Article

Comparative Life Cycle Assessment (LCA) of Conventional and Conservation Tillage Systems for Energy Crop Cultivation in Northern Italy

1
Department of Environmental and Prevention Sciences, University of Ferrara, Via L. Borsari 46, 44121 Ferrara, Italy
2
Agricultural Foundation F.lli Navarra, Via Conca 73/B, Malborghetto di Boara, 44122 Ferrara, Italy
*
Author to whom correspondence should be addressed.
Resources 2025, 14(12), 180; https://doi.org/10.3390/resources14120180
Submission received: 2 July 2025 / Revised: 17 November 2025 / Accepted: 18 November 2025 / Published: 26 November 2025

Abstract

Sustainable agriculture is a key pillar of the transition to agri-food systems that ensure global food security and the preservation of resources and ecosystems. This study evaluates the environmental impacts of different soil management practices in an agricultural system producing energy crops (maize and sorghum), using a Life Cycle Assessment (LCA) approach, comparing conventional tillage, minimum tillage and no-tillage agricultural practices. The results show no significant differences between conventional and minimum tillage in most impact categories, while no-tillage shows a significant reduction in environmental impact of almost 50%. The hotspot analysis shows that organic fertilisation, especially the application of digestate, is the main contributor to environmental impacts, particularly in the Climate Change and Eutrophication categories. The results highlight key methodological challenges in LCA, such as the allocation of impacts between digestate and biogas production, and the need to integrate biological and chemical soil processes. While conservation agriculture can improve soil health, its environmental benefits are not fully captured by LCA. This study highlights the need to integrate LCA methodologies with complementary analyses to better assess the sustainability of agricultural practices and support informed decision-making.

1. Introduction

The 2030 Agenda for Sustainable Development, adopted by the United Nations in 2015, is a global plan of action to promote a more equitable, prosperous and sustainable future [1]. Among the 17 Sustainable Development Goals (SDGs), agriculture plays a key role [2] in ensuring food security (Goal 2—Eradicate hunger), sustainable management of natural resources (Goal 12—Responsible consumption and production) and combating climate change (Goal 13—Climate action).
Sustainable agriculture is essential to reconcile the growing demand for food with the need to preserve the environment and natural resources [3]. Practices such as conservation agriculture, agroecology and the digitalisation of agriculture can help improve productivity while reducing environmental impacts. However, the transition to more sustainable agricultural systems requires appropriate policies, investment in research and innovation and the active involvement of farmers and local communities [4].
Global food security and fighting the climate crisis are the main challenges that characterize the XXI century [5]. These two challenges are closely linked, and agriculture plays a key role [6]. In fact, agriculture is thought to be responsible for 10–14% of total greenhouse gas (GHG) emissions, mainly carbon dioxide (CO2) and nitrous oxide (N2O), which alter the carbon (C) and nitrogen (N) cycles in agroecosystems [7]. Among the main causes, excessive use of nitrogen-based mineral fertilisers, burning of fossil fuels and intensive ploughing are considered the main sources of greenhouse gas emissions [7,8]. This approach to conventional agriculture is widely recognised as unsustainable, as it leads to soil degradation and reduced fertility, with negative consequences for food production [9]. Invasive techniques such as ploughing cause the detachment and displacement of the entire topsoil layer, releasing CO2 [7,10]. This requires a wide dissemination of sustainable agricultural production techniques, such as the conservation agriculture approach.
Conservation tillage involves practices like direct seeding and minimum tillage that limit soil disturbance to preserve soil structure and reduce erosion [11]. It is a key component of conservation agriculture, which rests on three core principles [12,13]:
(1)
Minimum or no-tillage: Avoiding or minimizing ploughing and other mechanical tillage to maintain soil structure and natural fertility;
(2)
Permanent cover: Maintaining continuous organic cover by using cover crops or crop residues to protect the soil from erosion and improve organic matter levels;
(3)
Crop rotation: Alternating different crop species over time to break pest and disease cycles, improve soil structure and optimize nutrient use.
Adopting these practices contributes to more sustainable management of agricultural resources, promoting soil health and the resilience of agricultural ecosystems [14]. The agronomic benefits of adopting conservation farming practices have also been demonstrated. They increase soil organic matter, and a higher carbon content is associated with improved soil structure and stability, reduced erosion, increased water infiltration and retention, higher microbial diversity and abundance and greater fertility [11,15,16,17,18]. It has also been demonstrated that there is less nutrient loss, including nitrogen, which means there is less need for fertilisation processes [15,16]. Although crop productivity is subject to many variables, particularly environmental ones, improvements in agricultural yields have been produced through the adoption of conservation agriculture practices [17].
Another proven environmental benefit of conservation agriculture is its ability to mitigate nitrous oxide emissions [16,18,19]. Nitrous oxide is a greenhouse gas with a very high global warming potential [20].
From an ecological point of view, it is important to examine the sustainability aspects of conservation farming practices, as well as the agronomic ones. It is essential to quantify the reduction in impact in terms of mitigating emissions and improving resource management. In particular, the positive aspects of conservation agriculture should be evaluated in terms of reducing fuel consumption, climate-altering gas emissions, water consumption and the environmental impacts of eutrophication. In this context, Life Cycle Assessment (LCA) methodology can play a significant role in evaluating the sustainability of agricultural practices by quantifying their environmental impact [21]. This is a key consideration for political decision-making and for addressing future challenges [22].

1.1. General Background of LCA Methodology

LCA represents the main operational tool of “Life Cycle Thinking” [23], and it was first used in industry, particularly for energy balances or resource and waste flow analyses [24]. LCA is an objective method for assessing and quantifying the energy and environmental burdens, as well as the potential impacts associated with a product, process, or activity throughout its entire life cycle, from raw material acquisition to end-of-life (“Cradle to Grave”) [25]. This comprehensive approach sets LCA apart as a valuable environmental management tool for policymakers. Without it, there is a risk of focusing only on environmental issues that require immediate attention, while overlooking or underestimating environmental dynamics that may occur elsewhere or manifest differently. Such targeted assessments can lead to decisions based on incomplete information [26].
Thus, the significance of this methodology lies primarily in its innovative approach, which considers all phases of a production process as interconnected and interdependent. Among the tools developed for industrial system analysis [27], LCA has assumed a prominent role and is widely established both nationally and internationally [28]. At the international level, the LCA methodology is regulated by the ISO 14040 [29] series of standards. According to these standards, an LCA study includes the following: the definition of the goal and scope of the analysis (ISO 14041 [30]), the compilation of an inventory of the inputs and outputs of a given system (ISO 14041), the evaluation of the potential environmental impact associated with these inputs and outputs (ISO 14042 [31]) and finally, the interpretation of results (ISO 14043 [32]).
An LCA study applied to a system that is potentially more complex than industrial systems, such as agricultural systems, directs the analysis of the system’s efficiency towards environmental protection, human health and resource conservation. In an LCA analysis, input parameters contribute to the debate on resource conservation issues, while output parameters are related to pollution problems.
The analogue model of the system under investigation in an LCA represents a simplification of reality [33]. Unfortunately, like all mathematical, physical and engineering models, the methodology cannot fully represent all environmental interactions. In the case of agricultural systems, this is a crucial limitation, as environmental factors significantly influence and shape the model. The goal is to conduct scenario analyses and model simulations as reliably and effectively as possible to design improvements for the agricultural system under study.
Even if the LCA methodology had already become widespread in the industrial sector by the end of the 1960s, research on agricultural LCA began in the mid-1990s, when the first academic seminar on agricultural LCA was organised in 1993 [34].
Currently, compared to LCA in other sectors (such as energy, construction and industrial production), the number of studies conducted in the agricultural sector is significantly lower [35,36].
The limited number of LCA studies in the agricultural field found in scientific literature is due not only to its more recent diffusion but mainly to specific methodological and sectoral constraints [37], including the following:
-
Heterogeneity and variability of data, such as agricultural techniques and system characteristics (largely composed of biotic components) vary considerably depending on geographical location, crop type and environmental conditions [36].
-
Complexity of interactions, since agriculture involves multiple interactions between soil, water, air and living organisms, making it challenging to identify and quantify the specific impacts of a single practice or input [38].
-
Temporal dynamics, as environmental impacts, particularly those related to fertiliser and pesticide use in agriculture [39], can vary over time and may have different levels of significance in the medium- to long-term.
Due to the complexity of conducting an LCA analysis of an agricultural system, it is important to define the scope and context to be considered.
This case study focuses on examining the specific factors influencing the agricultural system under analysis, in combination with standardised modelling data. Specifically, the aim is to quantify and compare the environmental impacts generated by the management of agricultural fields using three different soil tillage practices over a given period. The objective of the analysis is to provide an information base for assessing the sustainability of agricultural practices, using as much specific data available on the system as possible, in cooperation with a standardised analysis methodology, such as Life Cycle Assessment.

1.2. Energy Crops

Energy crops are plant crops whose purpose is the production of renewable energy. The major herbaceous energy crops are maize, sorghum, triticale, chard, sunflower, rapeseed, soybean, hemp, kenaf and fibre sorghum. They represent a very important resource for sustainable development [40], even though the use of first-generation crops for biofuel and bioenergy production is controversial because of their competition with food and feed production [41]. In the agricultural sector, they are also a very important resource from a socio-economic point of view: in Italy in 2024, more than 360,000 hectares of land are allocated to the cultivation of biomass maize (concentrated mainly in the north of Italy), with a total production exceeding 18 million tonnes [42].
Italy’s interest in increasing the contribution of agroenergy stems from the steady rise in national energy demand over the years. New incentives to produce energy from renewable sources, such as biogas power plants, are constantly being approved as policy [43]. Another issue contributing to the increase in biogas production is the war in Ukraine. This has led the European Union to consider the use of biogas and biomethane as key to reducing dependence on gas imports from Russia. As a result, the number of anaerobic digestion plants is steadily increasing, as global demand for biogas and biomethane is expected to accelerate, with estimated growth of 30% between 2024 and 2030 [44]. Compared to other agricultural or non-agricultural biomass types that can be used for anaerobic digestion for biogas production, maize has the best characteristics. Maize silage produces high levels of total solids, making it an ideal energy crop for biogas production [45,46]. It also has good ensiling, storage and fermentation properties, with relatively high methane yields per hectare and relatively low biomass supply costs [47]. In fact, more than 17,000 biogas plants in Europe use maize silage as their main substrate [45]. Another important benefit of biogas and biomethane production from anaerobic digesters, in addition to the production of renewable energy, is the production of the by-product digestate. This by-product is derived from residual biomass in the digester. On the one hand, it is an important source of nutrients [48]. Digestate is applied to fields as a soil improver and offers a more sustainable alternative to chemical fertilisers. Therefore, it is a by-product with agronomic value [49,50]. However, for digestion plant owners, the storage, transport and distribution of digestate represents a cost [48]. Consequently, it has no economic value.
Overall, the production of biomass crops, particularly maize, and the subsequent production of biogas and digestate are widespread practices, motivated by the growing importance of sustainable bioenergy in environmental policies and in the Intergovernmental Panel on Climate Change (IPCC)’s climate change mitigation scenarios [51,52].
The purpose of this study was to conduct an LCA comparing conventional soil management practices with conservation practices in an agricultural system producing energy crops (maize and sorghum). The study focused on different soil cultivation techniques in order to evaluate the sustainability of agricultural management systems, with the ultimate goal of establishing a scientific framework for optimising the sustainability of bioenergy production.

2. Materials and Methods

2.1. Agricultural Productions and Description of Scenarios

The study area is located in the eastern part of the Po River Plain, in the Province of Ferrara, in the Emilia-Romagna region (Italy). The Province of Ferrara covers 180,000 hectares of utilised agricultural area (UAA). The main crops are cereals, fruit and vegetables [53]. In this study, the cultivation was dedicated to the production of energy crops, in particular maize and sorghum, to be used for biogas production through an anaerobic digestion plant, also located in the vicinity of the test site.
The cultivation of herbaceous crops involves a series of operations and processes to maximise productivity. The agricultural operations essential to production are sowing, fertilisation, pesticide and herbicide treatments, irrigation and harvesting; these processes were therefore also included in this case study. In addition, agricultural operations carried out similarly in all the fields of this project to optimise production, in terms of improving soil fertility, also included soil management during the winter period with selected cover crop mixtures with the function of decompressing the soil and the application of organic fertilisers (digestate). The difference in the sequence of agricultural operations on the fields analysed is the different tillage techniques according to the principles of conventional and conservation agriculture. The scenarios analysed are thus represented by three different tillage techniques: ploughing, minimum tillage and no tillage.
Consequently, there are also differences in the amount of fertiliser applied. The no-tillage fields received half as much digestate (23 t/ha) and one fewer chemical fertiliser application than the other two tillage scenarios: This reduction in fertiliser application is due to the different nutritional requirements and dynamics of nutrients in soil managed using no-tillage techniques compared to soil managed using tillage [54,55]. The amount of digestate distributed was determined based on the nitrogen content of the organic matrix and efficiency, at the maximum dose permitted while complying with the limits imposed by European and Italian regulations [56]. In addition, due to agronomic and regulatory requirements [56], the distribution of digestate was carried out in two different ways: for the no-tillage scenario, a surface band application was used; and for the minimum tillage and ploughing scenarios, a scatter distribution method was used.
All of the above agricultural stages were analysed in terms of inputs and outputs of resources and materials.

2.2. Agricultural Test Site Characterisation

The agricultural test site under study is located in the eastern Po Basin, near the city of Ferrara, at the following coordinates: 44°47′41″ N and 11°42′20″ E (Figure 1). The area is characterised by a climate defined as “humid temperate with frequent fog” according to Koppen’s quantitative climate classification scheme [57], and soils with shallow hydromorphy, medium texture and are subordinately fine [58]. The soil is classified as a hypocalcic haplic calcisol. The site has been cultivated with a rotation of cereals, such as maize, winter wheat and beetroot. This type of soil is representative of large portions of the lower Po River Valley. The site was previously investigated as part of a research project supported by the Emilia-Romagna Region’s Rural Development Program (PSR 2014–2020) to reduce the environmental impact of agricultural practices through the adoption of no-till or minimum tillage techniques. A full description of the soil’s physical and chemical properties is provided in Colombani et al., 2020 [59].
The fields under investigation are owned by the Navarra Foundation, a nonprofit cultural organisation that promotes innovation and sustainability in agriculture. The foundation owns approximately 700 hectares of land. The experimental field was not specifically designed for this environmental impact assessment study using LCA methodology, but rather for further agronomic studies on soil health and the increase in organic matter. The decision to use experimental fields that are the subject of other agronomic studies is due to the intention to add elements for assessing the environmental sustainability of agricultural management from an ecological point of view, based on the emissions impact of agricultural practices. For a complete understanding and assessment of the environmental sustainability of agricultural systems, it is essential to investigate the many aspects that characterize them. The study of the biological conditions of the soil would also be of great importance to explore in future studies.
The fields are organised into large plots with a randomised block experimental design, with four theses and three replications (Figure 1):
  • Thesis 1: Conventional tillage (3 plots)
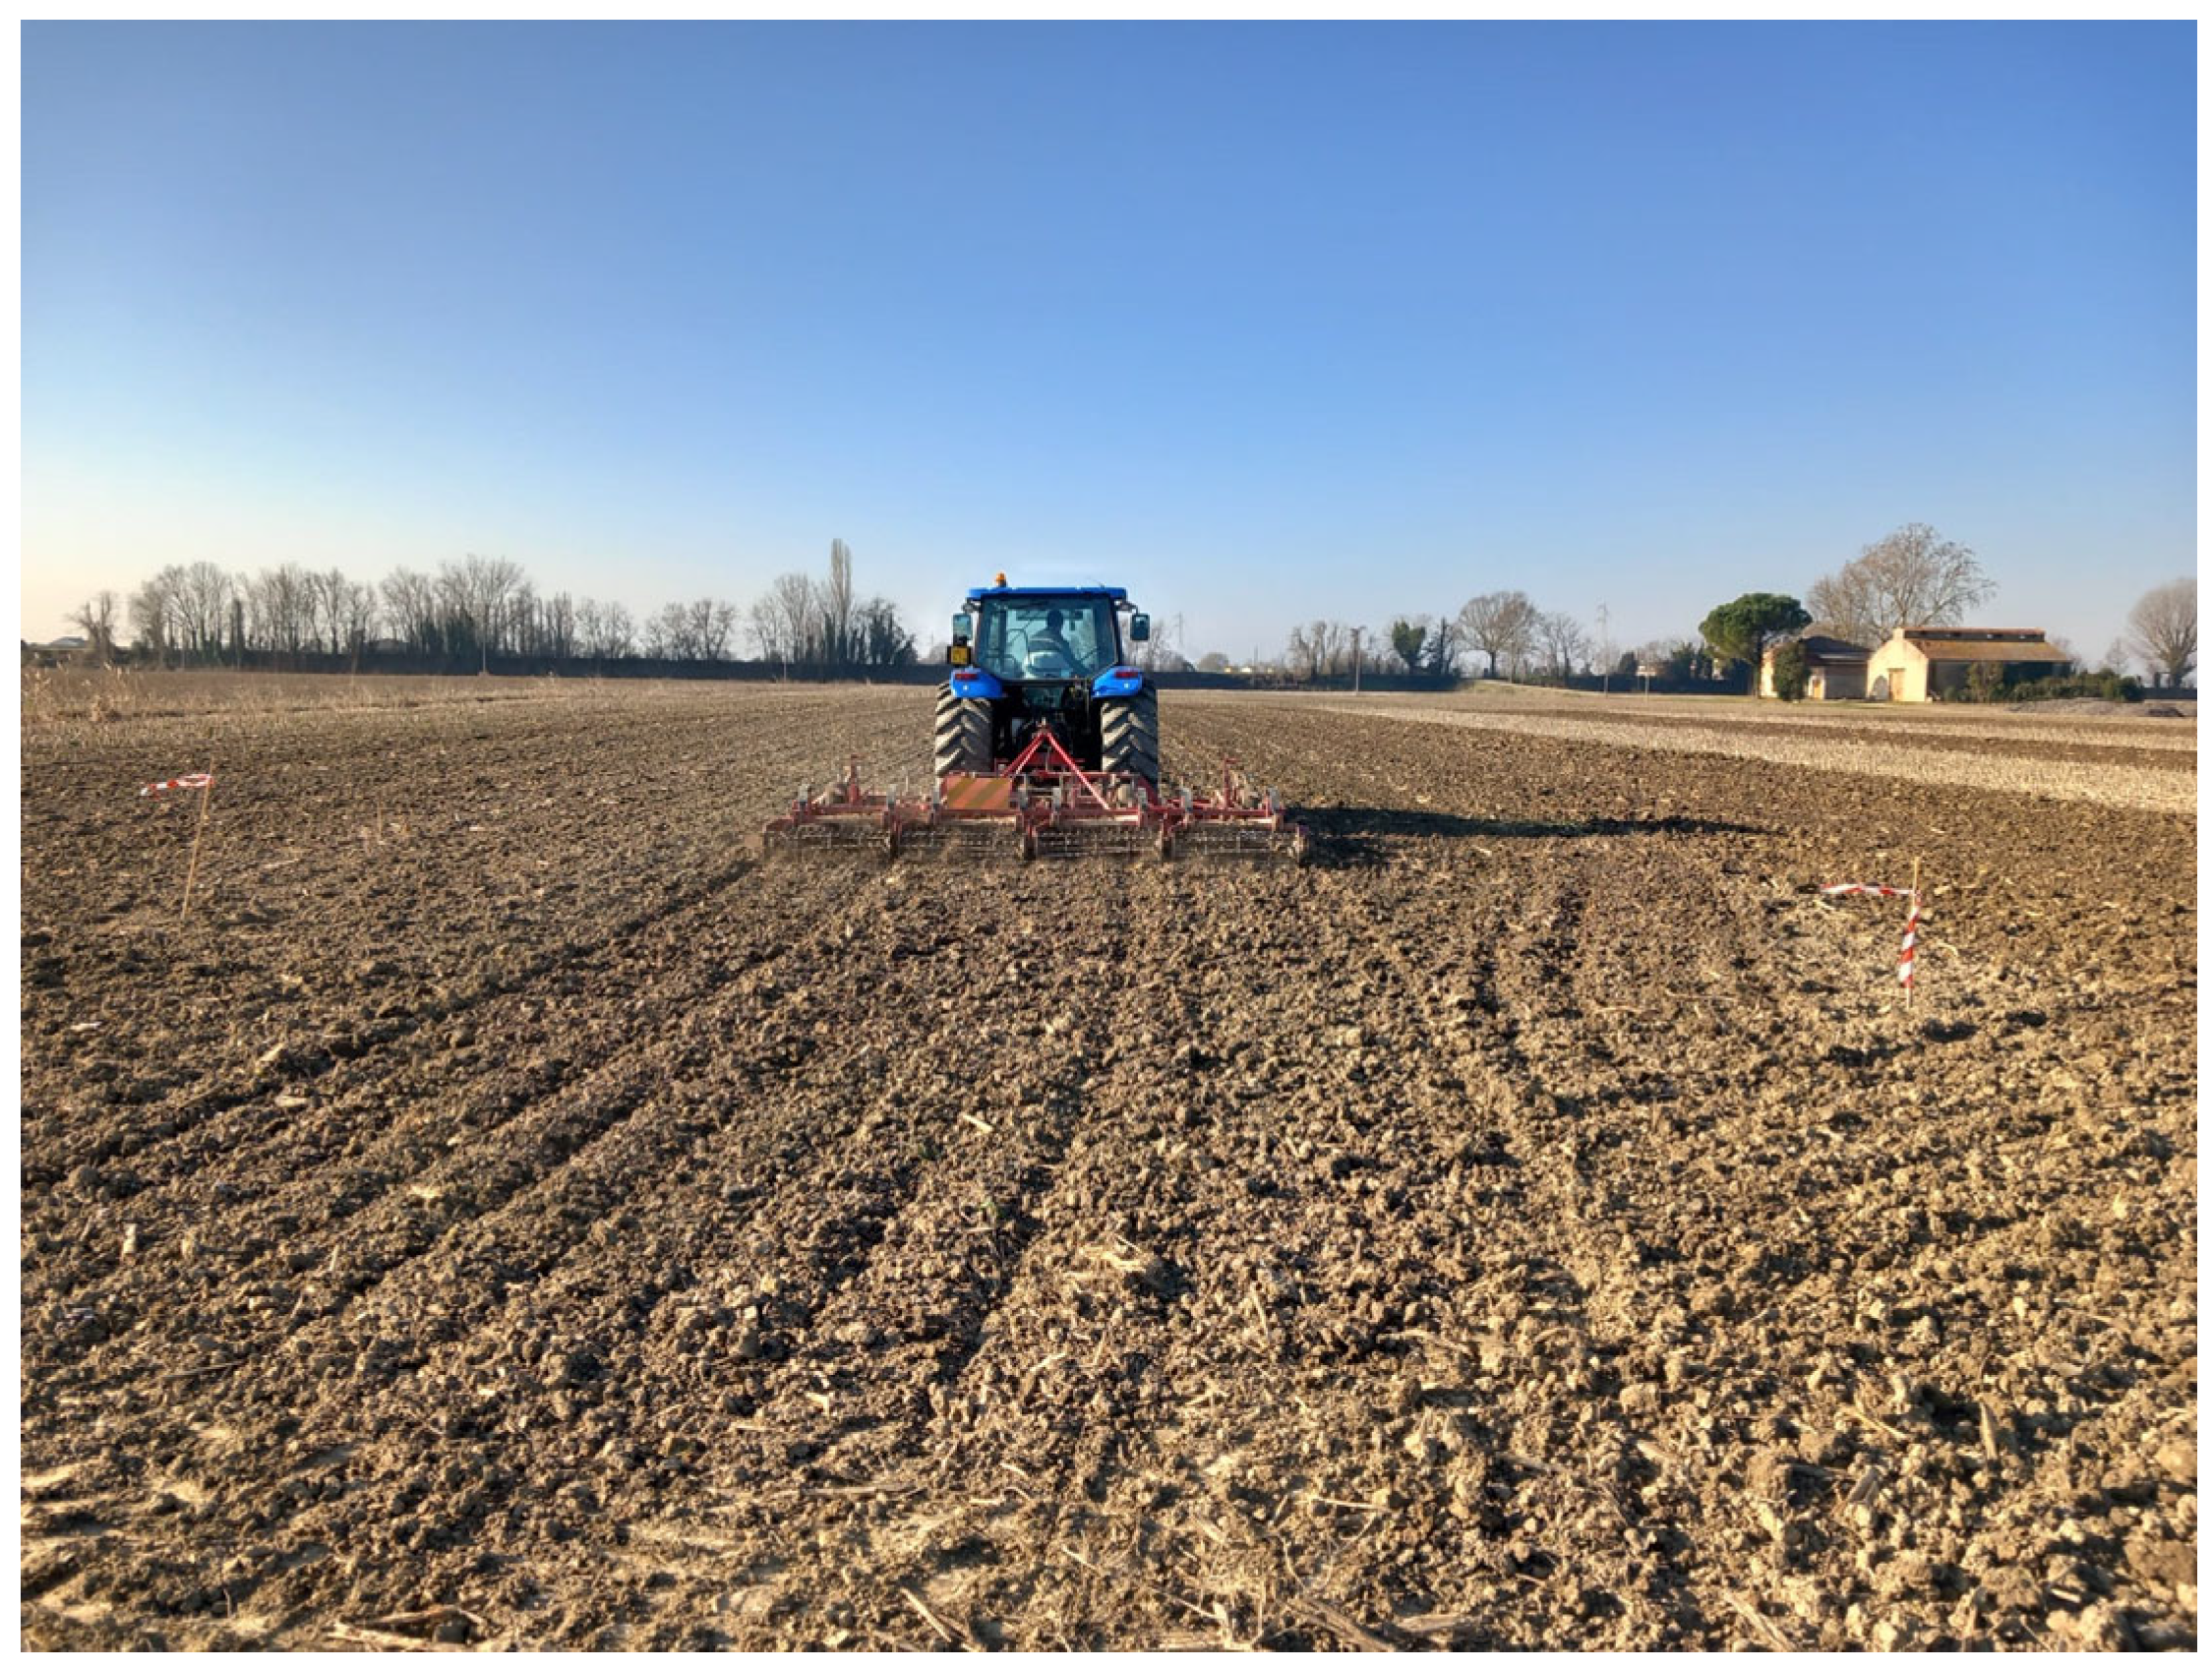
  • Thesis 2: Minimum tillage (3 plots) (Figure 2)
  • Thesis 3: Conversion from conventional tillage to no tillage—start of soil management with no-tillage technique in 2023 (3 plots)
  • Thesis 4: No tillage—start of soil management with no-tillage technique in 2017 (3 plots)
The total area under study is 2.7 hectares, divided into the 12 plots corresponding to the 4 theses. Each plot has an area of 0.675 hectares.

2.3. LCA Study Development

Normally, an LCA study consists of 4 phases, regulated by the ISO 14040 series [60]:
(1)
Goal and scope definition
(2)
Life Cycle Inventory (LCI)
(3)
Life Cycle Impact Assessment (LCIA)
(4)
Interpretation of the results

2.3.1. Goal and Scope Definition

The aim of the study is to assess the environmental impact of the management of one hectare of agricultural land over a period of eighteen months, in order to compare the environmental sustainability of conservation tillage techniques, with conventional techniques in terms of assessing the impact of emissions from agricultural practices.
The study area covers a total area of 2.7 hectares, divided into the four theses mentioned above and adapted to three different scenarios, in order to carry out the analysis comparing the environmental impact of the different soil management techniques:
Scenario 1: Conventional tillage with ploughing to a depth of 40 cm + addition of organic fertiliser (digestate) applied in the pre-sowing stage using the traditional method (spreading with a fan drum).
Scenario 2: Minimum tillage (<30 cm depth) without inversion of layers + addition of organic fertiliser (digestate) distributed in the pre-sowing stage using the traditional method (spreading with a fan drum).
Scenario 3: No tillage, sowing is carried out on hard soil + organic fertiliser (digestate) is distributed over the crop using surface band application.
Scenario 1 (ploughing) corresponds to conventional management, while Scenario 2 (minimum tillage) and Scenario 3 (no tillage) represent conservative management. Theses 3 and 4 have been merged into a single scenario (Scenario 3) in the environmental impact assessment, as both consist of no-tillage and are therefore considered the same for the purpose of the study’s objective. The comparative analysis of the three scenarios aims to compare the environmental impact of different soil management techniques and related agricultural practices. Consequently, variables associated with soil properties and crop productivity were not analysed for the purposes of the study. In order to enable comparison between the three scenarios, the study focused on the agricultural management of similar crops on an experimental plot with comparable chemical, physical and biological characteristics.
The system boundaries analysed in this study are defined as ‘cradle to gate’ according to the LCA methodology and are based on primary and secondary data (please see the next paragraph for a more detailed description) of the impacts of agricultural production processes, as follows: Primary data have been calculated from actual data registered on field accounting for all mechanical agricultural processes carried out over the duration of the experiment (18 months) and referred to the standard area of 1 hectare. Secondary data, such as those for the production of seeds, urea, digestate, plant protection products and herbicides, including transport from the production site to the experimental field, were taken from databases (Agribalyse® and Ecoinvent® v.3.7.1). The “to gate” boundary has been identified as the gate of the biogas plant receiving silomaize. This means that the analysis also includes the impacts of transporting the silomaize from the experimental field to the biogas plant and excludes the operating processes within the biogas plant.
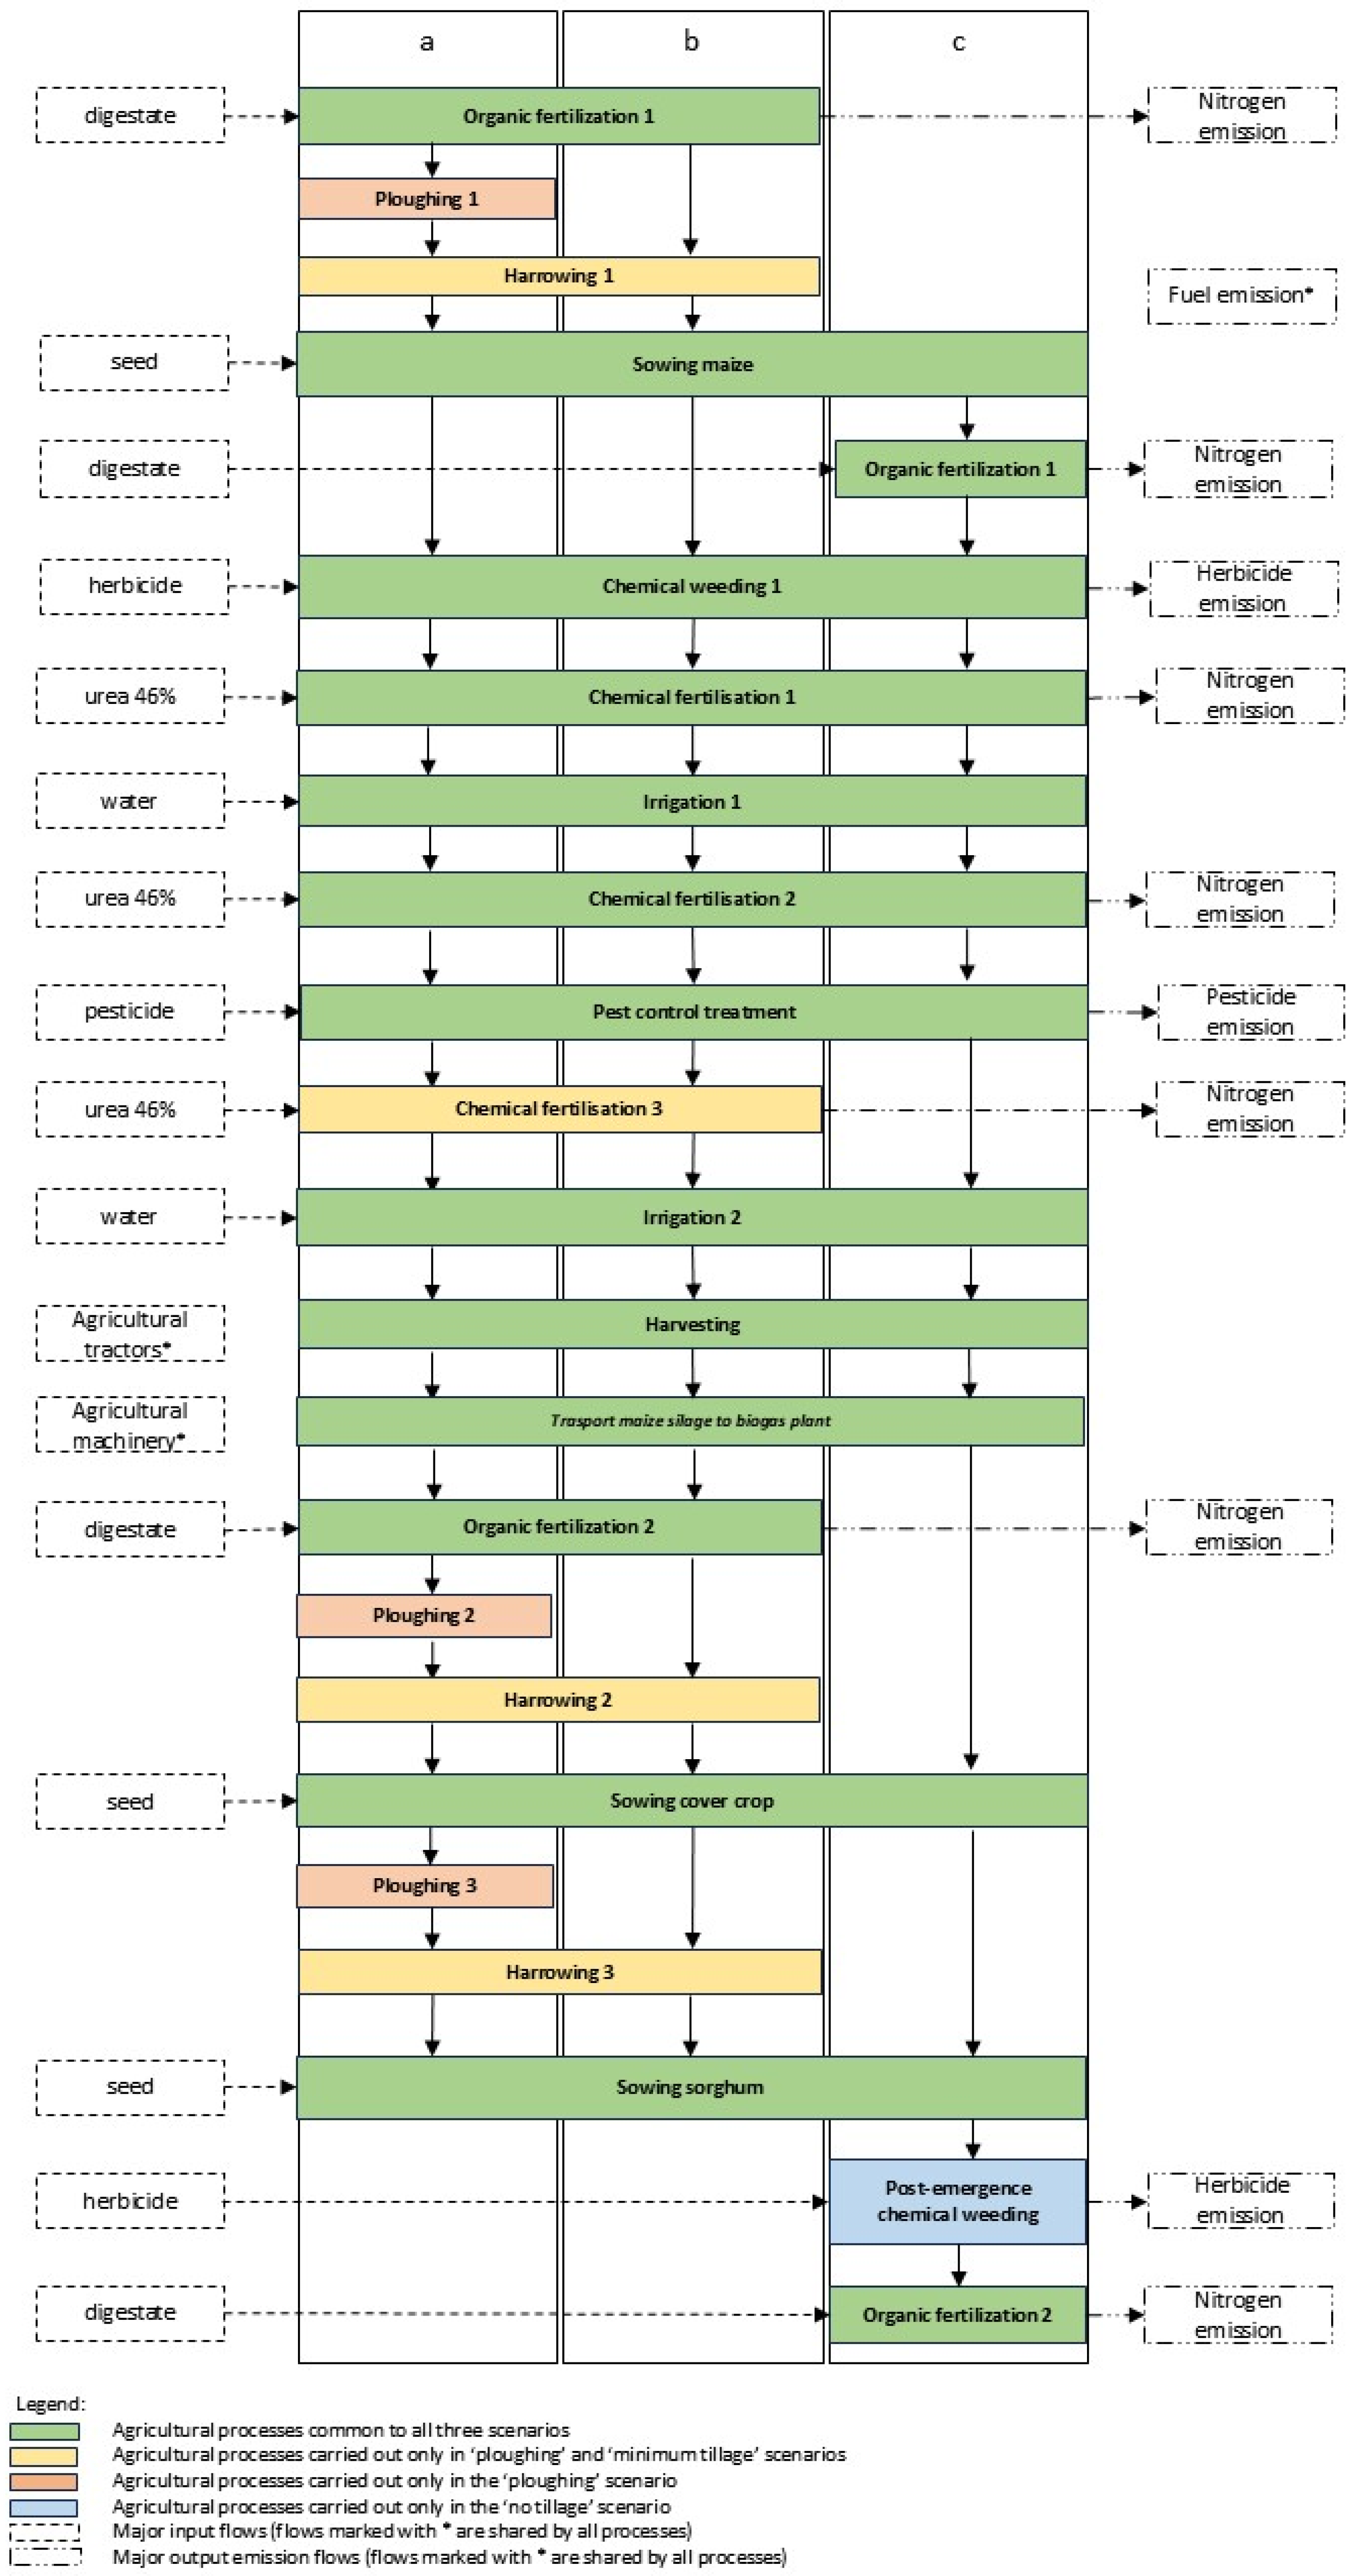
The time boundaries correspond to eighteen months, from November 2022, when soil preparation begins, to April 2024, when sorghum is sown. These time boundaries were established based on the time required for the succession of cultivation operations shown in Figure 3, which are necessary for the following agricultural activities:
  • Production of maize silage (November 2022–August 2023)
  • Soil management during the winter period with cover crops—a mix of plant species with a decompacting function (phacelia, family Boraginaceae, and horseradish and brown mustard, family Brassicaceae) (October 2023–February 2024).
  • Sowing of sorghum silage (April 2024)
Figure 3. Schematic outline of the agricultural processes analysed in the LCA study: (a) Ploughing; (b) Minimum tillage and (c) No tillage.
Resources 14 00180 g003
As Figure 3 shows, the three cultivation techniques examined are clearly distinct, yet they all result in sorghum being sown after 18 months. For instance, the ‘no tillage’ technique requires post-emergence weeding and organic fertilisation, whereas the other two techniques involve organic fertilisation prior to sowing, making chemical weeding unnecessary as this has already been achieved mechanically during soil preparation. Supplementary Materials provides details of the agricultural input flows associated with each of the agricultural processes shown in Figure 3.
The functional unit (FU) selected for the study is one hectare of agricultural land cultivated with maize as an energy crop, in rotation with sorghum. This choice is relatively unusual in LCA studies in agriculture, where impacts are usually referred to the mass of the product as the functional unit (FU). We made this choice to optimise the focus of the results in line with the primary objective of the study, which was to compare the environmental impacts associated with different soil management techniques. All input and output flows relating to the analysed processes, including agricultural equipment and vehicles, fuel, fertilisers, pesticides and herbicides, as well as all emissions, are normalised to the FU.

2.3.2. Life Cycle Inventories (LCI)

The inventory analysis phase is the stage of the study dedicated to collecting and quantifying input and output data relating to the system to be studied. The LCI involves collecting the data necessary to achieve the objectives of the defined study. Therefore, in order to carry out the life cycle analysis of the process, a considerable amount of data and information useful for the analysis of the agricultural system under study have been obtained:
-
Primary data, specifically related to the analysed system, were obtained through the submission of a dedicated survey to the farm operators who carried out the agricultural operations. Most of the primary data collected for each agricultural operation analysed in the study are reported in Table S1 in the Supplementary Materials.
-
Secondary data, related to standardised processes, are available in databases. In particular, processes and flows present in the databases Agribalyse® (developed by ADEME, a French Ecological Transition Agency) and Ecoinvent® v.3.7.1, developed by the Swiss Centre for Life Cycle Inventories (Zurich, Switzerland), were used. Data relating to data and models specific to the geographical context analysed, obtained from scientific publications and technical dissemination by national research centres, are also included in the secondary data.
The primary and secondary data collected in the inventory were managed for LCA according to an attributional modelling approach [61].
Concerning the agricultural equipment and machinery used in specific agricultural operations, the technical characteristics were analysed. The weight, the working time, the end of life of the equipment, the amount of fuel used and maintenance, if any, were taken into account in order to adapt the reference processes in the databases to the specific equipment used in the system analysed in the case study, as shown in Table 1 below.
Standardised processes in the Agribalyse® and Ecoinvent® v.3.7.1 databases were used for material and resource input flows such as seeds, organic and inorganic fertilisers, herbicides and pesticides.
Modelled data on pesticide and herbicide emissions were obtained from the scientific literature [62]. In order to more accurately describe and assess the impacts of the analysed agricultural system, an in-depth analysis of the emission factors related to the distribution of organic and inorganic fertilisers, diesel combustion and emissions due to land use change (LUC) was carried out for this case study. In fact, emissions due to the above-mentioned elements represent an important factor in assessing the environmental impacts of the agricultural system. The following are the considerations made that are helpful in selecting appropriate emission factors:
-
Inorganic fertiliser distribution (urea 46%): Emission factors from the IPCC guidance on ammonia and nitrous oxide were evaluated. For comparison, emission factors specifically calculated from literature studies on the dynamics of the nitrogen balance in agriculture according to the specific characteristics of the geographical area and crop were evaluated [63]. The use of the emission factors given in the official guideline of the IPCC [64] was found to be more compliant in order to maintain a good level of standardisation of the process under analysis, despite the fact that the values calculated in the official guideline are much overestimated compared to those calculated in site-specific scientific studies [63,65].
-
Distribution of organic fertiliser (digestate): Considering the high variability of the chemical composition of the product and the distribution methods, it was decided to use the emission factors inherent to ammonia, nitrous oxide, carbon dioxide and methane, calculated specifically for a context similar to the agricultural system under analysis [66].
-
Agricultural diesel combustion (biodiesel 7%): Emission factors from standardised processes in the Ecoinvent® database (diesel combustion, in tractor/FR U) were compared with current emission factors calculated taking into account the presence of biodiesel in the fuel [67]. The two values from the two different scientific sources agreed. As a result, the process and its emission factors from the Ecoinvent® database have been used.
-
Land use change: Based on EU Regulation 2018/841 [68] (Land Use, Land Use Change and Forestry LULUCF), the LUC must be calculated in relation to the geographical area under analysis and the type of crop (annual, perennial or paddy rice). The LUC processes standardised in the databases related to Italy assess the impact of one hectare of land use change over a 20-year interval, and one twentieth of the amount is then attributed to the annual crop through this process (Land use change, annual crop, annualised over 20 years (adapted from WFLDB [69])). However, in the context of the specific case study under analysis, cultivated land has been dedicated to agriculture for much longer than 20 years, corresponding to at least 100 years according to Navarra Foundation information and some historical maps. Based on these considerations, it was decided to consider the emission related to land use change as irrelevant for the agricultural system analysed.
Although they were potentially relevant, emissions of fertilisers, pesticides and herbicides to soil and water through leaching and runoff were not considered. This was partly due to the high degree of site-specificity of the processes involved and the difficulty of the measurements. Together, these factors are an inherent limitation that extends beyond our study and cannot be described using general predictive models [70,71,72].

2.3.3. Life Cycle Impact Assessment (LCIA)

The inputs and outputs of the production system identified in the previous phase are converted into potential environmental impacts by applying the corresponding characterisation factors to the inventory data. This process results in a profile of potential environmental impacts, comprising the outcomes of the various impact categories. The open-source software package OpenLCA® v2.0, developed by GreenDelta (Berlin, Germany), was used for life cycle analysis (LCA) processing. The selected impact assessment method was ReCiPe™ midpoint (H) [v1.11, December 2014]. The impact categories established to be analysed represent the main environmental consequences attributed to the agricultural sector [73]. In particular, the following impact categories were discussed during the interpretation phase of the results:
-
Climate Change: This impact category represents an indicator of potential global warming due to emissions of greenhouse gases to the air; it is expressed in kg CO2-eq and quantifies the integrated infrared radiative forcing increase of a greenhouse gas (GHG) [74].
-
Eutrophication: This category includes the effects of eutrophication in freshwater and the sea. Freshwater Eutrophication potentials are expressed in kg P to freshwater-equivalents [74]. Marine Eutrophication potentials are expressed in kg N equivalent and represent an indicator of the enrichment of the marine ecosystem with nutritional elements due to the emission of nitrogen-containing compounds.
-
Human Toxicity: Indicator of the impact on humans of toxic substances emitted to the environment. The effects of chemical emissions expressed in kg 1,4-dichlorobenzene-equivalents (1,4DCB-eq) were used as characterisation factors for this impact category.
-
Water Depletion: Indicator of the relative amount of water used in human activity; the characterisation factor at midpoint level is m3 of water consumed per m3 of water extracted [74].

2.3.4. Interpretation of the Results

The interpretation phase of the results makes it possible to derive robust conclusions and recommendations on which, for example, to base a communication strategy and/or process improvement activity. The main elements of the interpretation of results are:
-
identification of hot-spots (the materials/processes that contribute most to the overall impacts are identified),
-
assessments of the completeness and robustness of the model (such as sensitivity and uncertainty analysis),
-
definition of the conclusions of the study, even considering the limitations present.
To assess the uncertainty of the LCA, a Monte Carlo simulation was performed. The use of average inventory data requires calculating the root means square error (or standard deviation) as a measure of data quality. The standard deviation was used as an uncertainty factor, and a Monte Carlo analysis was conducted. In the Monte Carlo simulation, all defined uncertainty distributions in flows, parameters, and characterisation factors were considered, except for the reference product of the analysed system. The input and output values were sampled based on the unit process distributions for a fixed number of iterations, which in this study was set at 1000, with a 95% significance level [75]. An uncertainty interval represents a range of possible outcomes obtained by aggregating 1000 iterations. By considering the uncertainty interval and the related parameters, it is possible to determine the uncertainty of the impact category values resulting from the management of one hectare of agricultural land.
The relevant ISO standards also provide for an additional (optional) processing of the results obtained through the following activities:
-
Normalisation (expressing the values of each category relative to a reference value),
-
Grouping (sorting and classifying the impact categories),
-
Weighting (converting and aggregating the indicators by applying weighting factors). These optional processing operations were not performed in this preliminary study, which will serve as the basis for future studies. In those studies, these optional phases will be explored in greater depth to integrate further aspects. In this preliminary study, we determined that the aforementioned phases would not provide significant additional relevant information.

3. Results

The results shown in Table 2 represent the main environmental impact indicators selected to assess the environmental sustainability of cultivating a one hectare field under the three soil management scenarios analysed.
For all impact categories analysed, the highest impact values result from Scenario 1, which corresponds to conventional soil management. The climate change impact attributed to the conservative minimum tillage management system (Scenario 2), with a slightly lower value, shows no significant difference from Scenario 1. On the other hand, the result for the conservative no-tillage scenario shows a reduced value of climate change compared to the other two scenarios. Regarding the impact on Freshwater Eutrophication, the lowest value of 1.33 kg P eq is related to Scenario 3, while for Scenarios 1 and 2, comparable values of around 2.4 kg P eq were found. The same trend is shown for the impact on Marine Eutrophication, with values around 76 kg N eq for Scenarios 1 and 2, and a lower value of around 39 kg N eq for Scenario 1.
Both the indicators of human toxicity and water depletion are significantly lower in the case of the no-tillage scenario.
In addition, a Monte Carlo (MC) simulation was performed to verify the level of uncertainty of the LCI data. The Monte Carlo simulation was processed by the same OpenLCA software used to develop the LCA analysis and is considered a comprehensive statistical test for managing uncertainty [76,77]. Monte Carlo analysis assesses how the propagation of input variation is reflected in output values. For the analysis of this case study, the Monte Carlo method was run with 1000 interactions at a significance level of 95 percent. Table S2 provides details of the Monte Carlo analysis results with uncertainty intervals. The uncertainty values resulting from the Monte Carlo analysis are shown in Table 2 as standard deviation (SD) and coefficient of variation (CV). The MC analysis shows high levels of uncertainty in the assessment of impacts related to eutrophication (marine and freshwater): The high level of uncertainty (18–19% for Marine Eutrophication and 12–13% for Freshwater Eutrophication) may be due to the high incidence of impact of fertilisation with digestate and urea (processes in the agricultural process under consideration and the variability of nutrient dynamics in the environment, based on which the impact on eutrophication is assessed (units of kg N equivalent and units of P equivalent). Other impact categories that show a high level of uncertainty are Water Depletion (15–16%) and Human Toxicity (7 to 16 percent). The uncertainty of the results related to the impact category Human Toxicity may be due to the high complexity of the dynamics of the components of the mixtures that make up pesticides and herbicides interacting with the environment (conditioned by physical, chemical and biological variables). The lowest uncertainty values, on the other hand, as shown by the CVs in Table 2, are for the impact category of Climate Change for all three scenarios. Overall, the uncertainty analysis demonstrates a moderate level of accuracy of the analysis that can be improved.
The “contribution tree” analysis led to the identification of environmental hotspots, reported as contribution expressed as a percentage or absolute value of the processes or flows that contribute most to the overall value of the indicators. The identification of environmental hotspots on climate change potential and other impact categories was performed to identify which agricultural processes contribute more severely to impacts. Tables S3–S7 in the Supplementary Materials show the absolute value of the impact contribution of each individual agricultural operation carried out and analysed in the present study. For all impact categories analysed, the highest contribution values reported in Tables S3–S7 are attributed to the agricultural processes of organic (with digestate) and inorganic (with urea) fertilisation. Consequently, the analysis of environmental hotspots focused on organic and inorganic fertilisation processes.
As shown by the climate change “contribution tree” illustrated in Figure 4, the process with the highest contribution to environmental impact is organic fertilisation (organic fertilisation process with digestate). The impact of fertilisation with digestate for conventional and minimum tillage scenarios represents a contribution of more than 70% of the climate change impact. Even for the no-tillage scenario, the organic fertilisation process accounts for almost 70% of the total impact. Inorganic fertilisation, represented in Figure 4 by the orange bar, shows a contribution ranging from eight to ten percent for all three scenarios. The “Other Processes” represented in Figure 4, Figure 5, Figure 6, Figure 7 and Figure 8 by the green bar, correspond to the total impact contribution related to all other agricultural processes, excluding fertilisation, that is, plowing (only in Scenario 1 of the conventional management system); pre-sowing harrowing (in Scenario 1 and Scenario 2); sowing of maize, cover crop and sorghum, weeding, pest treatment, harvesting and irrigation (in all three scenarios analysed); and the post-emergence weeding process (only in the no-tillage management system). The percentage weight of the impact of all these agricultural processes on the total value of the climate change indicator ranges from 14 percent for the minimum tillage scenario, 17 percent for the conventional scenario, to 22 percent for the no-tillage scenario. The in-depth analysis of the contribution tree showed that among the ‘Other Processes’ those that have the greatest impact on climate change are harvesting and irrigation of maize silage (the irrigation process involves the combustion of diesel fuel in an engine unit connected to the irrigation reel pump), which is reasonable due to the high consumption of agricultural diesel fuel.
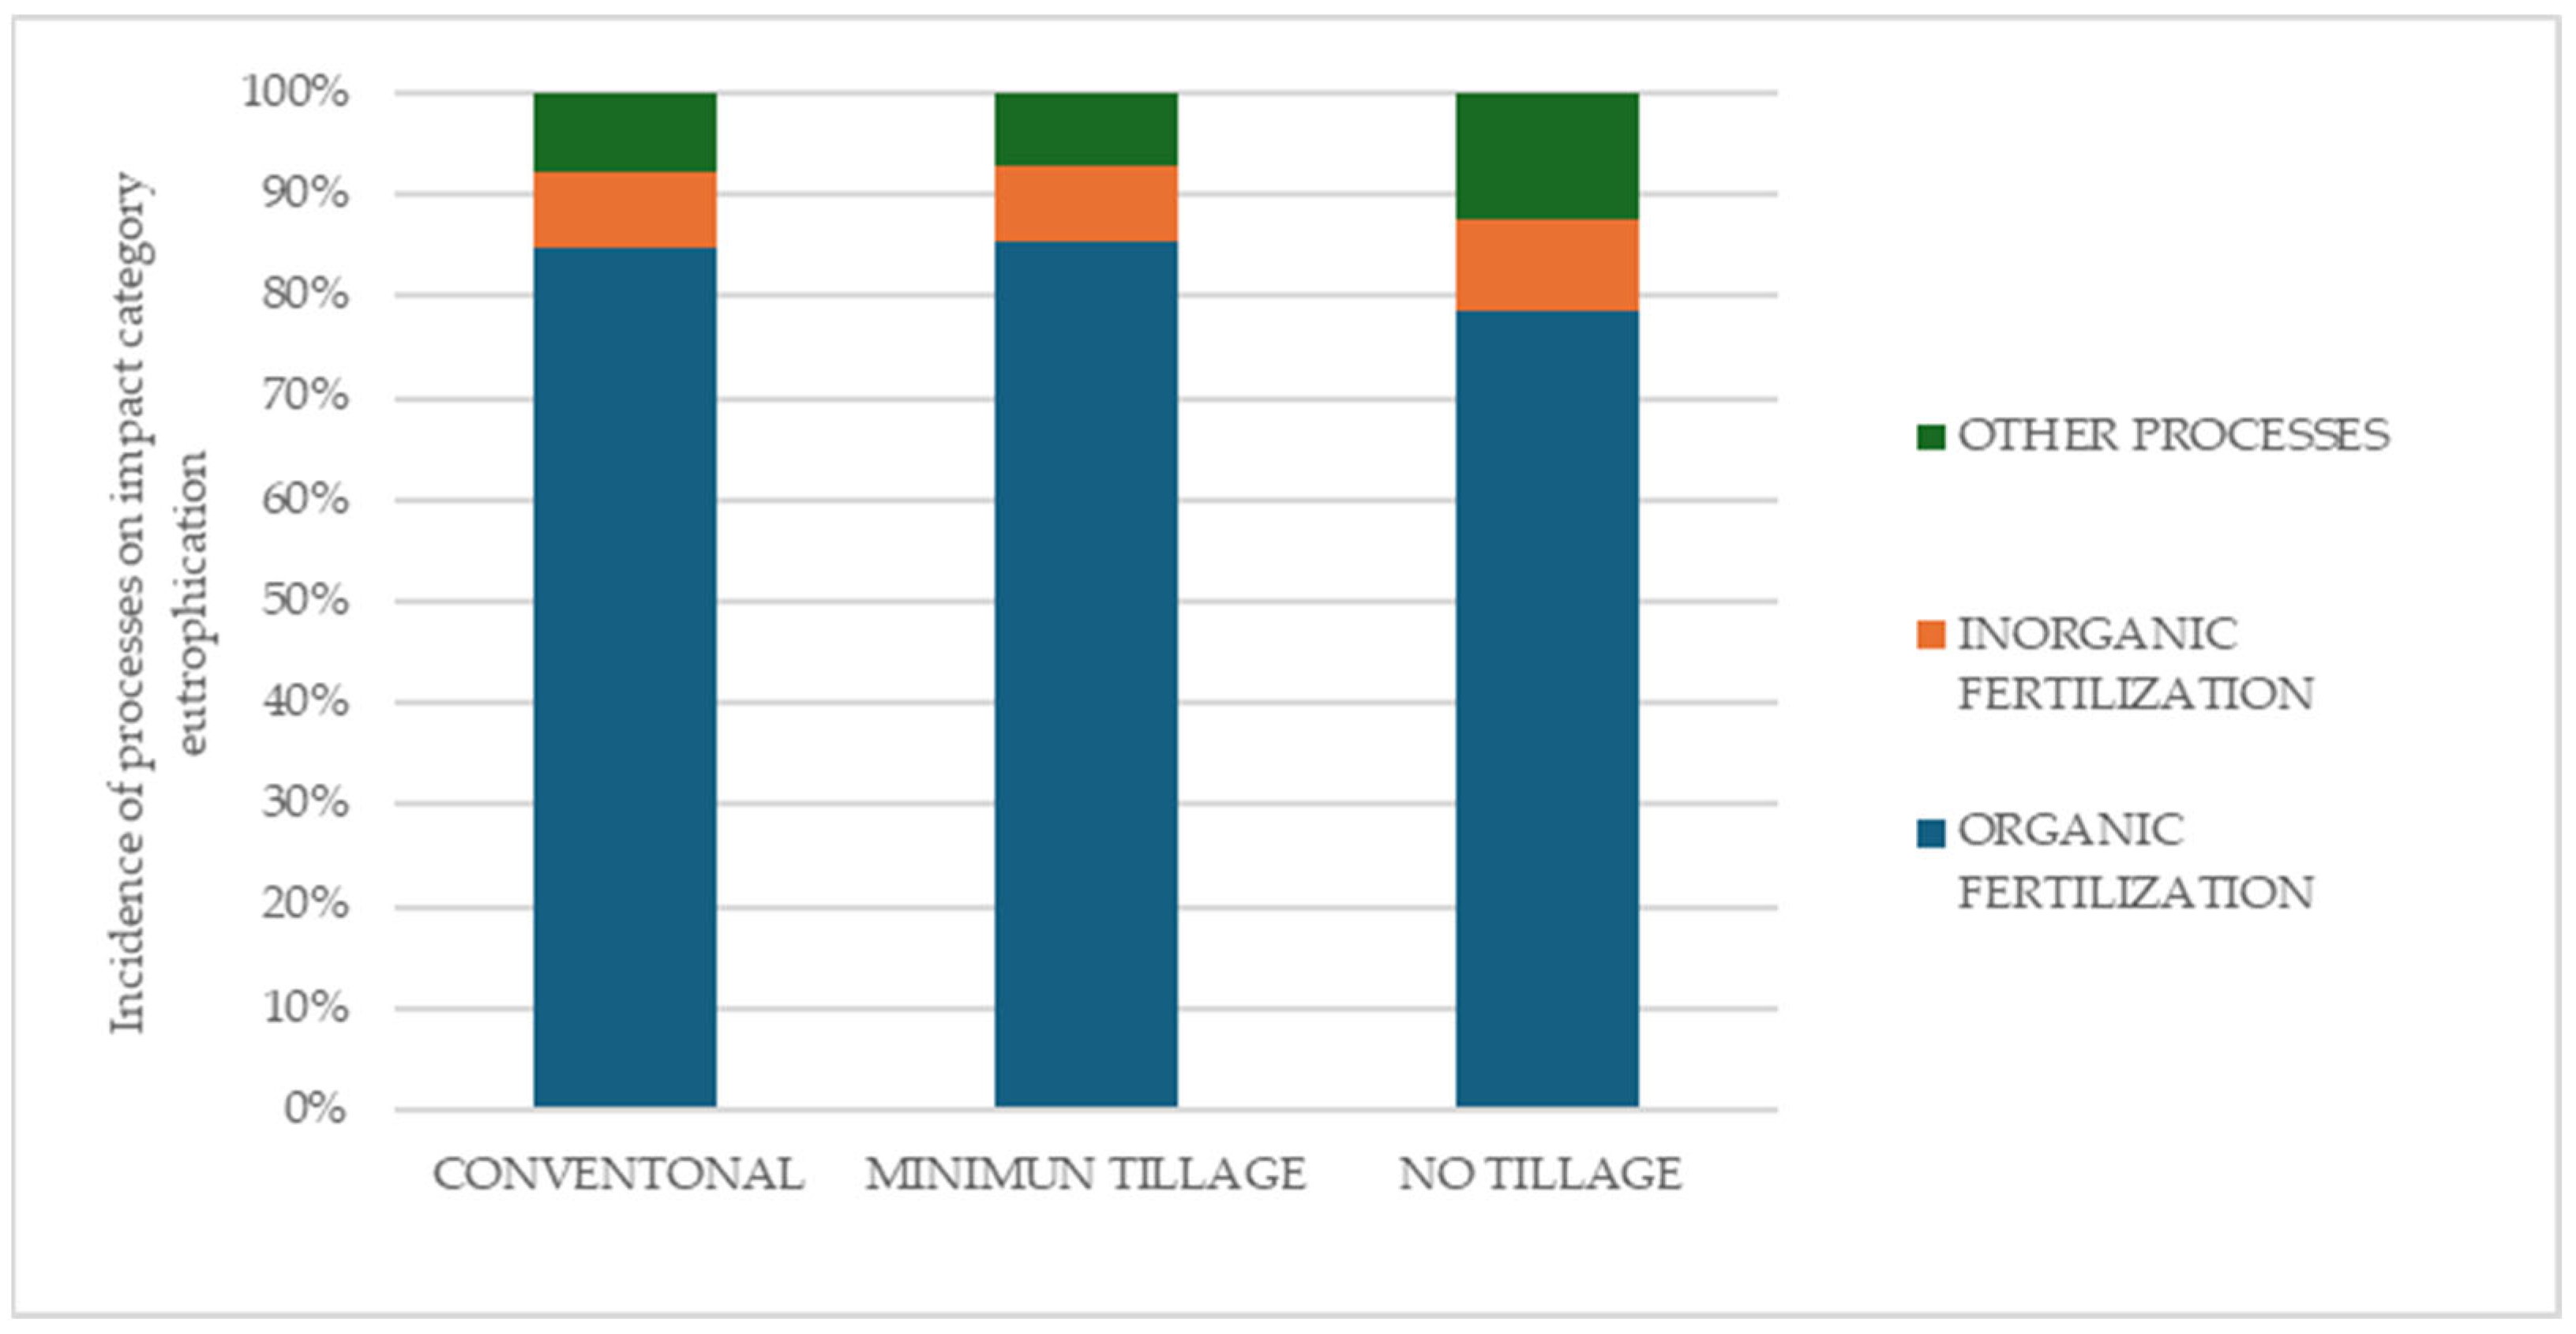
The identification of environmental hotspots on Freshwater Eutrophication potential has evidenced that the main hotspot is the fertilisation processes, in particular organic fertilisation with digestate (Figure 5). The 80 percent contribution of organic fertilisation in all three scenarios analysed is due to the cultivation of maize silage used as a raw material for anaerobic digestion for the production of digestate.
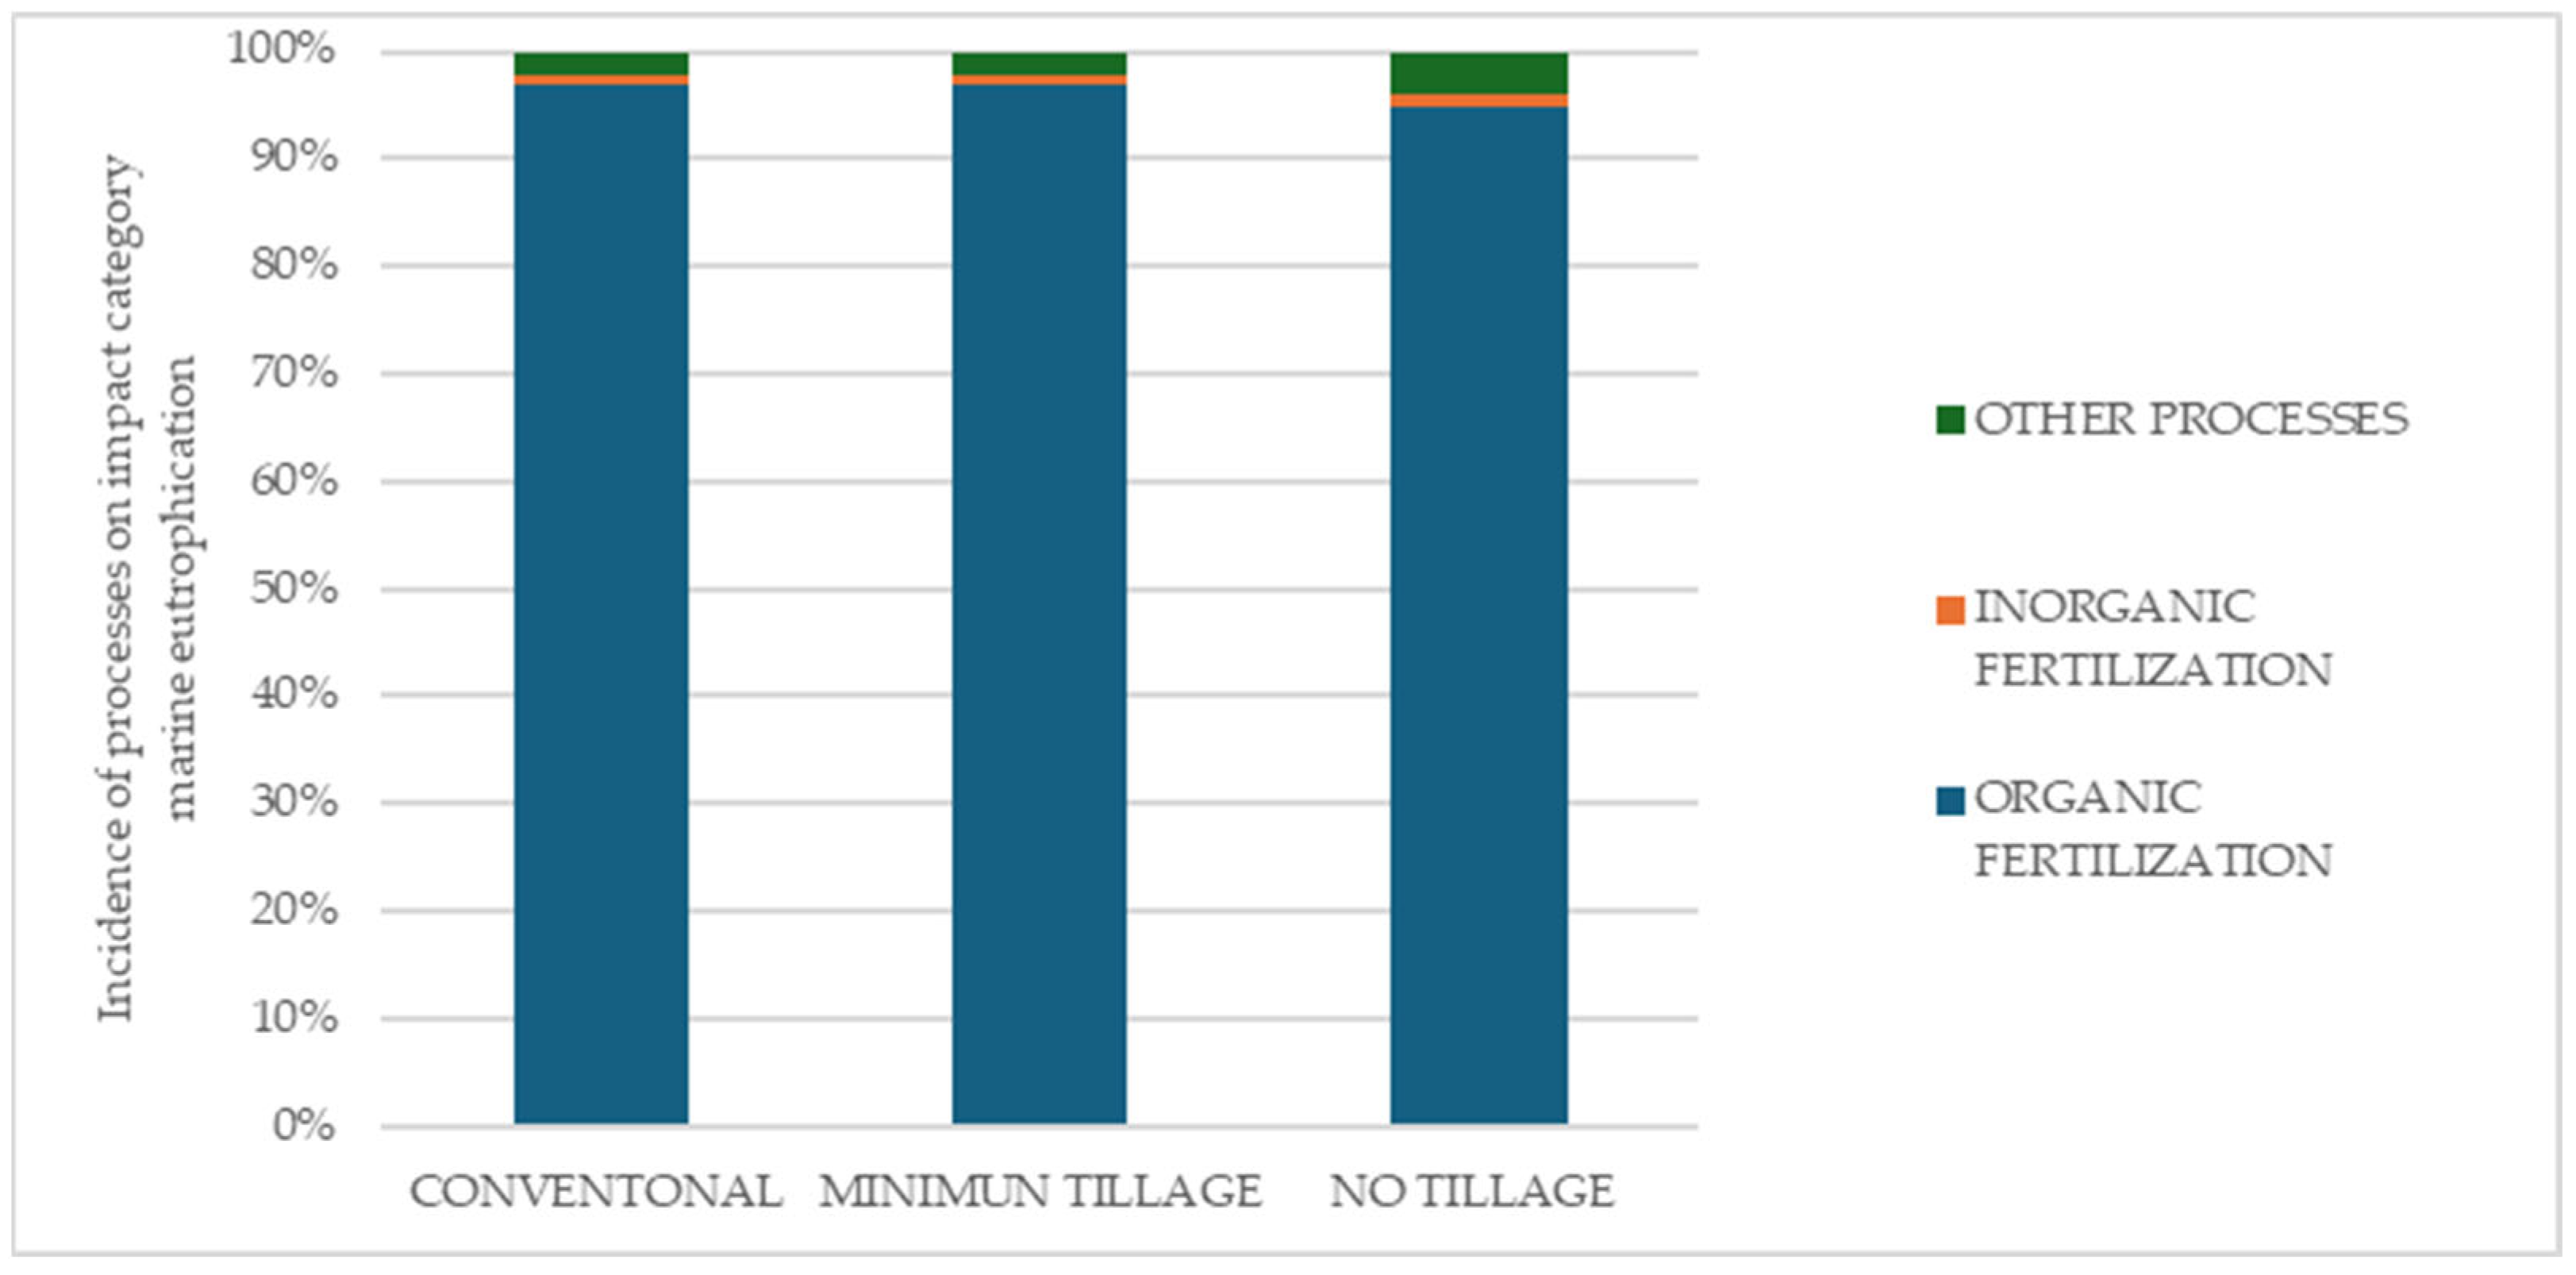
The same trend was found for Marine Eutrophication. In all three analysed scenarios, more than 90 percent of the total impact was attributed to organic fertilisation (Figure 6), which was always derived from producing maize silage to feed the digestion plant. The high impact contributions associated with organic fertilisation in the eutrophication impact indicators are due to the application of high amounts of phosphorus- and nitrogen-based nutrients for the cultivation of maize silage used as biomass for digestate production. This is most evident in the impact category of Marine Eutrophication (Figure 6), expressed in kg N equivalent, due to the use of nitrogen fertilisers such as urea.
In the impact on human toxicity, organic fertilisation with digestate contributes an average of 65 percent in the three scenarios. Inorganic fertilisation, on the other hand, contributes an average of 15 percent to the total impact. The remaining human toxicity impact contribution, represented in Figure 7 by the green bar of “Other Processes”, is mainly due to the application of chemicals such as pesticides and herbicides.
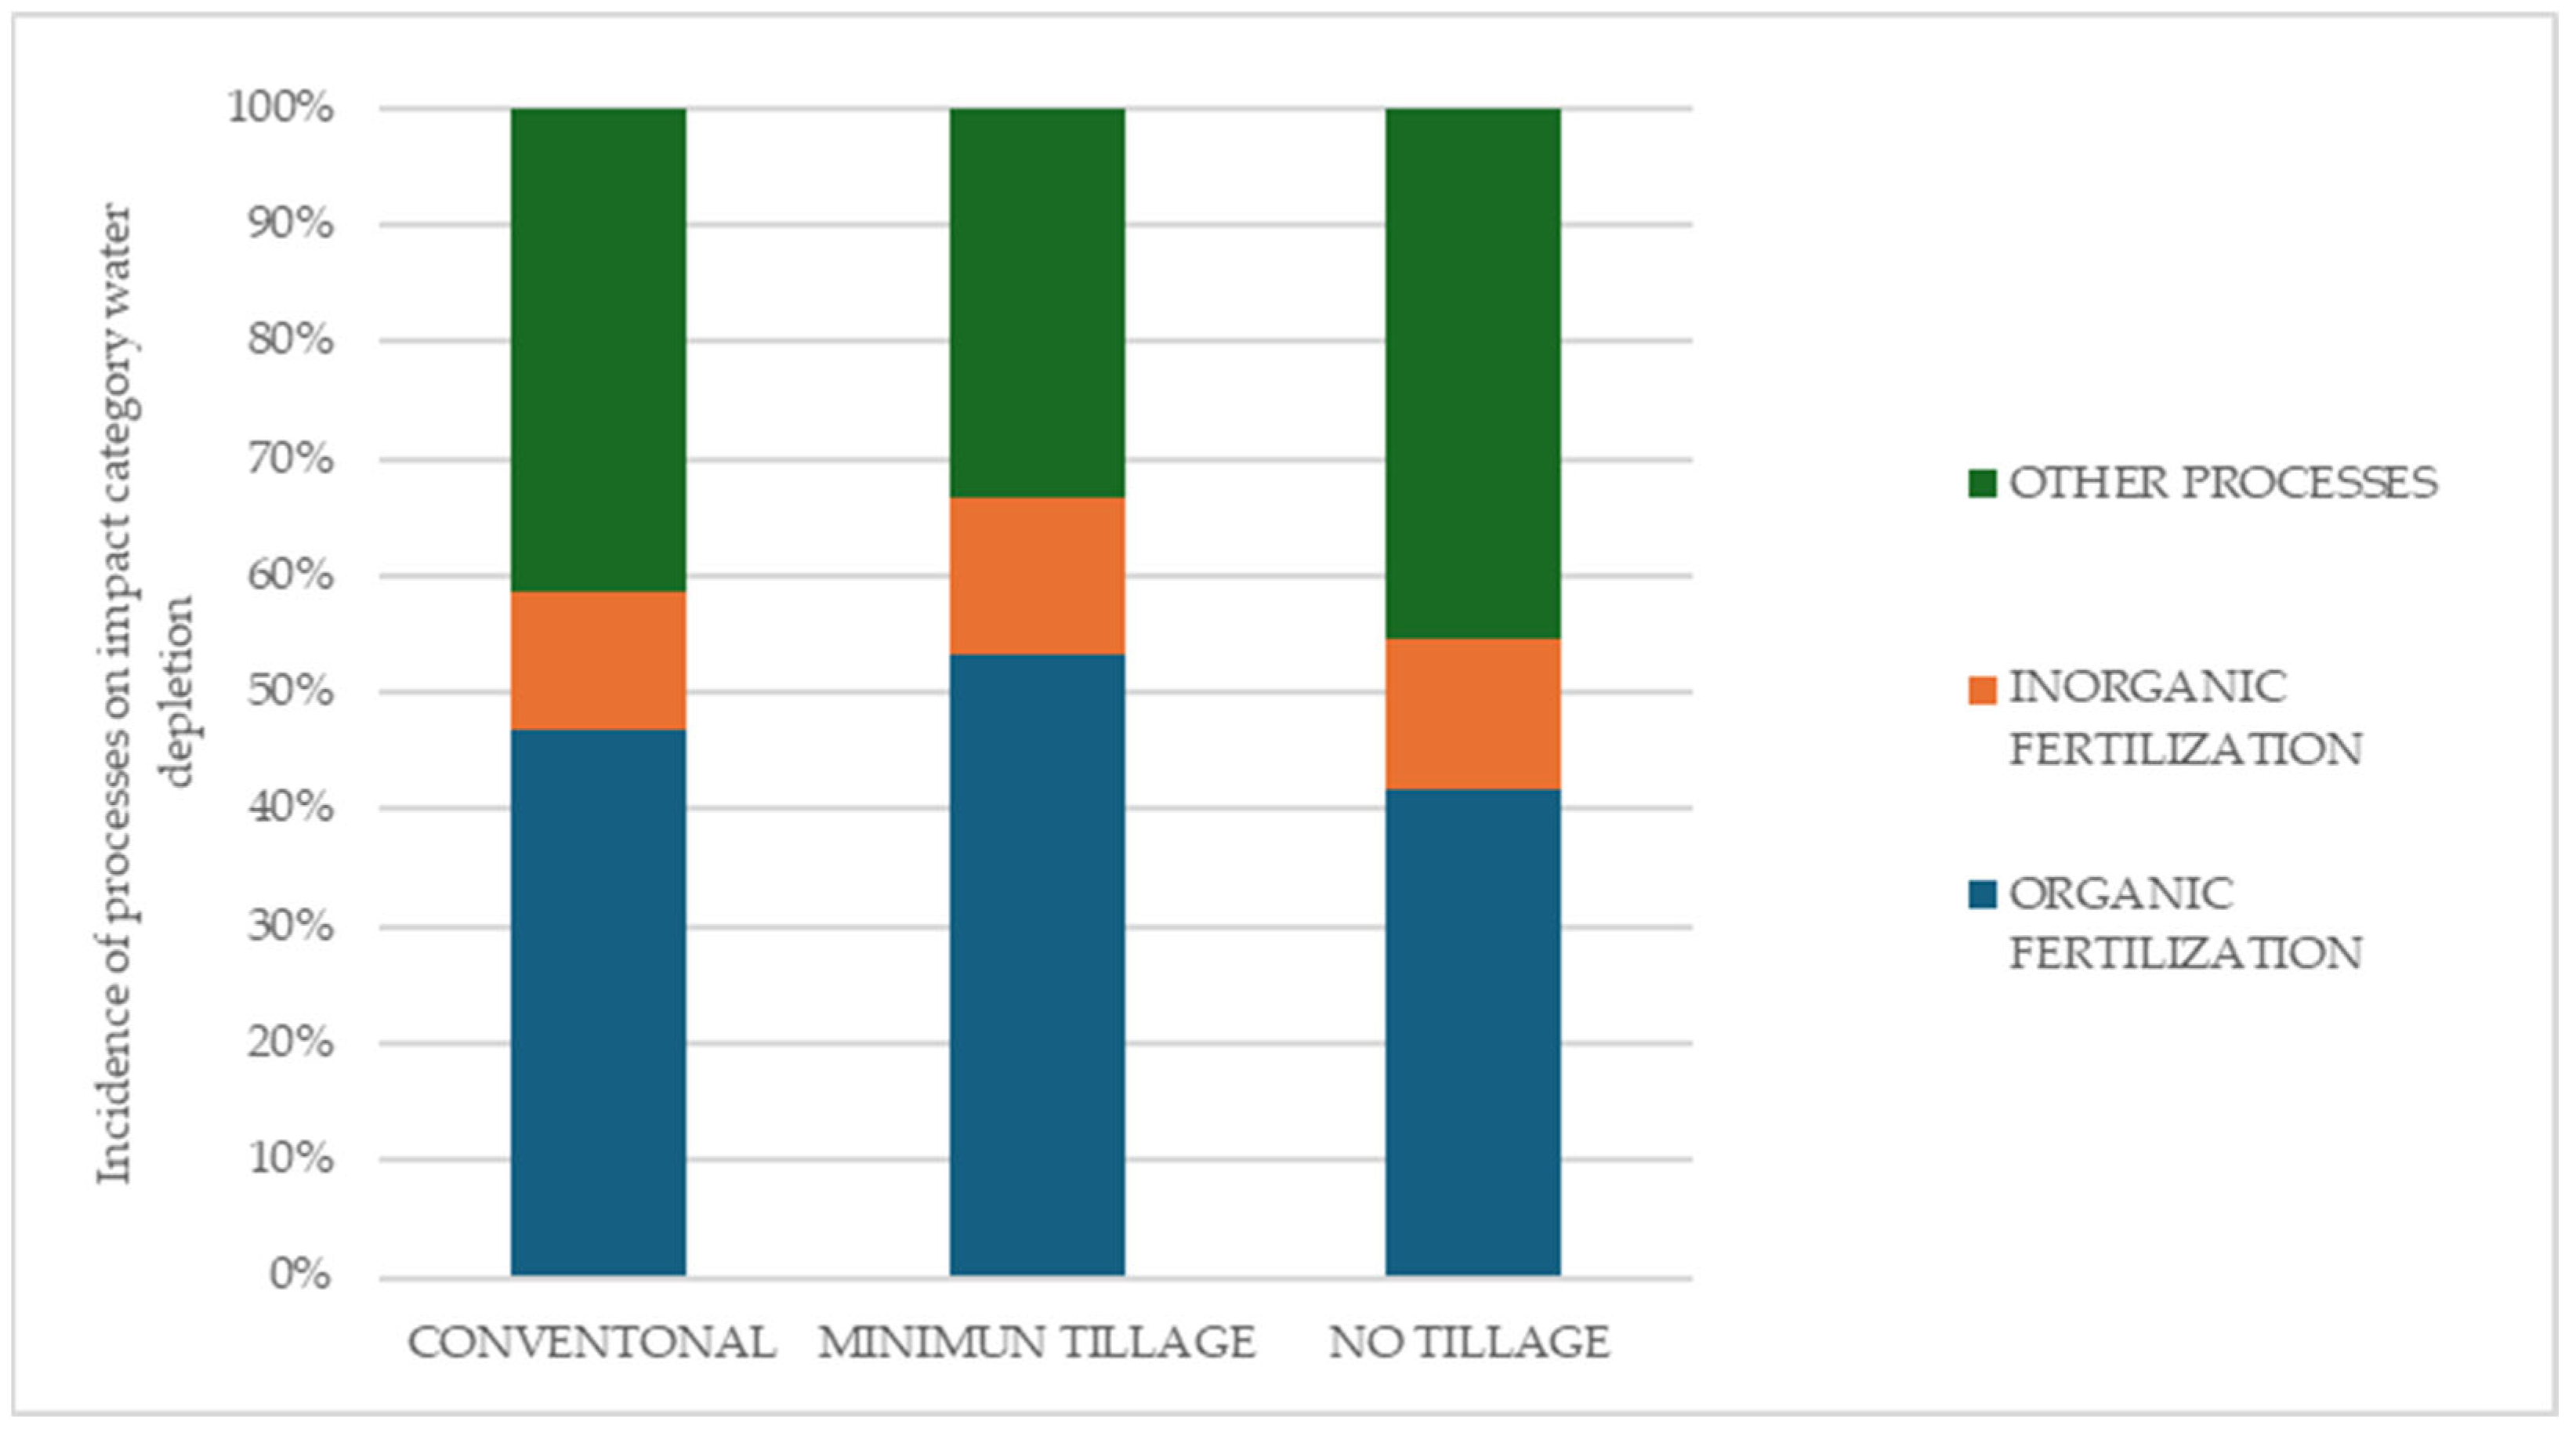
The influence of agricultural processes on impacts related to water consumption shows a different trend. As shown in Figure 8, the incidence of processes on impacts indicates a lower contribution of organic fertilisation than the impact indicators previously analysed. Instead, a higher contribution of other agricultural processes is evident for all three soil management scenarios. The percentage weight contribution of “Other Processes” for the Water Depletion indicator in the three scenarios analysed corresponds to 47% on average.
In particular, the in-depth investigation of the “contribution tree” showed how energy use related to the production of chemical inputs, such as pesticides and herbicides, and technical inputs requires greater consumption of water resources.
The interpretation of the results of the LCA analysis overall shows that the fertilisation phases make the main contribution to the environmental impact in the categories considered. In order to better understand the origin of the high contribution of fertilisation on the environmental impact of cultivating one hectare of field under the three different tillage scenarios, an in-depth analysis of the “contribution tree” specifically for fertilisation was carried out: This showed the same environmental hotspots for all impact categories analysed. Therefore, for representative purposes, Table 3 shows the most detailed analysis of fertiliser impacts related to the climate change category.
Table 3 shows the results of the in-depth analysis of the “contribution tree” for organic and inorganic fertilisation processes. The “tree visualisation” characteristic of the “contribution tree” shows the contribution of the processes and flows to the total impact attributed to the processes relating to the distribution of digestate and urea fertiliser input upstream of the analysed agricultural system. The processes shown in the table are therefore represented by secondary data derived from databases. The comparison of climate change generated by the three soil management scenarios shows how the environmental impact is related to the different amounts of fertiliser distributed, particularly the digestate input. It is evident that the production phase of digestate and urea fertilisers accounts for almost all of the impact contribution of fertilisation. Specifically, the impacts of digestate production are mainly due to the input materials in the anaerobic digestion process. Manure is responsible for a significant amount of direct emissions of nitrous oxide and methane; maize silage production results in a high amount of direct emissions from LUC and emissions from fertilisation processes. The environmental impact of the digestion plant is limited in relation to the raw material used: out of the total value of about 7.872 kg CO2 eq related to digestate production, only 443.21 kg CO2 eq is attributed to plant operation.
In the total impact shown in Table 3 of the “organic fertilisation” and “inorganic fertilisation” processes, emissions from the product transport and field distribution phase are also included; these emissions include diesel combustion in transport vehicles and agricultural tractors and also nitrogen emissions related to fertiliser distribution. Despite this, for organic fertilisation, the contribution to Climate Change impact from digestate transport and field distribution accounts for only 2%, corresponding to 212.06 kg CO2 equivalent for Scenario 1 and Scenario 2 and 154.46 kg CO2 equivalent for Scenario 3. Similarly, in inorganic fertilisation, the transport and distribution phase of urea is equivalent to 68.7 kg CO2 eq for Scenario 1 and Scenario 2 and a value of 45.8 kg CO2 eq for Scenario 3: These values for all three scenarios correspond to 7–10% of the impact contribution to the total value of the inorganic fertilisation process. This percentage contribution in inorganic fertilisation is greater than that for digestate transport and distribution because of the longer distance from the production plant to the field.

4. Discussion

The aim of the LCA analysis conducted in this study was to compare the environmental sustainability of conventional soil management systems with conservation tillage. Tillage is not a mandatory process for agricultural production and can be managed in different ways to optimize the soil’s productivity and biological capacity. According to the principles of conservation agriculture, no-tillage or minimum tillage techniques that minimize mechanical soil disturbance help protect the soil from erosion and degradation, improve its quality and biodiversity, and consequently enhance its fertility [78,79]. Conversely, conventional tillage techniques, such as plowing, lead to high soil transport and erosion rates [80]. In fact, the tool used, the plow, causes the detachment and displacement of the entire topsoil layer (i.e., the plow layer), typically at a uniform depth of 0.24–0.40 m. In extreme cases, such as in cultivated areas with certain clay soils characteristic of the studied geographical region, tillage depth often exceeds 0.50 m [10].
However, our results have shown that minimum tillage practices do not lead to any significant environmental impact improvements on the FU compared to conventional tillage; in contrast, an intense reduction is evident in the no-tillage scenario due to the reduced supply of fertiliser. To better understand this result, it was evaluated alongside previous LCA studies. However, the variability of the LCA methodology, which implies different calculation methodologies, system boundaries, characterisation methods, and different FUs, made a total comparison difficult [76,77,78,79]. The FU is a fundamental element of any LCA study, as it provides the reference to which all other data in the assessment are normalised. In many LCA studies of agricultural production systems, the FU is related to production and is therefore defined on a mass basis. Productivity is a relevant factor to take into account when evaluating the sustainability of the process, including economic sustainability. In our study, we decided to define the cultivated area as the FU for two main reasons. Firstly, we wanted to consider the system’s boundaries beyond the production of a single crop. Secondly, we had to take into account the temporal boundaries of eighteen months, during which different crops would be cultivated. It is common practice to choose a FU based on 1 ha when the objectives of a study extend beyond the evaluation of a single product [81,82]. Furthermore, the study aimed to compare the environmental impact of soil management techniques, regardless of agricultural yield or economic function. The study’s objective is related to analysing the function of land management [83].
In addition, although many studies have been conducted on farms located in the Po Valley [52,56,57], an area with a high prevalence of agriculture, the geographical context also significantly influences the results of an LCA study in agriculture due to the high variability of soil characteristics and, consequently, of the agricultural techniques applied.
Despite this, the results obtained from the present study are generally in line with the conclusions obtained from other studies. The results obtained by Bacenetti et al., 2015 [79] and Houshyar e Grundmann, 2017 [80] demonstrate that no-till systems show reduced environmental impact, particularly in the Climate Change category. An additional element confirmed by other LCA studies related to soil cultivation under different soil management techniques is the environmental hotspots of the process: Diesel combustion in agricultural tractors and the impact of fertilisation processes have also emerged from the results of many other studies [84,85]. However, unlike other studies that consider the use of inorganic fertilisers such as urea and ammonium nitrate or potassium nitrate [86], the results of our research have shown that the use of organic fertiliser such as digestate has significant environmental relevance. In-depth analysis and interpretation of the impact results for indicators of Climate Change, Eutrophication, Human Toxicity and Water Depletion have shown that the impact of organic fertilisation is significantly greater than that of inorganic fertilisation. Specifically, the investigation of impacts through the “contribution tree” showed that the impact of the organic fertilisation process derives mainly from the fertiliser itself, the digestate, rather than from emissions due to its distribution. This factor explains why, in our study, the conservative soil management system based on minimum tillage did not show any improvement over conventional management, as the same amount of digestate was used in both systems. On the other hand, in the conservative soil management system based on no-tillage, where approximately half of the organic fertiliser was distributed, there was an evident reduction in environmental impact. In the case of our environmental impact assessment study, digestate is mainly produced by an anaerobic digestion plant using maize silage as its main raw material. According to Avadì, the author of the study from which the secondary data related to fertiliser in the Agribalyse® database originate [85], which conducts an LCA screening of French organic amendments and fertilisers, the digestate produced from maize silage has the highest environmental impact. This is because, compared to digestate produced mainly from waste or secondary sources such as manure, sewage sludge, or agro-industrial waste, digestate from maize silage has higher impacts resulting from the agricultural cultivation of a dedicated crop. This was also clearly shown by the results of our study, where the main contribution to the impact on the various environmental indicators considered was due precisely to impacts related to the cultivation of raw materials for anaerobic digestion, such as a high rate of kg CO2 eq emissions linked to LUC in terms of climate change impact.
Digestate is a good input for agriculture as a source of benefits and nutrients such as phosphorus, nitrogen, and potassium compared to synthetic fertilisers [50]. It is also historically considered a by-product of biogas production [86], so the environmental impacts of its production should be correctly allocated [87]. Furthermore, the chemical and physical characteristics of digestate and the quantification of the impacts associated with its production depend largely on the raw materials used for anaerobic digestion. For this reason, the assessment and management of the impacts of digestate as an organic fertiliser are still highly controversial and widely discussed in scientific literature [88,89].
This study, thanks to the use of a massive primary dataset and specific secondary data representative of the context under analysis, has therefore highlighted that there is no improvement in the environmental impact of conservation management compared to conventional management in terms of reducing emissions related to different soil management systems. On the other hand, the study highlighted the importance of using organic fertilisers, particularly products derived from dedicated crops, and their role in the environmental sustainability of the agricultural sector.
Given the variability and complexity of many components of agricultural systems, it would be interesting to implement the LCA study with a greater amount of primary data. Moreover, the use of a FU based on maize silage production and the extension of the system boundaries to the anaerobic digestion plant for biogas and digestate production could better clarify the environmental role attributed to the organic fertiliser that emerged from this study.

Limitations of the Study and Future Challenges

We conducted this study with the aim of representing as specifically as possible the environmental impacts related to the agricultural management that the case study under analysis adopts. However, there were some limitations that could not be overcome due to the experimental nature of the study and the intrinsic challenges of the LCA methodology.
Firstly, digestate was included in the analysis as secondary data, alongside urea, herbicides, etc. However, digestate and biogas production are extremely variable processes in terms of plant operation, input matrices and product management (digestate and biogas). This is in contrast to the production process of the inorganic fertiliser urea, which is widely used and standardised globally. Furthermore, the allocation of impacts between biogas and digestate remains a topic of much debate in the scientific literature and should be addressed by taking into account the specific geographical and temporal context of the study, as this may also depend on economic and market variables [85]. This could introduce distortion between literature data and actual data when representing the environmental impacts of digestate. Further studies are needed to expand the boundaries of the system by including the operation of the anaerobic digestion plant for producing digestate and biogas through the collection of appropriate, specific primary data.
Another aspect to be explored is the FU. In agricultural systems, crop productivity data is fundamental to sustainability assessment; however, the focus of the present study was land management, for which the most appropriate FU is area-based. Additional analysis using a mass-based FU could provide further useful information. Future studies will therefore collect more data on crop productivity to provide a more comprehensive analysis of the sustainability of the agricultural system under study. This case study provides preliminary information to further explore the environmental aspects of agricultural systems from an ecological perspective using LCA methodology.

5. Conclusions

Conservation agriculture is playing an increasingly important role in the global agricultural sector, and the importance of adopting sustainable agricultural practices is driving the achievement of the UN’s Agenda 2030 goal for sustainable and resilient agri-food systems and global food security. Preserving and improving soil health through sustainable agricultural practices is key to ensuring these global goals.
The Po basin, particularly the area known as Pianura Padana, is an important centre of agricultural and food production. Conventional agricultural practices are still widely used in this area, but the trend towards conversion to conservation practices is widespread. This is also happening thanks to national policies that provide incentives through subsidies to farms that adopt sustainable practices. Therefore, in order to provide scientific evidence to guide future policy decisions, it is necessary to study the environmental impacts of all the processes that make up complex agricultural production systems.
The LCA methodology is a valuable tool for studying the sustainability of agricultural production in terms of assessing the impacts and emissions generated by related processes. The LCA analysis carried out in our case study showed that there is no improvement in terms of impacts and emissions from agricultural systems managed according to the principles of conservation agriculture compared to conventional systems. However, this conclusion is related to the emissions associated with the various stages of processing and the inputs required to carry out agricultural processes, such as equipment, diesel fuel, chemicals (herbicides, pesticides, and fertilisers), and organic fertilisers. The study, carried out using a large and specific set of primary and secondary data, also highlighted the impact of the use of digestate produced through the use of dedicated crops such as maize silage on Climate Change, Eutrophication and Human Toxicity in particular. The use of this organic fertiliser proved to be the main environmental hotspot of the entire agricultural process analysed.
On the other hand, as previously mentioned, the positive role of conservation management systems and the use of organic fertilisers (compared to inorganic ones) for soil health has been widely recognised. Reducing the use of synthetic fertilisers as much as possible is essential for the protection of resources and ecosystems.
This shows that there are many aspects to consider when assessing the sustainability of the agricultural sector. From an agronomic point of view, it is important to continue studying the benefits of conservative tillage techniques that preserve the chemical, physical, and biological structure of the soil, which is essential for ensuring agricultural productivity and, consequently, food security. It is also important to continue to explore the environmental benefits of using organic fertilisers to improve soil health and increase organic matter. On the contrary, from an ecological point of view, it is essential not to overlook the environmental aspects related to the entire life cycle of an agricultural process, which include the impacts associated with all inputs and production factors used. In fact, many factors contribute to the variability of agricultural systems and therefore to their related environmental impacts, so it is very important to examine each individual flow and process in depth.
In conclusion, this study has potential for improvement in terms of both quantity and quality of data, as shown by the results of the uncertainty analysis. Nevertheless, a comprehensive and correct use of LCA methodology can provide the informative basis for the development of environmental sustainability models for the management of agricultural practices in order to support evidence-based policies.

Supplementary Materials

The following supporting information can be downloaded at: https://www.mdpi.com/article/10.3390/resources14120180/s1, Table S1: Details of primary LCI data; Table S2: Details of the Monte Carlo analysis results; Table S3: Climate change impact category Contribution Tree: detail of the impact results of individual agricultural processes. The unit of measurement of the results is kg CO2 eq.; Table S4: Freshwater eutrophication impact category Contribution Tree: detail of the impact results of individual agricultural processes. The unit of measurement of the results is kg P eq.; Table S5. Human toxicity impact category Contribution Tree: detail of the impact results of individual agricultural processes. The unit of measurement of the results is kg 1,4-DB eq.; Table S6. Marine eutrophication impact category Contribution Tree: detail of the impact results of individual agricultural processes. The unit of measurement of the results is kg N eq.; Table S7. Water depletion impact category Contribution Tree: detail of the impact results of individual agricultural processes. The unit of measurement of the results is m3.

Author Contributions

Conceptualisation, E.T. (Elena Tamburini), E.T. (Elena Tamisari) and M.R.; methodology, D.S., E.T. (Elena Tamisari) and M.M.; data curation, E.T. (Elena Tamisari), F.V. and M.M.; writing—original draft preparation, D.S. and E.T. (Elena Tamisari); writing—review and editing, E.T. (Elena Tamburini) and G.C.; funding acquisition, E.T. (Elena Tamburini), G.C. and M.R. All authors have read and agreed to the published version of the manuscript.

Funding

This research was funded by PSR 2014–2020—Region Emilia Romagna, grant number 5517300—Digestate, Cover Crops and Crop Operations to increase the soil organic substance (DICO SOS).

Data Availability Statement

The data that support the findings of this study are available from the corresponding author upon reasonable request.

Acknowledgments

The authors would like to thank the representative of The Agricultural Foundation F.lli Navarra, Nicola Gherardi Ravalli Modoni and agricultural operator Luca Davì. We would like to express our heartfelt thanks to Reviewer 3, whose expertise and patience were invaluable in helping us improve the article significantly.

Conflicts of Interest

The authors declare no conflict of interest.

References

  1. Organizzazione delle Nazioni Unite. Trasformare Il Nostro Mondo: L’Agenda 2030 Per Lo Sviluppo Sostenibile; Risoluzione Adottata Dall’Assemblea Generale il: New York, NY, USA, 2015; p. 25. [Google Scholar]
  2. Calabrò, G.; Vieri, S. The Process of Integration of the Agenda 2030 into European Policies: The Issue of Migration and the Role of Agriculture. Qual. Access Success 2019, 20, 118–122. [Google Scholar]
  3. Pretty, J.; Bharucha, Z.P. Sustainable Intensification in Agricultural Systems. Ann. Bot. 2014, 114, 1571–1596. [Google Scholar] [CrossRef]
  4. FAO. The State of Food and Agriculture; FAO: Rome, Italy, 2019. [Google Scholar]
  5. Intergovernmental Panel On Climate Change. Climate Change and Land: IPCC Special Report on Climate Change, Desertification, Land Degradation, Sustainable Land Management, Food Security, and Greenhouse Gas Fluxes in Terrestrial Ecosystems, 1st ed.; Cambridge University Press: Cambridge, UK, 2022; ISBN 978-1-009-15798-8. [Google Scholar]
  6. Ripple, W.J.; Wolf, C.; Gregg, J.W.; Levin, K.; Rockström, J.; Newsome, T.M.; Betts, M.G.; Huq, S.; Law, B.E.; Kemp, L.; et al. World Scientists’ Warning of a Climate Emergency 2022. BioScience 2022, 72, 1149–1155. [Google Scholar] [CrossRef]
  7. Shakoor, A.; Ashraf, F.; Shakoor, S.; Mustafa, A.; Rehman, A.; Altaf, M.M. Biogeochemical Transformation of Greenhouse Gas Emissions from Terrestrial to Atmospheric Environment and Potential Feedback to Climate Forcing. Environ. Sci. Pollut. Res. 2020, 27, 38513–38536. [Google Scholar] [CrossRef] [PubMed]
  8. Charles, A.; Rochette, P.; Whalen, J.K.; Angers, D.A.; Chantigny, M.H.; Bertrand, N. Global Nitrous Oxide Emission Factors from Agricultural Soils after Addition of Organic Amendments: A Meta-Analysis. Agric. Ecosyst. Environ. 2017, 236, 88–98. [Google Scholar] [CrossRef]
  9. Kopittke, P.M.; Menzies, N.W.; Wang, P.; McKenna, B.A.; Lombi, E. Soil and the Intensification of Agriculture for Global Food Security. Environ. Int. 2019, 132, 105078. [Google Scholar] [CrossRef] [PubMed]
  10. Alba, S.D.; Borselli, L.; Torri, D.; Pellegrini, S.; Bazzoffi, P. Assessment of Tillage Erosion by Mouldboard Plough in Tuscany (Italy). Soil Tillage Res. 2006, 85, 123–142. [Google Scholar] [CrossRef]
  11. Rasmussen, K.J. Impact of Ploughless Soil Tillage on Yield and Soil Quality: A Scandinavian Review. Soil Tillage Res. 1999, 53, 3–14. [Google Scholar] [CrossRef]
  12. Hobbs, P.R.; Sayre, K.; Gupta, R. The Role of Conservation Agriculture in Sustainable Agriculture. Philos. Trans. R. Soc. B Biol. Sci. 2008, 363, 543–555. [Google Scholar] [CrossRef]
  13. Pittelkow, C.M.; Liang, X.; Linquist, B.A.; Van Groenigen, K.J.; Lee, J.; Lundy, M.E.; Van Gestel, N.; Six, J.; Venterea, R.T.; Van Kessel, C. Productivity Limits and Potentials of the Principles of Conservation Agriculture. Nature 2015, 517, 365–368. [Google Scholar] [CrossRef]
  14. Das, T.K.; Bandyopadhyay, K.K.; Ghosh, P.K. Impact of Conservation Agriculture on Soil Health and Crop Productivity under Irrigated Ecosystems. In Conservation Agriculture: A Sustainable Approach for Soil Health and Food Security: Conservation Agriculture for Sustainable Agriculture; Jayaraman, S., Dalal, R.C., Patra, A.K., Chaudhari, S.K., Eds.; Springer: Singapore, 2021; pp. 139–163. ISBN 978-981-16-0827-8. [Google Scholar]
  15. Boselli, R.; Fiorini, A.; Santelli, S.; Ardenti, F.; Capra, F.; Maris, S.C.; Tabaglio, V. Cover Crops during Transition to No-till Maintain Yield and Enhance Soil Fertility in Intensive Agro-Ecosystems. Field Crops Res. 2020, 255, 107871. [Google Scholar] [CrossRef]
  16. Fiorini, A.; Maris, S.C.; Abalos, D.; Amaducci, S.; Tabaglio, V. Combining No-till with Rye (Secale cereale L.) Cover Crop Mitigates Nitrous Oxide Emissions without Decreasing Yield. Soil Tillage Res. 2020, 196, 104442. [Google Scholar] [CrossRef]
  17. Michler, J.D.; Baylis, K.; Arends-Kuenning, M.; Mazvimavi, K. Conservation Agriculture and Climate Resilience. J. Environ. Econ. Manag. 2019, 93, 148–169. [Google Scholar] [CrossRef]
  18. Meng, X.; Meng, F.; Chen, P.; Hou, D.; Zheng, E.; Xu, T. A Meta-Analysis of Conservation Tillage Management Effects on Soil Organic Carbon Sequestration and Soil Greenhouse Gas Flux. Sci. Total Environ. 2024, 954, 176315. [Google Scholar] [CrossRef]
  19. Li, Y.; Chen, J.; Drury, C.F.; Liebig, M.; Johnson, J.M.F.; Wang, Z.; Feng, H.; Abalos, D. The Role of Conservation Agriculture Practices in Mitigating N2O Emissions: A Meta-Analysis. Agron. Sustain. Dev. 2023, 43, 63. [Google Scholar] [CrossRef]
  20. Intergovernmental Panel on Climate Change (IPCC). Climate Change 2021—The Physical Science Basis: Working Group I Contribution to the Sixth Assessment Report of the Intergovernmental Panel on Climate Change; Cambridge University Press: Cambridge, UK, 2023. [Google Scholar]
  21. Wang, Y.; Liu, G.; Cai, Y.; Giannetti, B.F.; Agostinho, F.; Almeida, C.M.V.B.; Casazza, M. The Ecological Value of Typical Agricultural Products: An Emergy-Based Life-Cycle Assessment Framework. Front. Environ. Sci. 2022, 10, 824275. [Google Scholar] [CrossRef]
  22. Alhashim, R.; Deepa, R.; Anandhi, A. Environmental Impact Assessment of Agricultural Production Using LCA: A Review. Climate 2021, 9, 164. [Google Scholar] [CrossRef]
  23. Heiskanen, E. The Institutional Logic of Life Cycle Thinking. J. Clean. Prod. 2002, 10, 427–437. [Google Scholar] [CrossRef]
  24. Roy, P.; Nei, D.; Orikasa, T.; Xu, Q.; Okadome, H.; Nakamura, N.; Shiina, T. A Review of Life Cycle Assessment (LCA) on Some Food Products. J. Food Eng. 2009, 90, 1–10. [Google Scholar] [CrossRef]
  25. Curran, M.A. Life Cycle Assessment: A Review of the Methodology and Its Application to Sustainability. Curr. Opin. Chem. Eng. 2013, 2, 273–277. [Google Scholar] [CrossRef]
  26. Brunn, H.; Bretz, R.; Fankhauser, P.; Spengler, T.; Rentz, O. LCA in Decision-Making Processes. Int. J. Life Cycle Assess. 1996, 1, 221–225. [Google Scholar] [CrossRef]
  27. Clift, R. System Approaches: Life Cycle Assessment and Industrial Ecology; RSC Publishing: Cambridge, UK, 2013. [Google Scholar]
  28. Standard, I. Environmental Management-Life Cycle Assessment-Requirements and Guidelines; ISO: London, UK, 2006. [Google Scholar]
  29. Heijungs, R. Is Mainstream LCA Linear? Int. J. Life Cycle Assess. 2020, 25, 1872–1882. [Google Scholar] [CrossRef]
  30. Fan, J.; Liu, C.; Xie, J.; Han, L.; Zhang, C.; Guo, D.; Niu, J.; Jin, H.; McConkey, B.G. Life Cycle Assessment on Agricultural Production: A Mini Review on Methodology, Application, and Challenges. Int. J. Environ. Res. Public Health 2022, 19, 9817. [Google Scholar] [CrossRef] [PubMed]
  31. Rahman, M.H.A.; Sharaai, A.H.; Ponrahono, Z.; Rahim, N.N.a.N.A.; Bakar, N.A.A.; Hanifah, N.A.S.; Suptian, M.F.M.; Zubir, M.N.; Shafawi, N.A. Systematic Literature Review on the Application of the Life Cycle Sustainability Assessment in Agricultural Production. J. Sustain. Res. 2024, 6, e240069. [Google Scholar] [CrossRef]
  32. Notarnicola, B.; Sala, S.; Anton, A.; McLaren, S.J.; Saouter, E.; Sonesson, U. The Role of Life Cycle Assessment in Supporting Sustainable Agri-Food Systems: A Review of the Challenges. J. Clean. Prod. 2017, 140, 399–409. [Google Scholar] [CrossRef]
  33. Brankatschk, G.; Finkbeiner, M. Modeling Crop Rotation in Agricultural LCAs—Challenges and Potential Solutions. Agric. Syst. 2015, 138, 66–76. [Google Scholar] [CrossRef]
  34. Rosenbaum, R.K.; Anton, A.; Bengoa, X.; Bjørn, A.; Brain, R.; Bulle, C.; Cosme, N.; Dijkman, T.J.; Fantke, P.; Felix, M.; et al. The Glasgow Consensus on the Delineation between Pesticide Emission Inventory and Impact Assessment for LCA. Int. J. Life Cycle Assess. 2015, 20, 765–776. [Google Scholar] [CrossRef]
  35. Catalano, G.; D’Adamo, I.; Gastaldi, M.; Nizami, A.-S.; Ribichini, M. Incentive Policies in Biomethane Production toward Circular Economy. Renew. Sustain. Energy Rev. 2024, 202, 114710. [Google Scholar] [CrossRef]
  36. González-García, S.; Bacenetti, J.; Negri, M.; Fiala, M.; Arroja, L. Comparative Environmental Performance of Three Different Annual Energy Crops for Biogas Production in Northern Italy. J. Clean. Prod. 2013, 43, 71–83. [Google Scholar] [CrossRef]
  37. Istat Coltivazioni—Superfici e Produzioni in Complesso. 2025. Available online: https://esploradati.istat.it/databrowser/#/it/dw/categories/IT1,Z1000AGR,1.0/AGR_CRP/DCSP_COLTIVAZIONI/IT1,101_1015_DF_DCSP_COLTIVAZIONI_2,1.0 (accessed on 21 March 2025).
  38. D’Adamo, I.; Sassanelli, C. A Mini-Review of Biomethane Valorization: Managerial and Policy Implications for a Circular Resource. Waste Manag. Res. 2022, 40, 1745–1756. [Google Scholar] [CrossRef]
  39. International Energy Agency. IEA Renewables 2024; International Energy Agency: Paris, France, 2024. [Google Scholar]
  40. Popović, V.; Vasileva, V.; Ljubičić, N.; Rakašćan, N.; Ikanović, J. Environment, Soil, and Digestate Interaction of Maize Silage and Biogas Production. Agronomy 2024, 14, 2612. [Google Scholar] [CrossRef]
  41. Hutnan, M.; Špalková, V.; Bodík, I.; Kolesarova, N.; Lazor, M. Biogas Production from Maize Grains and Maize Silage. Pol. J. Environ. Stud. 2010, 19, 323–329. [Google Scholar]
  42. Bahrs, E.; Angenendt, E. Status Quo and Perspectives of Biogas Production for Energy and Material Utilization. GCB Bioenergy 2019, 11, 9–20. [Google Scholar] [CrossRef]
  43. Wellinger, A.; Murphy, J.; Baxter, D. The Biogas Handbook: Science, Production and Applications; Woodhead Publishing: Cambridge, UK, 2013; pp. 1–476. [Google Scholar]
  44. Brychkova, G.; McGrath, A.; Larkin, T.; Goff, J.; McKeown, P.C.; Spillane, C. Use of Anaerobic Digestate to Substitute Inorganic Fertilisers for More Sustainable Nitrogen Cycling. J. Clean. Prod. 2024, 446, 141016. [Google Scholar] [CrossRef]
  45. Panuccio, M.R.; Papalia, T.; Attinà, E.; Giuffrè, A.; Muscolo, A. Use of Digestate as an Alternative to Mineral Fertilizer: Effects on Growth and Crop Quality. Arch. Agron. Soil Sci. 2019, 65, 700–711. [Google Scholar] [CrossRef]
  46. Gustafsson, M.; Anderberg, S. Biogas Policies and Production Development in Europe: A Comparative Analysis of Eight Countries. Biofuels 2022, 13, 931–944. [Google Scholar] [CrossRef]
  47. Fritsche, U.; Brunori, G.; Chiaramonti, D.; Galanakis, C.; Matthews, R.; Panoutsou, C.; Avraamides, M.; Borzacchiello, M.T.; Stoermer, E. Future Transitions for the Bioeconomy Towards Sustainable Development and A Climate-Neutral Economy—Foresight Scenarios for the EU Bioeconomy in 2050; Avraamides, M., Borzacchiello, M.T., Stoermer, E., Eds.; Publications Office: Luxembourg, 2021. [Google Scholar]
  48. Tamburini, E.; Pedrini, P.; Marchetti, M.; Fano, A.; Castaldelli, G. Life Cycle Based Evaluation of Environmental and Economic Impacts of Agricultural Productions in the Mediterranean Area. Sustainability 2015, 7, 2915–2935. [Google Scholar] [CrossRef]
  49. Zulu, S.G.; Motsa, N.M.; Magwaza, L.S.; Ncama, K.; Sithole, N.J. Effects of Different Tillage Practices and Nitrogen Fertiliser Application Rates on Soil-Available Nitrogen. Agronomy 2023, 13, 785. [Google Scholar] [CrossRef]
  50. De Santis, M.A.; Giuzio, L.; Tozzi, D.; Soccio, M.; Flagella, Z. Impact of No Tillage and Low Emission N Fertilization on Durum Wheat Sustainability, Profitability and Quality. Agronomy 2024, 14, 2794. [Google Scholar] [CrossRef]
  51. Massarelli , C.; Losacco, D.; Tumolo, M.; Campanale, C.; Uricchio, V.F. Protection of water resources from agriculture pollution: An integrated methodological approach for the nitrates Directive 91–676-EEC implementation. Int. J. Environ. Res. Public Health 2021, 18, 13323. [Google Scholar] [CrossRef]
  52. Servizio Geologico Sismico e Dei Suoli, Regione Emilia-Romagna Carta Dei Suoli—1:250.000 Della Regione Emilia-Romagna—Edizione. 1994. Available online: https://geoportale.regione.emilia-romagna.it/catalogo/dati-cartografici/informazioni-geoscientifiche/suoli/layer-5 (accessed on 17 November 2025).
  53. ISO 14040; 2006—Environmental Management—Life Cycle Assessment—Principles and Framework. ISO: London, UK, 2025. Available online: https://www.iso.org/standard/37456.html (accessed on 8 April 2025).
  54. Ekvall, T. Attributional and Consequential Life Cycle Assessment. In Sustainability Assessment at the 21st Century; IntechOpen: London, UK, 2019; p. 13. [Google Scholar]
  55. Birkved, M.; Hauschild, M.Z. PestLCI—A Model for Estimating Field Emissions of Pesticides in Agricultural LCA. Ecol. Model. 2006, 198, 433–451. [Google Scholar] [CrossRef]
  56. Soana, E.; Vincenzi, F.; Colombani, N.; Mastrocicco, M.; Fano, E.A.; Castaldelli, G. Soil Denitrification, the Missing Piece in the Puzzle of Nitrogen Budget in Lowland Agricultural Basins. Ecosystems 2022, 25, 633–647. [Google Scholar] [CrossRef]
  57. Paustian, K.; Ravindranath, N.H.; van Amstel, A.R. 2006 IPCC Guidelines for National Greenhouse Gas Inventories; IPCC: Geneva, Switzerland, 2006. [Google Scholar]
  58. Castaldelli, G.; Vincenzi, F.; Fano, E.A.; Soana, E. In Search for the Missing Nitrogen: Closing the Budget to Assess the Role of Denitrification in Agricultural Watersheds. Appl. Sci. 2020, 10, 2136. [Google Scholar] [CrossRef]
  59. Laura Valli. Giuseppe Moscatelli GOI Progetto Emissioni Digestato. Available online: https://digestatoemissioni.crpa.it/nqcontent.cfm?a_id=16865&tt=t_bt_app1_www (accessed on 3 February 2025).
  60. Department for Energy Security and Net Zero. Greenhouse Gas Reporting: Conversion Factors 2023; Department for Energy Security and Net Zero: London, UK, 2023.
  61. European Commission: Joint Research Centre; Korosuo, A.; Vizzarri, M.; Pilli, R.; Fiorese, G.; Colditz, R.; Abad Viñas, R.; Rossi, S.; Grassi, G. Forest Reference Levels Under Regulation (EU) 2018/841 for the Period 2021–2025—Overview and Main Findings of the Technical Assessment; Publications Office: Luxembourg, 2021. [Google Scholar]
  62. WFLDB: World Food LCA Database. Available online: https://quantis.com/services-solutions/consortium-building-and-management/wfldb/ (accessed on 8 April 2025).
  63. Hergoualc’h, K.; Mueller, N.; Bernoux, M.; Kasimir, Ä.; van der Weerden, T.J.; Ogle, S.M. Improved Accuracy and Reduced Uncertainty in Greenhouse Gas Inventories by Refining the IPCC Emission Factor for Direct N2O Emissions from Nitrogen Inputs to Managed Soils. Glob. Change Biol. 2021, 27, 6536–6550. [Google Scholar] [CrossRef] [PubMed]
  64. Fantin, V.; Buscaroli, A.; Dijkman, T.; Zamagni, A.; Garavini, G.; Bonoli, A.; Righi, S. PestLCI 2.0 Sensitivity to Soil Variations for the Evaluation of Pesticide Distribution in Life Cycle Assessment Studies. Sci. Total Environ. 2019, 656, 1021–1031. [Google Scholar] [CrossRef]
  65. Gentil, C.; Fantke, P.; Mottes, C.; Basset-Mens, C. Challenges and Ways Forward in Pesticide Emission and Toxicity Characterization Modeling for Tropical Conditions. Int. J. Life Cycle Assess. 2020, 25, 1290–1306. [Google Scholar] [CrossRef]
  66. Boggia, A.; Luciani, F.; Massei, G.; Paolotti, L. L’impatto Ambientale Ed Economico Del Cambiamento Climatico Sull’agricoltura; Università di Perugia, Dipartimento Economia, Finanza e Statistica, Quaderni del Dipartimento di Economia, Finanza e Statistica: Perugia, Italy, 2008. [Google Scholar]
  67. Huijbregts, M.A.J.; Steinmann, Z.J.N.; Elshout, P.M.F.; Stam, G.; Verones, F.; Vieira, M.; Zijp, M.; Hollander, A.; van Zelm, R. ReCiPe2016: A Harmonised Life Cycle Impact Assessment Method at Midpoint and Endpoint Level. Int. J. Life Cycle Assess. 2017, 22, 138–147. [Google Scholar] [CrossRef]
  68. Lo, S.-C.; Ma, H.; Lo, S.-L. Quantifying and Reducing Uncertainty in Life Cycle Assessment Using the Bayesian Monte Carlo Method. Sci. Total Environ. 2005, 340, 23–33. [Google Scholar] [CrossRef] [PubMed]
  69. Ciroth, A.; Muller, S.; Weidema, B.; Lesage, P. Empirically Based Uncertainty Factors for the Pedigree Matrix in Ecoinvent. Int. J. Life Cycle Assess. 2016, 21, 1338–1348. [Google Scholar] [CrossRef]
  70. Kounina, A.; Margni, M.; Henderson, A.D.; Jolliet, O. Global Spatial Analysis of Toxic Emissions to Freshwater: Operationalization for LCA. Int. J. Life Cycle Assess. 2019, 24, 501–517. [Google Scholar] [CrossRef]
  71. Chen, J.; Zhu, R.; Zhang, Q.; Kong, X.; Sun, D. Reduced-Tillage Management Enhances Soil Properties and Crop Yields in a Alfalfa-Corn Rotation: Case Study of the Songnen Plain, China. Sci. Rep. 2019, 9, 17064. [Google Scholar] [CrossRef] [PubMed]
  72. Li, Y.; Li, Z.; Cui, S.; Jagadamma, S.; Zhang, Q. Residue Retention and Minimum Tillage Improve Physical Environment of the Soil in Croplands: A Global Meta-Analysis. Soil Tillage Res. 2019, 194, 104292. [Google Scholar] [CrossRef]
  73. Tsara, M.; Gerontidis, S.; Marathianou, M.; Kosmas, C. The Long-term Effect of Tillage on Soil Displacement of Hilly Areas Used for Growing Wheat in Greece. Soil Use Manag. 2006, 17, 113–120. [Google Scholar] [CrossRef]
  74. Costa, M.P.; Chadwick, D.; Saget, S.; Rees, R.M.; Williams, M.; Styles, D. Representing Crop Rotations in Life Cycle Assessment: A Review of Legume LCA Studies. Int. J. Life Cycle Assess. 2020, 25, 1942–1956. [Google Scholar] [CrossRef]
  75. Acosta-Alba, I.; Chia, E.; Andrieu, N. The LCA4CSA Framework: Using Life Cycle Assessment to Strengthen Environmental Sustainability Analysis of Climate Smart Agriculture Options at Farm and Crop System Levels. Agric. Syst. 2019, 171, 155–170. [Google Scholar] [CrossRef]
  76. Nemecek, T.; Dubois, D.; Huguenin-Elie, O.; Gaillard, G. Life Cycle Assessment of Swiss Farming Systems: I. Integrated and Organic Farming. Agric. Syst. 2011, 104, 217–232. [Google Scholar] [CrossRef]
  77. Carozzi, M.; Bregaglio, S.; Scaglia, B.; Bernardoni, E.; Acutis, M.; Confalonieri, R. The Development of a Methodology Using Fuzzy Logic to Assess the Performance of Cropping Systems Based on a Case Study of Maize in the Po Valley. Soil Use Manag. 2013, 29, 576–585. [Google Scholar] [CrossRef]
  78. Noya, I.; González-García, S.; Bacenetti, J.; Arroja, L.; Moreira, M.T. Comparative Life Cycle Assessment of Three Representative Feed Cereals Production in the Po Valley (Italy). J. Clean. Prod. 2015, 99, 250–265. [Google Scholar] [CrossRef]
  79. Bacenetti, J.; Fusi, A.; Negri, M.; Fiala, M. Impact of Cropping System and Soil Tillage on Environmental Performance of Cereal Silage Productions. J. Clean. Prod. 2015, 86, 49–59. [Google Scholar] [CrossRef]
  80. Houshyar, E.; Grundmann, P. Environmental Impacts of Energy Use in Wheat Tillage Systems: A Comparative Life Cycle Assessment (LCA) Study in Iran. Energy 2017, 122, 11–24. [Google Scholar] [CrossRef]
  81. Vatsanidou, A.; Kavalaris, C.; Fountas, S.; Katsoulas, N.; Gemtos, T. A Life Cycle Assessment of Biomass Production from Energy Crops in Crop Rotation Using Different Tillage System. Sustainability 2020, 12, 6978. [Google Scholar] [CrossRef]
  82. Holka, M.; Bieńkowski, J. Carbon Footprint and Life-Cycle Costs of Maize Production in Conventional and Non-Inversion Tillage Systems. Agronomy 2020, 10, 1877. [Google Scholar] [CrossRef]
  83. Stoessel, F.; Sonderegger, T.; Bayer, P.; Hellweg, S. Assessing the Environmental Impacts of Soil Compaction in Life Cycle Assessment. Sci. Total Environ. 2018, 630, 913–921. [Google Scholar] [CrossRef]
  84. Keshavarz Afshar, R.; Dekamin, M. Sustainability Assessment of Corn Production in Conventional and Conservation Tillage Systems. J. Clean. Prod. 2022, 351, 131508. [Google Scholar] [CrossRef]
  85. Avadí, A. Screening LCA of French Organic Amendments and Fertilisers. Int. J. Life Cycle Assess. 2020, 25, 698–718. [Google Scholar] [CrossRef]
  86. Doyeni, M.O.; Stulpinaite, U.; Baksinskaite, A.; Suproniene, S.; Tilvikiene, V. The Effectiveness of Digestate Use for Fertilization in an Agricultural Cropping System. Plants 2021, 10, 1734. [Google Scholar] [CrossRef]
  87. Lamolinara, B.; Pérez-Martínez, A.; Guardado-Yordi, E.; Fiallos, C.G.; Diéguez-Santana, K.; Ruiz-Mercado, G.J. Anaerobic Digestate Management, Environmental Impacts, and Techno-Economic Challenges. Waste Manag. 2022, 140, 14–30. [Google Scholar] [CrossRef] [PubMed]
  88. Timonen, K.; Sinkko, T.; Luostarinen, S.; Tampio, E.; Joensuu, K. LCA of Anaerobic Digestion: Emission Allocation for Energy and Digestate. J. Clean. Prod. 2019, 235, 1567–1579. [Google Scholar] [CrossRef]
  89. Rehl, T.; Lansche, J.; Müller, J. Life Cycle Assessment of Energy Generation from Biogas—Attributional vs. Consequential Approach. Renew. Sustain. Energy Rev. 2012, 16, 3766–3775. [Google Scholar] [CrossRef]
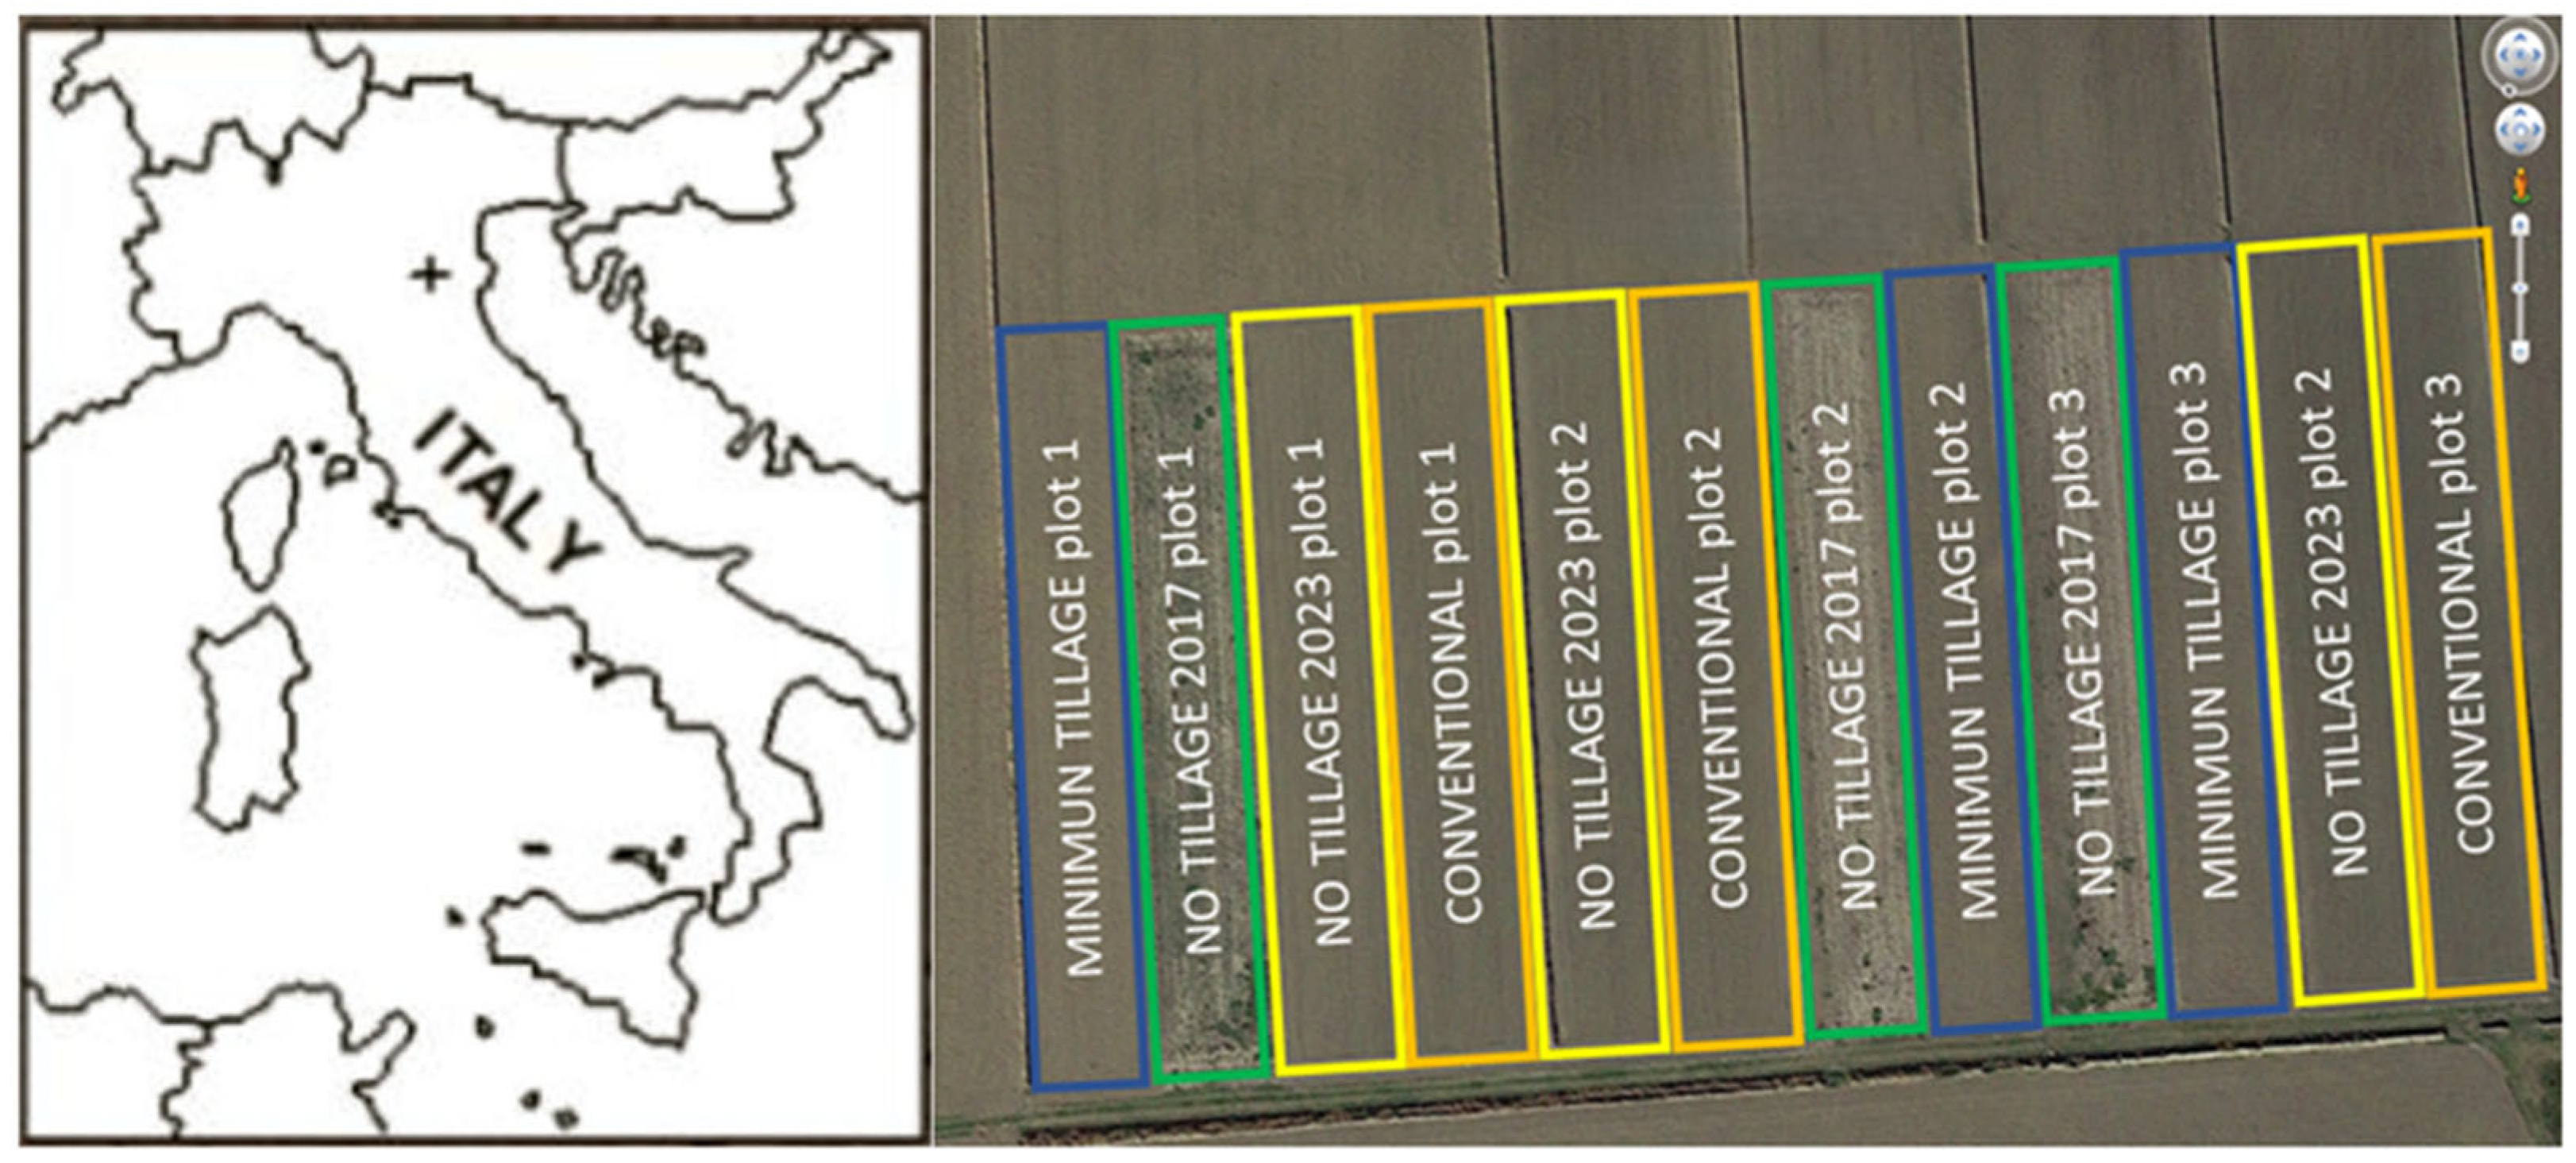
Figure 1. The location of the agricultural test site is indicated by the cross on the map on the left. The panel on the right shows the plot division.
Resources 14 00180 g001
Figure 2. Representation of the minimal tillage of a plot at the experimental site, which was performed using a disc harrow.
Resources 14 00180 g002
Figure 4. Contribution tree of the climate change impact category: percentage incidence of organic fertilisation (blue bars), inorganic fertilisation (orange bars) and cumulative effect of other processes (green bars).
Resources 14 00180 g004
Figure 5. Contribution tree of the Freshwater Eutrophication impact category: percentage incidence of organic fertilisation (blue bars), inorganic fertilisation (orange bars) and cumulative effect of other processes (green bars).
Resources 14 00180 g005
Figure 6. Contribution tree of the Marine Eutrophication impact category: percentage incidence of organic fertilisation (blue bars), inorganic fertilisation (orange bars) and cumulative effect of other processes (green bars).
Resources 14 00180 g006
Figure 7. Contribution tree of the Human Toxicity impact category: percentage incidence of organic fertilisation (blue bars), inorganic fertilisation (orange bars) and cumulative effect of other processes (green bars).
Resources 14 00180 g007
Figure 8. Contribution tree of the Water Depletion impact category: percentage incidence of organic fertilisation (blue bars), inorganic fertilisation (orange bars) and cumulative effect of other processes (green bars).
Resources 14 00180 g008
Table 1. Example of primary data inventory for equipment (sowing phase).
DataTractor (New Holland 105 cv)Pneumatic Seeder
Reference database processTractor, LT 12,000 h productionagricultural machinery, tillage, production
Weight (kg)40201260
End of life (h)12,000131,490
Working time (h/ha)11
Fuel consumed (L/h)77
Maintenance (lubricating oil)ND1 kg per 16 h
Conversion factor17,777.78194,800
Table 2. Environmental impact results of the LCA analysis for Scenario 1, 2 and 3 and results of the Monte Carlo simulation.
Impact
Category
UnitScenario 1
(Conventional)
Scenario 2
(Minimum Tillage)
Scenario 3
(No Tillage)
MeanSD 2CV 3 (%)MeanSDCV (%)MeanSDCV (%)
Climate Changekg CO2 eq10,938.10307.602.8%10,547.97314.103.0%6075.02157.852.6%
Freshwater
Eutrophication
kg P eq2.460.3212.9%2.440.3213.3%1.330.1611.9%
Human Toxicitykg 1,4-DB eq 11771.33128.307.2%1738.21172.109.9%1029.93172.4016.7%
Marine
Eutrophication
kg N eq76.4314.2118.6%76.2514.8419.5%38.987.1718.4%
Water Depletionm3713.23111.5015.6%623.64102.6016.5%431.5371.8116.6%
1 kg 1,4-DB eq corresponds to kg 1,4-dichlorobenzene equivalent; 1,4-dichlorobenzene is a harmful, irritating, carcinogenic and environmentally hazardous compound. 2 SD, standard deviation; 3 CV, coefficient of variation.
Table 3. Amount of organic and inorganic fertiliser distributed for each scenario, expressed in tonnes of product per hectare; process hotspots climate change: detailed contribution of fertilisation processes; kg CO2 eq is the unit of measurement for all values. All results shown in Table 3 refer to the FU of the study (1 ha over 18 months).
ScenarioConventionalMinimum TillageNo
Tillage
Amount organic fertiliserdigestate = 45 ton/hadigestate = 45 ton/hadigestate = 23 ton/ha
Amount inorganic fertiliserurea = 0.81 ton/haurea = 0.81 ton/haurea = 0.5 ton/ha
Total impact on climate change10,938.1010,547.976075.02
1. ORGANIC FERTILISATION8083.878083.874091.16
1.1 Digestate from maize silage production7871.817871.813936.7
1.1.1 (Direct contribution digestate)850.29850.29425.24
1.1.2 Maize silage shredded5651.345705.342739.52
1.1.2a Silage maize cultivation5477.825477.83689.16
1.1.2a * LUC silage maize cultivation1378.011378.01276.99
1.1.3 Other digestate (from manure)553.87553.87221.65
1.1.3a (Direct contribution other digestate)546.29546.29273.20
1.1.4 Heat (digestion plant)443.21443.21221.65
1.2 Digestate transport and distribution212.06212.06154.46
2. INORGANIC FERTILISATION941.64941.64606.20
2.1 Urea production (with 46% N)872.94872.94560.40
2.2 Urea transport and distribution68.768.745.8
‘*’ indicates an additional hierarchical level of processes
Disclaimer/Publisher’s Note: The statements, opinions and data contained in all publications are solely those of the individual author(s) and contributor(s) and not of MDPI and/or the editor(s). MDPI and/or the editor(s) disclaim responsibility for any injury to people or property resulting from any ideas, methods, instructions or products referred to in the content.