Article

The Influence of the Rainfall Extremes and Land Cover Changes on the Major Flood Events at Bekasi, West Jawa, and Its Surrounding Regions

by
Fanny Meliani
1,
Reni Sulistyowati
1,*,
Elenora Gita Alamanda Sapan
1,
Lena Sumargana
1,
Sopia Lestari
2,3,
Jaka Suryanta
1,
Aninda Wisaksanti Rudiastuti
4,
Ilvi Fauziyah Cahyaningtiyas
1,
Teguh Arif Pianto
1,
Harun Idham Akbar
1,5,
Yulianingsani
1,
Winarno
6,
Hari Priyadi
1,
Darmawan Listya Cahya
1,
Bambang Winarno
1 and
Bayu Sutejo
1
1
Research Center for Limnology and Water Resources, National Research and Innovation Agency (BRIN), South Tangerang 15314, Indonesia
2
Research Center for Climate and Atmosphere, National Research and Innovation Agency (BRIN), South Tangerang 15314, Indonesia
3
Institute for Space-Earth Environmental Research (ISEE), Nagoya University, Nagoya 4640805, Japan
4
Research Center for Conservation of Marine and Inland Water Resources, National Research and Innovation Agency of Indonesia (BRIN), Bogor 16911, Indonesia
5
Study Program of Tropical Ocean Economics, Faculty of Economics and Management, IPB University, Bogor 16680, Indonesia
6
Directorate for Laboratory Management, Research Facilities, and Science and Technology Park, National Research and Innovation Agency (BRIN), Jakarta 10340, Indonesia
*
Author to whom correspondence should be addressed.
Resources 2025, 14(11), 169; https://doi.org/10.3390/resources14110169 (registering DOI)
Submission received: 8 September 2025 / Revised: 18 October 2025 / Accepted: 21 October 2025 / Published: 27 October 2025

Abstract

The Bekasi River Basin is highly vulnerable to severe and recurrent flooding, as evidenced by significant infrastructure and environmental damage during major events. This study investigates the catastrophic floods of 2016, 2020, 2022, and 2025 by implementing the Rainfall-Runoff-Inundation (RRI) model to simulate key hydrological processes. After validation using historical water level data, the model performed effectively, achieving the highest coefficient of determination (R2 = 0.75) and lowest root mean square error (RMSE = 0.66) at Cileungsi Station. In contrast, the lowest R2 = 0.02, and the highest RMSE = 3.74 at Pondok Gede Permai (PGP) Station. The results reveal a concerning trend of worsening 5-year flood events, with the 2025 flood reaching a peak inundation depth exceeding 3 m and affecting an area of 2.97 km2, caused by a rainfall threshold of more than 180 mm/day. Furthermore, the model shows a rapid hydrological response, with a time lag of approximately 7 h or less between peak rainfall and flood onset across three monitoring stations. Analysis indicates these severe floods were primarily triggered by heavy rainfall combined with significant land cover changes. The findings provide valuable insights for flood prediction and mitigation strategies in this vulnerable region.

1. Introduction

Urban flooding has emerged as a critical challenge in rapidly developing regions, with Southeast Asian megacities experiencing unprecedented flood frequencies due to climate change and uncontrolled urban expansion [1,2,3]. The compound effects of extreme rainfall intensification and land cover transformation create complex flood dynamics that remain poorly understood, particularly in tropical developing countries where monitoring infrastructure is limited [4,5], like the Indonesian Maritime Continent (IMC).
The IMC, located in the equatorial regions, has received strong insulation leading to a large reservoir of warm sea surface temperature (SST) and moisture, as well as high rainfall compared to any other regions around the world. Situated between the Pacific and the Indian Ocean, large-scale climate variability, such as the El Niño-Southern Oscillation (ENSO) and the Indian Ocean Dipole (IOD), also influences rainfall variability. Furthermore, a highly complex topography over the IMC has caused a complicated climate and weather system. Hence, accurate weather and flood predictions have always been a big challenge to date.
The IMC has highly localized rainfall and is prone to floods. Bekasi, an urban region adjacent to the Megacity of Jakarta, has been vulnerable to heavy rainfall, which can often increase in the chance of flood occurrence. The flood monitoring and prediction in this region are also challenging, as a high-water level associated with a flood does not necessarily come from the heavy rainfall but also from the inflow of water from the upstream rivers, and tidal waves from the downstream area. Bekasi has experienced catastrophic flooding with increasing frequency. Major events in 2016, 2020, 2022, and 2025 have affected millions of residents and caused economic losses [6,7,8,9,10,11]. The Bekasi River Basin, home to 3.2 million people [12], experienced a 43% increase in built-up areas between 1990 and 2018 [13], while extreme rainfall events have become more frequent. These events have an increase in flood risks that exceed those predicted by considering either factor independently. Yet, up to now, studies on understanding the influence of the timing of the peak of rainfall and its amplitude on floods are still limited in the region.
Despite extensive global research on urban flooding, significant research gaps persist for tropical urbanizing river basins, particularly in understanding the complex influence between intense rainfall patterns, rapid urbanization, and suboptimal drainage infrastructure in these environments remains a considerable challenge [14,15]. First, the impacts of extreme rainfall and land cover change on flood risk have been studied [16,17], but their influence remains unclear across some of IMC megacities, as each river basin has its own hydrological characteristics [18]. Second, existing flood models developed may not capture the characteristics of tropical urban river basins, requiring more appropriate hydrological frameworks for each river basin [19]. Third, the lack of ground-based monitoring in developing countries demands a large-scale gridded dataset as input to hydrological models to overcome data scarcity [20]. In addition, river basin areas that span from mountainous regions to relatively flat lowlands to coastal and urban areas indicate the complex topography of the region, which requires higher-resolution rainfall data to accurately capture detailed rainfall characteristics [21]. These gaps highlight the need for a deeper integrated urban flood analysis that combines gridded rainfall data and land cover changes within hydrological modelling to provide more reliable flood risk assessment in data-scarce tropical urban river basins, especially over the downstream region of Bekasi.
Recent integrated studies have shown that interactions between land cover changes and extreme rainfall events can exacerbate flooding in highly urbanized regions. Two-dimensional hydraulic modeling, such as HEC–RAS (Hydrologic Engineering Center–River Analysis System), indicates that the conversion of forest or agricultural land into urban areas every 13 km2 has significantly increased in the flood extent by up to 15% and the flood volume by 16% in the Ciliwung River Basin [22]. Similarly, ref. [23] demonstrated that in Indonesian watersheds, the combined influence of land cover and climate change could expand flood inundation areas by up to 3.5 km2 by 2030, highlighting their substantial role in shaping future hydrological and flood dynamics using the Rainfall-Runoff-Inundation (RRI) model. Another study in Chiang Mai, Thailand, employing the RRI model, found that land cover changes driven by urbanization have a significant increase in flood risk [24]. Moreover, in the Ibu Kota Nusantara (IKN) development zone, ref. [25] reported a marked increase in inundation area from 1497.91 hectares in 2019 to 1545.16 hectares in 2023, with notable shifts in hazard classifications driven by depth–velocity interactions and duration metrics. These studies collectively demonstrate that land cover changes, such as urbanization and deforestation, alter flood dynamics by increasing surface runoff, emphasizing that accurate representation of land cover is essential for effective flood risk modeling and management.
Advances in satellite-based rainfall data, open-access geospatial data, and distributed rainfall-runoff-inundation models offer a path to address these gaps in data-limited contexts. The integration of novel satellite data, geospatial data, and distributed hydrological models provides a robust hydrological framework for enhancing flood forecasting and mitigation strategies in such regions [26]. Satellite-based rainfall products such as Global Satellite Mapping of Precipitation (GSMaP) now provide near-real-time rainfall data at 0.1° resolution [27]. Distributed hydrological models can simulate coupled surface-subsurface flows [28,29], enhance flood forecasting accuracy, and show good agreements in data-rich environments [30,31].
Numerous studies on RRI applications have been conducted in various river basins across IMC. RRI has been applied in a single event, the 2020 catastrophic flood in Jakarta, to determine the return period of the 2020 flood event [7]. In the large-scale river basin such as the upper Citarum, the RRI model has been shown to simulate the inundation area of the February 2010 flood event more effectively [32]. In addition, the RRI model has been applied to assess flood inundation under climate change conditions, revealing that flood volume increased by 3.3 times in the Batanghari River Basin [33]. Particularly in this study, we employ the RRI model to analyze rainfall, runoff, and inundation processes across multiple major flood events (2016, 2020, 2022, 2025), in contrast to previous studies. In this research, as an input into RRI, we utilized hourly GSMaP rainfall data, along with land cover changes within the period, to simulate inundation depths. Moreover, we used the RRI model outputs, i.e., the river water level, to determine the time lag between rainfall and the subsequent increase in river water level, and the inundation peak to establish the rainfall threshold. While previous studies have primarily focused on highly urbanized areas, such as the Ciliwung and Upper Citarum River Basins, this study extends the analysis to satellite cities, such as the Bekasi River Basin. Unlike its neighboring river basins, the Bekasi River Basin still faces limited preparedness for flood disasters and less integrated river basin management and disaster governance [34].
This study directly addresses the above gaps through the utilization of combined satellite-based rainfall data, open-access geospatial data, authoritative land cover data, water level observation data, and distributed rainfall-runoff-inundation, with the area study focusing on the Bekasi River Basin. To our knowledge, the study on characterizing the inundation during the multiple flood events over the Bekasi region has not been investigated previously, particularly using the water level datasets at six ground-based stations in comparison to the simulated RRI model. We examine the influence of extreme rainfall on flood inundation, establish rainfall–flood lag relationships ranging from 24 h to 72 h across six monitoring stations, analyze the influence of land cover changes on flood, and determine rainfall thresholds that might trigger flooding. These findings shall provide insights into flood management in tropical urban river basins across IMC megacities.
The RRI as a distributed model was used to address these gaps was based on its advantages over alternatives: (1) instead of requiring detailed channel cross-sections every 100–500 m [35] or complete sewer network data [36], RRI operates with publicly available digital elevation model (DEM) and rainfall data [31,37], but a limited hydraulic survey availability in Bekasi’s river network, a common constraint in developing countries [38]; (2) its computational efficiency (<10–30 min of simulation time depends on the extent of river basin and resolution being applied) [39,40]. In this study, the computational time was less than 10 min, which enables operational flood forecasting in near real time, significantly faster than any hydrological model [30,41]; (3) proven validation in similar Southeast Asian contexts, which supports its suitability for this study, including Chao Phraya, Thailand which had streamflow validation >70% at key locations, whereas spatial inundation validation showed moderate agreement of True Ratio ≈ 72%, and Hit Ratio ≈ 57% [39]; and Kalu River, Sri Lanka with Nash–Sutcliffe Efficiency (NSE) >0.9 [42], and for the Bago River in Myanmar, both NSE and R2 were greater than 0.9 [43].
The objectives of this research are as follows: first, quantification of flood characteristics (river water level, inundation depth) and identify the primary causes of four major flood events; second, a characterization of station–specific rainfall to river water level time lag relationships and a rainfall threshold distribution that can support early warning and response; third, analyze the influence of land cover change that causes inundation over the river basin. Compared to our preliminary RRI application that focused on a single extreme event [44], this research examines four extreme events with a more comprehensive analysis. This knowledge is beneficial for the preliminary assessment and provides valuable operational insights into flood management.

2. Materials and Methods

2.1. Study Area

The Bekasi River Basin (106°48′28″–107°27′29″ E, 6°10′6″–6°30′6″ S) covers 142,845 hectares in West Jawa, Indonesia, located 20 km East of Jakarta as shown in (Figure 1). The basin extends 115 km from the Southern highlands of Bogor (elevation 2235 m) to the Jawa Sea, encompassing three main rivers: Bekasi, Cikeas, and Cileungsi [45]. This basin falls within the administrative boundaries of Bogor Regency, Bekasi Regency, and Bekasi City in West Jawa Province. The Bekasi River Basin is exposed to a variety of land cover types, including communities, industry, mining, and shrubs [46], as well as three important rivers. The Bekasi River Basin is critical because it supplies clean water to the province’s population and industries. However, the river basin is prone to flooding during the rainy season [47], particularly around the junction of the Cileungsi and Cikeas rivers and near the coast. These flood events are mostly caused by heavy rainfall and exacerbated by land cover change over Bekasi River Basin [48].
The Bekasi River Basin has a wet tropical climate, with a hot and humid dry season from June to September, and a rainy season from October to March. The annual average temperature is around 28 °C. Rainfall patterns show significant spatio-temporal variability, with annual rainfall during the wet season ranging from 1920 mm in the Southern and downstream area to 1400 mm in the Northern region [49].

2.2. Materials

There were frequent flood disasters from different years that occurred in Bekasi and its surrounding regions, which were used in this study. We selected four major flood events in 2016, 2020, 2022, and 2025 due to the catastrophe and its impact on society. The study utilized various satellite data for estimating flood inundation using the RRI model and ground-based observation data for validation, shown in (Table 1). Multiple software tools were applied in data processing and analysis, including ArcGIS Pro ver. 3.5.1 (ESRI, Redlands, CA, USA), RStudio ver. 2025.05.1+513 (Posit Software, PBC, Boston, MA, USA), Open GrADS ver. 2.2.1.oga.1.(Center for Ocean-Land-Atmosphere Studies (COLA), Calverton, MD, USA), and Python in Excel ver. Office 365 (Microsoft Corporation, Redmond, WA, USA). ArcGIS Pro was used for processing, classification, data conversion, thematic maps, and visualization of geospatial data. RStudio and Python provided analysis for rainfall and water level. Open GrADS was used to describe the rainfall propagation over the study area.

2.2.1. Rainfall

The rainfall data we used in this study are from GSMaP_Gauge (JAXA, Tokyo, Japan), a multi-resolution global rainfall product developed by JAXA under the Global Precipitation Measurement (GPM) mission. GSMaP provides hourly rain rate and gauge-calibrated rain rate data, also near-real-time rainfall information. The data can be downloaded at JAXA Global Rainfall Watch (https://sharaku.eorc.jaxa.jp/GSMaP/) (accessed on 24 January 2025). GSMaP data produces global rainfall data with high temporal resolution. Some previous studies using GSMaP data can show high accuracy compared to other satellite data [50,51,52,53,54,55]. GSMaP data has moderate to high correlation values, making it an alternative source suitable for hydrological analysis in river basins where rainfall data is limited [56].
Hourly gridded rainfall taken from GSMaP_Gauge data during the four periods of the flood events. The rainfall categories are classified based on rainfall criteria from the Indonesian Agency for Meteorological, Climatological and Geophysics (BMKG) [57] as shown in Table 2.

2.2.2. Land Cover (LC)

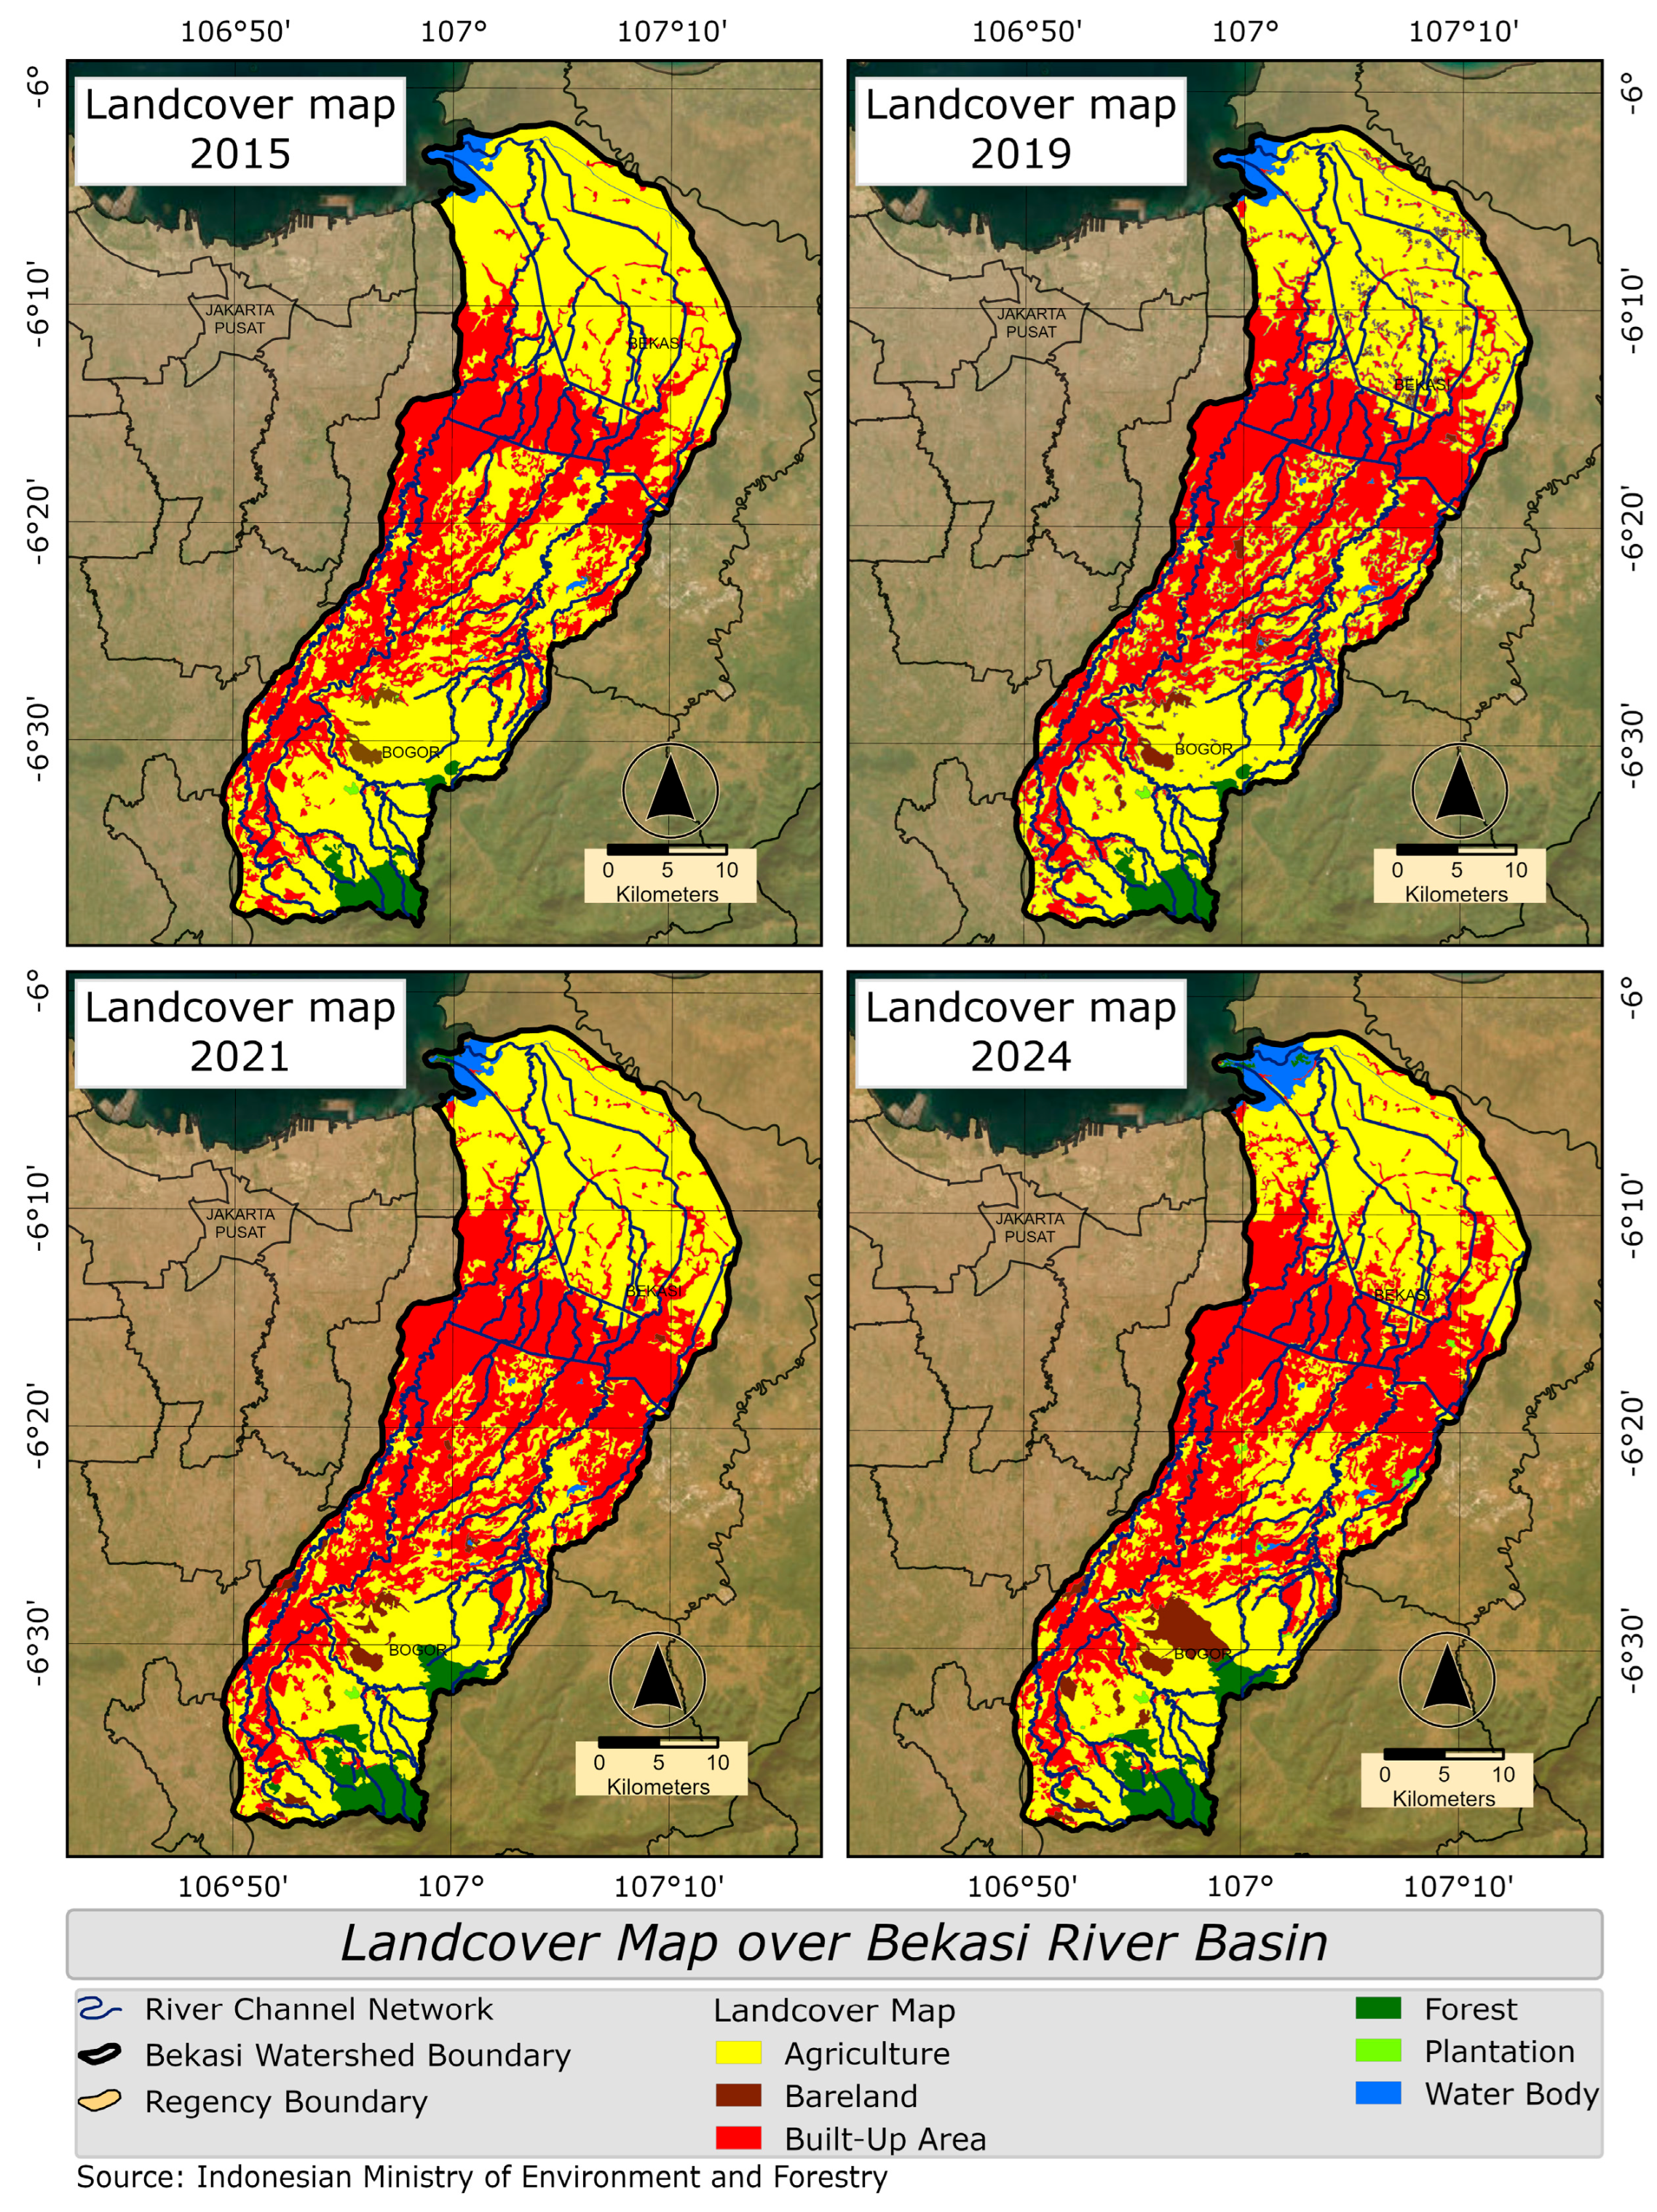
This study utilizes land cover (LC) data from the Indonesian Ministry of Environment and Forestry (MoEF), which issues references of land covers and has passed ground-based validation for all Indonesian regions for the years 2015, 2019, 2021, and 2024. The LC data from one year prior to each flood event is utilized in order to investigate the LC change patterns in the period leading up to the flooding. The supervised classification for LC is categorized into six classes, i.e., agriculture, bare land, built-up area, forest, plantation, and water body. These datasets are applied in the hydrological simulation using the rainfall-runoff model and in the analysis of land cover changes and coverage. LC data and soil texture over the area were essential for determining model parameters that influence infiltration and subsurface processes.

2.2.3. Digital Elevation Model (DEM)

The Digital Elevation Model (DEM) data was used to understand the topographic and river network, which is essential for simulating rainfall-runoff processes. HydroSHEDS was employed as input in the RRI model. Launched in 2006 by the World Wildlife Fund, HydroSHEDS offers freely available hydrographic datasets, which can be downloaded on the website (https://hydrosheds.org/hydrosheds-core-downloads) (accessed on 30 January 2025). HydroSHEDS is primarily derived from elevation data of the Shuttle Radar Topography Mission (SRTM) [58]. There are various resolutions of regional and global data provided by HydroSHEDS. The dataset utilized in this study is the HydroSHEDS product with a spatial resolution of 15 arc-seconds (~450 m at the equator). Several earlier studies have applied HydroSHEDS for input data in the RRI model to simulate flood runoff and inundation [39,44,55,59,60].

2.2.4. River Water Level (WL)

Water level (WL) was measured using the automatic water level recorder (AWLR) (PT. Higertech Karya Sinergi, Bandung, Indonesia) obtained from Ciliwung Cisadane River Basin Authority-Ministry of Public Works (BBWSCC) and Cileungsi-Cikeas River Care Community (KP2C). We selected 6 stations from upstream to downstream area which have the relatively complete data, i.e., Cibinong (6°28′49.98″ S/106°52′3.36″ E), Cileungsi (6°27′12.348″ S/106°55′26.76″ E), Cikeas (6°22′20.964″ S/106°56′21.84″ E), P2C Nusa Indah/P2C (6°18′15.84″ S/106°58′17.04″ E), Pondok Gede Permai/PGP (6°18′11.16″ S/106°58′26.796″ E), and Pondok Mitra Lestari/PML (6°17′5.1″ S/106°58′29.856″ E). Based on data from BBWSCC, there were 2 monitoring stations available in 2016, 3 stations in 2020, and 4 stations in 2022. In parallel, data from KP2C shows 3 monitoring stations in both 2020 and 2025, and 2 stations in 2022. Data availability of AWLR is shown in Table 3.

2.2.5. Sentinel-1 Inundation

Inundation area identification was carried out by utilizing Sentinel-1 radar imagery processed on the Google Earth Engine (GEE) platform. The Sentinel-1 data employed were acquired using the Interferometric Wide Swath (IW) mode, which provides a swath width of approximately 250 km through the Terrain Observation with Progressive Scanning SAR (TOPSAR) technique to maintain interferometric alignment [61]. This study applied dual-polarization data, namely VV (vertical transmit—vertical receive) and VH (vertical transmit—horizontal receive), which were processed using a median filtering method to reduce noise and smooth the imagery. The analysis also separated the data based on ascending (South to North) and descending (North to South) orbits to obtain a comprehensive depiction of the inundation area.
A specific backscatter threshold was applied to distinguish between permanent water bodies and flood-induced inundation. The backscatter threshold for permanent water was set below −17 dB, while for flood inundation, the VV polarization threshold was <−15.94 dB, and the VH polarization threshold prior to flooding was <−24.06 dB. Additionally, the VH/VV backscatter ratio was analyzed, where values below −28 dB indicated inundated areas [62]. This thresholding approach aligns with common practices in Sentinel-1 flood mapping, which exploits the characteristic low radar reflectance of water surfaces [63]. The Sentinel-1 data acquisition dates can be shown in Table A1.

2.3. Methods

This research was conducted in four main stages: (1) input data preparation, (2) simulating inundation with the RRI model, (3) analyzing the effects of rainfall and LC on inundation, and (4) assessment of the relationship between inundation results and observations. The workflow of the research is illustrated in Figure 2.
The research flow consists of a data collection stage that includes rainfall, LC, DEM, WL, and flood locations. Rainfall and DEM data underwent a cropping process, while the LC data were classified to produce a more detailed land cover map. All data is then further processed through Geographic Information System (GIS) analysis and incorporated into modeling using the RRI Model. The modeling process produces flood inundation maps, which are subsequently validated using ground observation data, namely river water level data and actual flood locations, which are also described by using Sentinel-1 data.

2.3.1. Inundation Model

In this study, we applied the RRI model to the Bekasi River Basin to simulate major flood events during 4 periods. The RRI model is a two-dimensional model capable of simulating hydrological processes over a river basin and developed to run simultaneously [31,39,64]. This model has been utilized to simulate flooding resulting from short-duration rainfall events or flash-flood events [30,31,43,55,59,65,66].
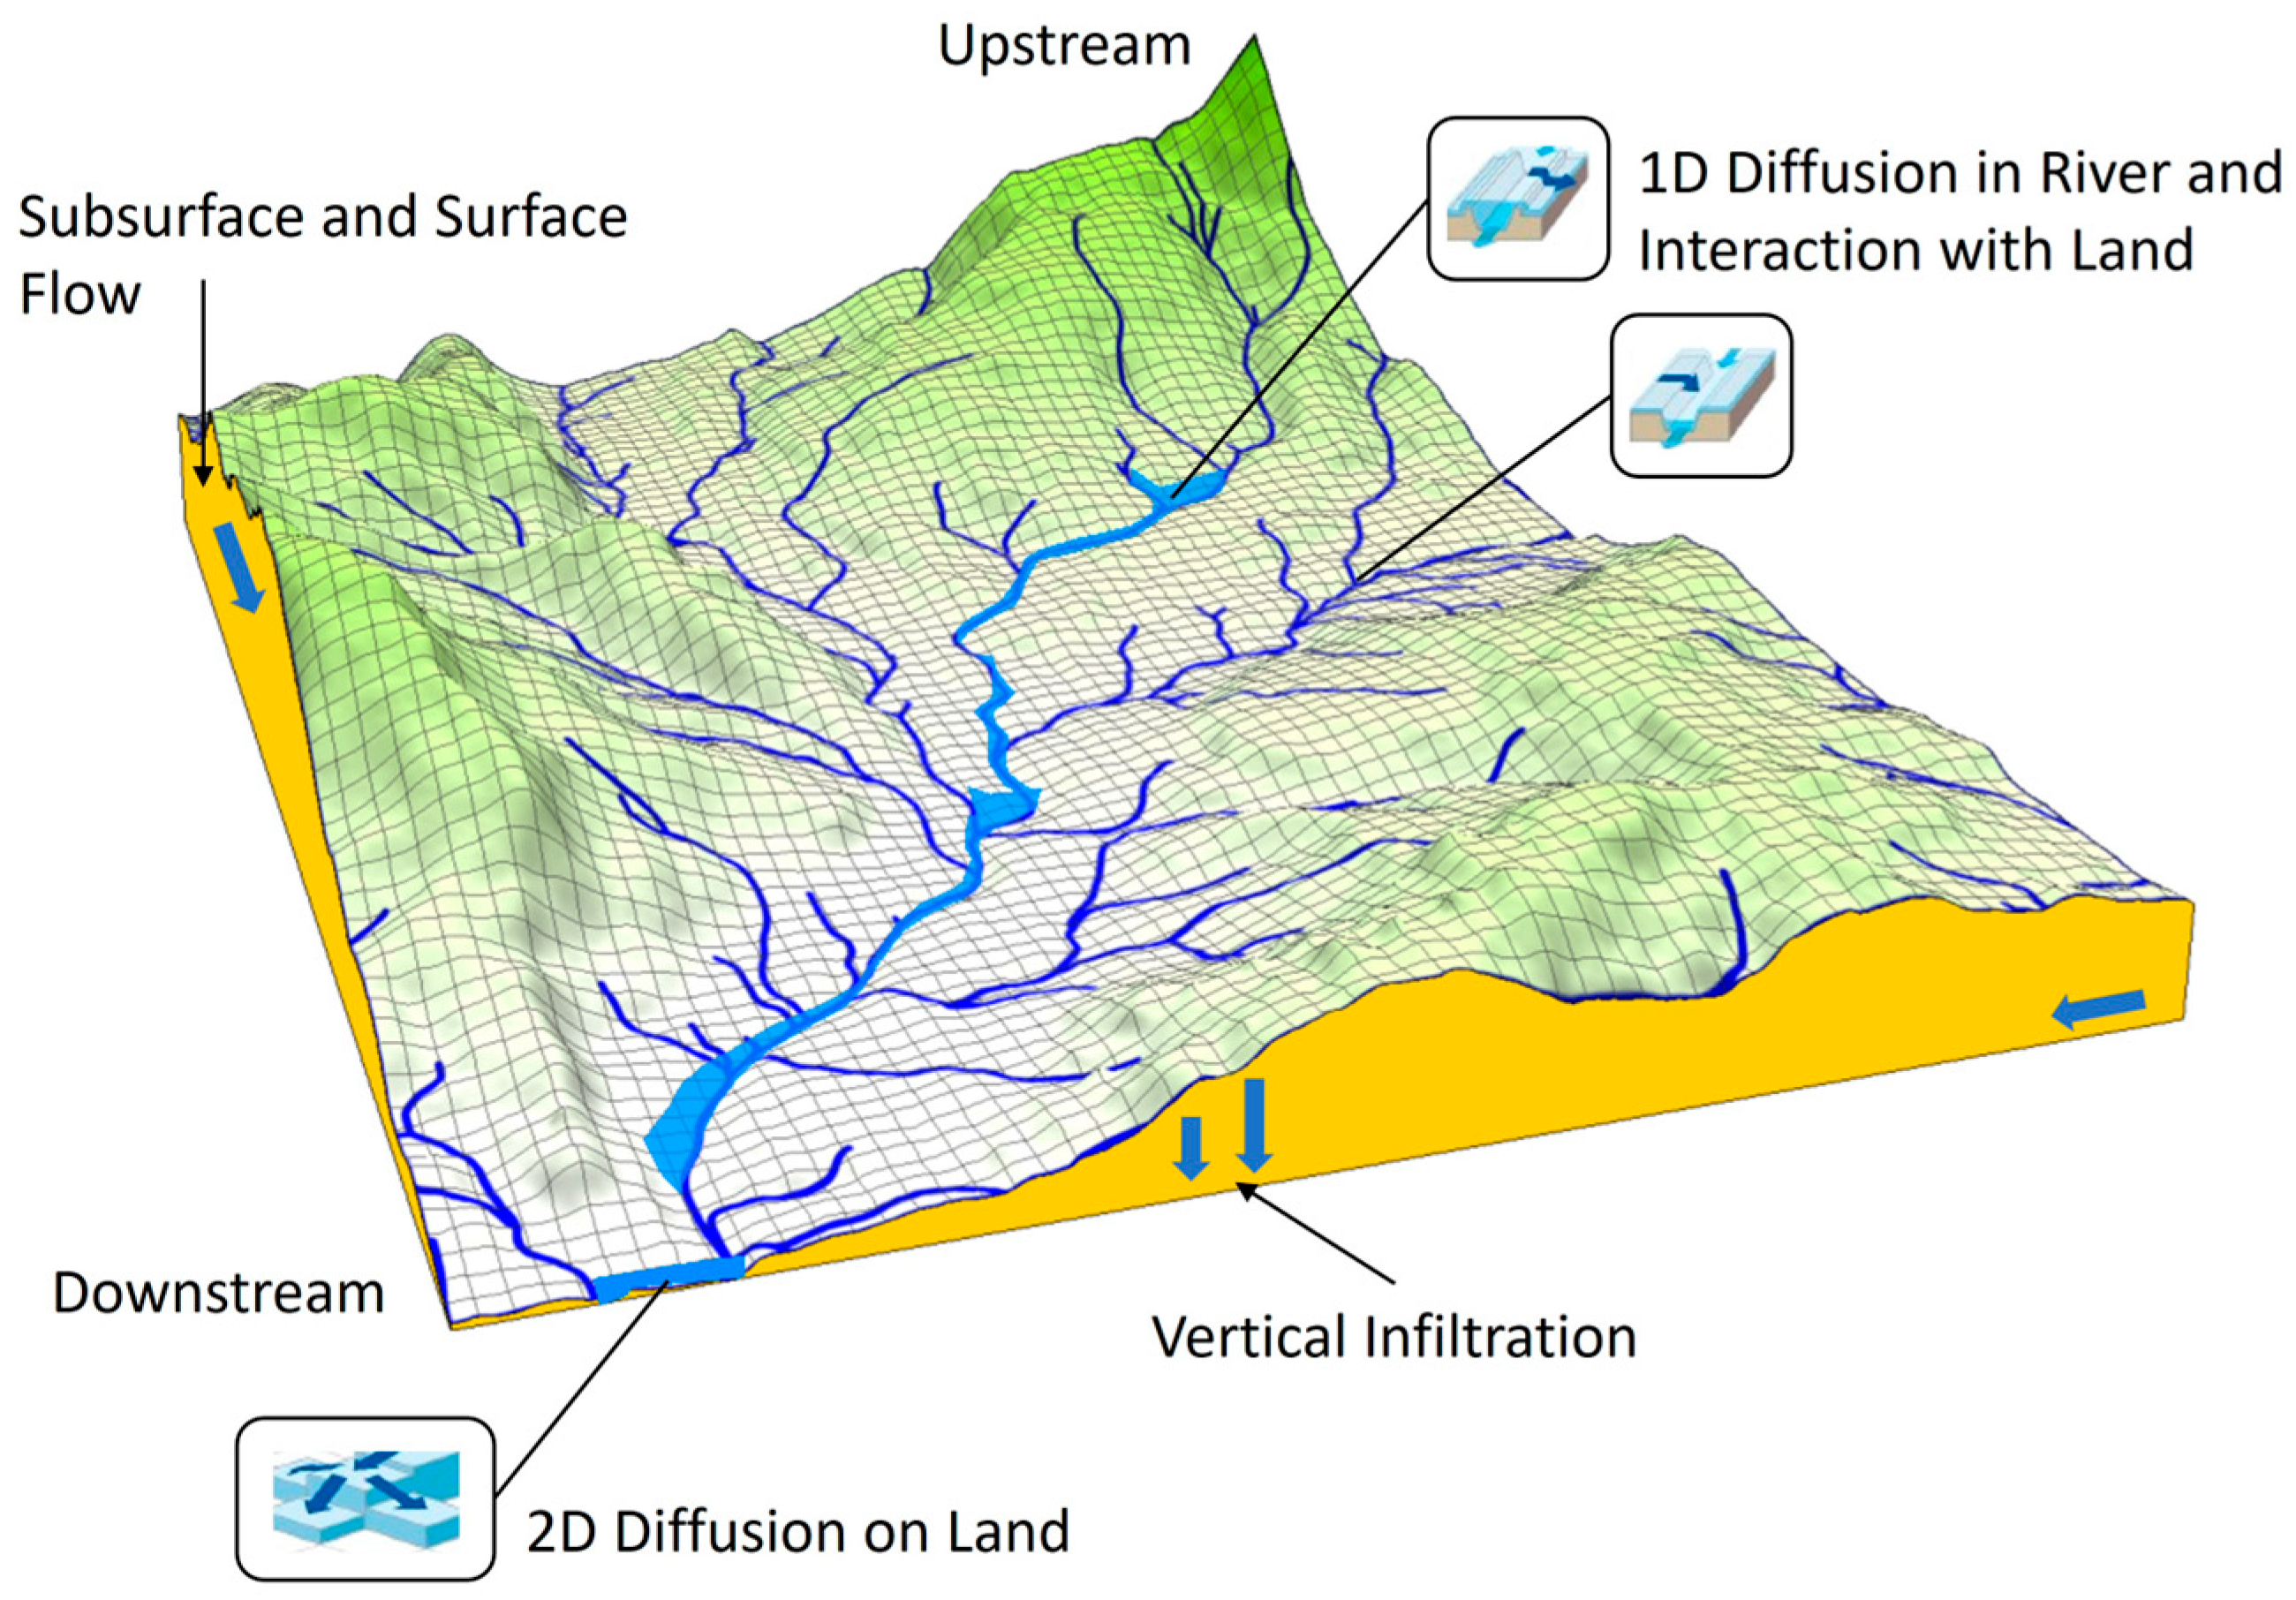
The RRI model processes river channels and topographic slopes individually. The model assumes the location of the river channel, slope, and river is located within the same grid cell. Runoff on the slope areas is computed using a 2D diffusive wave approach, while the flow in the river channel is modeled using a 1D diffusive wave method [39,64,67]. Illustrative diagram of the RRI model shown in Figure 3.
The RRI model simulates three flow scenarios for each basin mesh, determined by soil and land use characteristics. The hydrologic model components considered are surface flow only, vertical infiltration using the Green–Ampt Model plus surface flow excess infiltration, and subsurface saturated plus surface flow excess saturation [67]. While the Green–Ampt model simplifies the infiltration process by assuming that water penetrates the soil through a distinct wetting front, where soil moisture abruptly shifts from its initial condition to full saturation. The parameters for the infiltration process include Manning’s roughness, soil depth, soil porosity, saturated hydraulic conductivity, and suction. The infiltration parameters in this model are based on [67], and Manning’s roughness coefficient refers to [68]. The geometry of the mesh is considered to be rectangular. In terms of the upstream contribution area in km2, the following two equations were used to calculate the river width and depth [39,64,67]:
W = C w A S W
D = C D A S D
where the variables D, W, A, CD, SD, CW, and SW represent depth (in meters), width (in meters), area (in square kilometers), depth parameter, and width parameter of the river and its network.
The input parameters for the RRI model include (1) rainfall (GSMaP), (2) elevation, flow direction, flow accumulation (HydroSHEDS), (3) LC (MoEF), and (4) location of river water monitoring stations (BBWSCC and KP2C).

2.3.2. Statistical Method

Root Mean Square Error (RMSE) is a measure of the absolute error between the observed value and the simulated value. The RMSE index value ranges from 0 to +∞, with smaller values indicating better simulation results. Meanwhile, the Coefficient of Determination (R2) is an indicator that can be used to evaluate model accuracy and show the fit between observed values and predicted values [69].
RMSE and R2 can be used to evaluate the performance of regression models. The criteria that can be used to obtain a good regression model are low RMSE and high R2 values [70]. The mathematical expressions can be seen in Equations (3) and (4) [70,71].
R M S E = 1 n i = 1 n ( y ^ i y i ) 2
R 2 = 1 i n y i y ^ i 2 i n y i y ¯ 2
where yi is the label of the i-th sample, y ^ i is the predicted value of the i-th sample, and the horizontal line is the average value. RMSE is the standard deviation of the difference between the predicted value and the observed value in the sample. Meanwhile, R2 has a value proportional to the dependent variable that can be predicted from the independent variable [70].
The data used in the equation consists of observed water levels from river monitoring stations and simulated water levels from the RRI model. The R2 and RMSE values are calculated for each station each year. Additionally, overall R2 and RMSE values are computed for all stations combined within the same year.
The Pearson correlation coefficient is a linear correlation coefficient used to describe the linear correlation between two normal continuous variables, which are rainfall amount and observed WL. For example, let X and Y be two samples, where sample X contains n sample observations (×1, ×2, ×3, …, ×n) and sample Y contains n sample observations (y1, y2, y3, …, yn). Then the Pearson correlation coefficient is defined as follows [72]:
r = ( N x i y i x i y i ) N x i 2 ( x i ) 2 N y i 2 ( y i ) 2
the value of r is in the interval [−1, 1]. The greater the value is, the higher X, Y, linear correlation rate will be.
when r = 1, X and Y are completely positive correlation (observed rainfall before WL).
when r = −1, X and Y are completely negative correlation (observed rainfall after WL).
when r = 0, the linear correlation between X and Y is not obvious.

3. Results

3.1. Rainfall Conditions

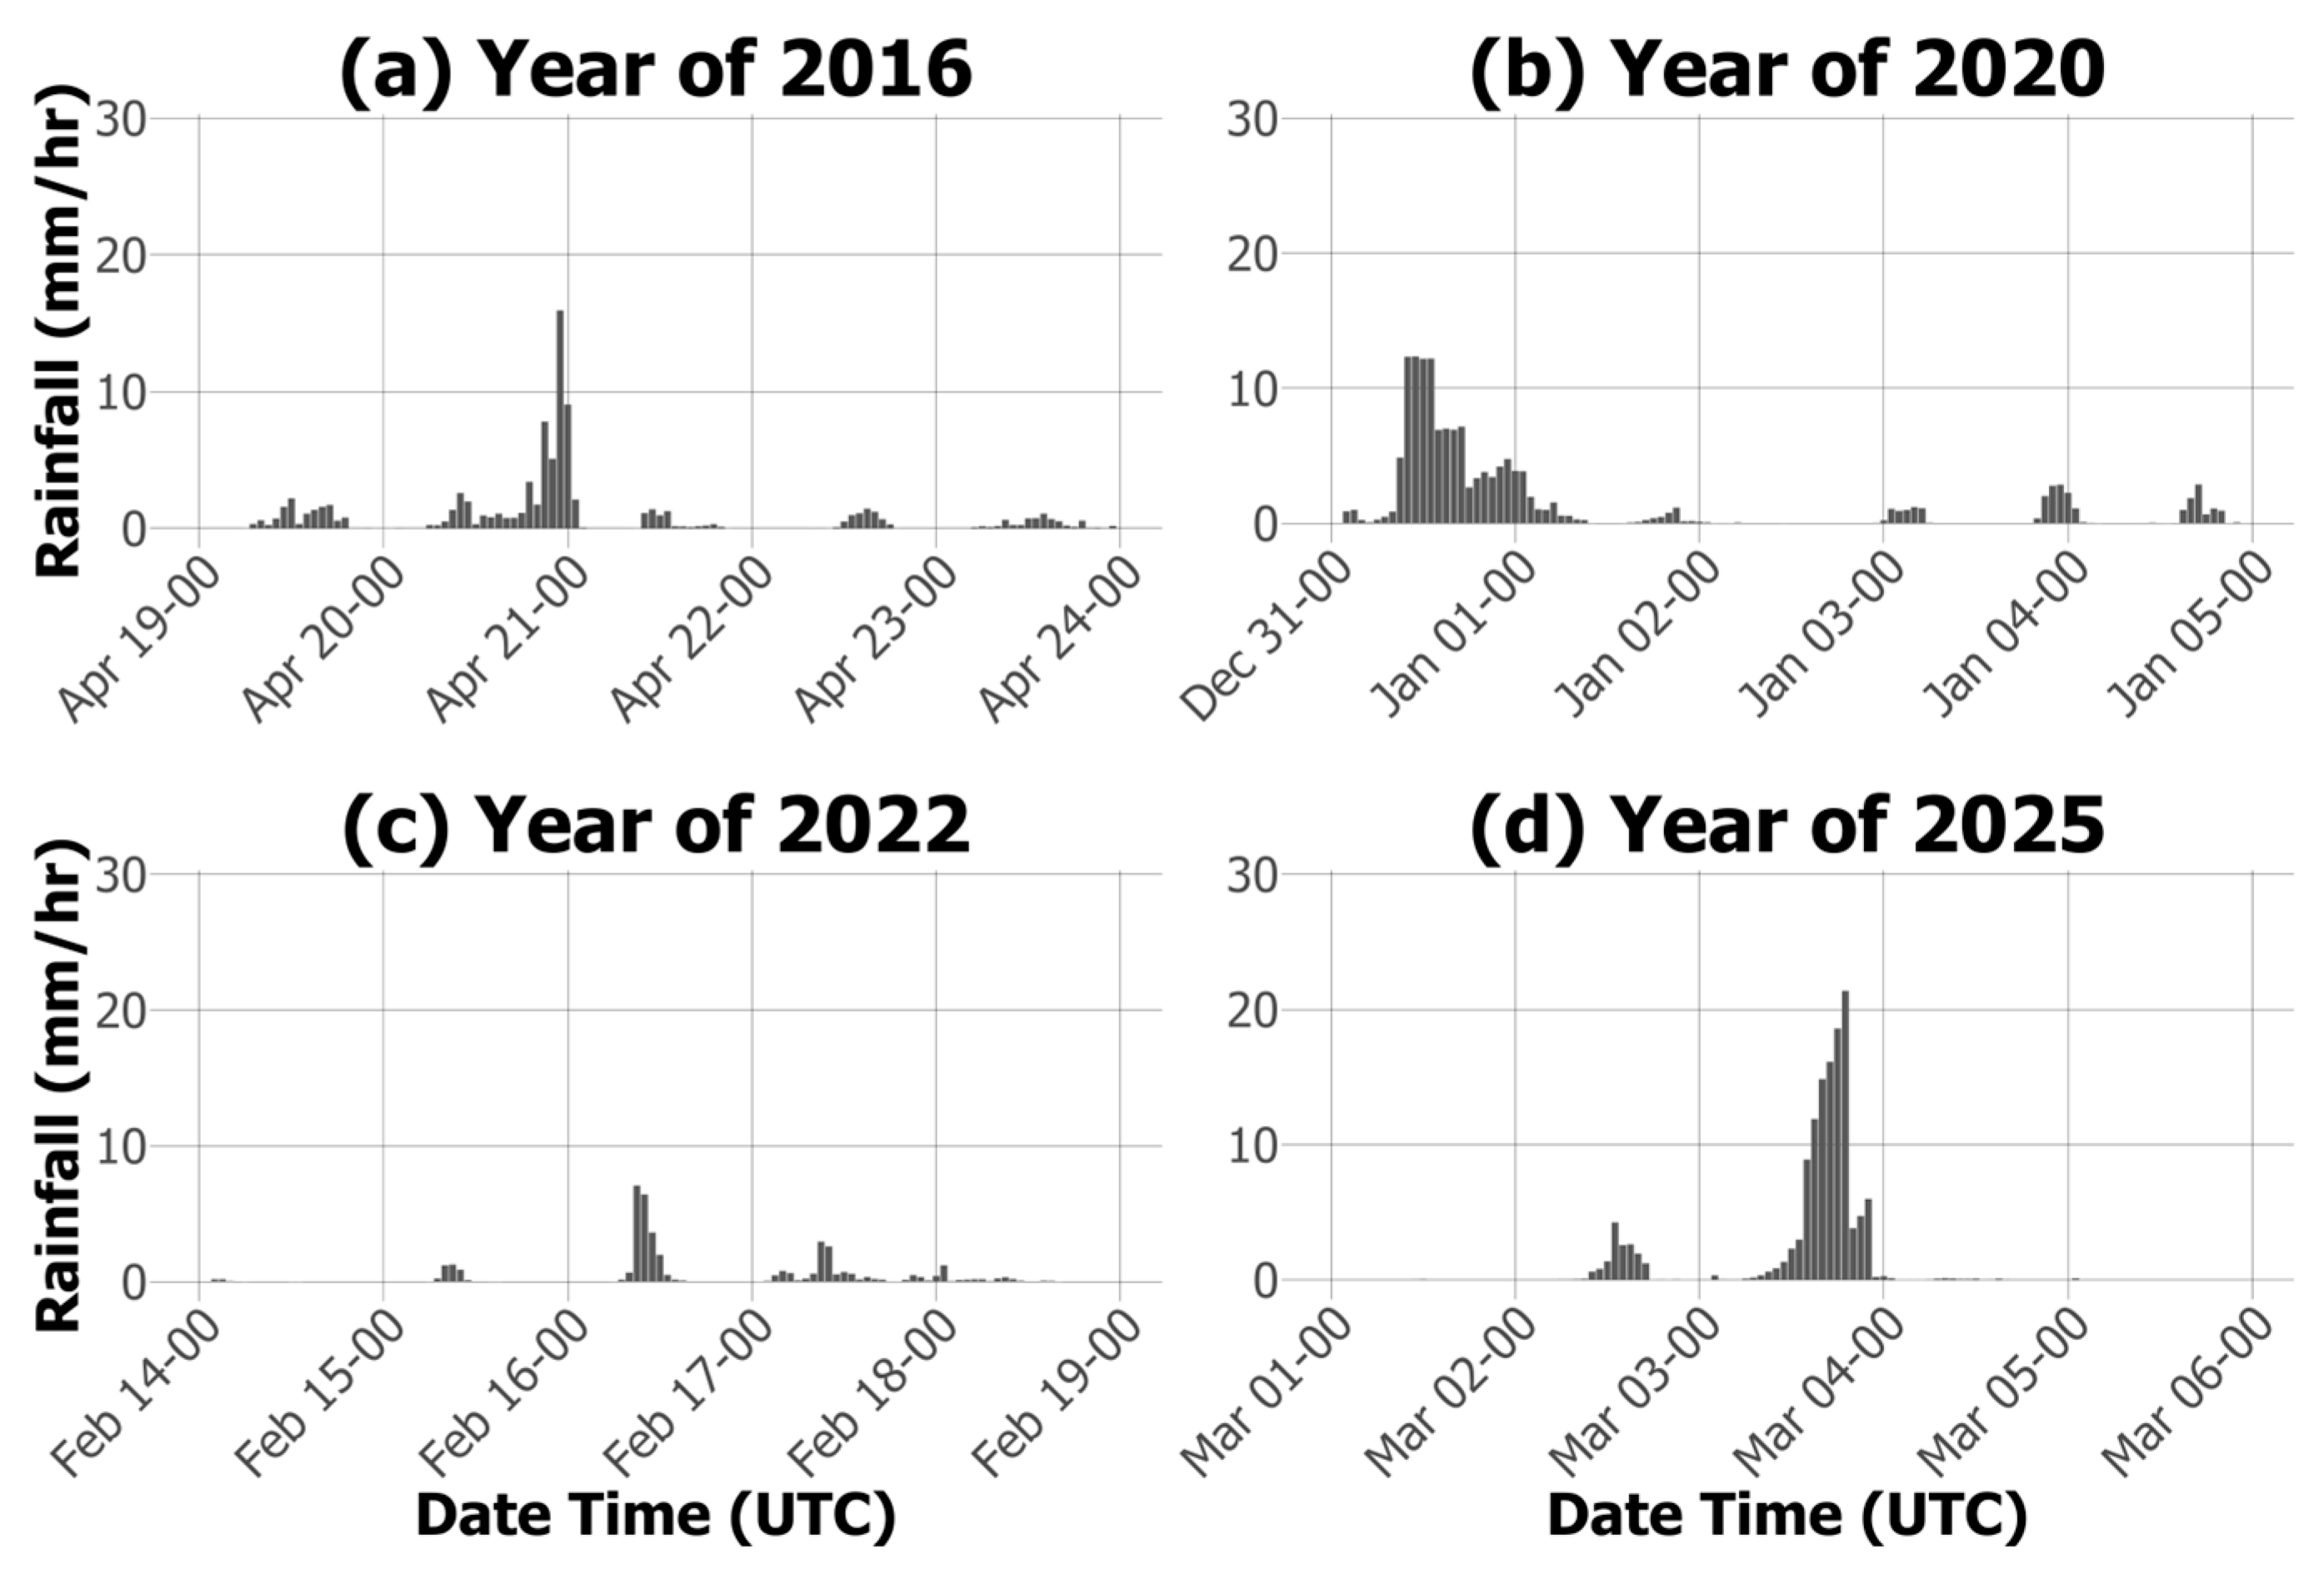
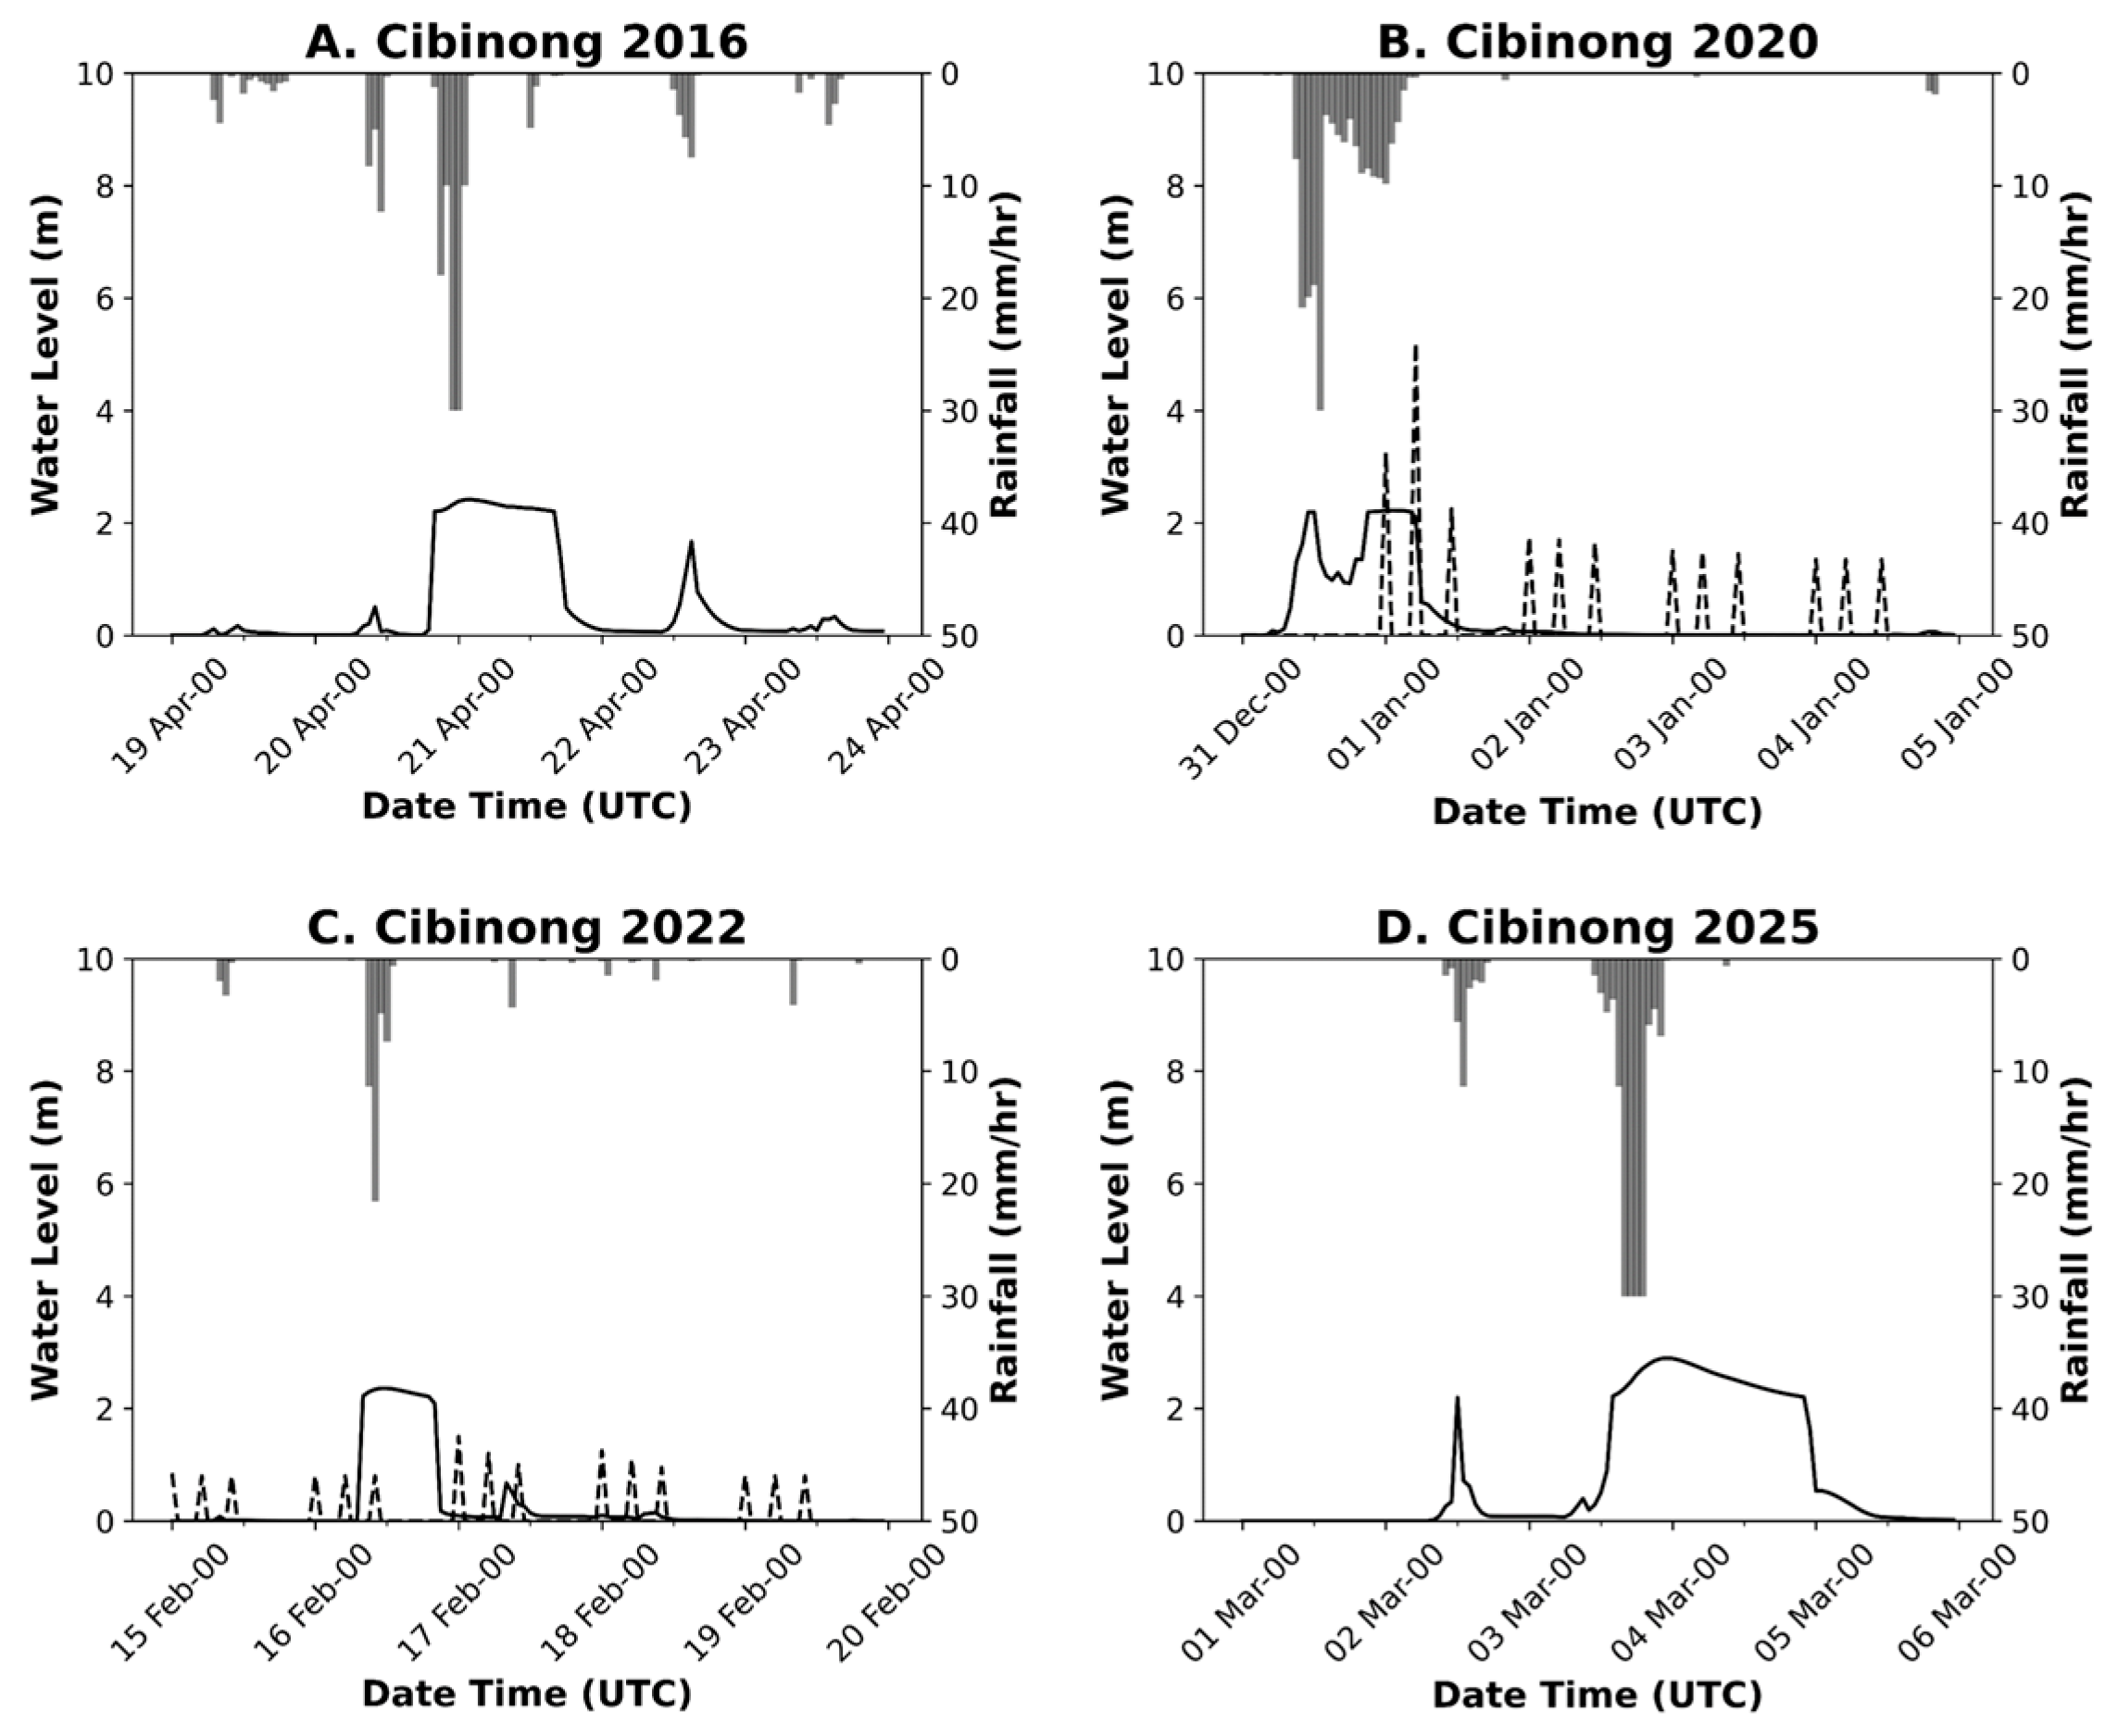
During four major flood events over Bekasi River Basin, the conditions of rainfall in 2016 and 2020 are classified as heavy rainfall with peak intensities of 15.94 mm/hr (2016) and 12.36 mm/hr (2020). Meanwhile, 2022 has had moderate rainfall with a maximum value of 7.08 mm/hr. In 2025, very heavy rainfall occurred and reached the highest intensity of 21.37 mm/hr. The graph of rainfall intensities during the four periods is shown in Figure 4.
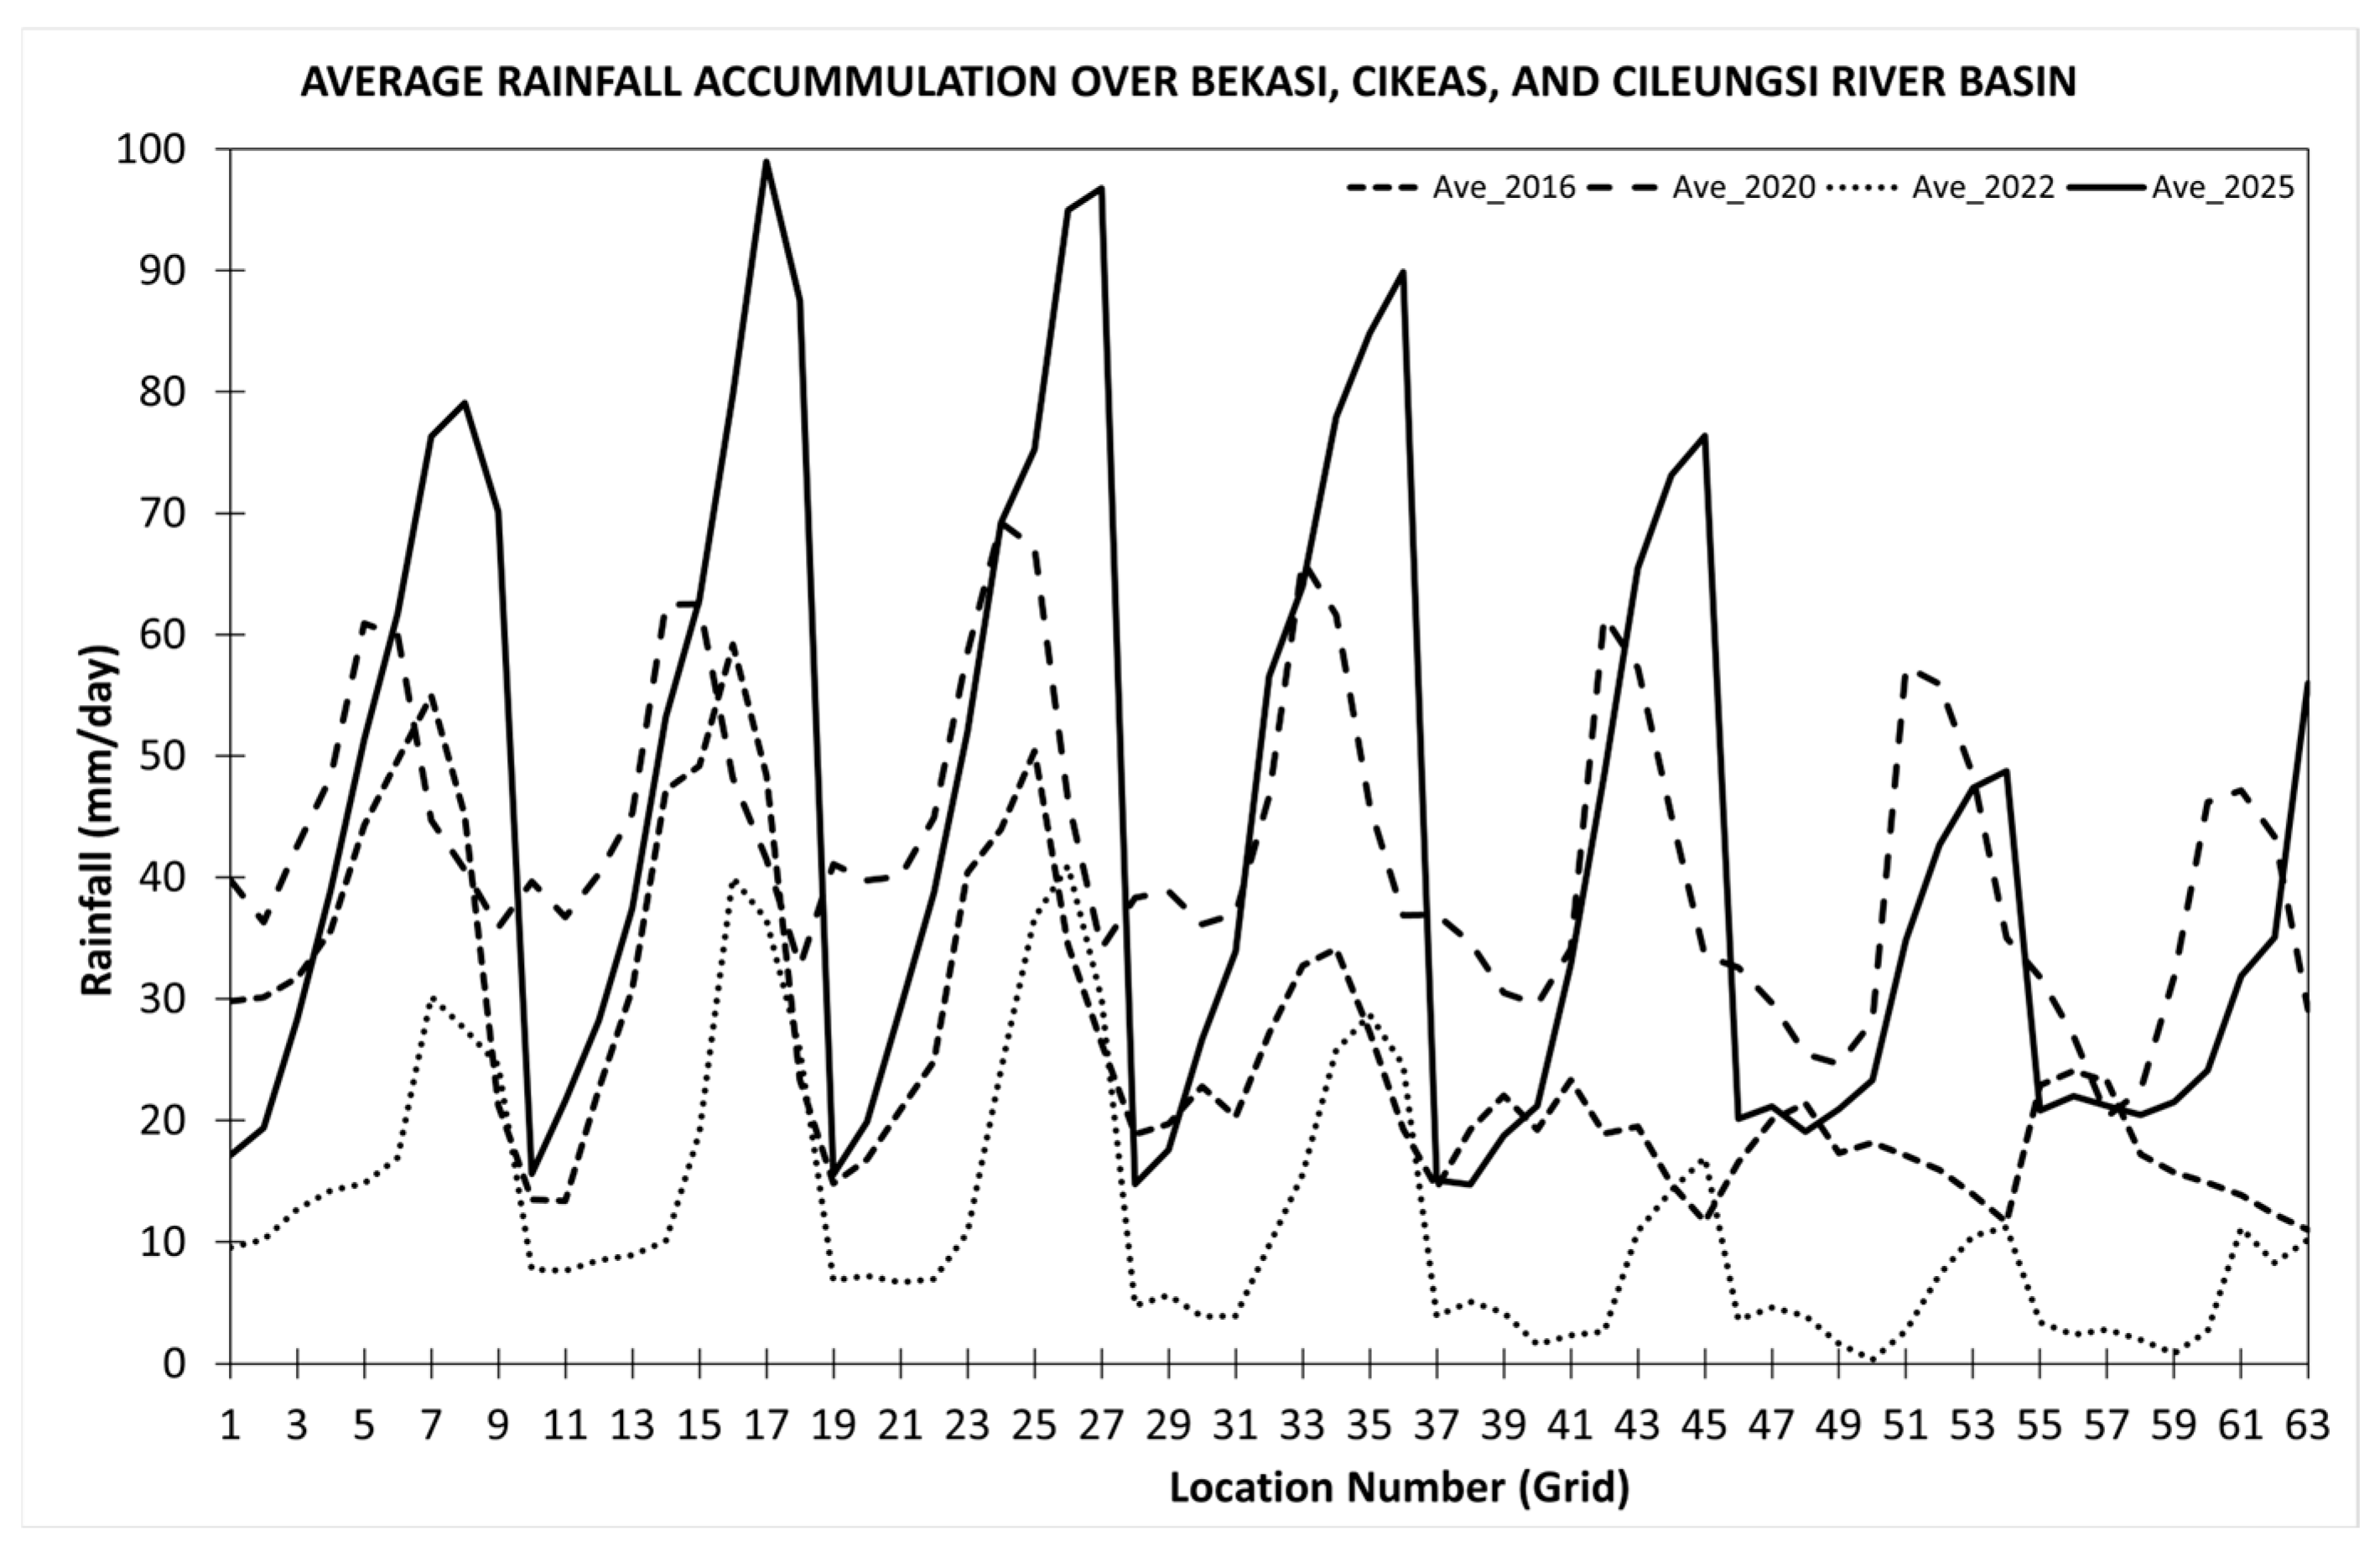
The daily rainfall trend during four flood events shows variation in spatial rainfall distribution. Figure 5 shows the sequence of location numbers based on GSMaP gridded data and the flood location of four major events. The maximum rainfall accumulation, described by “red box”, tends to occur in the mountainside of Bogor (the upstream area of Bekasi River Basin), while the major flooding locations are shown in “purple, brown, green, and dark-blue colored” in the middle and downstream area. Daily rainfall accumulation during four major flood events showed varying intensities. The 2016 flood recorded a maximum of 90.60 mm/day, categorized as heavy rainfall. In 2020, rainfall increased significantly to 188.51 mm/day, while in 2022 it reached 101.86 mm/day. The most extreme event occurred in 2025, with a peak daily accumulation of 236.44 mm. 2020 and 2025 are classified as very heavy or extreme rainfall, as shown in Figure A1.
For each gridded rainfall data, the 2016 flood had an average rainfall of 25.65 mm/grid, while the 2020 flood showed an increase of 42.33 mm/grid. In contrast, the average in 2022 decreased significantly to 12.22 mm/grid. However, in 2025, the average rainfall increases again to 44.18 mm/grid, indicating the most widespread rainfall among the four events (see Figure 6).
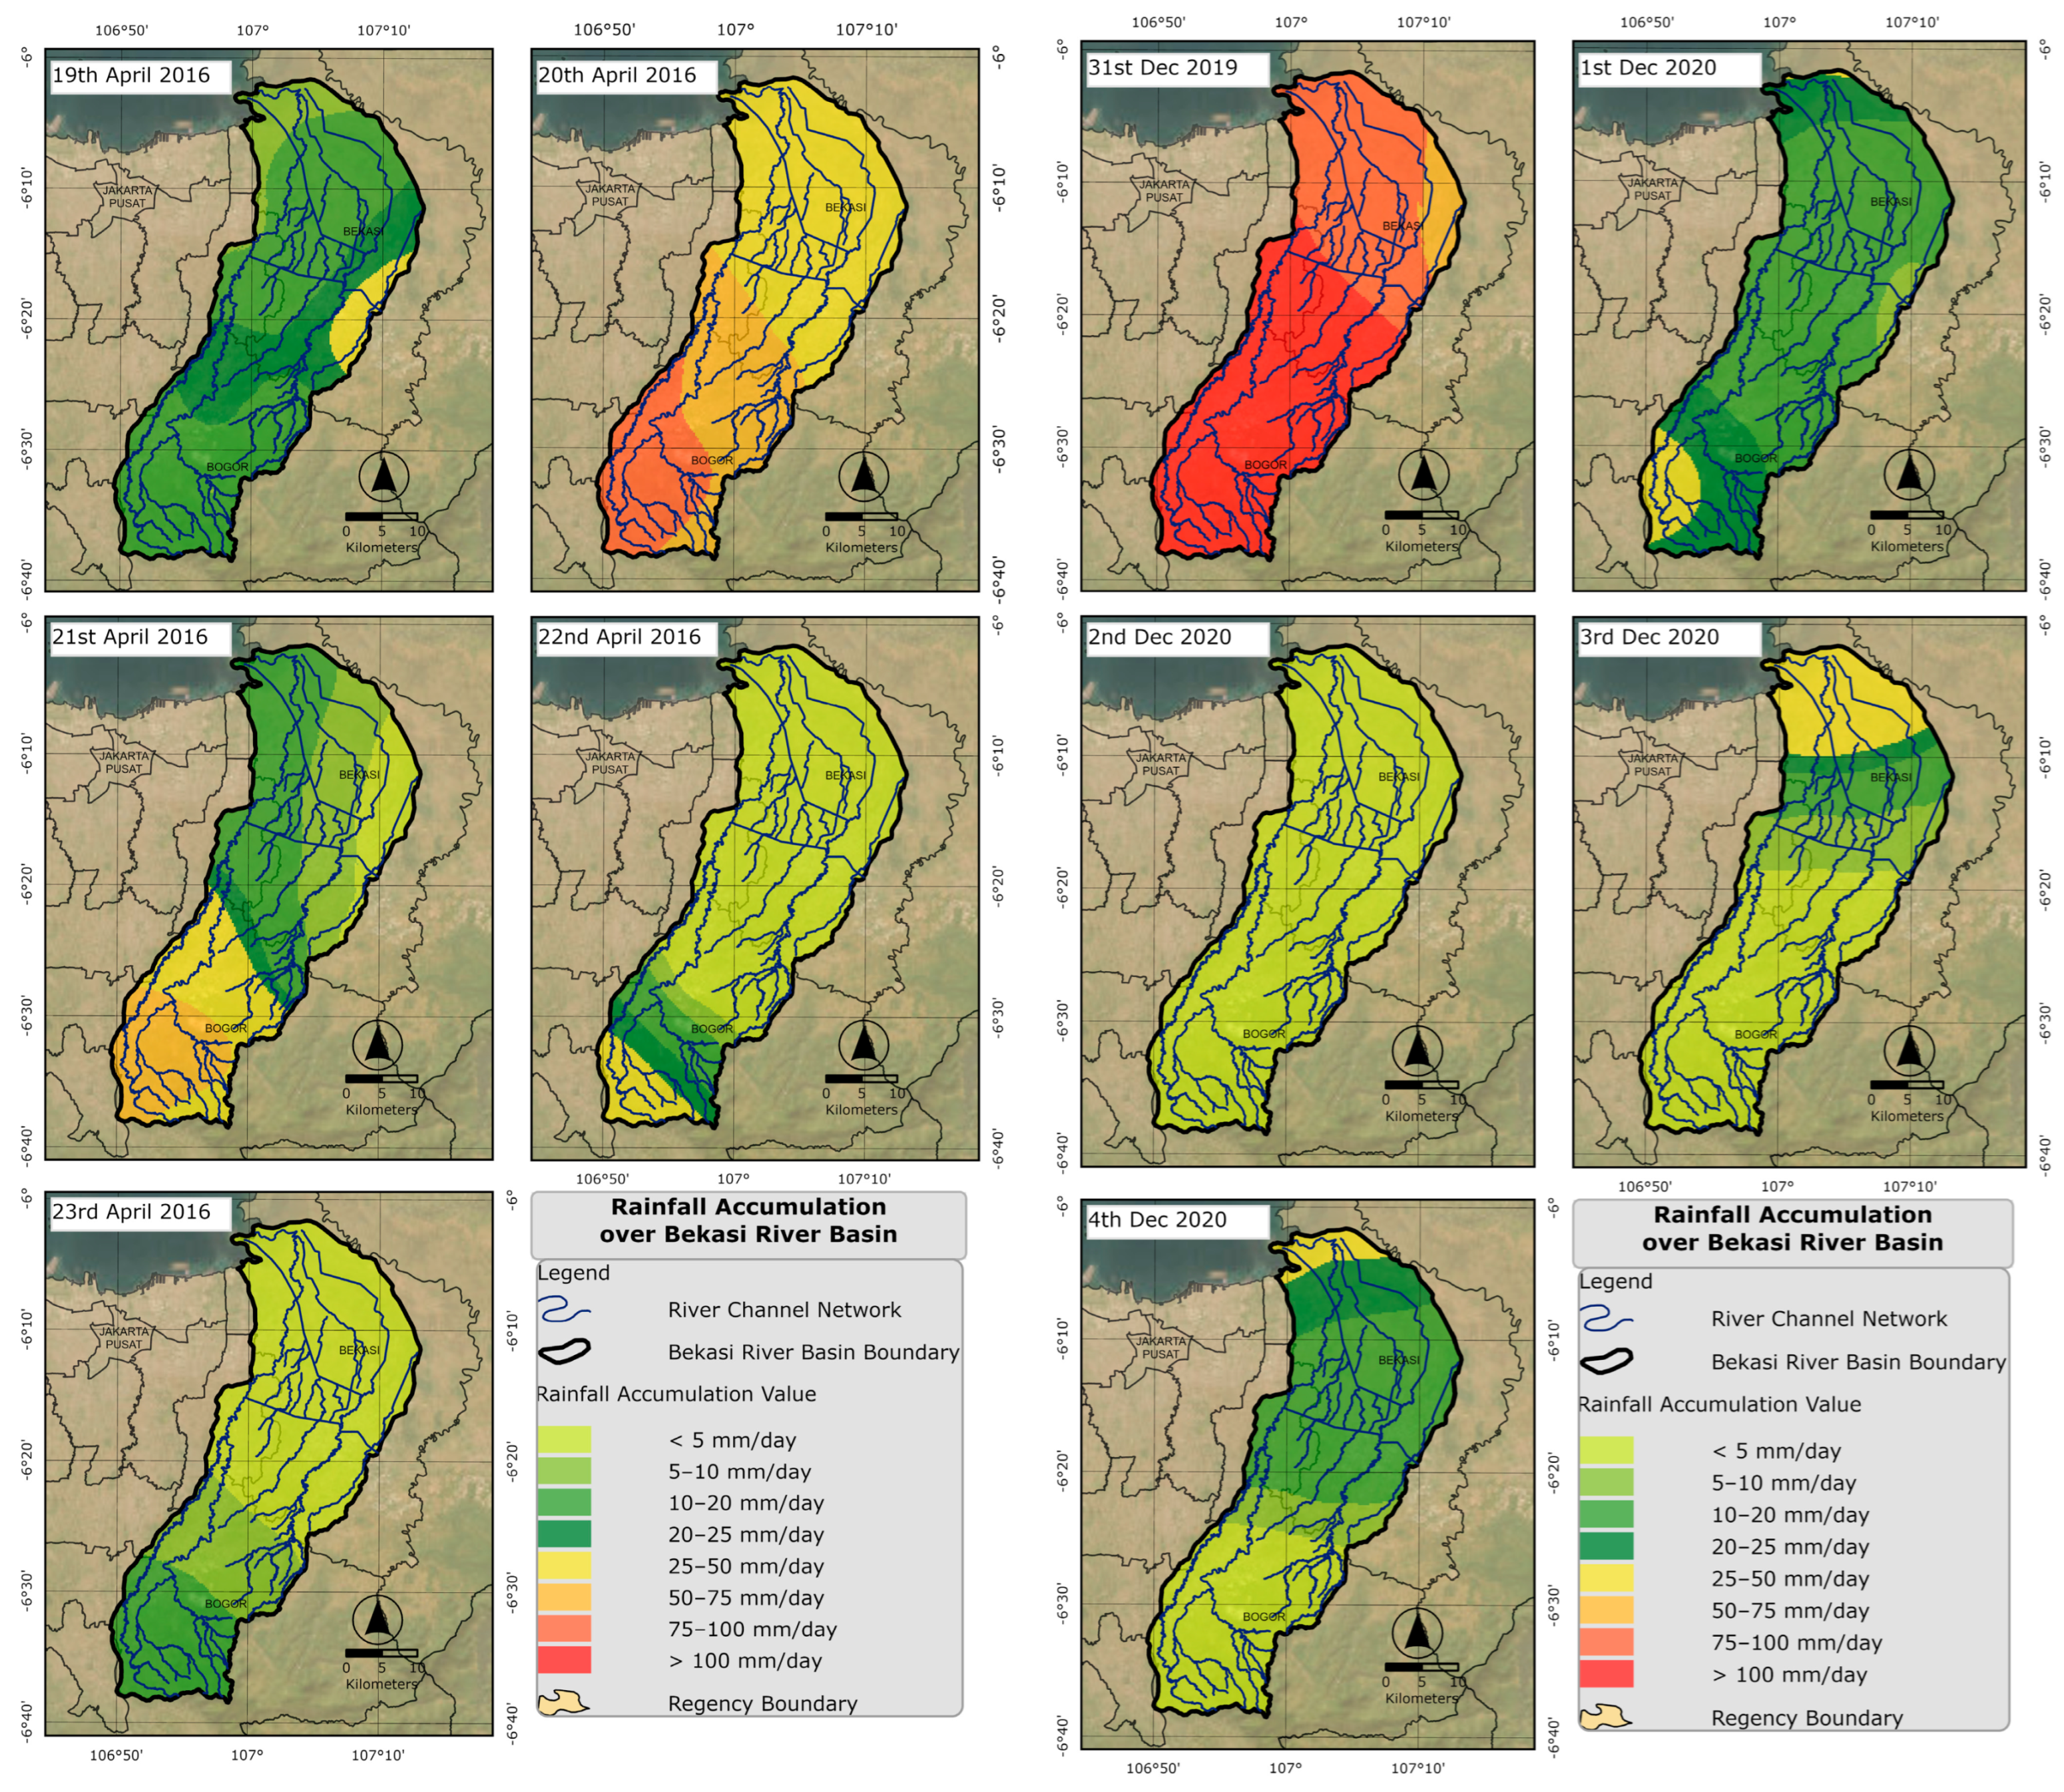
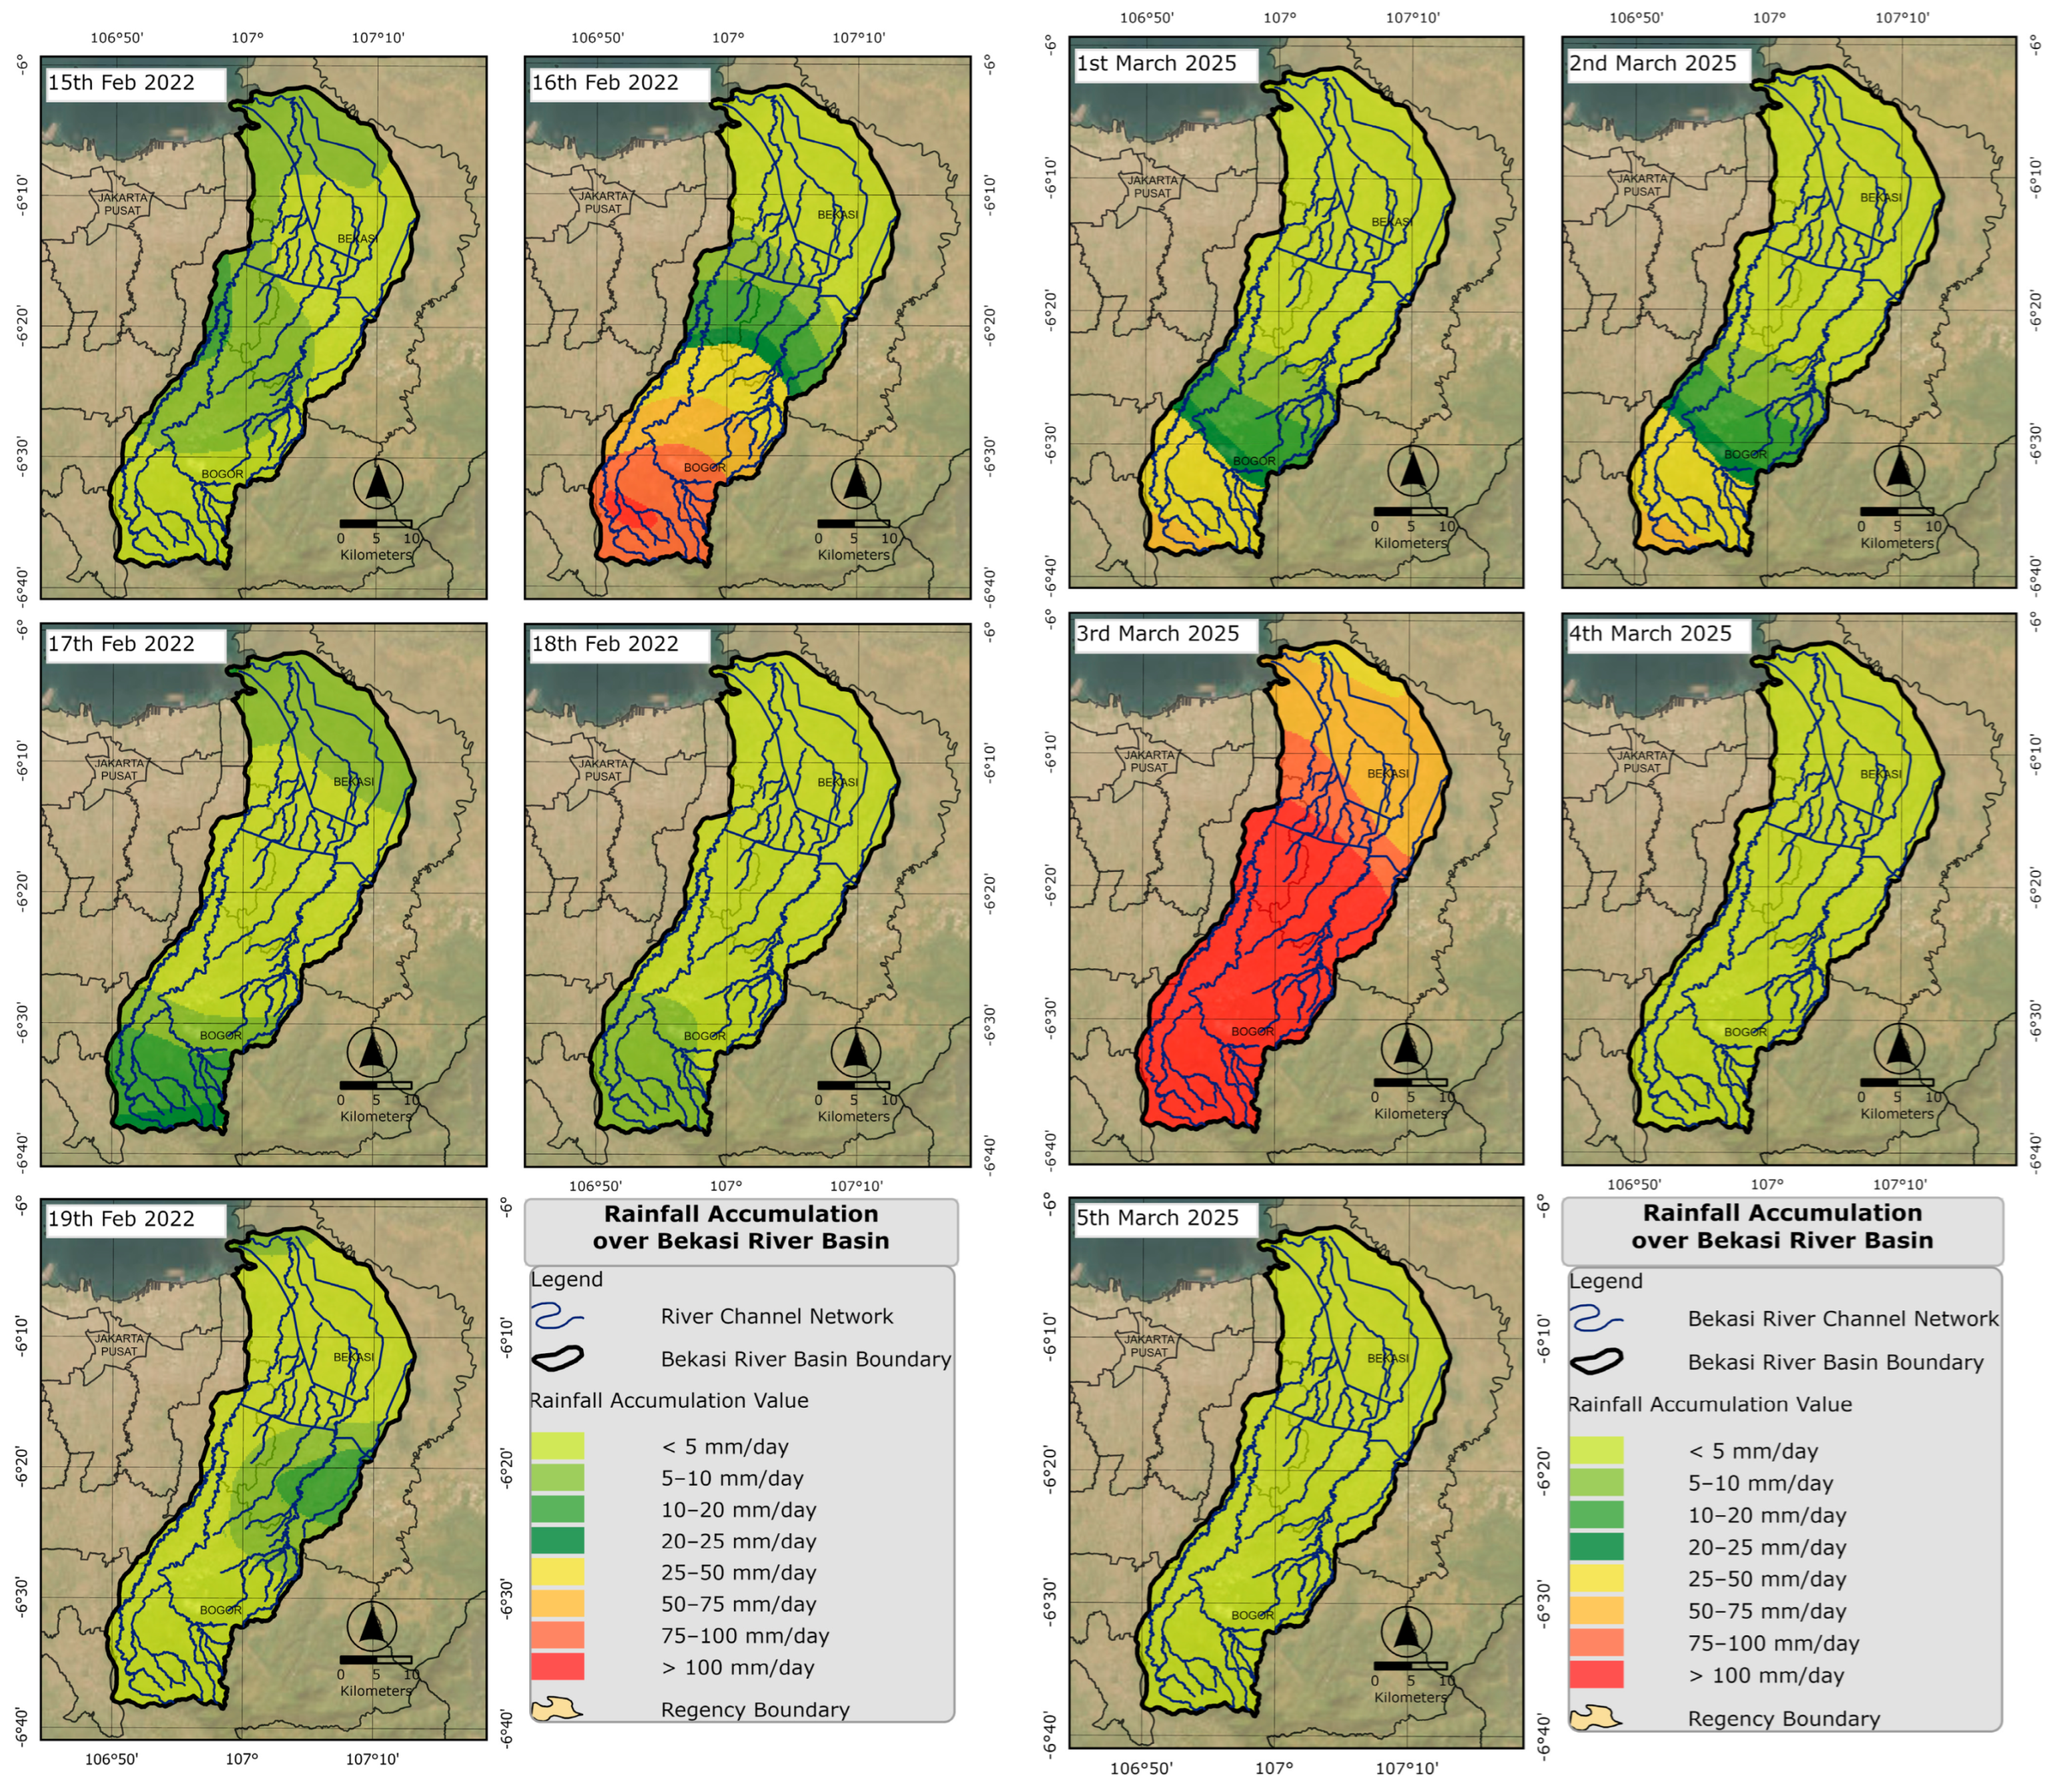
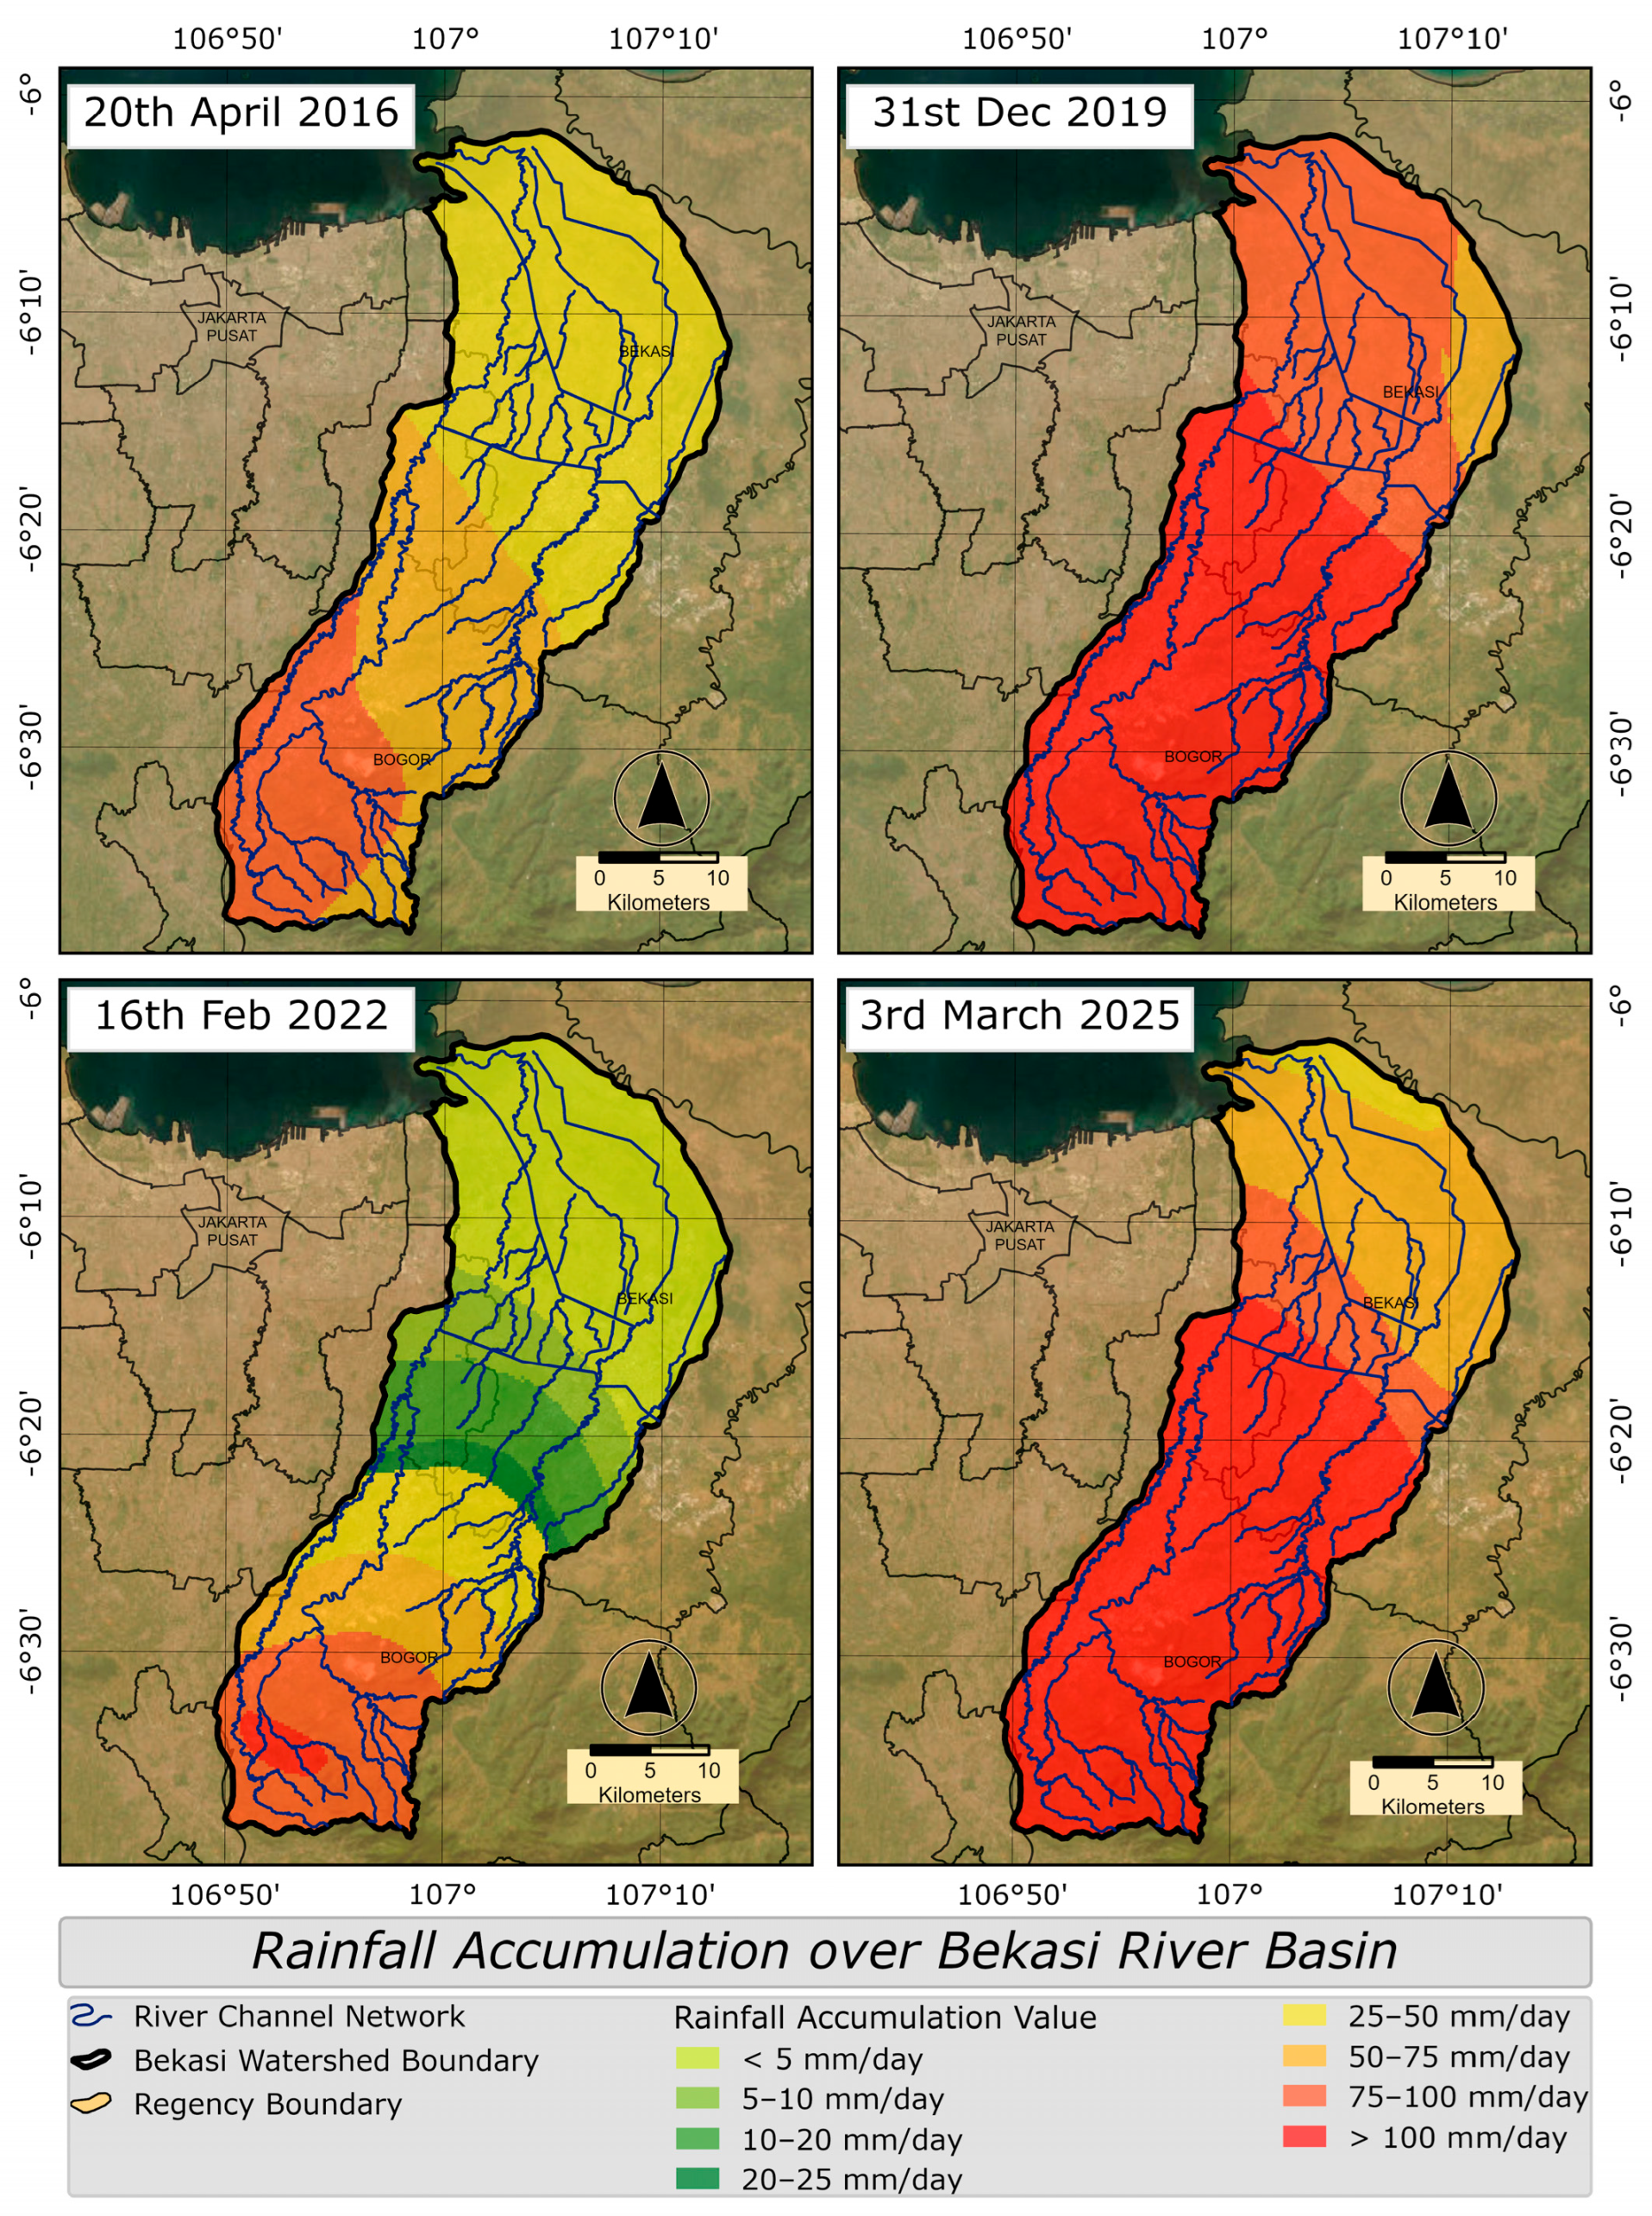
The accumulation of average rainfall shows that the regions located in the Southern part of Bekasi River Basin experience the highest amount in comparison to the Northern side. In 2025, the largest accumulation is found particularly for locations number 17 and 27, which align with the upstream area that generally receives the largest accumulation of more than 100 mm/day, as shown in Figure 7. On 31 December 2019 and 3 March 2025, the rainfall accumulated more than 100 mm/day covering almost all river basin areas from upstream to downstream during flood events. In contrast, on 20 April 2016 and 16 February 2022, the rainfall was concentrated mostly on the upstream area. Day by day, leading up to the flood events can be shown in Figure A2 and Figure A3. Figure A2 shows the daily developments leading to the flooding events in 2016 and 2020. Moderate to heavy rainfall occurred on 20 April 2016. Meanwhile, in the 2020 event, heavy to extreme rainfall occurred on 31 December 2019. Figure A3 shows the daily developments leading to the flooding events in 2022 and 2025. In 2022, a light to small location of heavy rainfall occurred on 16 February 2022. Meanwhile, in 2025, heavy to extreme rainfall occurred on 3 March 2025, in which daily rainfall was extremely high (>100 mm/day), occurring almost in all study locations.
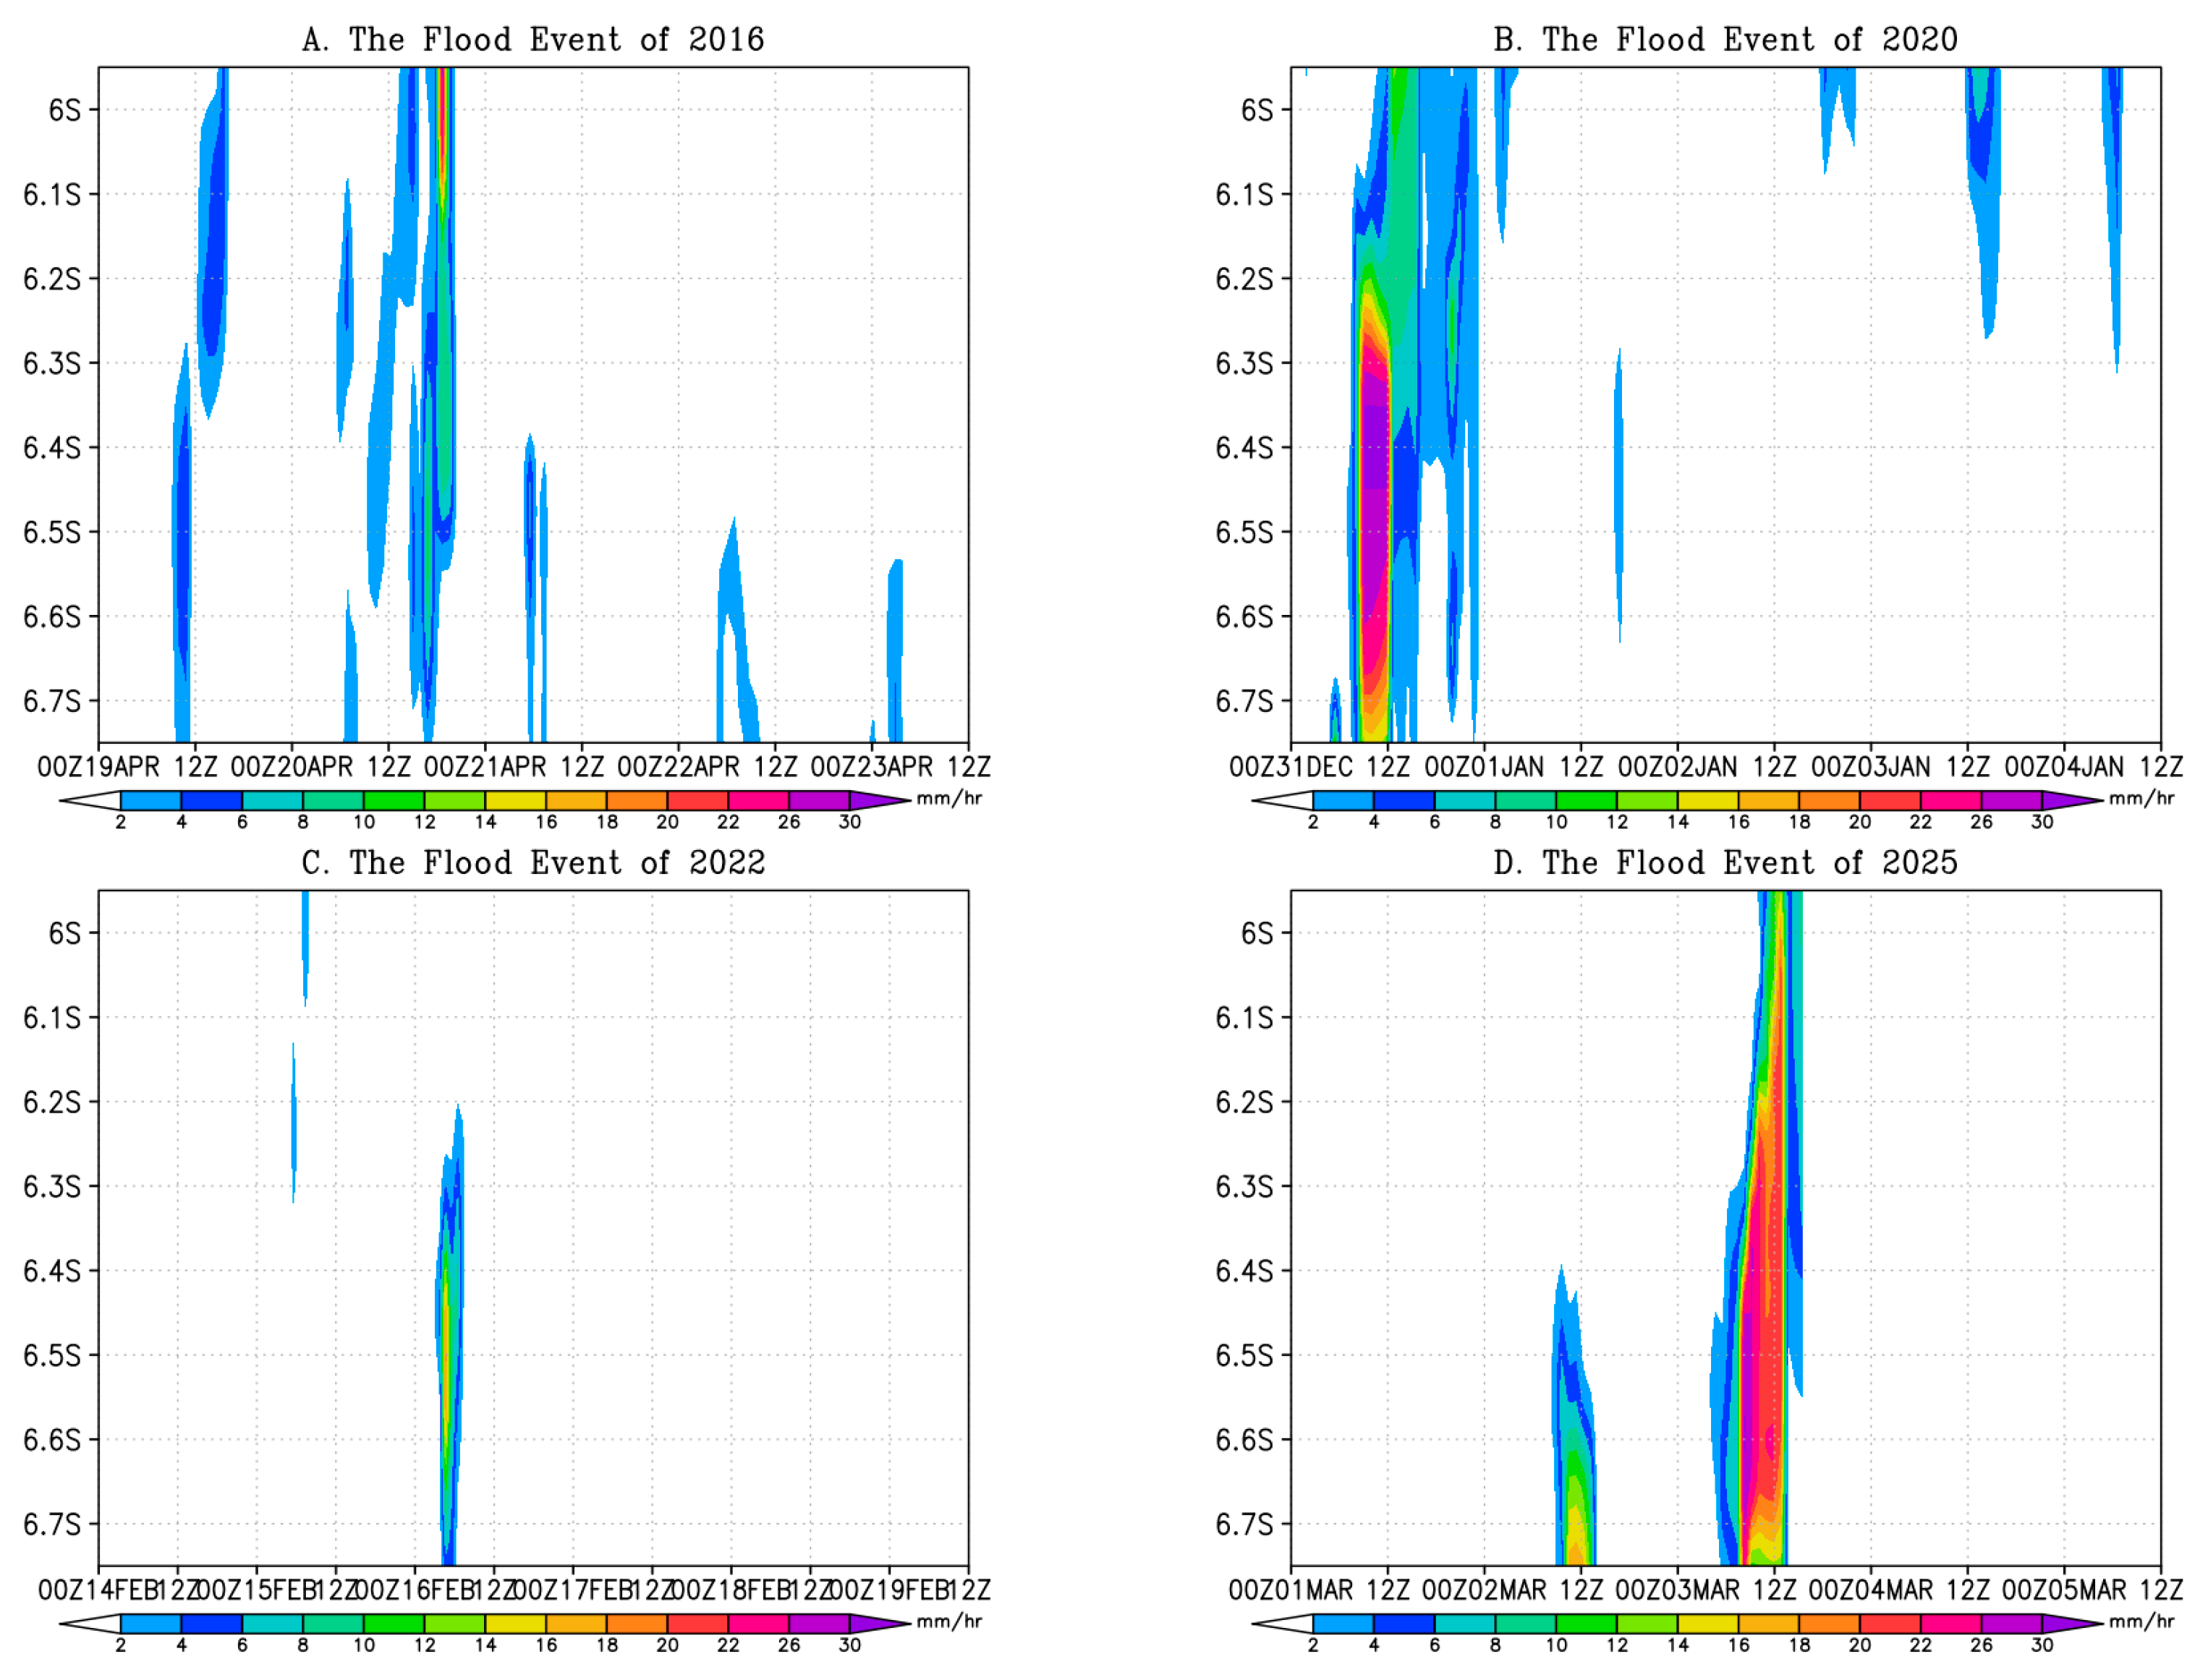
Figure 8 shows the rainfall propagation during four major flood events. Very heavy/extreme rainfall has been captured during 2020 and 2025, with the intensity more than 20 mm/hr concentrated over the upstream and middle area, then propagated to the downstream of Bekasi River Basin. That extreme rainfall occurred for more than 6 h. Compared to the rainfall in 2016 and 2022, more concentrated rainfall on the downstream area is mostly observed in the upstream area, with intensity 10–22 mm/hr for less than 3 h.

3.2. Model Validation

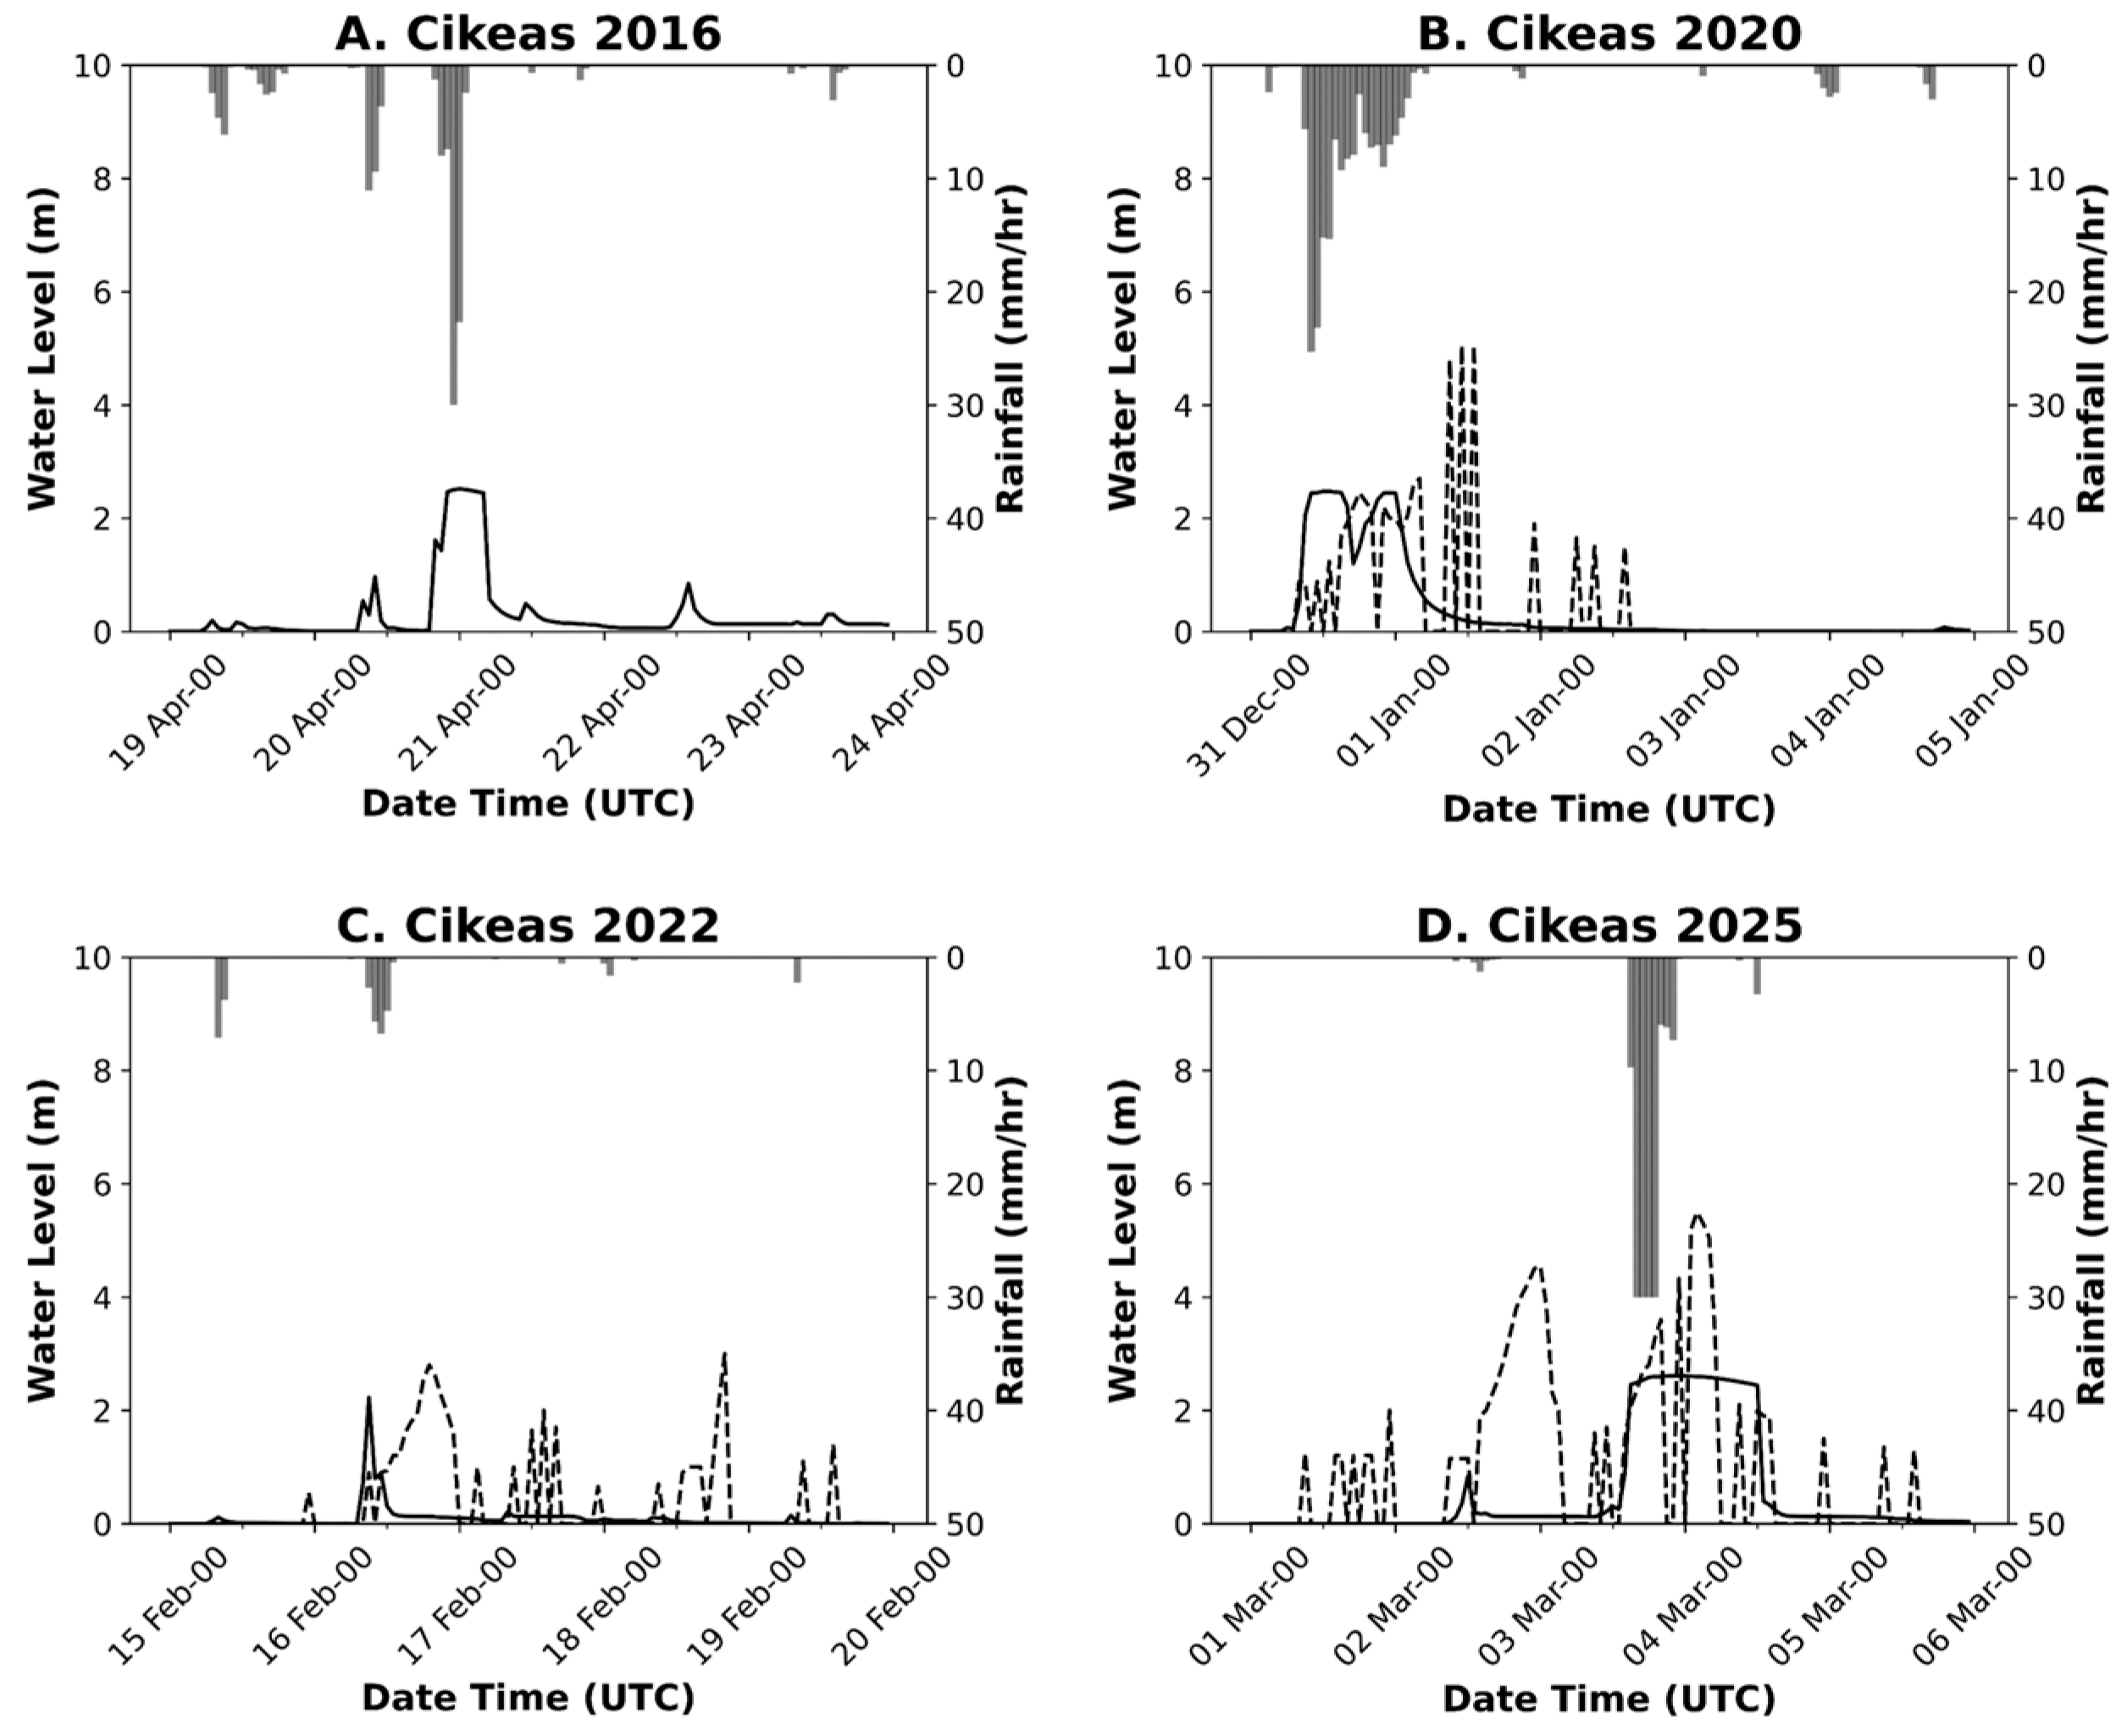
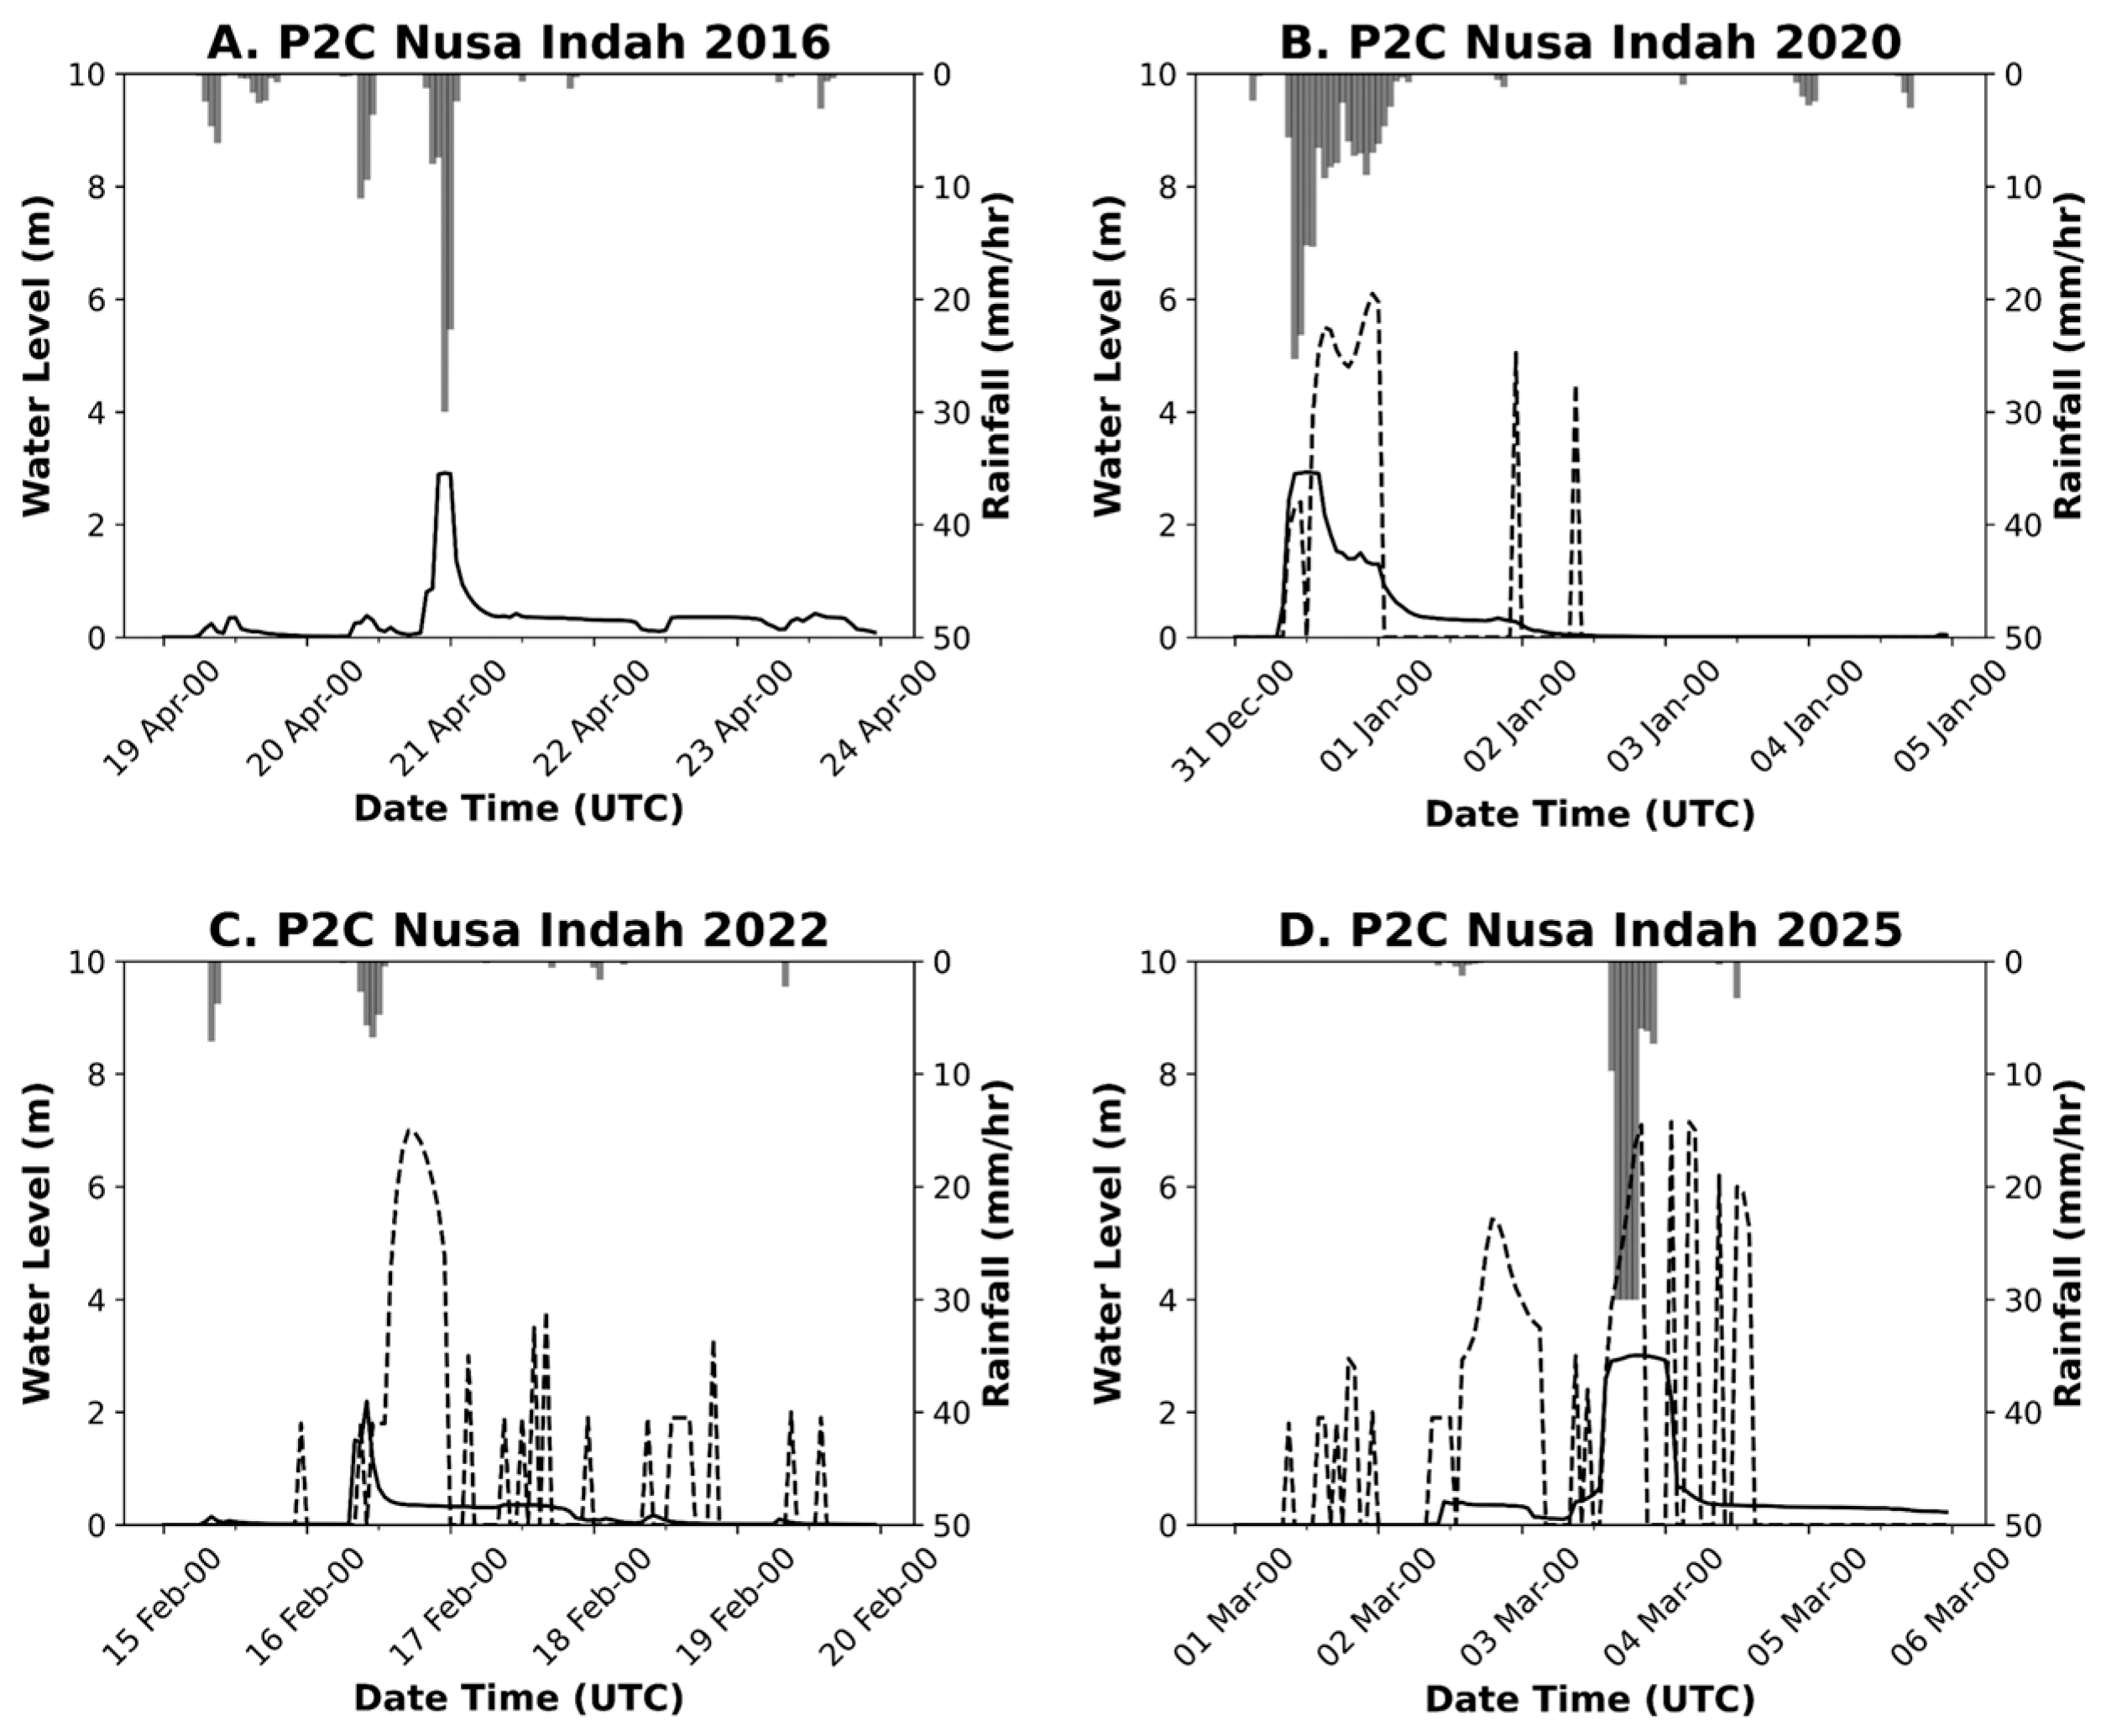
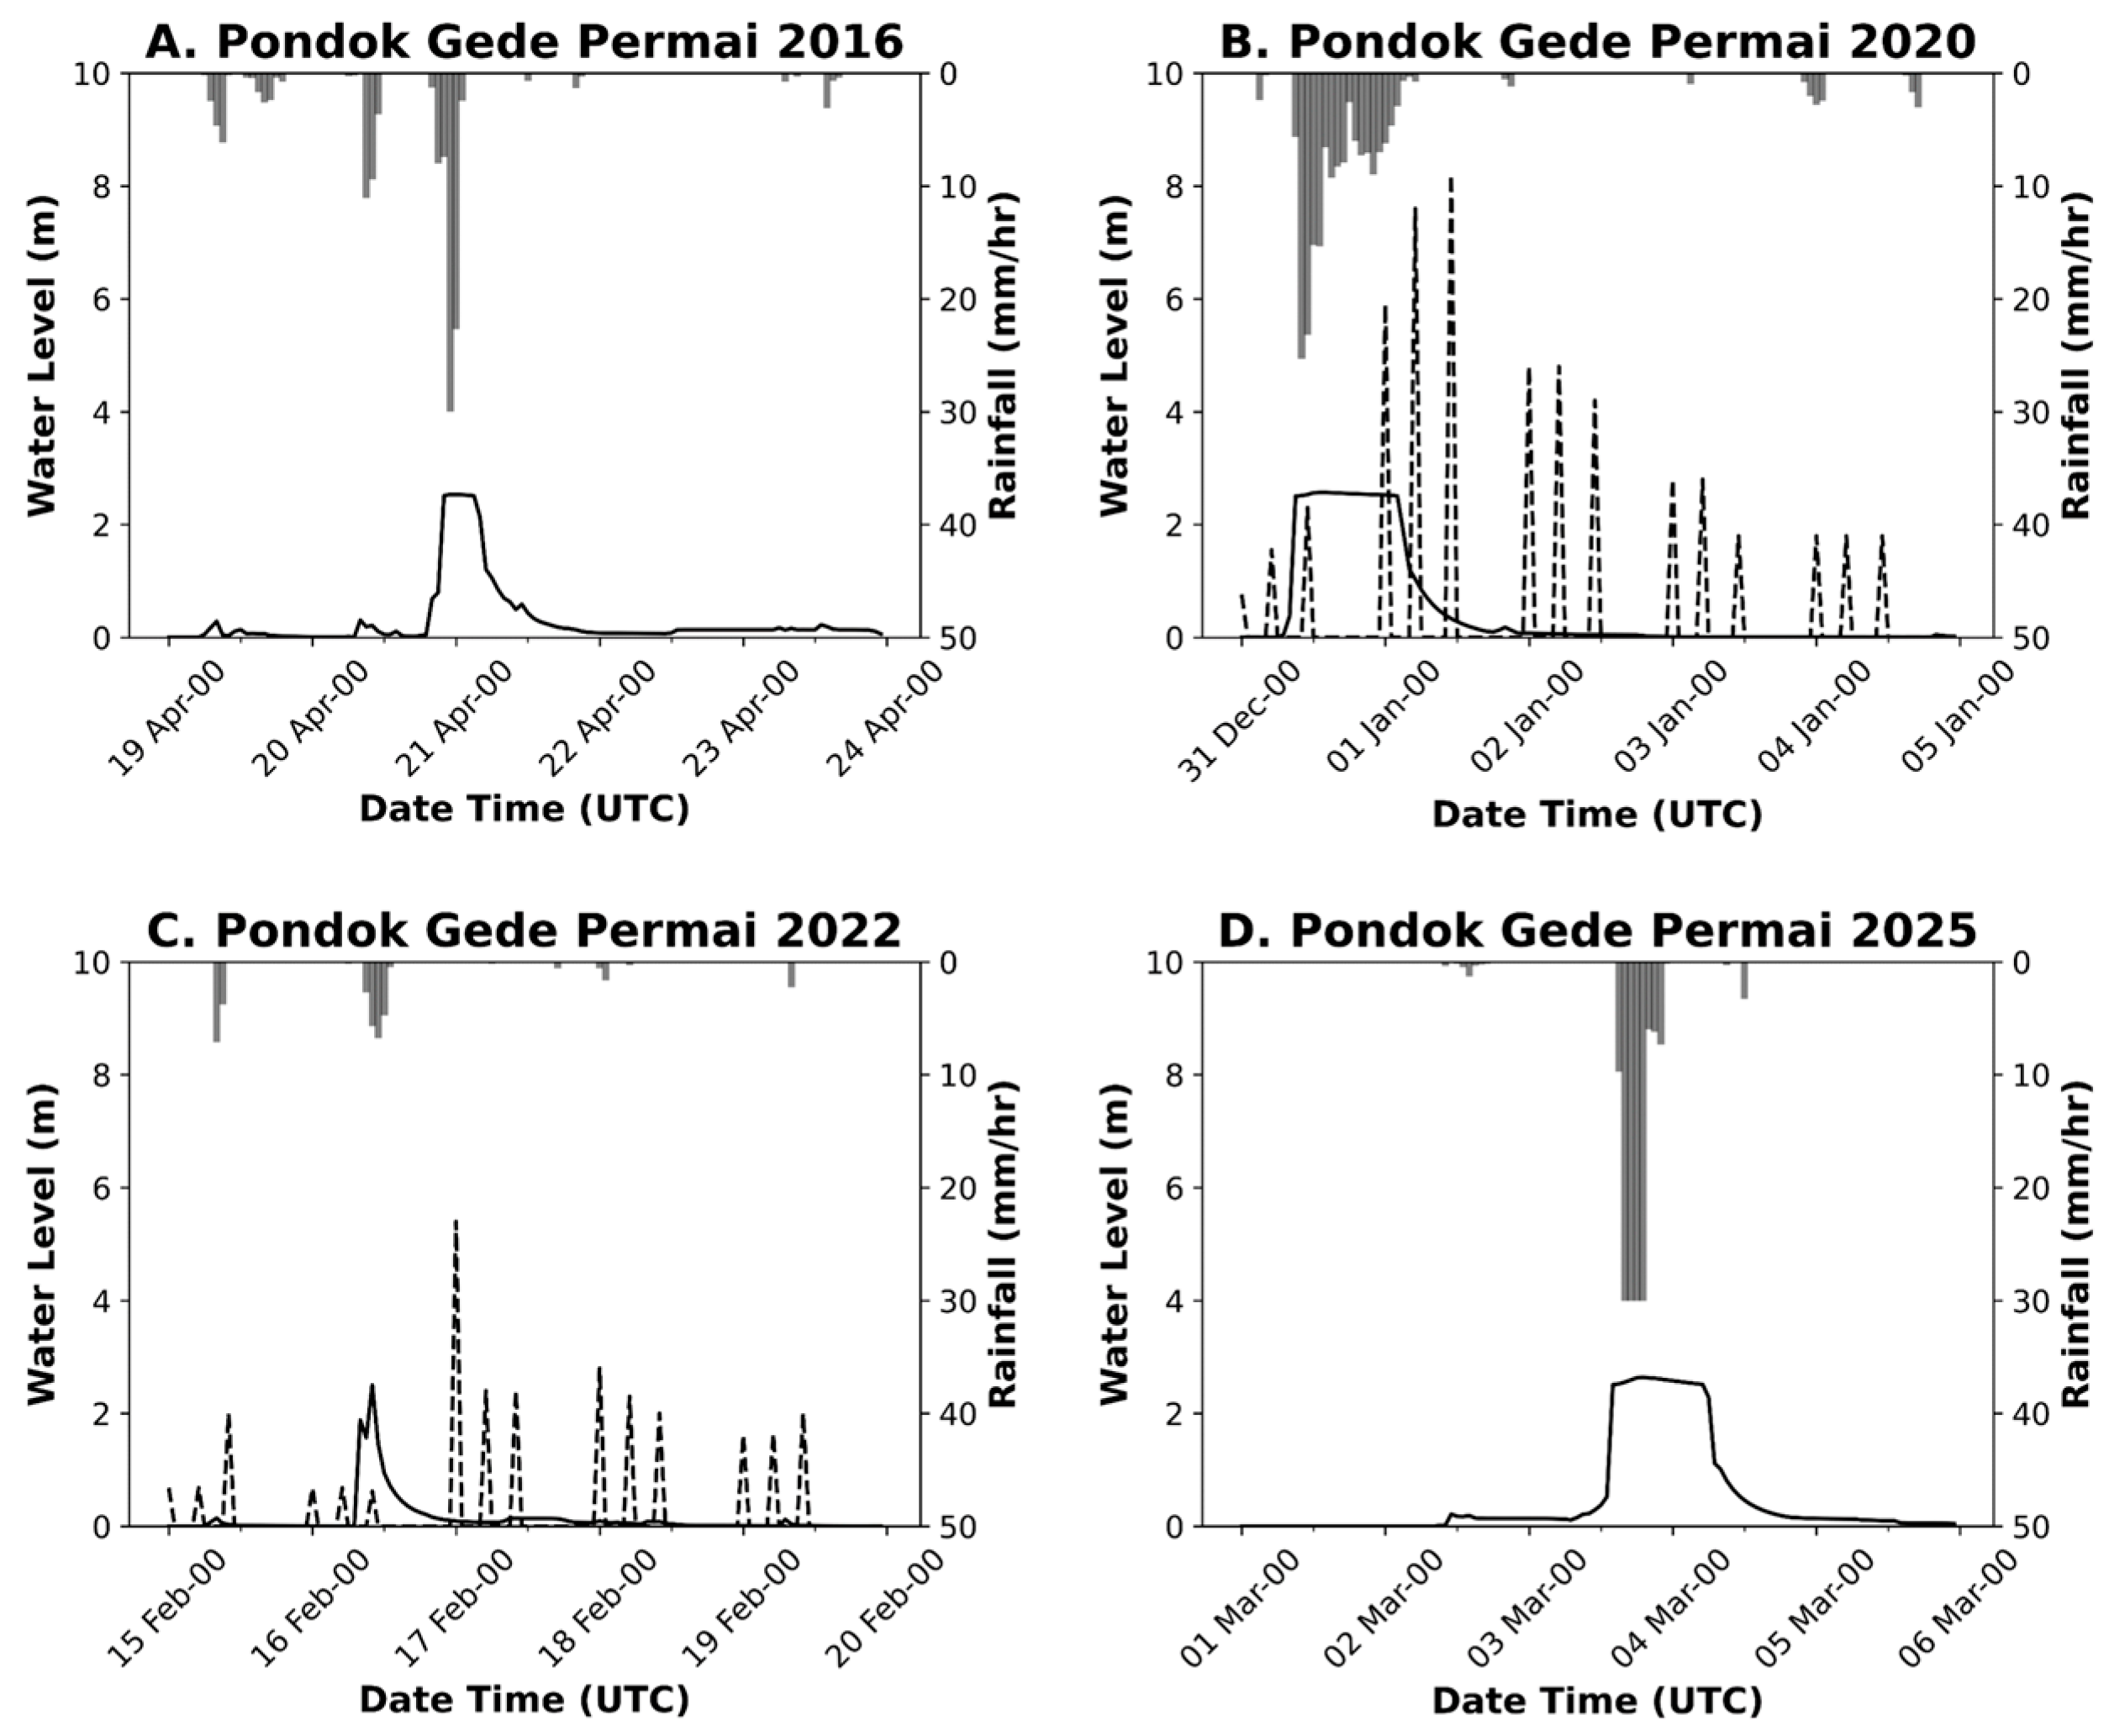
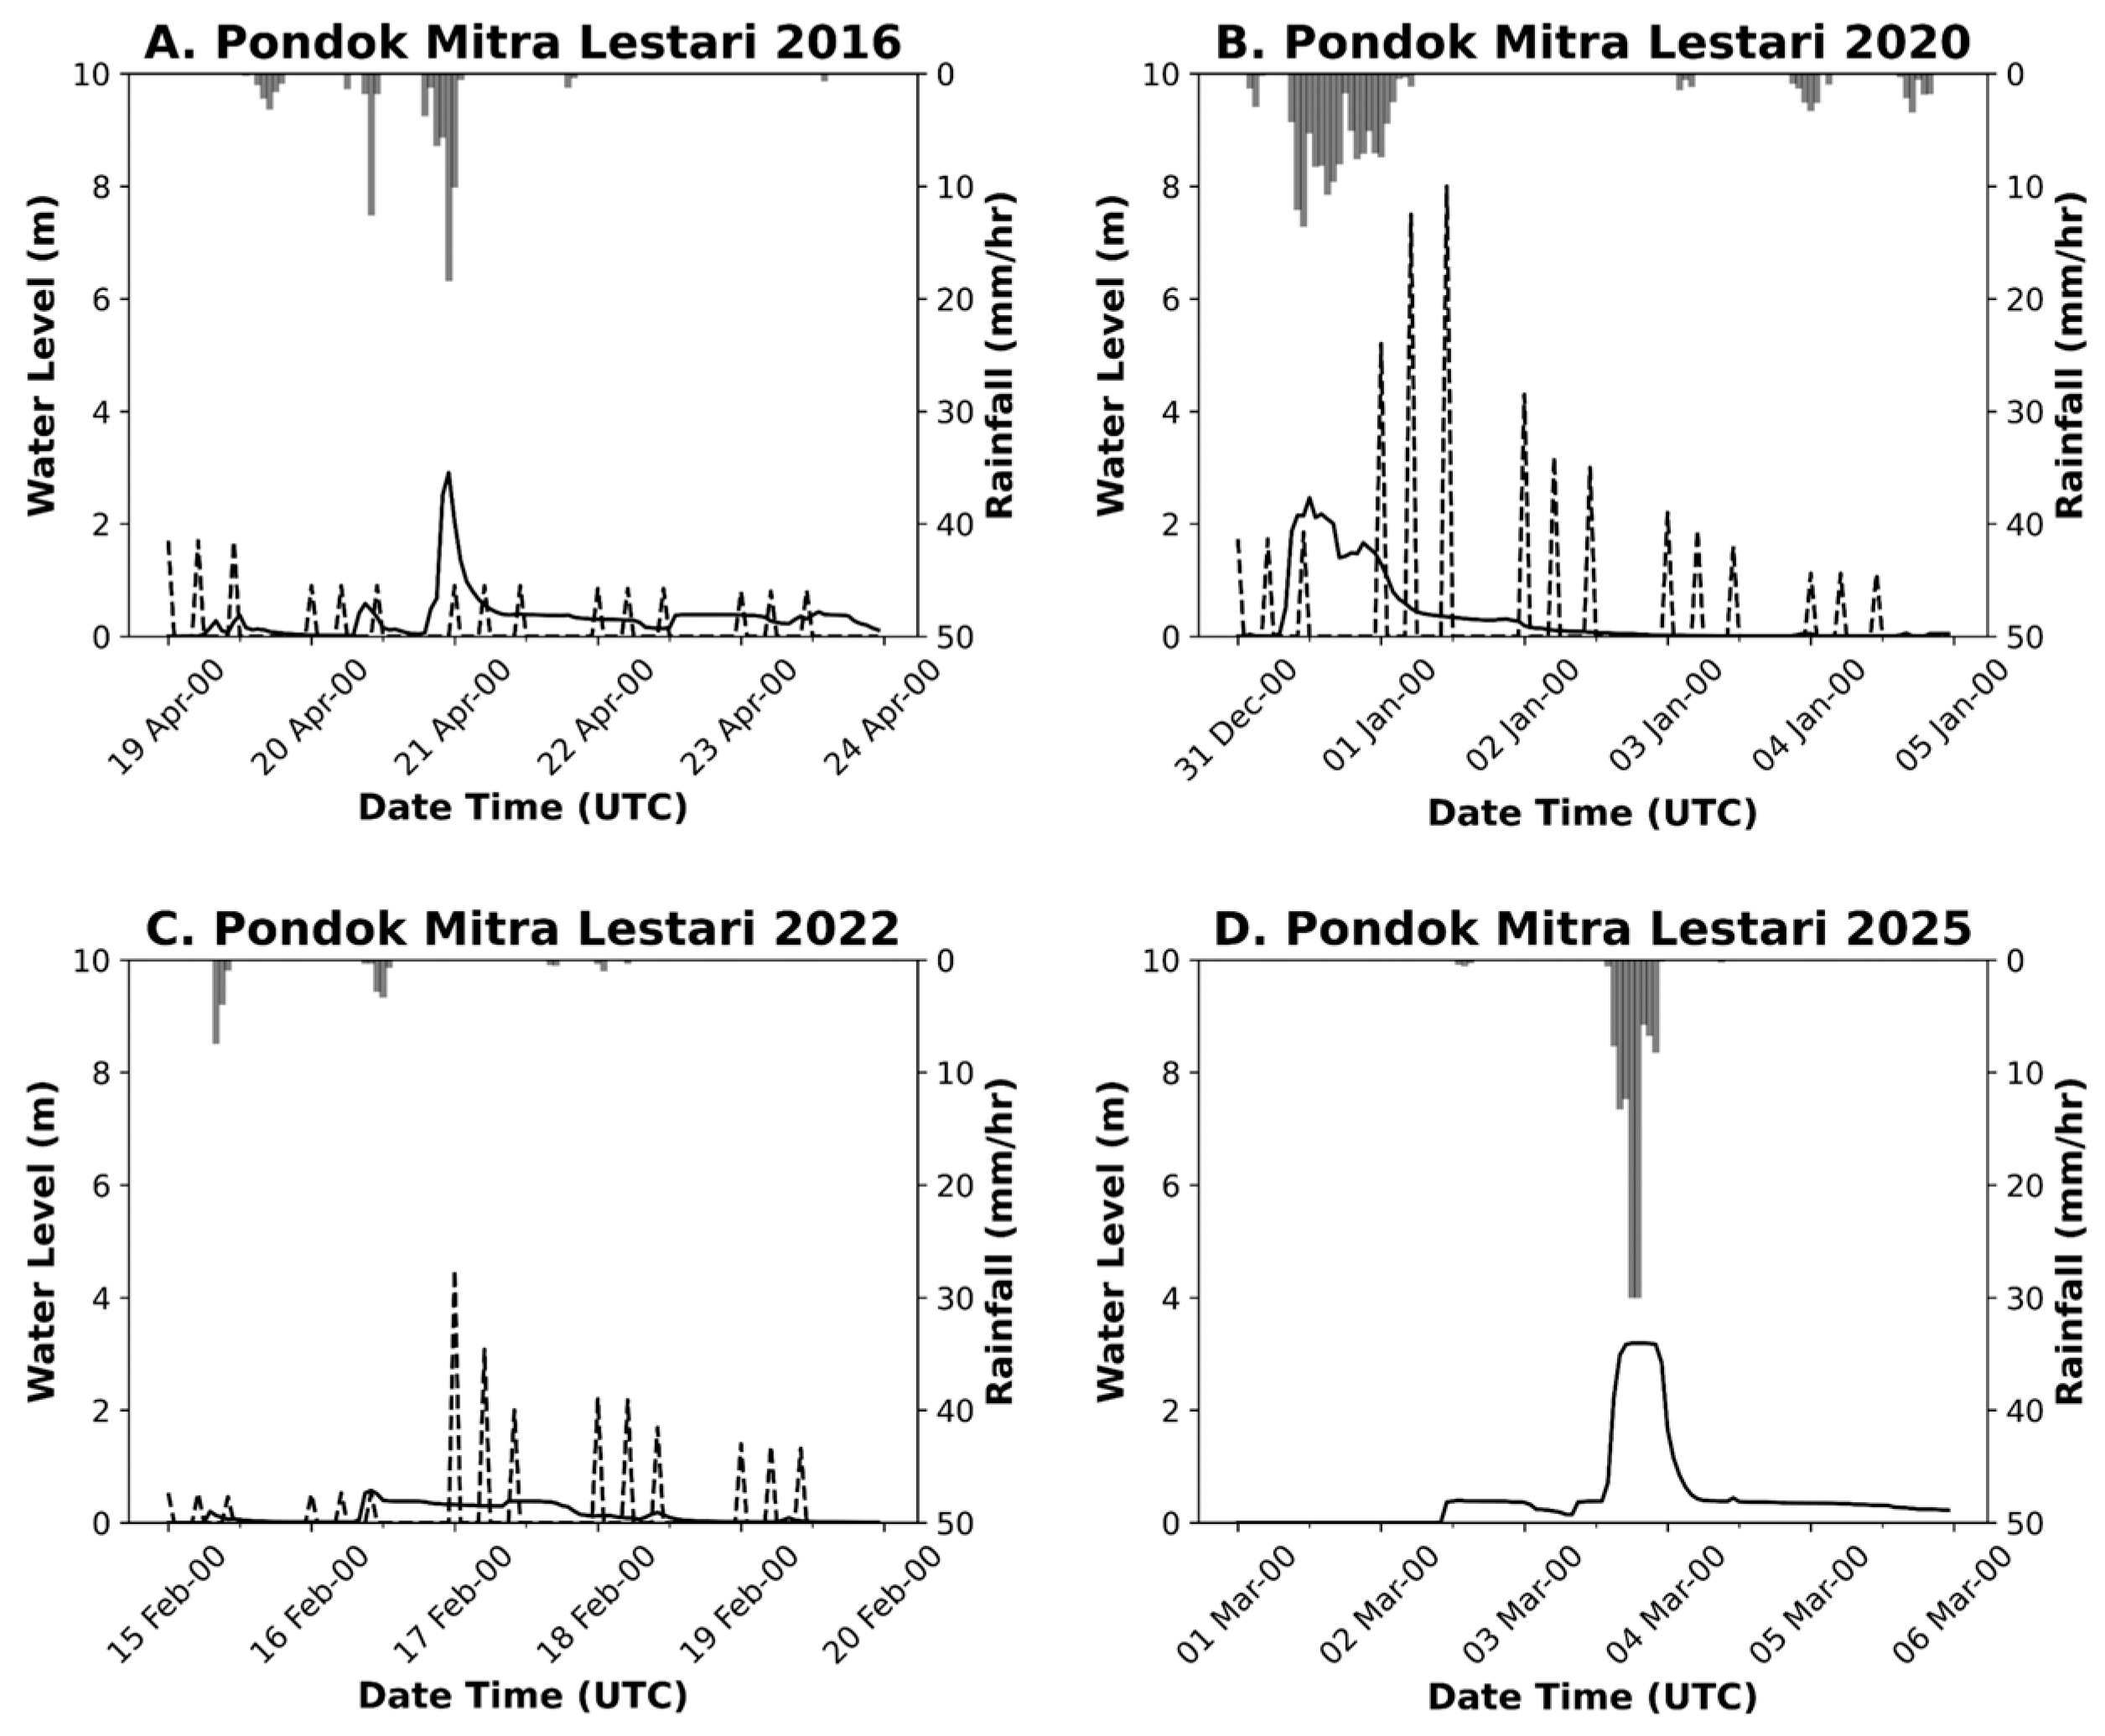
RRI model has been utilized to simulate inundation maps over Bekasi River Basin and river water level for each monitoring station. Hydrographs during four periods of flood for six stations are shown in Figure 9, Figure 10, Figure 11, Figure 12, Figure 13 and Figure 14. Generally, RRI models can simulate relatively well the river WL from rainfall data at Cibinong, Cileungsi, and PML Stations, with bias errors less than 1.2 m and have a strong correlation of more than 50% with observations.
In 2020, Cibinong had a maximum rainfall intensity of around 30 mm/hr and a maximum WL of around 5.2 m. Unfortunately, the observational data were available only in 2020 and 2022. On the other hand, in 2020, the WL observation at Cileungsi reached a maximum of around 5.4 m while the maximum rainfall intensity was observed to be around 30 mm/hr during 2016, 2020, and 2025, shown in (Figure 9 and Figure 10). Based on WL observation data available during 2020, 2022, and 2025, in comparison between Cikeas and P2C Stations, shown in (Figure 11 and Figure 12), P2C has the maximum WL of around 7.15 m in 2025. The maximum rainfall intensity reached 30 mm/hr in 2016 and 2025 for both stations. A long-duration rainfall exceeding 12 h has occurred at PGP and PML Stations in 2020, shown in (Figure 13 and Figure 14), resulting in a severe flood event with the maximum peak of water level reaching 8.20 m at PGP. However, in 2025, WL observation data at PGP and PML were not available during the flooding events.
The simulation results of WL were compared with observed data to evaluate the RRI model’s accuracy, shown in Table 4. In general, around 50% cases have a significant relationship (R2 ≥ 0.3) between observed and simulated WL at a 95% confidence level. The insignificant and lowest R2 occur over PML (0.25) in 2016, as well as for Cibinong (0.09), Cikeas (0.10), and PGP (0.02) in 2022. The lowest RMSE is 0.66 at Cileungsi and the highest is 3.88 at P2C, both in 2022. In contrast, for all stations, the lowest is in 2016 (0.88) and the highest is in 2025 (2.72). For R2, the greatest value is 0.75 at Cileungsi (2020) and the smallest value is 0.02 at PGP (2022). In contrast, 2020 has a maximum R2 for all stations, with a value of 0.40, and the minimum is 0.16 in 2022.
Around 50% of the WL comparisons between observations and simulations are not statistically significant. We speculate that this is primarily due to the low spatial resolution of the GSMaP dataset (~11 km), which may not accurately capture the true rainfall distribution. Even small underestimations in rainfall over certain sub-catchments can lead to large differences in simulated WL. In addition, real-world drainage delays and ponding effects can alter the timing and volume of observed WL, so the model may reproduce the general flood timing but not the amplitude. Lastly, the WL in downstream Bekasi is influenced not only by local rainfall but also by inflows from the upper and middle catchments. As a result, the correlations are relatively low, even though some remain statistically significant, particularly at the most downstream stations such as PGP and PML.
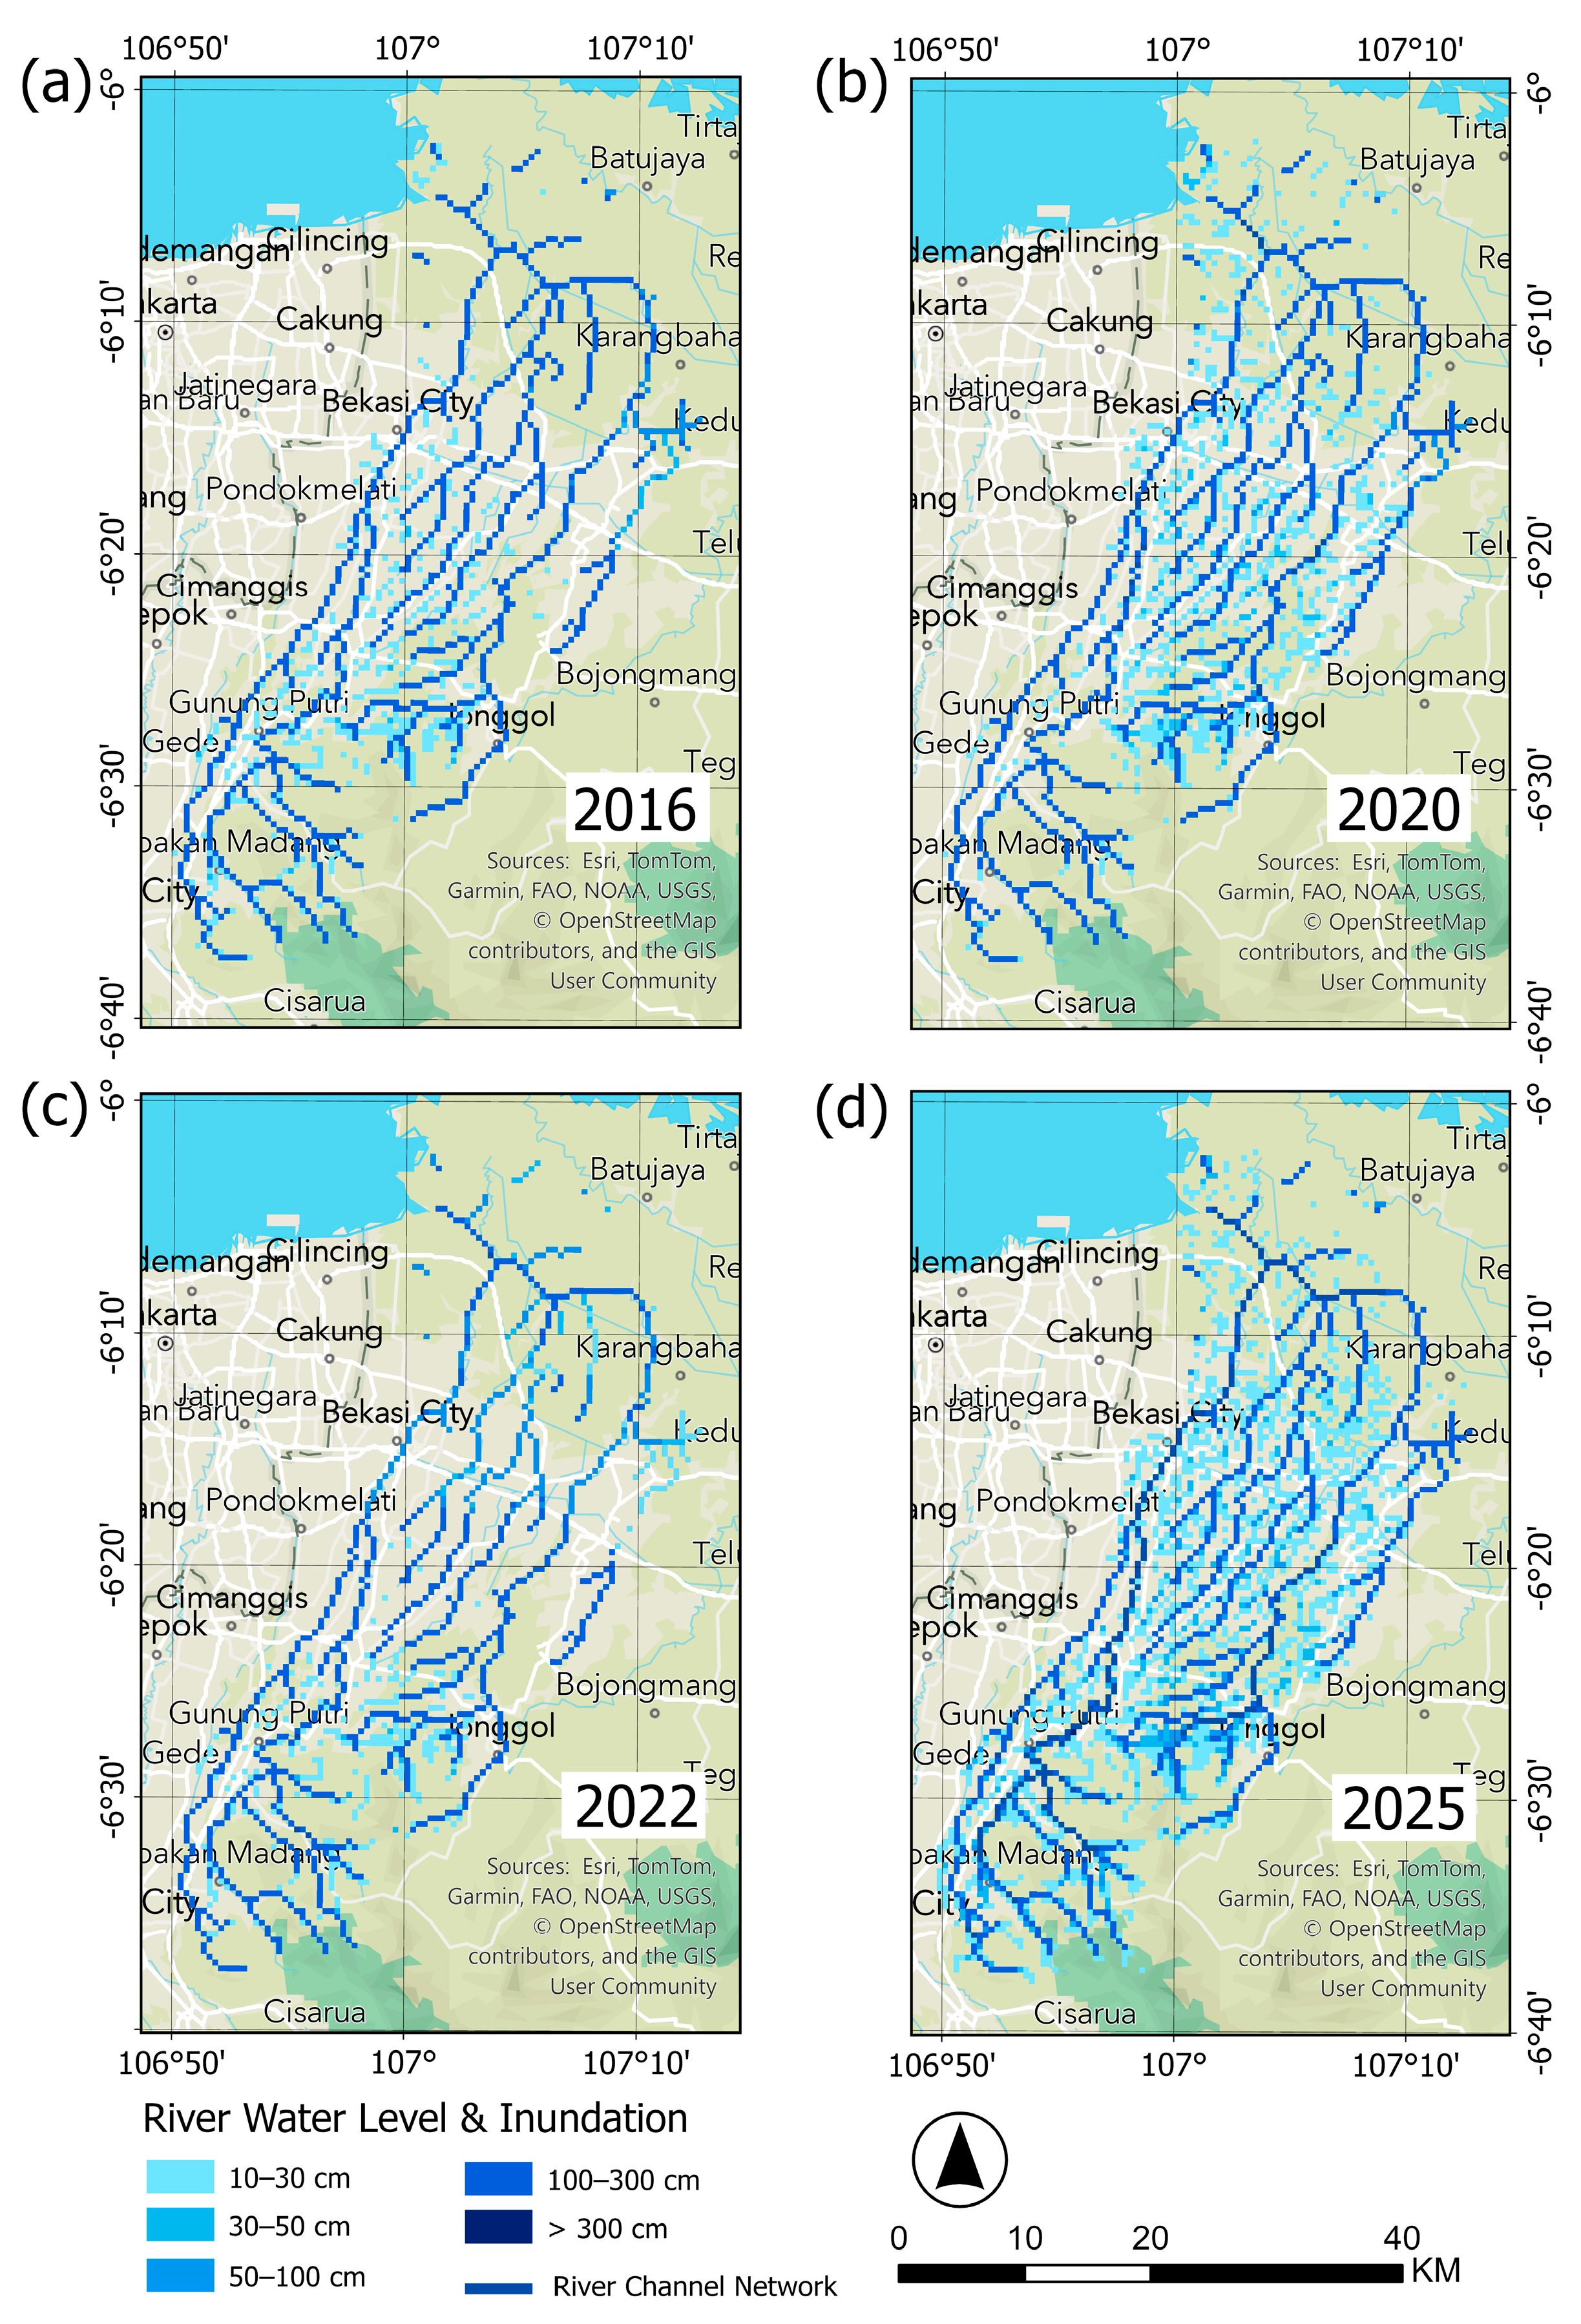
Flood inundation map derived from the RRI model shown in Figure 15. In 2016, 2020, 2022, and 2025, the model simulated several floods in the Bekasi and its surrounding regions and affected almost the entire study area from upstream to downstream, exhibiting widespread and uniform patterns with total affected area about 136.60 km2 (2016), 239.73 km2 (2020), 91.13 km2 (2022), and 464.32 km2 (2025). Over 75% of the Bekasi River Basin has experienced the inundation depth between 10 and 30 cm in 2025, reaching more than 80% in 2020 and >89% in 2016. The inundation depth between 30 and 50 cm affected over 15% in 2020 and 2025. In 2022, 0.42 km2 in water depth between 100 and 300 cm occurred. The highest peak in inundation depth between 100 and 300 cm affected a 20.82 km2 area, and >300 cm affected a 2.97 km2 area in the 2025 flood event. In 2020, the total flood-affected area was about a 75% increase in comparison to 2016. It expanded further and reached about 94% in 2025 compared to 2020.
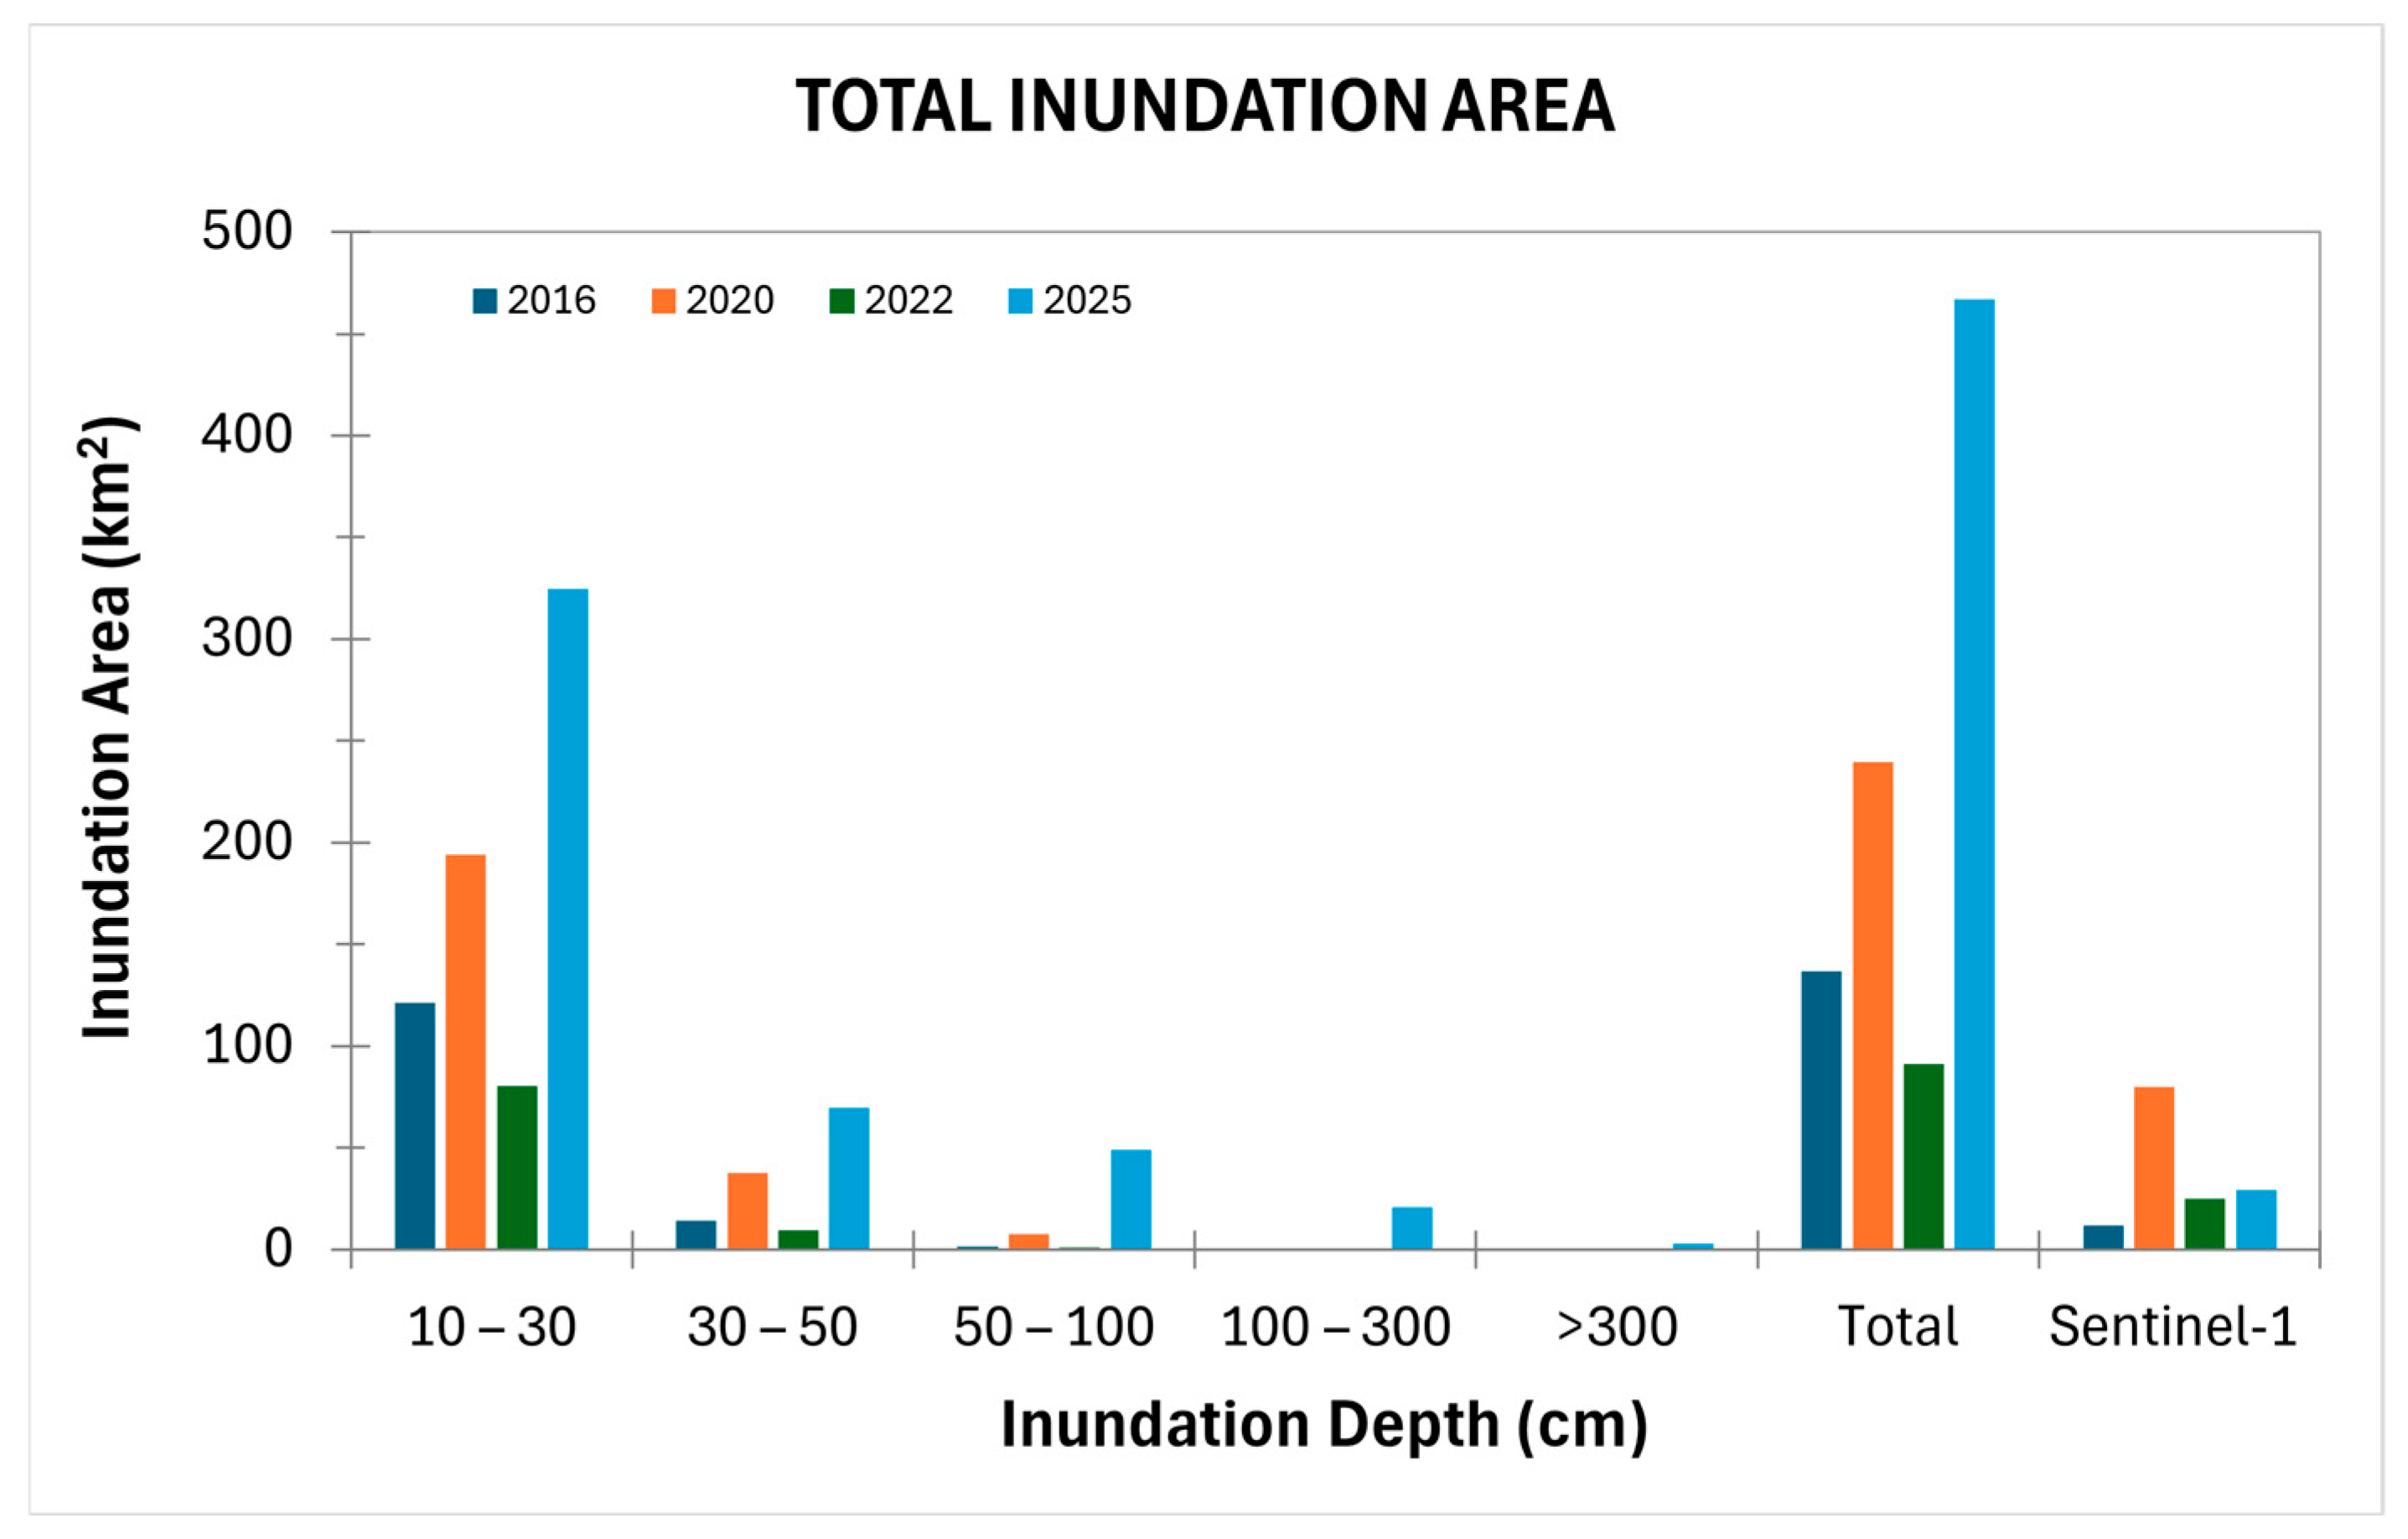
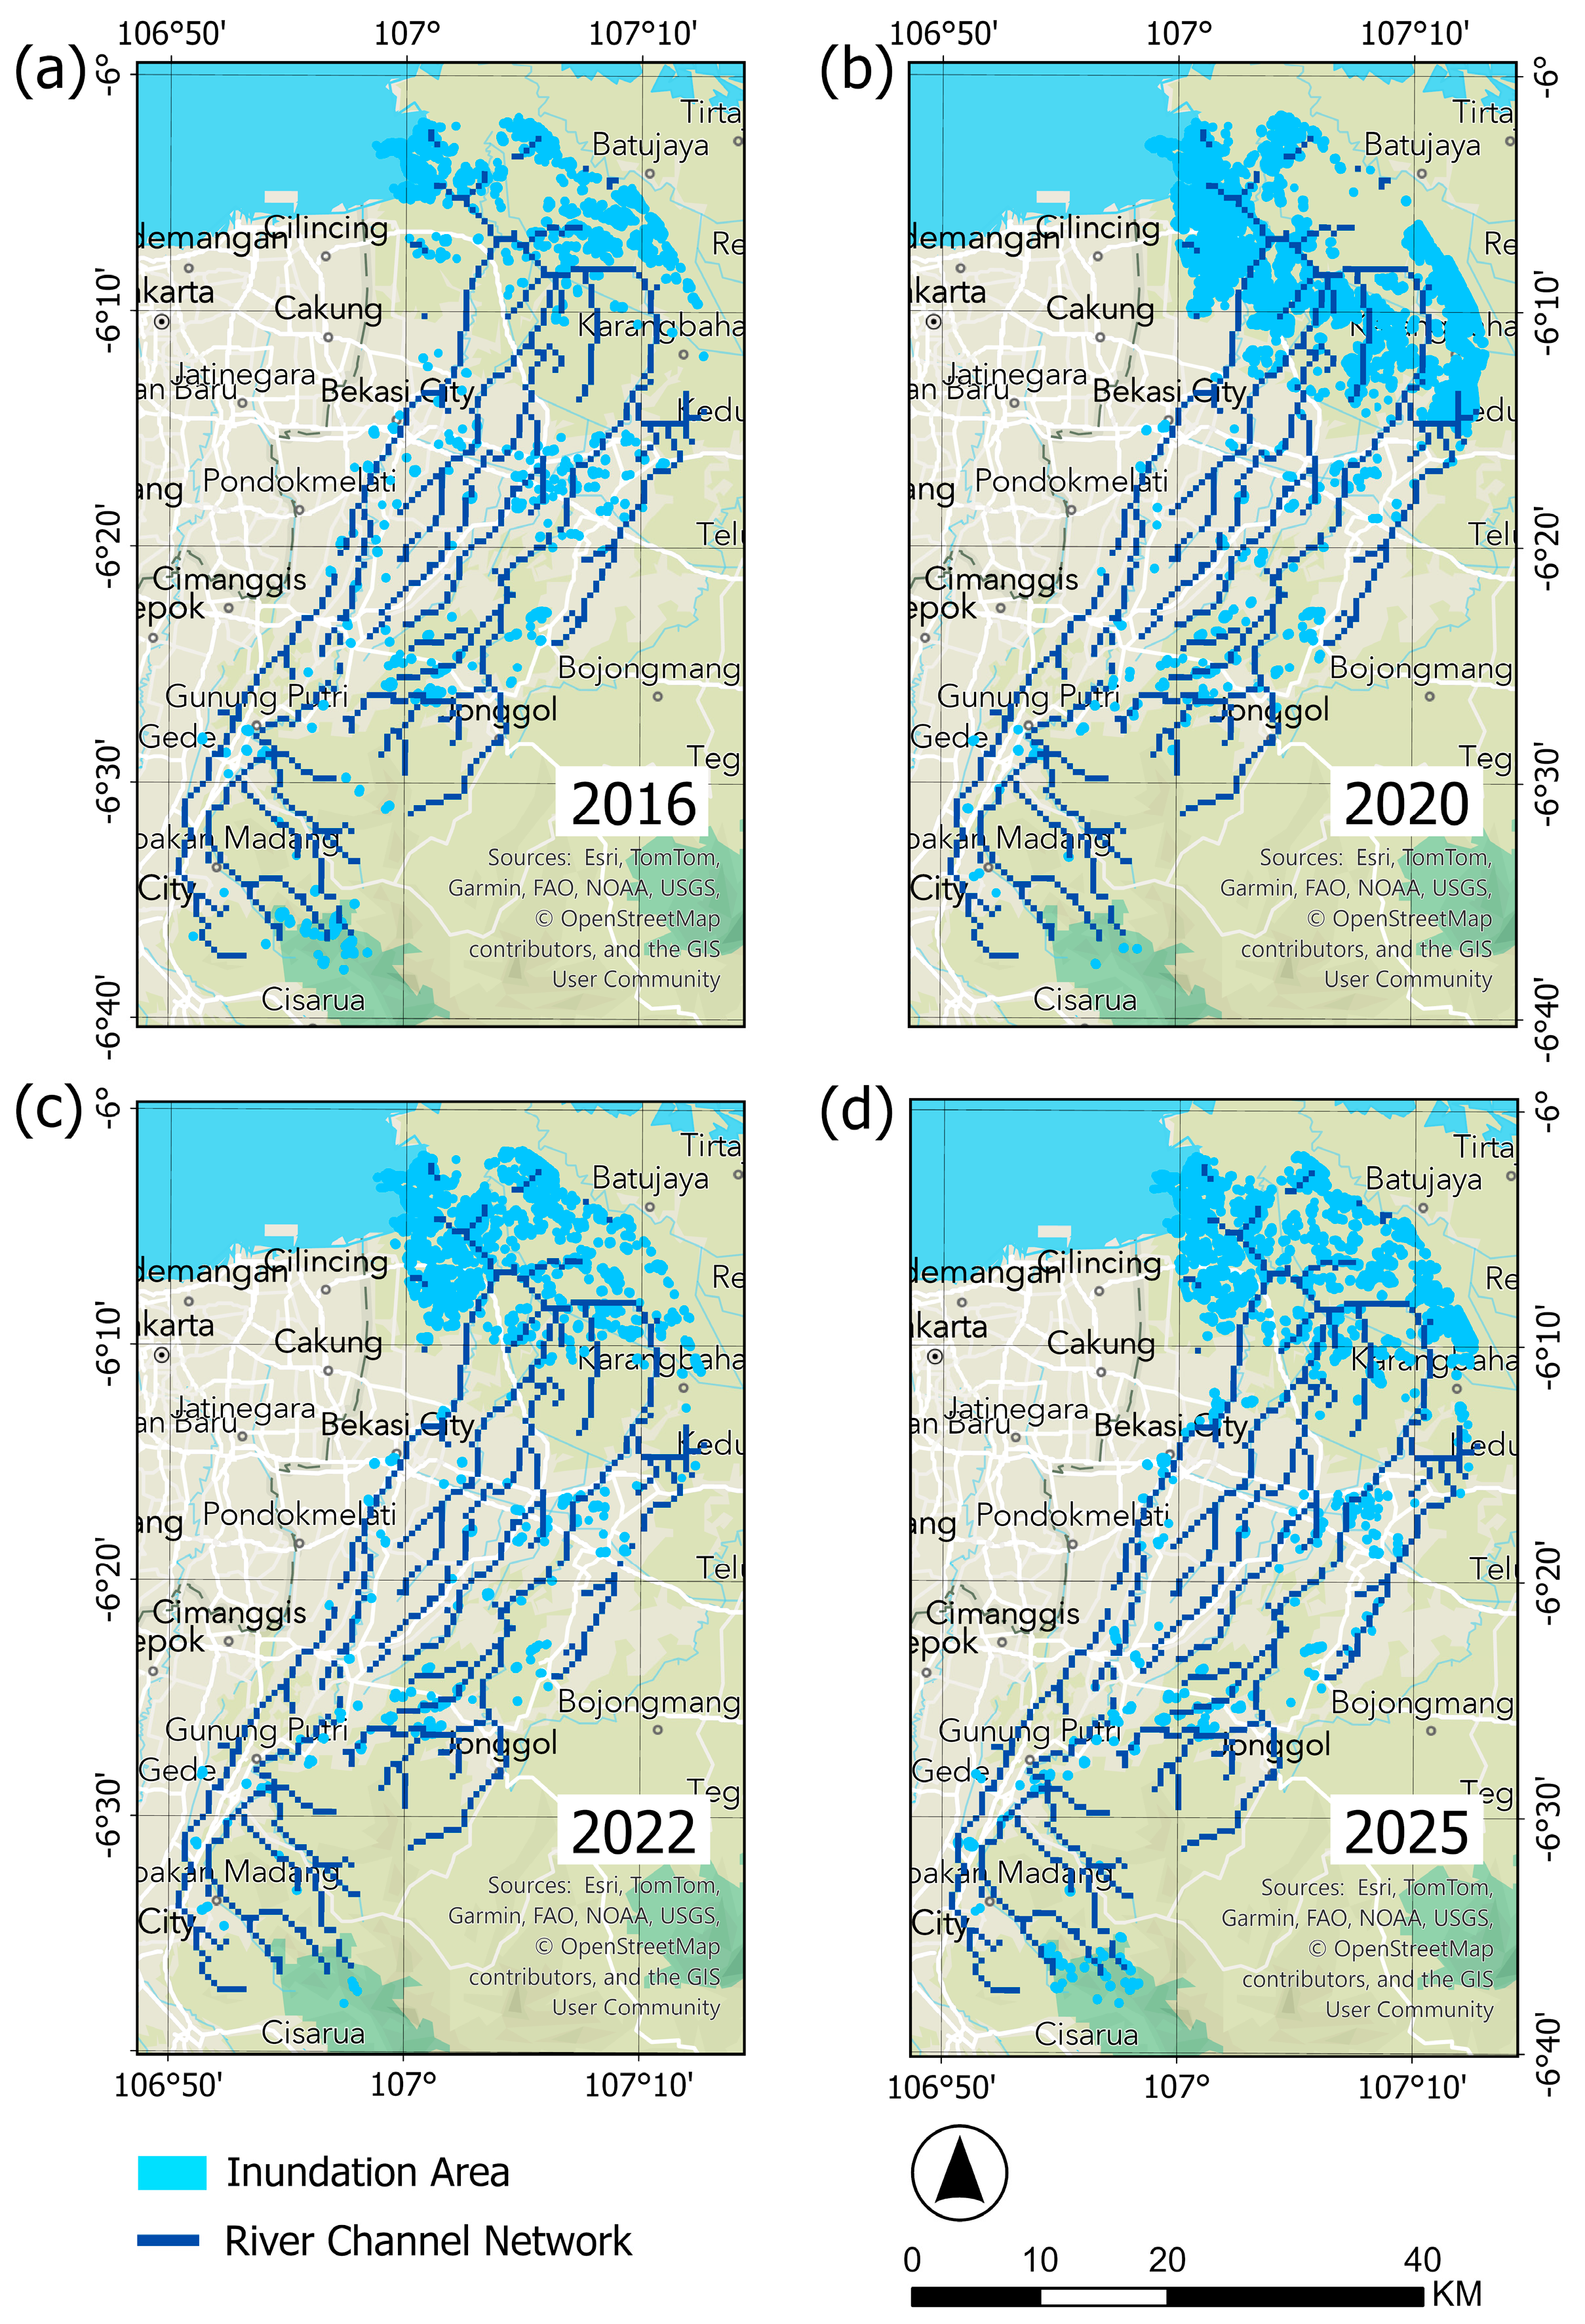
Compared with the inundation map derived from Sentinel-1 satellite imagery, calculated before and after the flood events, as shown in Figure 16, the inundation area was mostly concentrated on the downstream area (Northern part of Bekasi River Basin), with only a limited number of inundations in the upstream or middle area. The highest total inundation area of about 79.81 km2 was recorded in 2020, and 29.15 km2 in 2025. In contrast, the smallest inundation occurred in 2016, covering 11.98 km2. According to Sentinel-1, the smallest was in 2016 at 11.98 km2. The total inundation area during the four major flood events is shown in Table 5. Furthermore, Figure A4 shows that total inundated area derived from RRI model is significantly larger than that from Sentinel-1, especially on 2025, this discrepancy is most likely because the rainfall data used in the RRI simulation corresponds precisely to the date of the flood events, whereas the Sentinel-1 image was acquired from the nearest available dates before and after the flood occurred as shown in Table A1.
Based on data obtained from the Ministry of Health [73] in 2016, floods occurred in Muara Gembong, East Bekasi, North Bekasi, Jatiasih, and Pondok Melati districts. In 2020, flooding was more widespread, not only in the Bekasi area but also in surrounding areas such as East Jakarta and Karawang. A news report from the media [74] also mentioned that flooding occurred in several areas in Bekasi, including Jatiasih, West Bekasi, East Bekasi, North Bekasi, South Bekasi, Mustika Jaya, and Bantar Gebang. Based on media reports, the areas affected by flooding in 2022 included Jatiasih, East Bekasi, North Bekasi, and South Bekasi. In 2025, a significant flood occurred, affecting many areas within the Bekasi River Basin. In the data recorded on the Bekasi city statistics portal [75], Regional Disaster Management Agency (BPBD) of Bogor Regency, Bekasi Regency, Bekasi City, Depok City and Jakarta there are also many areas affected by the 2025 flood, namely Bogor, Depok, Jakarta and Bekasi including Rawalumbu, Pondok Gede, West Bekasi, Bantar Gebang, North Bekasi, South Bekasi, Jatiasih and East Bekasi Districts. The detailed location of inundation during the four major flood events can be shown in Figure 5 and Table A2. According to our results, there was some flooding in the upper reaches of the Bekasi River Basin, and it has been shown that the inundation spreads evenly throughout the Bekasi River Basin area.
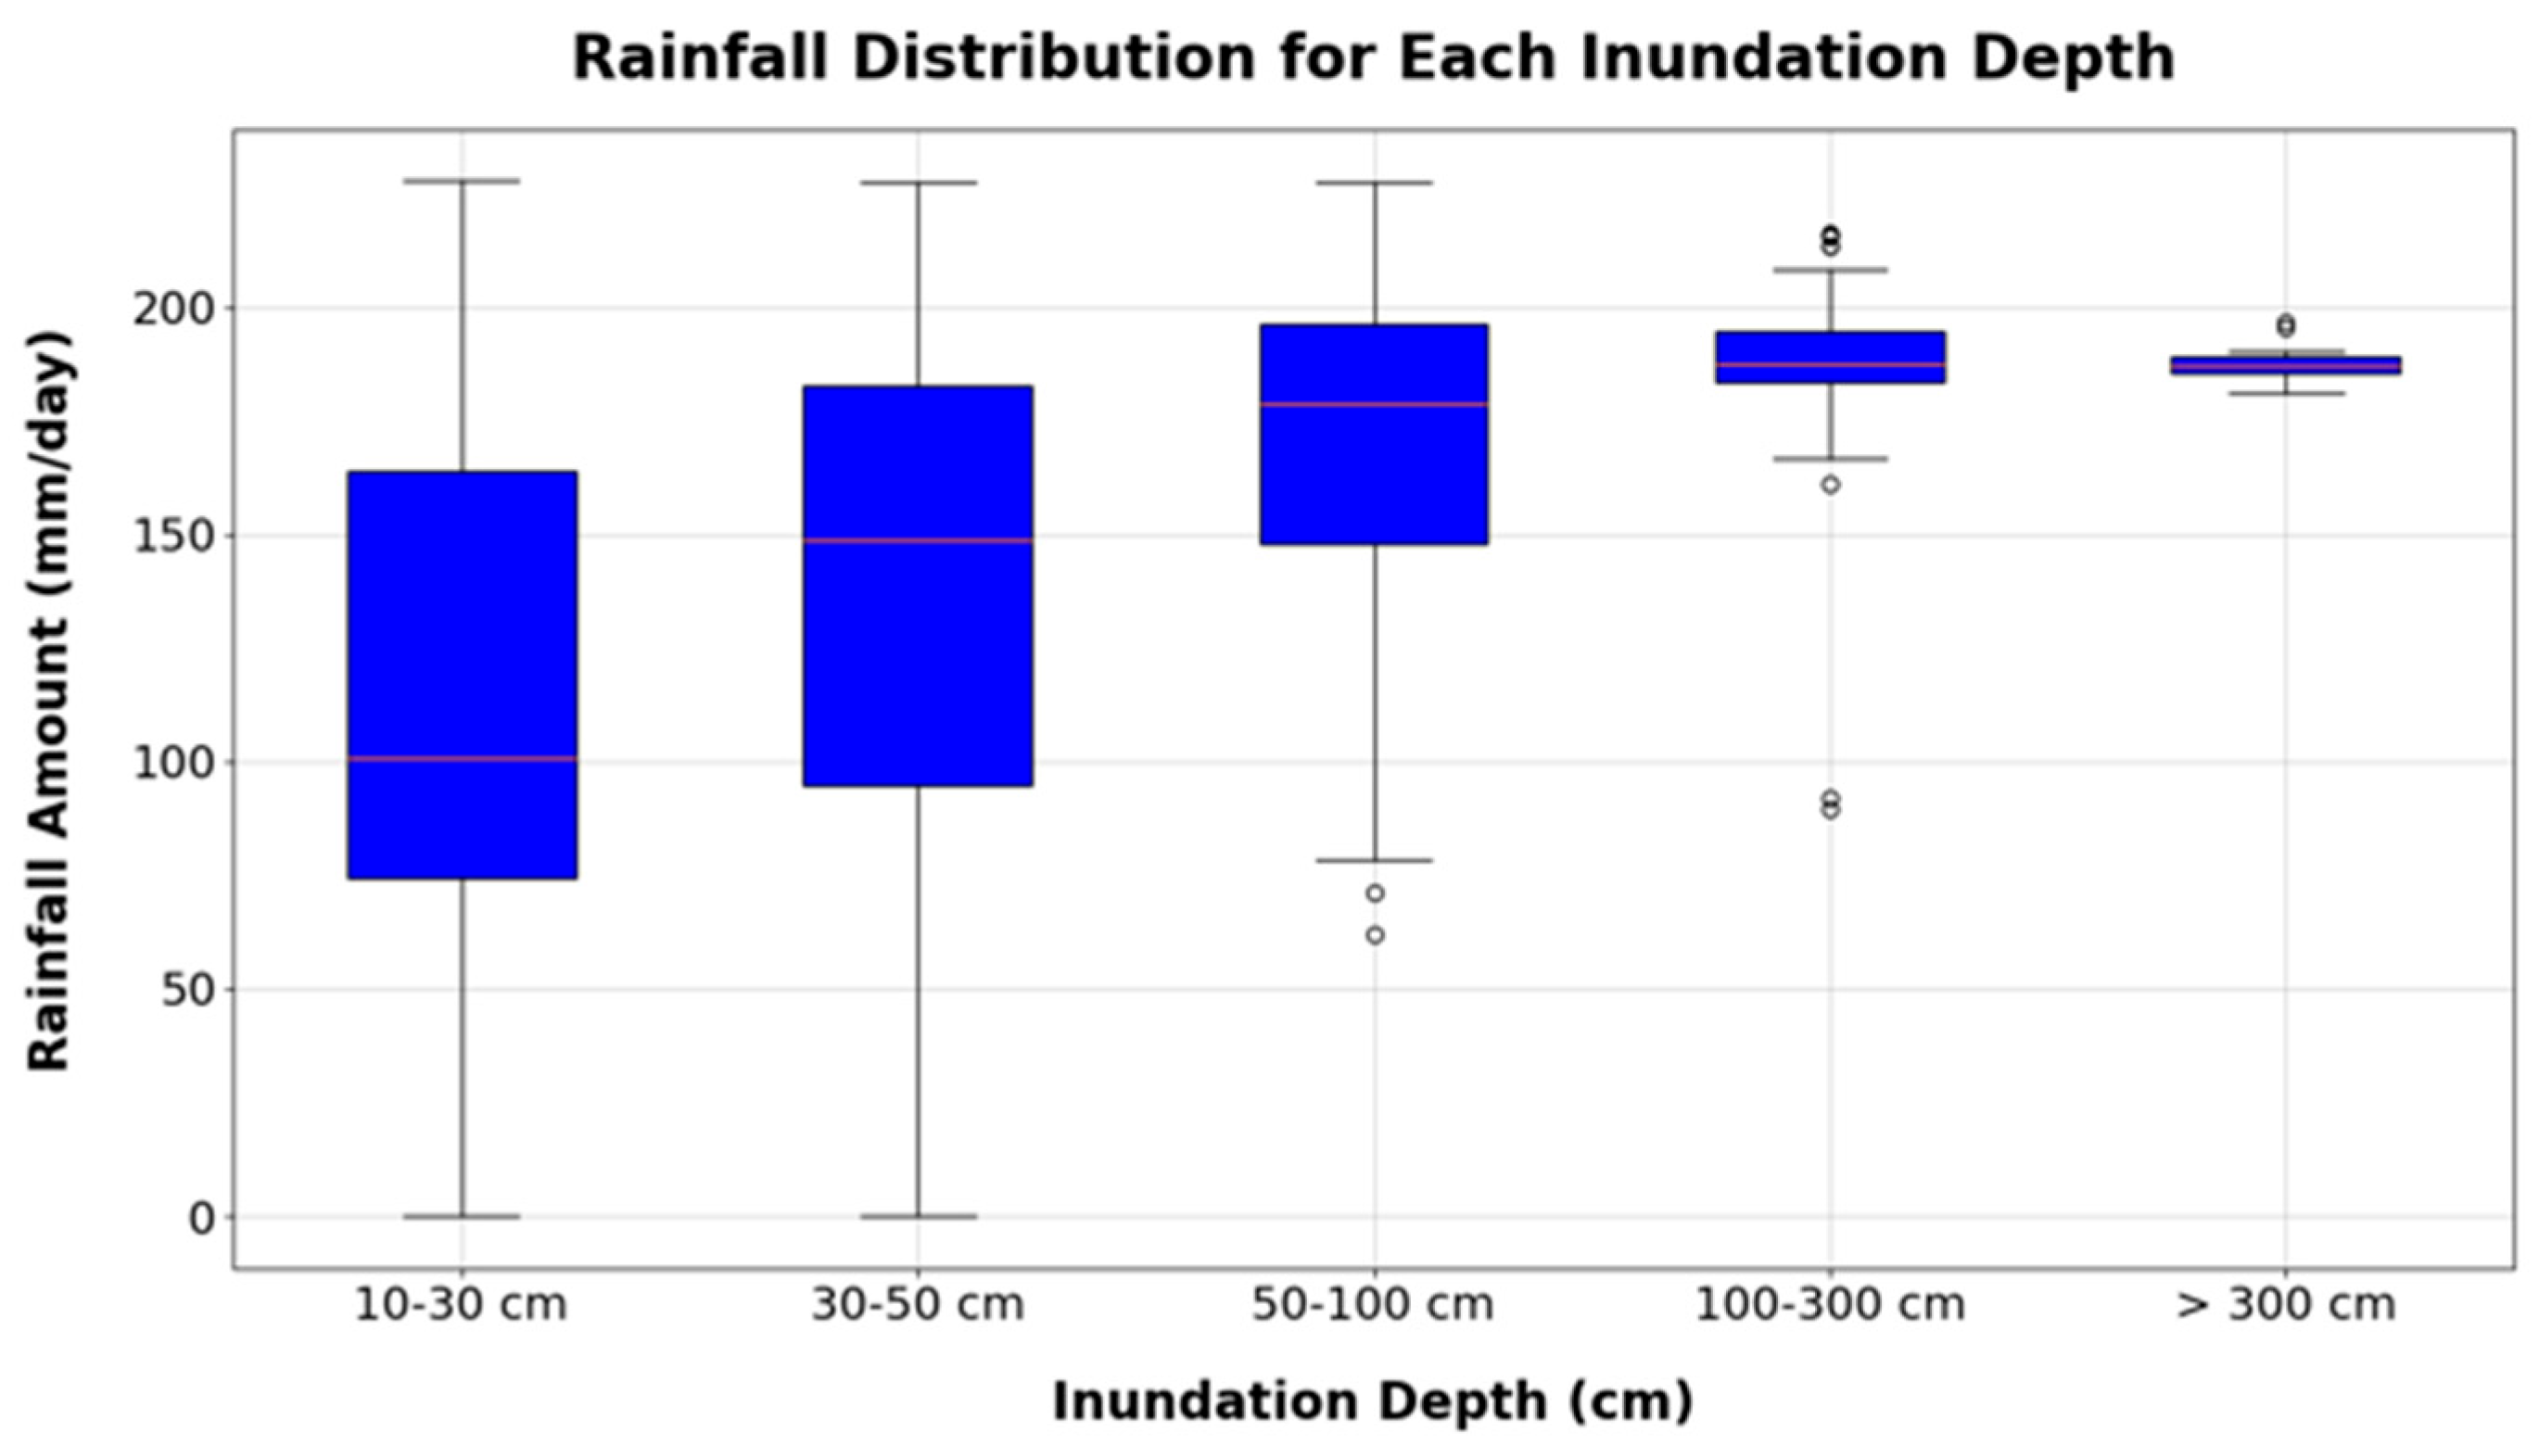
Furthermore, the rainfall threshold that leads to flooding of a certain depth was calculated using GSMaP rainfall data and simulated inundation peaks from RRI model, as shown in Figure 17. This indicates that inundation of 0.5–1 m deep is triggered by rainfall intensities exceeding 150 mm/day, while intensities above 180 mm/day can lead to inundation depths greater than 3 m, which can create a severe hazard for the local community. Conversely, rainfall with intensities below 100 mm/day produces inundation depths less than 0.5 m.

3.3. Rainfall Impact on Flood Events

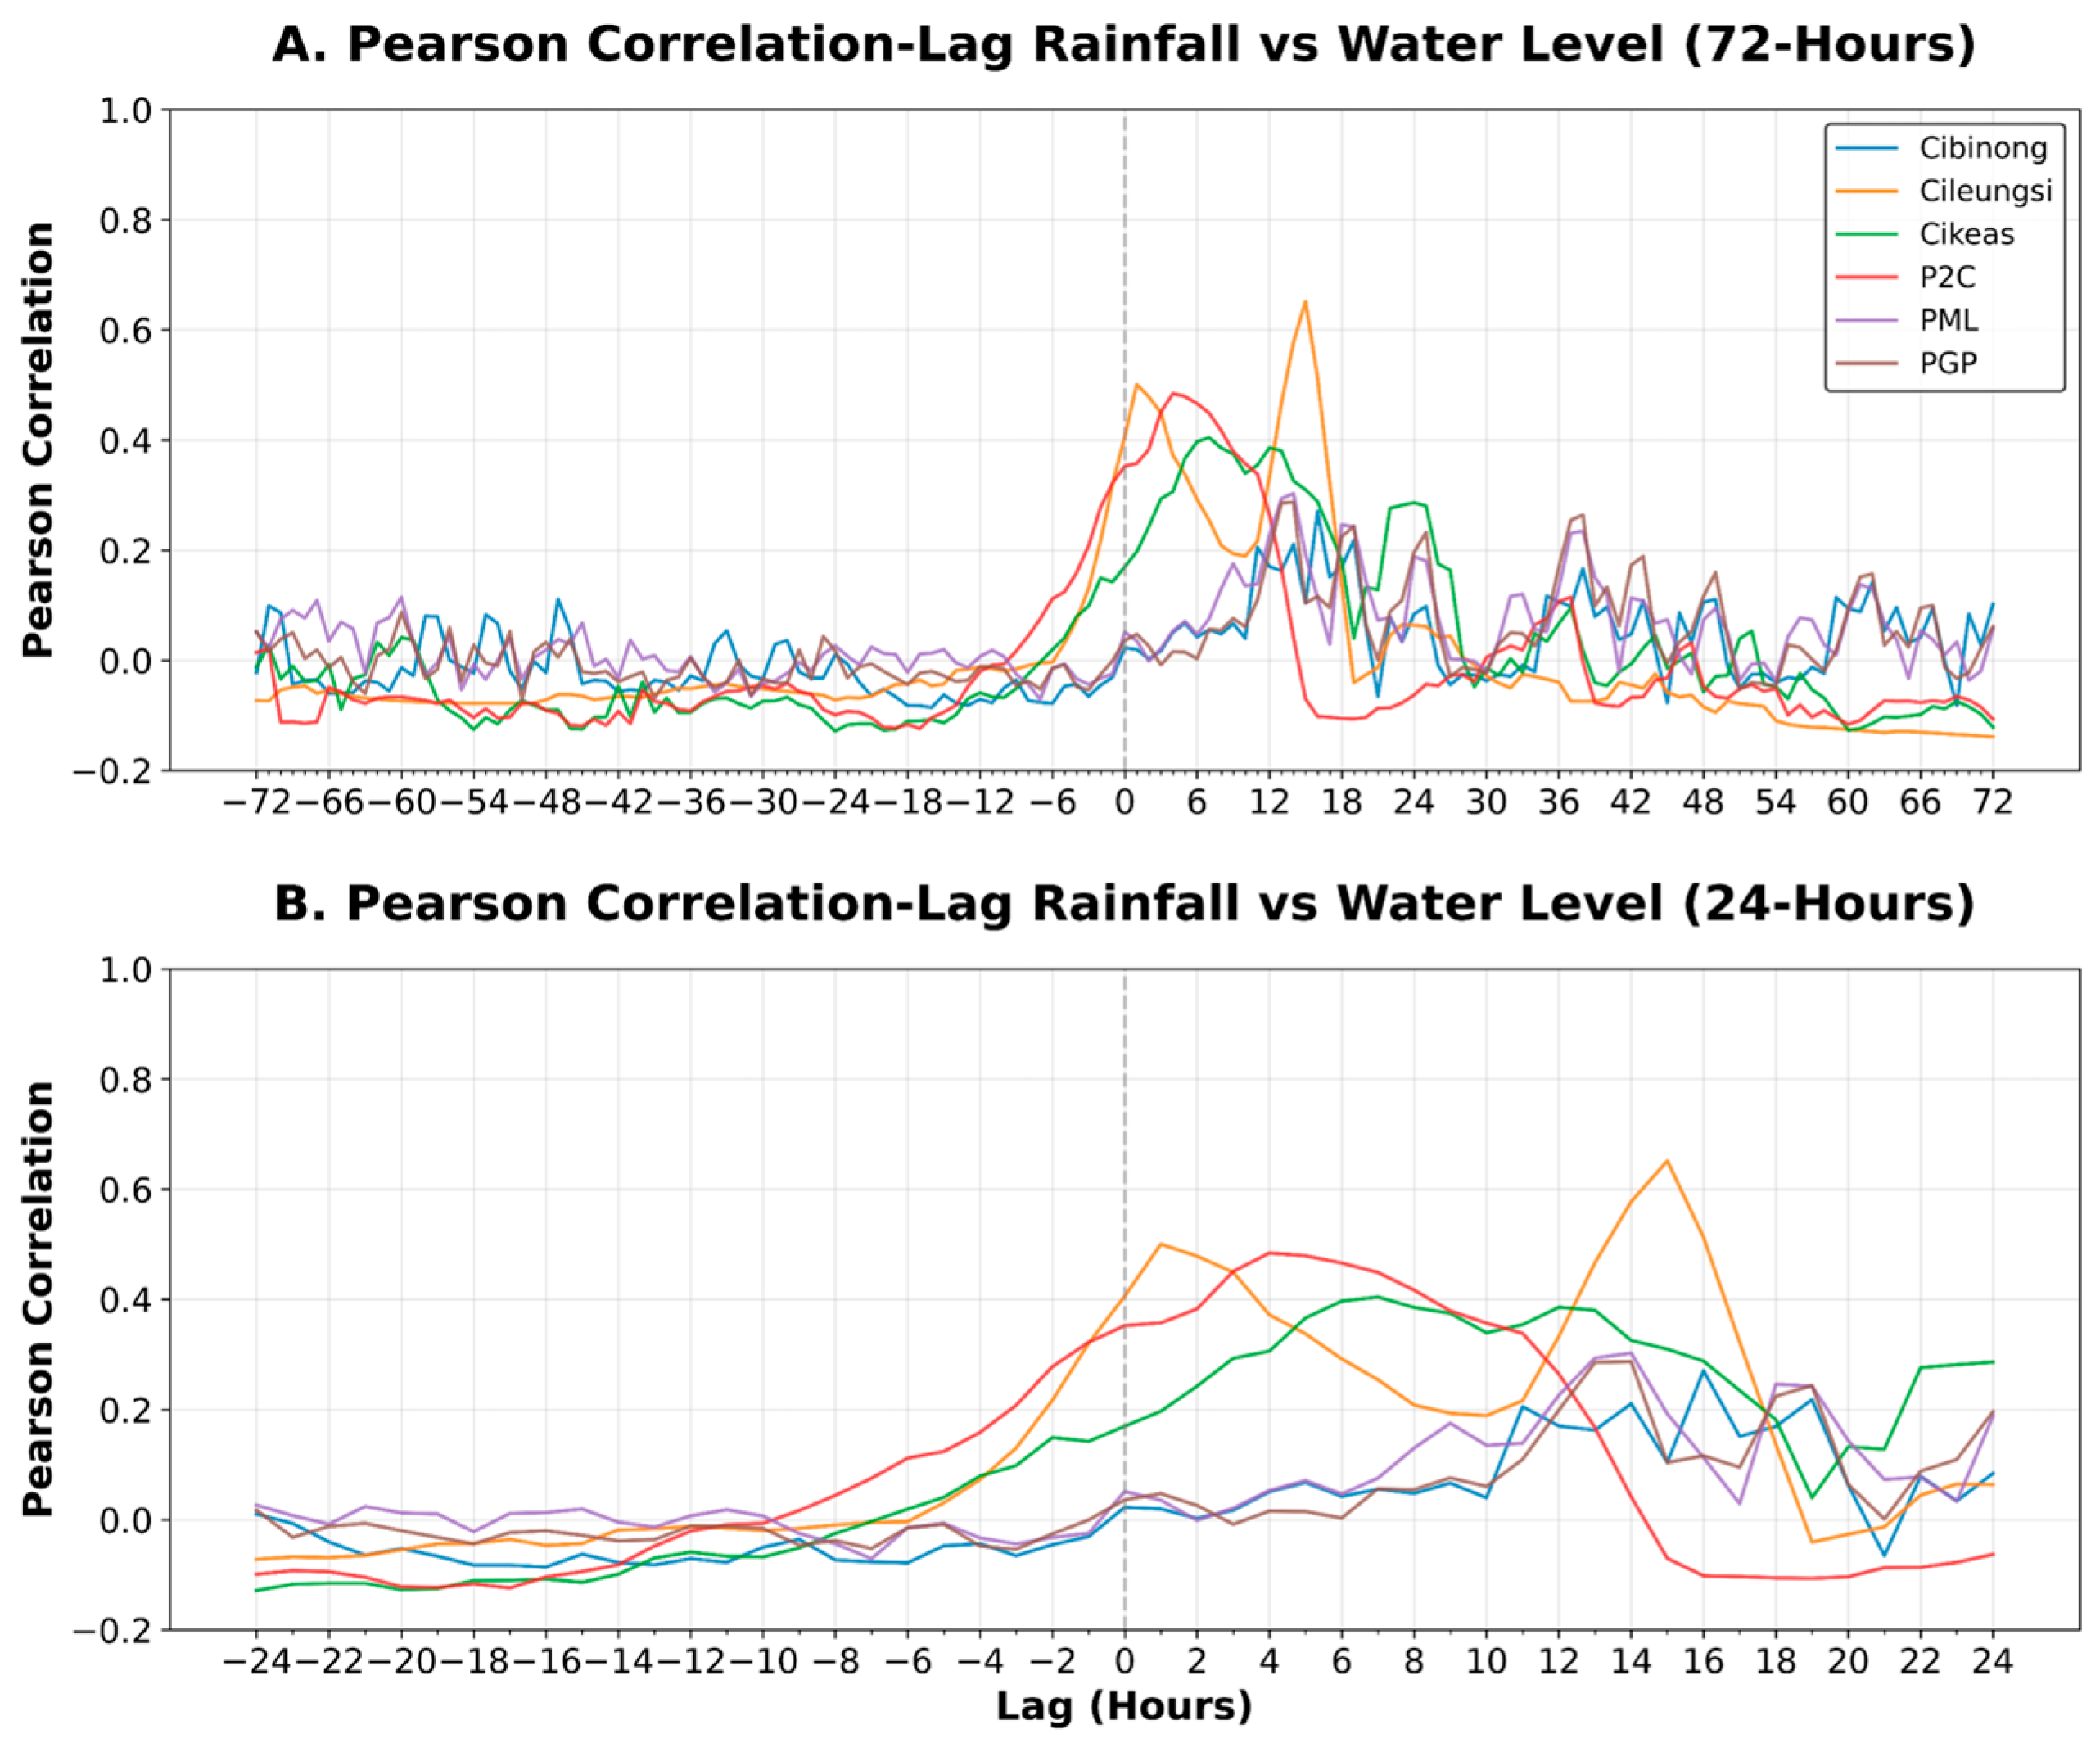
Using time series data in 2020 and 2022 across six monitoring stations in the Bekasi River Basin, the time lag difference between rainfall and river water level is shown in Figure 18. The correlation for all the monitoring stations is positive, beginning with rainfall before an increase in WL occurred. All stations show a time lag of less than one day or within 24 h. Cileungsi, Cikeas, and P2C have a time lag difference of up to 7 h. Particularly in Cileungsi (upstream station), the time lag occurred within an hour (r = 0.5), indicating almost no leading time, even though the maximum correlation happened after 15 h (r = 0.6). This demonstrates that they may have secondary runoff components. Cikeas and P2C show the time lag difference of about 7 h (r = 0.4) and 4 h (r = 0.5), respectively, indicating the river water level may rise several hours after rainfall events. PGP and PML (downstream station) have the same time lag difference of 14 h (r = 0.3), because the flow integrated from several tributaries and runoff needs more time to reach them. The time lag difference of PGP was about two times that of P2C, even though the location of P2C and PGP was very close, because the data availability was different (P2C is available for three events, while PGP was only available for two events). For Cibinong, even though the location is in the upstream area, the time lag difference was around 11 h (r = 0.2). This is likely that they have a more complex relationship between rainfall events and river water level.
The impact of rainfall on flood events can be assessed using the rainfall distribution of pre-flood rainfall for each monitoring station, calculating the total rainfall in the 6 h leading up to the flood events, and the river water level for each location exceeds its 90th percentile, as shown in (Figure 19). Cileungsi, Cikeas, and P2C tend to have higher rainfall accumulation compared to others, and the highest mean rainfall before floods, i.e., around 50.46 (Cileungsi), 18.72 (Cikeas), and 31.23 (P2C), respectively, suggesting that the strong precursors for flooding at these stations originate from heavy rainfall. In contrast, Cibinong, PGP, and PML show much lower averages, i.e., 4.52 (Cibinong), 6.51 (PGP), and 5.29 (PML), implying that flood events may be triggered not only from heavy rainfall but also by other factors such as upstream flow, catchment conditions, environment, etc.

3.4. The Influence of Land Cover Changes on the Intensification of Inundation Area

Figure 20 shows that the agriculture and built-up areas are the most dominant LC in the Bekasi River Basin throughout all observed years, maintaining a coverage area above 500 km2. Agriculture is located in the upstream and downstream parts of the river basin; meanwhile, built-up areas are in the upstream and middle-stream. Agriculture gradually decreased from 854.69 km2 in 2015 to 703.08 km2 in 2024. In contrast, built-up areas progressively increased from 2015 until 2024, from 492.40 km2 to 578.34 km2, indicating rapid urban expansion over the Bekasi River Basin within nine years. This increase is the most dominant in the Southern and Central parts of the area, where urban and residential development are densely concentrated. Forest and plantation areas are located upstream, which are mountainous regions of Bogor. Forest increased from 31.86 km2 in 2015 to 51.47 km2 in 2024 (about 62%), while for the plantation, it was relatively stable from 2015 to 2022 (0.86 km2) and increased in 2024 (6.21 km2). Bare land and water body have a similar pattern, bare land significantly increased from 2015 to 2024 (about 418%), and water body increase by about 36%. The total land cover area for each period is shown in Table 6.
The trend in land cover changes and its impact on the inundation area can be shown in Figure 21. In general, the development of the bare land, built-up, and water body areas leads to an increase in the area of inundation. Conversely, the increase in the agricultural area can reduce the extent of flood inundation. However, even though the forest and plantation areas slightly increased, it resulted in an increase in the inundation area. This is likely due to the location of the forest and plantation are in the mountainous region of Bogor (upstream area) and the total change in the area is relatively small, therefore the flood-affected areas in the middle and downstream parts are not influenced by this changing, rather than the increased number in bare land and built-up area which are mostly located in the middle and downstream regions.

4. Discussion

Severe flood disasters have occurred during the past decade over Bekasi River Basin, resulting in significant losses of both damaged materials and psychological impacts. During the past decade, floods have occurred more frequently, roughly every 2–3 years since 2016, in this region. This highlights the importance of studying the causes of these floods and the need for an appropriate flood modeling approach to accurately simulate regions prone to flooding and minimize the risks associated with floods. The RRI model is used in this study, and it has been widely used and considered to be effective in simulating flash-flood events and streamflow [26,76], as well as real-time flood prediction [41]. Based on the simulation results of the RRI model, the 5-year flood event has become worse recently, shown by the coverage of the inundation area, which becomes spatially wider and deeper in 2025 compared to 2016 and 2020.
The severe flood events during 5-year periods were primarily triggered by heavy and/or extreme rainfall over the Bekasi River Basin, which increases year-by-year, exacerbated by other factors such as upstream flow, catchment conditions, environment, etc. In upstream areas such as Cileungsi, Cikeas, and P2C, they tend to have higher rainfall accumulation. This suggests that the strong precursors for flooding at these stations emanated from rainfall [77,78], similar to the previous result, which used simulated RRI over West Sumatra [79] and Thailand [80]. Conversely, flooding in the middle and downstream area, i.e., PGP and PML, shows that it may be triggered not only by rainfall but also by other factors such as land cover changes. If the rainfall is concentrated only in the mountainous regions, it will affect the upstream and middle areas as described in 2016 and 2022. In contrast, if the rainfall is concentrated not only on the upstream but also propagated to the downstream area for view hours, then the flood-affected area became wider and the inundation became deeper, as occurred in 2020 and 2025, because it will be affected by transboundary flood propagation from Bogor (so called “Banjir Kiriman”) [81], and will be contributed to the very large communities and residential areas in the surrounding river basin as well. Compared with the inundation derived from Sentinel-1 data shows that the flood-affected area is mostly in the downstream area close to the river mouth/coastal regions and total area coverage is less than simulation results. Meanwhile, Sentinel-1 captured less flood-affected areas compared to the simulation results over the middle and upper-stream region. The possible reasons why the discrepancy occurs are as follows: the middle stream regions are mostly occupied by the tall, dense vertical buildings, causing the Sentinel’s radar beam to have difficulty fully observing the surface, due to beam blocking. As a result, the backscatter reduces and leads to the underestimation of the inundation. In contrast, in downstream regions, there are fewer tall buildings and more open flat surfaces, so that the radar signal can hit the water surfaces; consequently, the water surfaces can be observed clearly. However, in the downstream, the simulation underestimates the Sentinel-1; we speculate that in the downstream, small channels and drains may not be resolved by the model. Due to its coarse grid, the model cannot simulate. Additionally, the Sentinel-1 data was acquired outside the flood event period, it is possible that the river water had already flowed to downstream area, this resulted in the inundated area detected by Sentinel-1 being predominantly concentrated in the downstream, near the coastal and surrounding regions. However, our simulation generally aligns with the previous study, which found the vulnerability of Bekasi to flooding, especially in sloping areas and near rivers [82]. The Ministry of Health reported that several districts in Bekasi and the surrounding regions have experienced severe flooding, consistent with the simulation results, particularly in Jatiasih, Pondok Melati, and Pondok Gede.
This research shows differences in the time lag between rainfall and WL monitoring in the Bekasi River Basin, which indicates the occurrence of flooding. All monitoring stations have a positive time lag of under 1 day or within 24 h, which indicates the possibility of an increase in river water levels several hours after the rain event. At downstream stations, the difference in time lag indicates that runoff takes longer to reach, due to the integrated river flow from several tributaries. Meanwhile, the upstream stations demonstrate that there is a more complex relationship between rainfall events and river water levels, so that a more detailed study is required in the future, combined with a detailed investigation of changes in land cover and land slope.
Land cover changes have a strong link to flood events [83,84,85,86,87]. Increasing agricultural areas have resulted in a decrease in the inundation area. In contrast with the increase in bare land, built-up, and water body area, it has resulted in an increase in the flood-affected area over the Bekasi River Basin due to the reduced area of water absorption capacity. These conditions were exacerbated, particularly in the middle and downstream areas, where urban and residential areas have been widely developed. Consequently, it will reduce the infiltration capacity and increase surface runoff [88,89]. Our results show that land cover changes and flooded areas from 2015 to 2024 reveal a strong and negative correlation between land conversion and increasing flood vulnerability. Plantations have a very small proportion of the total land cover in the Bekasi River Basin. The data shows that the expansion of bare land has the strongest positive correlation (+0.84) with the size of the flooded area, indicating that non-vegetation significantly accelerates runoff and worsens flood extent. Concurrently, the built-up area experienced a substantial increase (over 85 km2) and showed a significant positive correlation (+0.45). This urbanization reduces the land’s water infiltration capacity and accelerates surface runoff, which is a primary driver of higher flood peaks. The corresponding sharp decline in agricultural land, which has a negative correlation (−0.62) with flooding, further suggests that agriculture can minimize flood risks due to its capability to absorb the water. Conversely, uncontrolled land conversion from agricultural land to other sectors, such as built-up areas, amplifies the overall flood risks in the region over the years. Our study has added to previous research by examining the contribution of land cover changes to the widespread and the severity of flooding, apart from drainage density and rainfall [89,90].
We acknowledge that this study has some caveats, particularly regarding the input datasets used in the model. These include the rainfall uncertainty of GSMaP due to its spatial resolution, which may not represent the true rainfall due to the highly localized nature of precipitation in the region. The model also does not account for complete urban drainage systems or tidal wave and backwater effects, especially near downstream of the Bekasi River Basin. As a result, the observed water levels do not fully match the simulations. The highly urbanized Bekasi River Basin contains numerous channels, gates, and pumping systems that are not well represented in the model. Consequently, the model performs better in capturing the general timing of floods rather than their magnitude.
We did not perform a detailed sensitivity analysis in this study—such as quantifying key sources of uncertainty (e.g., rainfall bias and timing, DEM vertical offset, or downstream boundary conditions). Nevertheless, the results remain generally plausible in capturing the main features of water level and discharge during flood events. In the future, the use of high spatial (1 km) and temporal (10 min) resolution X-band Doppler radar rainfall data is required, as it could improve the model’s accuracy.
This study demonstrates that an early warning system can be implemented by integrating 6 h rainfall data accumulation as a strong flood precursor. Our quantitative results show that flooding events at Cileungsi, Cikeas, and P2C station are strongly associated with the 6 h cumulative rainfall with the intensity ≥30 mm. In addition, this study can identify the rainfall threshold that leads to severe flooding. The findings indicate that when rainfall intensity exceeds 150 mm/day, it can cause a flood with a depth of over 1 m; conversely, rainfall intensities below 100 mm/day may lead to shallow flooding with an inundation depth under 0.5 m or below knee-level. This threshold can be used as an initial warning and to mitigate the flood occurrence.

5. Conclusions

This study revealed that the flood disaster is not solely caused by heavy and/or extreme rainfall and its propagation, but also by environmental factors such as land cover change. This research indicated that the 5-year flood events occurred and the coverage area gradually increased year-by-year, due to the increase in rainfall and land cover changes, and the 5-year flood events were more catastrophic than in other years.
The accumulated average rainfall in the upstream areas was higher than in the downstream areas. Rainfall concentrated in the upstream areas (mountainous region) then propagated to the middle and downstream areas, occurring for several hours generating the flood-affected area became deeper. Rainfall over the Bekasi River Basin leads to a rapid increase in water level, especially at Cileungsi, Cikeas, and P2C stations, showing a response time of less than 6 h, demonstrating their high sensitivity to rainfall events. Moreover, when rainfall intensity surpasses the critical threshold of 150 mm/day, this can result in severe flooding with inundation depths exceeding 1 m in the middle and downstream areas.
The changes in land cover induce the flood-affected area to become wider due to a decrease in water absorption and infiltration capacity. Yet, the surface runoff increases. The decrease in agriculture and the expansion of built-up and bare land areas have affected inundation locations and depths more severely, particularly in the middle and downstream areas, where urban and residential development has occurred. Even though forests and plantations are increasing, their impact on reducing inundation has not significantly contributed. Since these land covers are mostly located in the upstream area and cover only small, fragmented areas. The 5-year changes of land cover over the Bekasi and surrounding regions have a big impact on flood severity.
Furthermore, the implementation of the RRI model offers significant operational advantages, particularly its ability to execute rapid, near-real-time simulations using continuously updated online data sources. The model’s capacity to process available data streams and generate timely outputs makes it particularly suitable for emergency response situations. The integration of real-time modeling with an understanding of environmental triggers facilitates improved early warning systems and preparedness measures. These capabilities enable both policymakers and local communities to utilize this information for effective flood mitigation in Bekasi and surrounding regions.
However, this study has several limitations. The available water level data was limited, making the model validation less comprehensive. In addition, the spatial resolution of satellite data used (GSMaP and Sentinel-1), and its accuracy, may not fully represent the true rainfall and inundation due to the highly localized nature of precipitation and data availability. These limitations highlight the need for a denser monitoring network and the utilization of Doppler weather radar data to enhance the model’s accuracy in future studies.

Author Contributions

Conceptualization, R.S.; methodology, F.M., R.S., L.S. and J.S.; software, F.M., E.G.A.S., H.P. and I.F.C.; validation, F.M., E.G.A.S., B.W., D.L.C. and B.S.; formal analysis, S.L., R.S., I.F.C., H.I.A. and A.W.R.; investigation, J.S., T.A.P., W. and H.P.; data curation, I.F.C., T.A.P., Y. and H.P.; writing—original draft preparation, F.M., J.S., A.W.R., I.F.C., E.G.A.S. and Y.; writing—review and editing, R.S., S.L., H.I.A. and L.S.; visualization, F.M., E.G.A.S., T.A.P., H.I.A., W. and B.S.; supervision, R.S., L.S. and S.L.; project administration, B.W. and D.L.C. All authors have read and agreed to the published version of the manuscript.

Funding

The research was funded by the National Research and Innovation Agency (BRIN) Indonesia under the 2023 Disaster Program House and the 2024 Hydrometeorological and Climate Disaster Monitoring Technology Prototype Program House of the Research Organization for Earth and Maritime [grant numbers No.2/III.4/HK/2023 and No.8/III.4/HK/2024].

Data Availability Statement

The original contributions presented in this study are included in the article. Further inquiries can be directed at the corresponding author.

Acknowledgments

We would like to express our gratitude to (1) The National Research and Innovation Agency (BRIN) and Research Organization for Earth and Maritime for funding support; (2) Komunitas Peduli Sungai Cileungsi Cikeas-KP2C (Cileungsi Cikeas River Care Community), Balai Besar Wilayah Sungai Ciliwung Cisadane (Ciliwung Cisadane River Basin Authority—Ministry of Public Works), Indonesian Ministry of Environment and Forestry (MoEF), Japan Aerospace Exploration Agency (JAXA) in collaboration with the National Institute of Information and Communications Technology (NICT), and Regional Disaster Management Agency (BPBD) of Bogor Regency, Bekasi Regency, Bekasi City, Depok City and Jakarta for providing data; (3) The Head of Research Center for Limnology and Water Resources for facilitating and supporting the research. We would like to extend our appreciation to the anonymous reviewer for their valuable input on this manuscript.

Conflicts of Interest

The authors declare no conflicts of interest.

Abbreviations

The following abbreviations are used in this manuscript:
RRIRainfall-Runoff Inundation
IMCIndonesian Maritime Continent
SSTSea Surface Temperature
ENSOEl-Niño Southern Oscillation
IODIndian Ocean Dipole
NSENash–Sutcliffe Efficiency
LCLand Cover
GSMaPGlobal Satellite Mapping of Precipitation
HEC-RASHydrologic Engineering Center-River Analysis System
IKNIbu Kota Nusantara
MoEFIndonesian Ministry of Environment and Forestry
JAXAJapan Aerospace Exploration Agency
ESAEuropean Space Agency
GPMGlobal Precipitation Measurement
BMKGBadan Meteorologi, Klimatologi dan Geofisika (Indonesian Agency for Meteorological, Climatological and Geophysics)
DEMDigital Elevation Model
HydroSHEDSHydrological data and maps based on SHuttle Elevation Derivatives at multiple Scales
SRTMShuttle Radar Topography Mission
WLWater Level
AWLRAutomatic Water Level Recorder
BBWSCCBalai Besar Wilayah Sungai Ciliwung Cisadane (Ciliwung Cisadane River Basin Authority—Ministry of Public Works)
KP2CKomunitas Peduli Sungai Cileungsi Cikeas (Cileungsi Cikeas River Care Community)
P2C Pertemuan Cileungsi Cikeas (Cileungsi Cikeas Meeting Point)
PGPPondok Gede Permai
PMLPondok Mitra Lestari
GEEGoogle Earth Engine
IWInterferometric Wide Swath
TOPSARTerrain Observation with Progressive Scanning SAR
VVVertical transmit—Vertical receive
VHVertical transmit—Horizontal receive
RMSERoot Mean Square Error
R2Coefficient of Determination
GISGeographic Information System
BPBDBadan Penanggulangan Bencana Daerah (Regional Disaster Management Agency)

Appendix A

Table A1. Data acquisition of Sentinel-1.
YearMonthDate
2016April
May
4, 7, 12, 28
13, 22, 25, 30
2020December 2019
January
29
2
2022February4, 8, 11, 16
2025February
March
19, 28
3, 12
Table A2. Inundation Location.
PeriodLocation (District)Source
2016Muara Gembong, East Bekasi, North Bekasi, Jatiasih, Pondok Melati, Babelan, Kedung Waringin, Gunung Putri, Cibarusah, Tambun Utara, Citeureup, Cileungsi, Babakan Madanghttps://pusatkrisis.kemkes.go.id/banjir-di-bekasi-jawa-barat-27-05-2016 (accessed on 8 April 2025)
https://www.tribunnews.com/metropolitan/2016/04/22/600-kk-terdampak-banjir-bekasi (accessed on 8 April 2025)
https://jakarta.bisnis.com/read/20160421/383/540338/bekasi-banjir-kata-warga-terbesar-sepanjang-2016 (accessed on 8 April 2025)
2020Jatiasih, West Bekasi, Rawa Lumbu, East Bekasi, North Bekasi, Medan Satria, South Bekasi, Pondok Gede, Mustika Jaya, Bantar Gebang, Babelan, Muara Gembong, Gunung Putrihttps://www.tempo.co/arsip/ini-puluhan-titik-banjir-di-kota-bekasi-ribuan-rumah-terendam--669056 (accessed on 10 April 2025)
https://pusatkrisis.kemkes.go.id/Banjir-di-BEKASI-JAWA-BARAT-01-01-2020-48 (accessed on 10 April 2025)
https://megapolitan.antaranews.com/berita/366793/banjir-bekasi-tersebar-di-20-titik-dan-tujuh-wilayah-kecamatan (accessed on 10 April 2025)
2022Jatiasih, Pondok Gede, East Bekasi, North Bekasi, South Bekasi, Medan Satria, Rawa Lumbu, Babelan, Tambun Utara, Gunung Putri, Muara Gembonghttps://www.liputan6.com/news/read/4890876/bpbd-bekasi-ada-13-titik-banjir-4958-jiwa-terdampak (accessed on 14 April 2025)
https://www.sonora.id/read/423147484/banjir-pertama-di-tahun-2022-kali-bekasi-meluap-sebabkan-8-kelurahan-tergenang-banjir-ada-yang-mencapai-2-m (accessed on 14 April 2025)
2025Rawalumbu, Pondok Gede, West Bekasi, Bantar Gebang, North Bekasi, South Bekasi, Jatiasih, East Bekasi, Bogor City, Bogor Regency, Depok City and Jakartahttps://pusatkrisis.kemkes.go.id/situation-report-banjir-kota-bekasi-tanggal-05-maret-2025 (accessed on 15 April 2025)
https://bekasikota.go.id/detail/rakor-evaluasi-banjir-kota-bekasi-bahas-pemulihan-pasca-banjir (accessed on 15 April 2025)
BPBD Bogor Regency, Bekasi Regency, Bekasi City, Depok City, Jakarta
Table A3. Statistical Description for Figure 17.
DepthTotal DataMeanMedianStdMinMax
10–30 cm3304115.71100.7550.190227.87
30–50 cm580140.8148.8648.40227.58
50–100 cm287168.93178.8137.0262.06227.62
100–300 cm94187.02187.617.7589.42216.32
>300 cm14187.96187.334.15181.25196.65
Table A4. Statistical Description for Figure 19.
StationTotal EventMeanStd DevMinQ1MedianQ3Max
Cibinong194.7413.550001.3656.37
Cileungsi2448.7540.25023.6139.663.55136.47
Cikeas2424.8331.08003.4647.12103.14
P2C2436.6736.5800.3432.7658.22103.14
PGP246.1713.99000.493.2654.1
PML244.7110.390003.5241.18
Figure A1. Daily rainfall accumulation over Bekasi River Basin during four major flood events.
Resources 14 00169 g0a1
Figure A2. Daily rainfall accumulation over Bekasi River Basin in 2016 (left) and 2020 (right).
Resources 14 00169 g0a2
Figure A3. Daily rainfall accumulation over Bekasi River Basin in 2022 (left) and 2025 (right).
Resources 14 00169 g0a3
Figure A4. Total inundation area over Bekasi River Basin, derived from RRI Model and Sentinel-1.
Resources 14 00169 g0a4

References

  1. Yuanita, C.N.; Sagala, S. Blue-Green Infrastructure in Jakarta’s Fringe: An Analysis of Accessibility to Blue-Green Spaces as a Flood Solution in Bekasi City. Int. J. Disaster Risk Reduct. 2025, 121, 105425. [Google Scholar] [CrossRef]
  2. Cea, L.; Costabile, P. Flood Risk in Urban Areas: Modelling, Management and Adaptation to Climate Change. A Review. Hydrology 2022, 9, 50. [Google Scholar] [CrossRef]
  3. Rajkhowa, S.; Sarma, J. Climate Change and Flood Risk, Global Climate Change. In Global Climate Change; Elsevier: Amsterdam, The Netherlands, 2021; pp. 321–339. [Google Scholar] [CrossRef]
  4. Adikari, Y.; Osti, R.; Noro, T. Flood-related Disaster Vulnerability: An Impending Crisis of Megacities in Asia. J. Flood Risk Manag. 2010, 3, 185–191. [Google Scholar] [CrossRef]
  5. Shivaprasad Sharma, S.V.; Parth Sarathi, R.; Chakravarthi, V.; Srinivasa Rao, G. Flood Risk Assessment Using Multi-Criteria Analysis: A Case Study from Kopili River Basin, Assam, India. Geomat. Nat. Hazards Risk 2018, 9, 79–93. [Google Scholar] [CrossRef]
  6. Warsono, A. Bekasi Floods Worst in City’s History. Available online: https://en.tempo.co/read/764994/bekasi-floods-worst-in-citys-history (accessed on 10 March 2025).
  7. Sihombing, Y.I.; Rizaldi, A.; Farid, M.; Januriyadi, N.F.; Moe, I.R. Jakarta’s 2020 New Year Flood Assessment with a Rainfall–Runoff–Inundation (RRI) Model. Environ. Sci. Proc. 2023, 25, 100. [Google Scholar] [CrossRef]
  8. Human Initiative. Current Condition of Floods Submerdging 8 Urban Villages in Bekasi. Available online: https://human-initiative.org/current-condition-of-floods-submerdging-8-urban-villages-in-bekasi/?lang=en#:~:text=Initiator (accessed on 10 March 2025).
  9. Dhany, F.W.W. Bekasi River Overflow Paralyzes Bekasi City. Available online: https://www.kompas.id/artikel/en-luapan-kali-bekasi-lumpuhkan-kota-bekasi (accessed on 10 March 2025).
  10. Warsono, A. Mall in Bekasi Paralyzed as Floods Reach 2 Meters High. Available online: https://en.tempo.co/read/1982429/mall-in-bekasi-paralyzed-as-floods-reach-2-meters-high (accessed on 10 March 2025).
  11. Kurniawan, P. Widespread Flooding Paralyzes Public Activities: Bekasi Mayor. Available online: https://en.antaranews.com/news/347061/widespread-flooding-paralyzes-public-activities-bekasi-mayor (accessed on 10 March 2025).
  12. Bekasi Regency Central Bureau of Statistics. Total Population by Age Group and Sex in Bekasi Regency. 2024. Available online: https://bekasikab.bps.go.id/id/statistics-table?subject=519 (accessed on 10 March 2025).
  13. Rachmat, F.B.; Muhammad, H. Analysis of Land Use Changes to the Criticality Level of the Catchment Area in Eight Watersheds That Flow into Jakarta Bay, Indonesia. E3S Web Conf. 2018, 73, 03001. [Google Scholar] [CrossRef]
  14. Owuor, M.O.; Mwiturubani, D.A. Nexus between Flooding Impacts and Coping Strategies in Nairobi’s Settlements. Int. J. Disaster Risk Reduct. 2021, 64, 102480. [Google Scholar] [CrossRef]
  15. Agonafir, C.; Lakhankar, T.; Khanbilvardi, R.; Krakauer, N.; Radell, D.; Devineni, N. A Review of Recent Advances in Urban Flood Research. Water Secur. 2023, 19, 100141. [Google Scholar] [CrossRef]
  16. Rahayu, R.; Mathias, S.A.; Reaney, S.; Vesuviano, G.; Suwarman, R.; Ramdhan, A.M. Impact of Land Cover, Rainfall and Topography on Flood Risk in West Java. Nat. Hazards 2023, 116, 1735–1758. [Google Scholar] [CrossRef]
  17. Zope, P.E.; Eldho, T.I.; Jothiprakash, V. Impacts of Land Use–Land Cover Change and Urbanization on Flooding: A Case Study of Oshiwara River Basin in Mumbai, India. Catena 2016, 145, 142–154. [Google Scholar] [CrossRef]
  18. Berhanu, B.; Seleshi, Y.; Demisse, S.; Melesse, A. Flow Regime Classification and Hydrological Characterization: A Case Study of Ethiopian Rivers. Water 2015, 7, 3149–3165. [Google Scholar] [CrossRef]
  19. Yin, J.; Yu, D.; Yin, Z.; Liu, M.; He, Q. Evaluating the Impact and Risk of Pluvial Flash Flood on Intra-Urban Road Network: A Case Study in the City Center of Shanghai, China. J. Hydrol. 2016, 537, 138–145. [Google Scholar] [CrossRef]
  20. Ertan, S.; Çelik, R.N. The Assessment of Urbanization Effect and Sustainable Drainage Solutions on Flood Hazard by GIS. Sustainability 2021, 13, 2293. [Google Scholar] [CrossRef]
  21. Lestari, S.; Sapan, E.G.A.; Sulistyowati, R.; Belgaman, H.A.; Meliani, F.; Winarno; Hapsari, R.I.; Cahyaningtiyas, I.F.; Pianto, T.A.; Akbar, H.I.; et al. Characteristic of Rain Rate Associated with Floods during the 2021 Rainy Season around Jakarta and Bekasi River. IOP Conf. Ser. Earth Environ. Sci. 2022, 1109, 012010. [Google Scholar] [CrossRef]
  22. Farid, M.; Pratama, M.I.; Kuntoro, A.A.; Adityawan, M.B.; Rohmat, F.I.W.; Moe, I.R. Flood Prediction Due to Land Cover Change in the Ciliwung River Basin. Int. J. Technol. 2022, 13, 356–366. [Google Scholar] [CrossRef]
  23. Ardiansyah, M.; Nugraha, R.A.; Iman, L.O.S.; Djatmiko, S.D. Impact of Land Use and Climate Changes on Flood Inundation Areas in the Lower Cimanuk Watershed, West Java Province. J. Ilmu Tanah Dan Lingkung. 2021, 23, 53–60. [Google Scholar] [CrossRef]
  24. Gu, Z.; Phakdimek, S.; Nagami, K.; Komori, D. Relationship Between Urbanization–Induced Land Use Changes and Flood Risk: Case Study in Chiang Mai, Thailand. Water 2025, 17, 327. [Google Scholar] [CrossRef]
  25. Handyastono, B.; Alghoul, M.A.; Rizki, A.; Djambek, N.P.; Kusuma, M.S.B.; Kuntoro, A.A.; Harlan, D.; Nugroho, E.O.; Munthe, H.M.; Hazmi, M.; et al. Flood Hazard Assessment in Pemaluan Village Due to Land Use Change in IKN (Ibu Kota Nusantara) as the New Capital City of Indonesia. Case Stud. Chem. Environ. Eng. 2025, 11, 101211. [Google Scholar] [CrossRef]
  26. Phyoe, P.P.; Uchida, T. Flood Simulation Studies with Rainfall-Runoff-Inundation (RRI) Model, Over Yangon City, Myanmar. Proc. IAHS 2024, 386, 115–120. [Google Scholar] [CrossRef]
  27. Zhou, C.; Zhou, L.; Du, J.; Yue, J.; Ao, T. Accuracy Evaluation and Comparison of GSMaP Series for Retrieving Precipitation on the Eastern Edge of the Qinghai-Tibet Plateau. J. Hydrol. Reg. Stud. 2024, 56, 102017. [Google Scholar] [CrossRef]
  28. Kumar, V.; Sharma, K.V.; Mangukiya, N.K.; Tiwari, D.K.; Ramkar, P.V.; Rathnayake, U. Machine Learning Applications in Flood Forecasting and Predictions, Challenges, and Way-out in the Perspective of Changing Environment. AIMS Environ. Sci. 2025, 12, 72–105. [Google Scholar] [CrossRef]
  29. Nevo, S.; Elidan, G.; Hassidim, A.; Shalev, G.; Gilon, O.; Nearing, G.; Matias, Y. ML-Based Flood Forecasting: Advances in Scale, Accuracy and Reach. arXiv 2020. [Google Scholar] [CrossRef]
  30. Try, S.; Tanaka, S.; Tanaka, K.; Sayama, T.; Oeurng, C.; Uk, S.; Takara, K.; Hu, M.; Han, D. Comparison of Gridded Precipitation Datasets for Rainfall-Runoff and Inundation Modeling in the Mekong River Basin. PLoS ONE 2020, 15, e0226814. [Google Scholar] [CrossRef] [PubMed]
  31. Sayama, T.; Ozawa, G.; Kawakami, T.; Nabesaka, S.; Fukami, K. Rainfall–Runoff–Inundation Analysis of the 2010 Pakistan Flood in the Kabul River Basin. Hydrol. Sci. J. 2012, 57, 298–312. [Google Scholar] [CrossRef]
  32. Nastiti, K.D.; An, H.; Kim, Y.; Jung, K. Large-Scale Rainfall–Runoff–Inundation Modeling for Upper Citarum River Watershed, Indonesia. Environ. Earth Sci. 2018, 77, 640. [Google Scholar] [CrossRef]
  33. Yamamoto, K.; Sayama, T.; Apip. Impact of Climate Change on Flood Inundation in a Tropical River Basin in Indonesia. Prog. Earth Planet. Sci. 2021, 8, 5. [Google Scholar] [CrossRef]
  34. Fitriyati, N.; Arifin, H.S.; Kaswanto; Marimin. Towards a Resilient and Sustainable City: New Paradigm of Flood Disaster Governance Study Case Bekasi City. Int. J. Sustain. Dev. Plan. 2024, 19, 3393–3404. [Google Scholar] [CrossRef]
  35. Patel, D.P.; Ramirez, J.A.; Srivastava, P.K.; Bray, M.; Han, D. Assessment of Flood Inundation Mapping of Surat City by Coupled 1D/2D Hydrodynamic Modeling: A Case Application of the New HEC-RAS 5. Nat. Hazards 2017, 89, 93–130. [Google Scholar] [CrossRef]
  36. Bisht, D.S.; Chatterjee, C.; Kalakoti, S.; Upadhyay, P.; Sahoo, M.; Panda, A. Modeling Urban Floods and Drainage Using SWMM and MIKE URBAN: A Case Study. Nat. Hazards 2016, 84, 749–776. [Google Scholar] [CrossRef]
  37. Yoshimoto, S.; Amarnath, G. Applications of Satellite-Based Rainfall Estimates in Flood Inundation Modeling—A Case Study in Mundeni Aru River Basin, Sri Lanka. Remote Sens. 2017, 9, 998. [Google Scholar] [CrossRef]
  38. Vojinovic, Z.; Hammond, M.; Golub, D.; Hirunsalee, S.; Weesakul, S.; Meesuk, V.; Medina, N.; Sanchez, A.; Kumara, S.; Abbott, M. Holistic Approach to Flood Risk Assessment in Areas with Cultural Heritage: A Practical Application in Ayutthaya, Thailand. Nat. Hazards 2016, 81, 589–616. [Google Scholar] [CrossRef]
  39. Sayama, T.; Tatebe, Y.; Iwami, Y.; Tanaka, S. Hydrologic Sensitivity of Flood Runoff and Inundation: 2011 Thailand Floods in the Chao Phraya River Basin. Nat. Hazards Earth Syst. Sci. 2015, 15, 1617–1630. [Google Scholar] [CrossRef]
  40. Tanaka, T.; Kiyohara, K.; Tachikawa, Y. Comparison of Fluvial and Pluvial Flood Risk Curves in Urban Cities Derived from a Large Ensemble Climate Simulation Dataset: A Case Study in Nagoya, Japan. J. Hydrol. 2020, 584, 124706. [Google Scholar] [CrossRef]
  41. San, Z.M.L.T.; Zin, W.W.; Kawasaki, A.; Acierto, R.A.; Oo, T.Z. Developing Flood Inundation Map Using RRI and SOBEK Models: A Case Study of the Bago River Basin, Myanmar. J. Disaster Res. 2020, 15, 277–287. [Google Scholar] [CrossRef]
  42. Rasmy, M.; Sayama, T.; Koike, T. Development of Water and Energy Budget-Based Rainfall-Runoff-Inundation Model (WEB-RRI) and Its Verification in the Kalu and Mundeni River Basins, Sri Lanka. J. Hydrol. 2019, 579, 124163. [Google Scholar] [CrossRef]
  43. Bhagabati, S.S.; Kawasaki, A. Consideration of the Rainfall-Runoff-Inundation (RRI) Model for Flood Mapping in a Deltaic Area of Myanmar. Hydrol. Res. Lett. 2017, 11, 155–160. [Google Scholar] [CrossRef]
  44. Cahyaningtiyas, I.F.; Djoharin, M.; Grace, T.; Eugenie, A.; Aviantie, E.; Amaliyah, R.; Sapan, E.G.A.; Meliani, F.; Sulistyowati, R.; Priyadi, H.; et al. Preliminary Study on the Rainfall-Runoff Inundation and Its Economic Lost at Bekasi River Basin, West Jawa. In Proceedings of the 2022 IEEE Asia-Pacific Conference on Geoscience, Electronics and Remote Sensing Technology (AGERS), Surabaya, Indonesia, 21–22 December 2022; IEEE: New York, NY, USA, 2022; pp. 162–168. [Google Scholar] [CrossRef]
  45. Kadri, T.; Kurniyaningrum, E. Impact of Land Use on Frequency of Floods in Upper Bekasi Watershed, Indonesia. Int. J. Sci. Technol. Res. 2019, 8, 3328–3334. [Google Scholar]
  46. Effendi, H.; Prayoga, G.; Azhar, A.R.; Permadi, T.; Santoso, E.N. Pollution Index of Cileungsi-Cikeas-Bekasi River. IOP Conf. Ser. Earth Environ. Sci. 2021, 744, 012015. [Google Scholar] [CrossRef]
  47. Prihartanto; Ganesha, D. Flood Time Arrival Estimation Based on Empirical Analysis of Recorded Data of Flood Early Warning System in Bekasi City. J. Sains Teknol. Mitigasi Bencana 2019, 14, 8–15. [Google Scholar]
  48. Kadri, T.; Sinukaban, N.; Pawitan, H.; Darma Tarigan, S. Analysis of Bekasi City Flood Reduction Using Watershed Management. Forum Pascasarj. 2011, 34, 1–11. [Google Scholar]
  49. Yuwono, R.A. Aplikasi Fast Fourier Transform untuk Menentukan Periode Maksimum Curah Hujan: Studi Kasus di Stasiun Klimatologi BMKG Bogor. Ph.D. Thesis, Universitas Brawijaya, Malang, Indonesia, 2020. [Google Scholar]
  50. Fatkhuroyan; TrinahWati. Accuracy Assessment of Global Satellite Mapping of Precipitation (GSMaP) Product Over Indonesian Maritime Continent. IOP Conf. Ser. Earth Environ. Sci. 2018, 187, 012060. [Google Scholar] [CrossRef]
  51. Fu, Q.; Ruan, R.; Liu, Y. Accuracy Assessment of Global Satellite Mapping of Precipitation (GSMaP) Product over Poyang Lake Basin, China. Procedia Environ. Sci. 2011, 10, 2265–2271. [Google Scholar] [CrossRef]
  52. Lu, D.; Yong, B. A Preliminary Assessment of the Gauge-Adjusted Near-Real-Time GSMaP Precipitation Estimate over Mainland China. Remote Sens. 2020, 12, 141. [Google Scholar] [CrossRef]
  53. Setiawati, M.D.; Miura, F. Evaluation of GSMaP Daily Rainfall Satellite Data for Flood Monitoring: Case Study—Kyushu Japan. J. Geosci. Environ. Prot. 2016, 4, 101–117. [Google Scholar] [CrossRef]
  54. Sofiati, I.; Avia, L.Q. Analysis of Rainfall Data Based on GSMaP and TRMM towards Observations Data in Yogyakarta. IOP Conf. Ser. Earth Environ. Sci. 2018, 166, 012031. [Google Scholar] [CrossRef]
  55. Sulistyowati, R.; Meliani, F.; Sapan, E.G.A.; Winarno; Lestari, S.; Hapsari, R.I.; Cahyaningtiyas, I.F.; Avianti, E.; Eugenie, A.; Grace, T.; et al. Distributed Flood Simulation Based on Satellite Rainfall Data at the Ciliwung River Basin, Jawa, Indonesia. IOP Conf. Ser. Earth Environ. Sci. 2023, 1127, 012025. [Google Scholar] [CrossRef]
  56. Helda, N.; Nashrullah, E.; Wijayanto, M.R.; Noralamsyah, M.; Jannah, N.; Erisa, E.; Saputri, D.S. Evaluation of GSMap (Global Satellite Mapping of Precipitation) with the Reference to Rain Gauge Observations in Banjarbaru City, Indonesia. IOP Conf. Ser. Earth Environ. Sci. 2024, 1343, 012005. [Google Scholar] [CrossRef]
  57. BMKG. Press Release Kondisi Cuaca Ekstrem Dan Iklim Tahun 2010–2011; BMKG: Jakarta, Indonesia, 2010. [Google Scholar]
  58. Lehner, B.; Verdin, K.; Jarvis, A. New Global Hydrography Derived From Spaceborne Elevation Data. Eos Trans. Am. Geophys. Union 2008, 89, 93–94. [Google Scholar] [CrossRef]
  59. Abdel-Fattah, M.; Kantoush, S.A.; Saber, M.; Sumi, T. Rainfall-Runoff Modeling for Extreme Flash Floods in Wadi Samail, Oman. J. Jpn. Soc. Civ. Eng. (Hydraul. Eng.) 2018, 74, 691–696. [Google Scholar] [CrossRef] [PubMed]
  60. Sulistyowati, R.; Meliani, F.; Winarno; Belgaman, H.A.; Syamsudin, F. Flood Early Warning System (FEWS) Based on Weather Radar Observation at Ciliwung River Basin: Preliminary Study. In Proceedings of the 2020 IEEE Asia-Pacific Conference on Geoscience, Electronics and Remote Sensing Technology (AGERS), Jakarta, Indonesia, 7–8 December 2020; IEEE: New York, NY, USA, 2020; pp. 98–101. [Google Scholar] [CrossRef]
  61. Torres, R.; Snoeij, P.; Geudtner, D.; Bibby, D.; Davidson, M.; Attema, E.; Potin, P.; Rommen, B.; Floury, N.; Brown, M.; et al. GMES Sentinel-1 Mission. Remote Sens. Environ. 2012, 120, 9–24. [Google Scholar] [CrossRef]
  62. Tarpanelli, A.; Mondini, A.C.; Camici, S. Effectiveness of Sentinel-1 and Sentinel-2 for Flood Detection Assessment in Europe. Nat. Hazards Earth Syst. Sci. 2022, 22, 2473–2489. [Google Scholar] [CrossRef]
  63. Twele, A.; Cao, W.; Plank, S.; Martinis, S. Sentinel-1-Based Flood Mapping: A Fully Automated Processing Chain. Int. J. Remote Sens. 2016, 37, 2990–3004. [Google Scholar] [CrossRef]
  64. Sayama, T.; Tatebe, Y.; Tanaka, S. An Emergency Response-type Rainfall-runoff-inundation Simulation for 2011 Thailand Floods. J. Flood Risk Manag. 2015, 10, 65–78. [Google Scholar] [CrossRef]
  65. Nastiti, K.D.; Kim, Y.; Jung, K.; An, H. The Application of Rainfall-Runoff-Inundation (RRI) Model for Inundation Case in Upper Citarum Watershed, West Java-Indonesia. Procedia Eng. 2015, 125, 166–172. [Google Scholar] [CrossRef]
  66. Try, S.; Lee, G.; Yu, W.; Oeurng, C.; Jang, C. Large-Scale Flood-Inundation Modeling in the Mekong River Basin. J. Hydrol. Eng. 2018, 23, 05018011. [Google Scholar] [CrossRef]
  67. Sayama, T. Rainfall-Runoff-Inundation (RRI) Model (updated version); Kyoto University: Kyoto, Japan, 2022. [Google Scholar]
  68. Chow, V.T. Open Channel Hydraulics; McGraw-Hill: New York, NY, USA, 1959; ISBN 07-010776-9. [Google Scholar]
  69. Kouzehgar, K.; Eslamian, S. Application of Experimental Data and Soft Computing Techniques in Determining the Outflow and Breach Characteristics in Embankments and Landslide Dams. In Handbook of Hydroinformatics; Elsevier: Amsterdam, The Netherlands, 2023; pp. 11–31. [Google Scholar] [CrossRef]
  70. Liu, H.; Li, Q.; Yu, D.; Gu, Y. Air Quality Index and Air Pollutant Concentration Prediction Based on Machine Learning Algorithms. Appl. Sci. 2019, 9, 4069. [Google Scholar] [CrossRef]
  71. Ramachandran, K.M.; Tsokos, C.P. Mathematical Statistics with Applications; Elsevier Academic Press: Burlington, MA, USA, 2009. [Google Scholar]
  72. Xu, H.; Deng, Y. Dependent Evidence Combination Based on Shearman Coefficient and Pearson Coefficient. IEEE Access 2018, 6, 11634–11640. [Google Scholar] [CrossRef]
  73. Murodi, E.H. Banjir di BEKASI, JAWA BARAT, 27-05-2016. Available online: https://pusatkrisis.kemkes.go.id/banjir-di-bekasi-jawa-barat-27-05-2016 (accessed on 8 April 2025).
  74. Warsono, A. Ini Puluhan Titik Banjir di Kota Bekasi, Ribuan Rumah Terendam. Available online: https://www.tempo.co/arsip/ini-puluhan-titik-banjir-di-kota-bekasi-ribuan-rumah-terendam--669056 (accessed on 10 April 2025).
  75. Tim Diskominfostandi. Rakor Evaluasi Banjir Kota Bekasi Bahas Pemulihan Pasca-Banjir. Available online: https://bekasikota.go.id/detail/rakor-evaluasi-banjir-kota-bekasi-bahas-pemulihan-pasca-banjir (accessed on 15 April 2025).
  76. Abdelmoneim, H.; Eldardiry, H.; Saber, M.; Kantoush, S.A.; Moghazy, H.M.; Sumi, T. Integrating Multi-Sensor Observations and Rainfall-Runoff Inundation Modeling for Mapping Flood Extents over the Nile River Basin: Example from the 2020 Flooding in Sudan. Geocarto Int. 2023, 38, 2197504. [Google Scholar] [CrossRef]
  77. Pakoksung, K.; Takagi, M. Effect of Satellite Based Rainfall Products on River Basin Responses of Runoff Simulation on Flood Event. Model. Earth Syst. Environ. 2016, 2, 143. [Google Scholar] [CrossRef]
  78. Priyambodoho, B.A.; Kure, S.; Yagi, R.; Januriyadi, N.F. Flood Inundation Simulations Based on GSMaP Satellite Rainfall Data in Jakarta, Indonesia. Prog. Earth Planet. Sci. 2021, 8, 34. [Google Scholar] [CrossRef]
  79. Arlis, A.P.; Farid, M.; Wahid, A.N.; Suryadi, Y.; Kuntoro, A.A. Prediction of Flooding Area in Batang Sinamar River Basin Based on Design Return Period Simulation by Using Rainfall Runoff Inundation Model. Environ. Sci. Proc. 2023, 25, 91. [Google Scholar] [CrossRef]
  80. Pakoksung, K. Impact of Spatial Rainfall Scenarios on River Basin Runoff Simulation a Nan River Basin Study Using the Rainfall-Runoff-Inundation Model. Eng 2023, 5, 51–69. [Google Scholar] [CrossRef]
  81. Sulistyowati, R.; Hapsari, R.I.; Syamsudin, F.; Mori, S.; Oishi, S.T.; Yamanaka, M.D. Rainfall-Driven Diurnal Variations of Water Level in the Ciliwung River, West Jawa, Indonesia. SOLA 2014, 10, 141–144. [Google Scholar] [CrossRef]
  82. Damayanti, A.; Dwiputra, N.A. Flood Exposure of Settlement Areas in Bekasi City. IOP Conf. Ser. Earth Environ. Sci. 2019, 248, 012054. [Google Scholar] [CrossRef]
  83. Moe, I.R.; Kure, S.; Januriyadi, N.F.; Farid, M.; Udo, K.; Kazama, S.; Koshimura, S. Future Projection of Flood Inundation Considering Land-Use Changes and Land Subsidence in Jakarta, Indonesia. Hydrol. Res. Lett. 2017, 11, 99–105. [Google Scholar] [CrossRef]
  84. Kure, S.; Yamada, T.; Kure, S.; Watanabe, A.; Akabane, Y.; Yamada, T. Field Observations of Discharge and Runoff Characteristics in Urban Catchments Area. 2008. Available online: https://www.researchgate.net/publication/267948338 (accessed on 9 July 2025).
  85. Moe, I.R.; Kure, S.; Farid, M.; Udo, K.; Kazama, S.; Koshimura, S. Evaluation of Flood Inundation in Jakarta Using Flood Inundation Model Calibrated by Radar Rainfall. J. Jpn. Soc. Civ. Eng. 2016, 72, I_1243–I_1248. [Google Scholar] [CrossRef]
  86. Pradiko, H.; Arwin; Soewondo, P.; Suryadi, Y. The Change of Hydrological Regime in Upper Cikapundung Watershed, West Java Indonesia. Procedia Eng. 2015, 125, 229–235. [Google Scholar] [CrossRef]
  87. Sugianto, S.; Deli, A.; Miswar, E.; Rusdi, M.; Irham, M. The Effect of Land Use and Land Cover Changes on Flood Occurrence in Teunom Watershed, Aceh Jaya. Land 2022, 11, 1271. [Google Scholar] [CrossRef]
  88. Zhou, Q.; Leng, G.; Su, J.; Ren, Y. Comparison of Urbanization and Climate Change Impacts on Urban Flood Volumes: Importance of Urban Planning and Drainage Adaptation. Sci. Total Environ. 2019, 658, 24–33. [Google Scholar] [CrossRef] [PubMed]
  89. Trihono, K. Analysis of Bekasi Watershed Erosion and Sedimentation Problem. IOP Conf. Ser. Mater. Sci. Eng. 2019, 620, 012030. [Google Scholar] [CrossRef]
  90. Pramesti Kameswara, A.S.; Suharjito. Analysis of Flood Disaster Risk Factors with Geographic Information System (GIS) and Analytical Hierarchy Process (AHP) Methods in Bekasi City, West Java, Indonesia. Int. J. Eng. Trends Technol. 2023, 71, 371–386. [Google Scholar] [CrossRef]
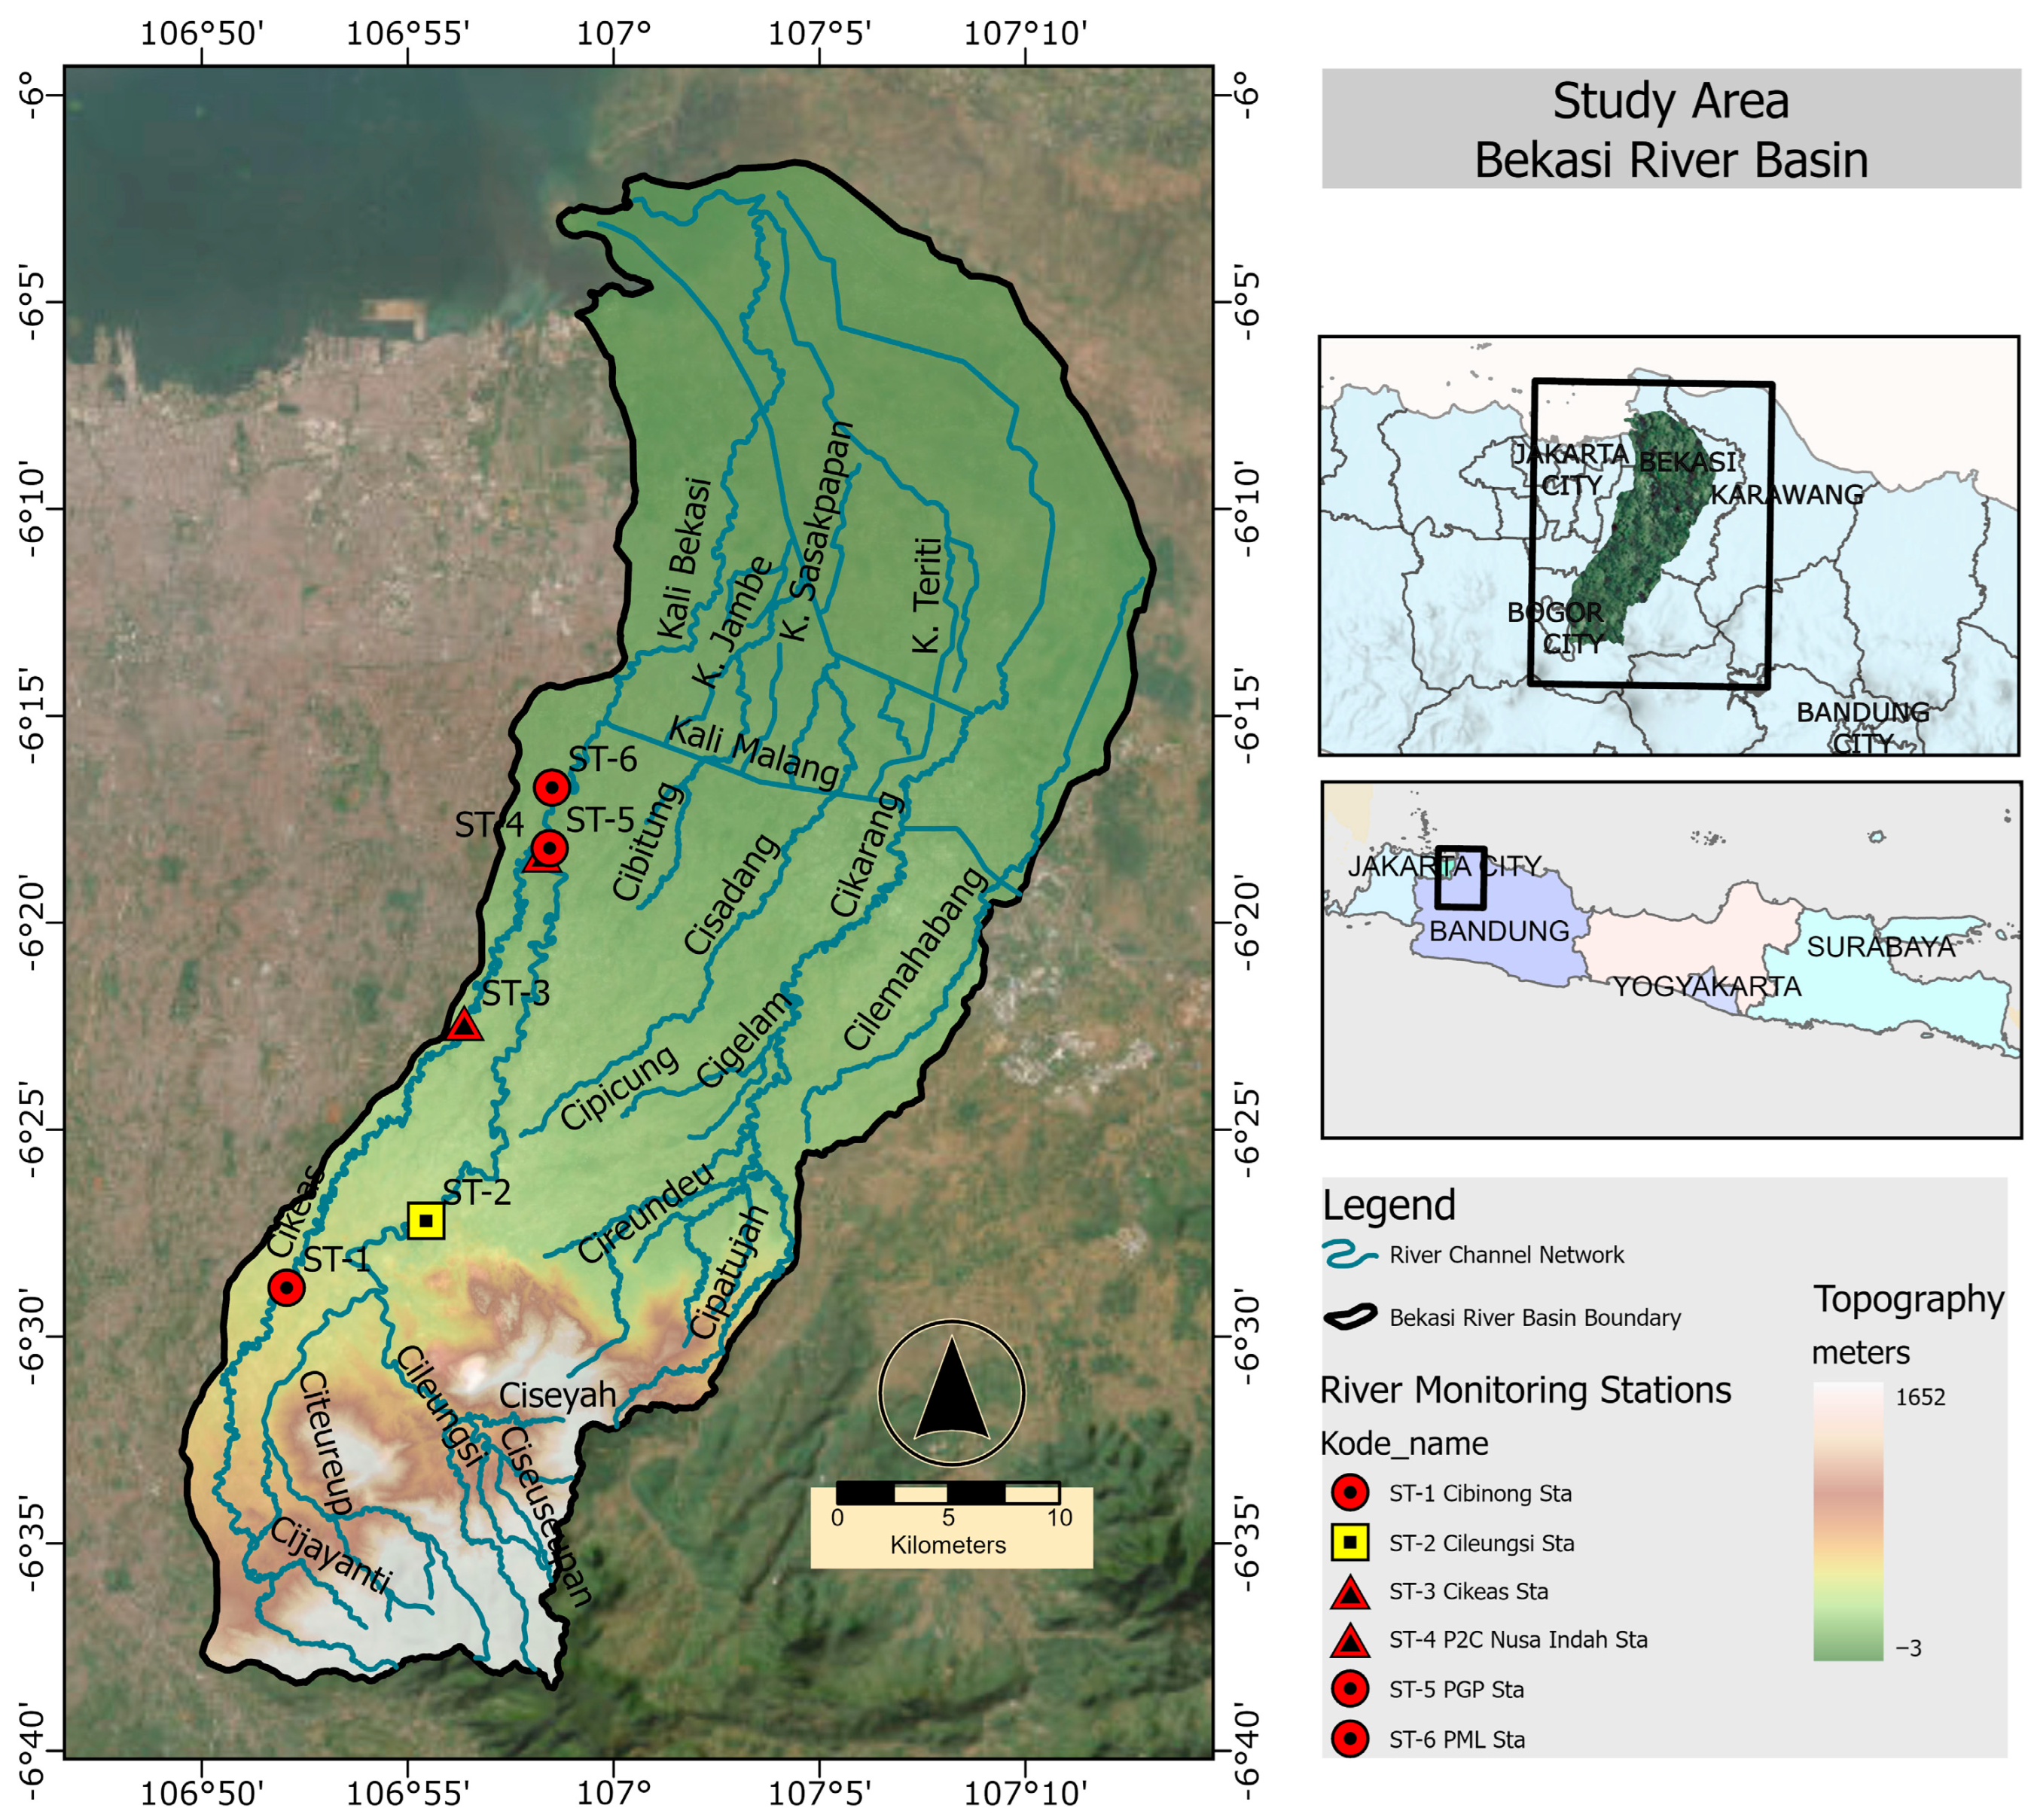
Figure 1. Study area of Bekasi River Basin and the location of river monitoring stations.
Resources 14 00169 g001
Figure 2. Research flow diagram.
Resources 14 00169 g002
Figure 3. RRI model framework diagram (modified from [39,64]).
Resources 14 00169 g003
Figure 4. Hourly rainfall intensity during four major flood events over the Bekasi River Basin.
Resources 14 00169 g004
Figure 5. GSMaP gridded rainfall area with the sequence of location number, red box refers to the location of maximum rainfall accumulation during four major flood events, the purple, brown, green, and dark-blue colored area refers to the sub-district flood location which are affected by four major flood events.
Resources 14 00169 g005
Figure 6. Average rainfall accumulation over Bekasi River Basin during 4 major flood events.
Resources 14 00169 g006
Figure 7. Coverage area of rainfall accumulates over Bekasi River Basin during 4 major flood events.
Resources 14 00169 g007
Figure 8. Latitude-cross section of rainfall propagation over Bekasi River Basin during 4 major flood events. Horizontal axis represented the flood period in (A) 2016, (B) 2020, (C) 2022, and (D) 2025, and the vertical axis represented the latitude-cross-section.
Resources 14 00169 g008
Figure 9. Hydrograph of rainfall and river water level at Cibinong Station, bars represent the rainfall amount, the dashed line represents WL Observation, and the solid line represents WL Simulation.
Resources 14 00169 g009
Figure 10. Hydrograph of rainfall and river water level at Cileungsi Station, bars represent the rainfall amount, the dashed line represents WL Observation, and the solid line represents WL Simulation.
Resources 14 00169 g010
Figure 11. Hydrograph of rainfall and river water level at Cikeas Station, bars represent the rainfall amount, the dashed line represents WL Observation, and the solid line represents WL Simulation.
Resources 14 00169 g011
Figure 12. Hydrograph of rainfall and river water level at P2C Station, bars represent the rainfall amount, the dashed line represents WL Observation, and the solid line represents WL Simulation.
Resources 14 00169 g012
Figure 13. Hydrograph of rainfall and river water level at PGP Station, bars represent the rainfall amount, the dashed line represents WL Observation, and the solid line represents WL Simulation.
Resources 14 00169 g013
Figure 14. Hydrograph of rainfall and river water level at PML Station, bars represent the rainfall amount, the dashed line represents WL Observation, and the solid line represents WL Simulation.
Resources 14 00169 g014
Figure 15. Simulated inundation depth for 4 major flood events, (a) 2016, (b) 2020, (c) 2022, and (d) 2025 over Bekasi River Basin.
Resources 14 00169 g015
Figure 16. Inundation location derived from Sentinel-1 data for 4 major flood events, (a) 2016, (b) 2020, (c) 2022, and (d) 2025 over Bekasi River Basin.
Resources 14 00169 g016
Figure 17. Rainfall distribution for each inundation depth over Bekasi River Basin (red line indicates median values, dot indicates outlier for each inundation depth) (Detailed statistical descriptions can be seen at Table A3).
Resources 14 00169 g017
Figure 18. Time lag difference between rainfall and river water level for all monitoring stations in the Bekasi River Basin over (A) a 3-day period and (B) a 1-day period.
Resources 14 00169 g018
Figure 19. The rainfall distribution of pre-flood rainfall for each monitoring station (yellow line indicates median values, color-dot indicates outlier for each WL Station, blue-box shows 25th–75th percentiles) (Detailed statistical descriptions can be seen at Table A4).
Resources 14 00169 g019
Figure 20. MoEF’s land cover classification over Bekasi River Basin corresponds to flood events period.
Resources 14 00169 g020
Figure 21. Land cover changes correspond to the inundation area over the Bekasi River Basin for each land cover classification (af), the scatter points represent the observed inundation depth and land cover data, while the regression line shows the predicted relationship between the two variables.
Resources 14 00169 g021
Table 1. Data sources.
VariableDataSourcePeriod
RainfallGSMaP
(0.1°~10 km)
Japan Aerospace Exploration Agency (JAXA) Global Rainfall Watch (https://sharaku.eorc.jaxa.jp/GSMaP/)
(accessed on 24 January 2025)
19–23 April 2016
31 December 2019–4 January 2020
15–19 February 2022
1–5 March 2025
Land CoverIndonesian Ministry of Environment and
Forestry (MoEF)
(~450 m)
2015, 2019, 2021, 2024
Digital Elevation ModelHydrological data and maps based on SHuttle Elevation Derivatives at multiple Scales
(HydroSHEDS)
(15 arc-seconds~450 m)
https://hydrosheds.org/hydrosheds-core-downloads
(accessed on 30 January 2025)
River Water LevelAutomatic Water Level Recorder (AWLR)Balai Besar Wilayah Sungai Ciliwung Cisadane (BBWSCC)2016, 2020, 2022
Komunitas Peduli Sungai Cileungsi Cikeas (KP2C)2020, 2022, 2025
InundationSentinel-1
(10 m)
European Space Agency (ESA)
Copernicus Programme
2016, 2020, 2022, 2025
Table 2. Rainfall intensity criteria in Indonesia.
CategoryRainfall Intensity
Light1.0–5.0 mm/hour or 5–20 mm/day
Moderate5.0–10 mm/hour or 20–50 mm/day
Heavy10–20 mm/hour or 50–100 mm/day
Very heavy/Extreme>20 mm/hour or >100 mm/day
Table 3. Data availability of AWLR from BBWSCC and KP2C.
No.StationsBBWSCCKP2C
201620202022202020222025
1Cibinong
2Cileungsi
3Cikeas
4P2C
5PGP
6PML
Table 4. RMSE and R2 between observed and simulated WL.
No.StationsRMSER2
20162020202220252016202020222025
1Cibinong 1.710.98 0.60 *0.09
2Cileungsi0.811.180.662.270.70 *0.75 *0.61 *0.39
3Cikeas 1.981.562.09 0.38 *0.100.53 *
4P2C 3.453.883.65 0.65 *0.410.47 *
5PGP 3.742.21 0.280.02
6PML0.943.451.74 0.250.250.48
All Stations0.882.511.682.720.40 *0.40 *0.16 *0.28
* 95% confidence level.
Table 5. Area of inundation derived from RRI Simulation and Sentinel-1.
No.DepthsInundation Area (km2)
(cm)2016202020222025
RRI results
110–30121.10194.2580.30324.51
230–5014.0237.839.3569.69
350–1001.487.651.0648.87
4100–300--0.4220.82
5>300---2.97
Total136.60239.7391.13466.86
Sentinel-1
Total11.9879.8125.1529.15
Table 6. Land Cover Area by Year.
No.Land Cover2015 (km2)2019 (km2)2021 (km2)2024 (km2)
1Agriculture 854.69764.80742.39703.08
2Bare Land7.4524.6321.1438.57
3Built-Up Area492.40565.06572.13578.34
4Forest31.8631.8651.4251.47
5Plantation0.890.800.806.21
6Water Body21.1621.3117.7828.68
Disclaimer/Publisher’s Note: The statements, opinions and data contained in all publications are solely those of the individual author(s) and contributor(s) and not of MDPI and/or the editor(s). MDPI and/or the editor(s) disclaim responsibility for any injury to people or property resulting from any ideas, methods, instructions or products referred to in the content.