Abstract
A comprehensive investigation of a highly complex petroleum refinery (Nelson complexity index of 10.7) during the processing of 11 crude oils and an imported atmospheric residue replacing the design Urals crude oil was performed. Various laboratory oil tests were carried out to characterize both crude oils, and their fractions. The results of oil laboratory assays along with intercriteria and regression analyses were employed to find quantitative relations between crude oil mixture quality and refining unit performance. It was found that the acidity of petroleum cannot be judged by its total acid number, and acid crudes with lower than 0.5 mg KOH/g and low sulphur content required repeated caustic treatment enhancement and provoked increased corrosion rate and sodium contamination of the hydrocracking catalyst. Increased fouling in the H-Oil hydrocracker was observed during the transfer of design Urals crude oil to other petroleum crudes. The vacuum residues with higher sulphur, lower nitrogen contents, and a lower colloidal instability index provide a higher conversion rate and lower fouling rate in the H-Oil unit. The regression equations developed in this work allow quantitative assessment of the performance of crucial refining units like the H-Oil, fluid catalytic cracker, naphtha reformer, and gas oil hydrotreatment based on laboratory oil test results.
Keywords:
crude oil; oil acidity; asphaltenes; PIONA; hydrocracking; FCC; intercriteria analysis; fouling 1. Introduction
Petroleum is a mineral source that satisfies about 30% of energy demand of human society, and it is expected to continue being the major supplier of energy for the next couple of decades [1]. The main consumer of petroleum is the transport sector [2]. Petroleum-based fuels drive our cars, trucks, trains, ships, and airplanes, which move passengers and goods supporting the economic development of society [3]. Despite the progress achieved in the processes, which has provided alternative fuels [4,5,6,7], petroleum fuels consumption is expected to grow by 8.7 million barrels per day in 2045 in comparison to 2022 [1]. These findings suggest that petroleum refining is and will be an important industrial branch that delivers energy products to support continual society development.
A petroleum refinery is designed to process crude oil with certain properties. These properties are used in the design phase to select material to construct equipment and chose the technological scheme considering different aspects of performance, energy efficiency, environmental protection, safety, and reliability. These properties define the hardware and technological limits of the refinery.
The oil refining experience has shown that processing of crude oil blends is more profitable than that of refinement of a single crude [8]. Having in mind that petroleum is an extraordinary complex mixture consisting of alkane, cycloalkane, and arene hydro-carbons with different molecular weights and heteroatom organic compounds containing nitrogen, sulphur, oxygen, and metals [9,10] with a great number of characteristics, inventing the proper crude acceptance matrix that takes into account all pitfalls of selecting the wrong crude oil is a real challenge. To improve profitability, refineries are trying to process blends resembling in their properties the design crude, which contain one or more cheaper crudes (opportunity crudes) [11]. The processing of petroleum mixtures can be accompanied by operational problems related to accelerated fouling [12,13,14], corrosion [15,16,17,18,19,20], equipment failure [21], catalyst deactivation [22,23,24], etc. Thus, the assumption that a refinery can refine economically favourable, environmentally friendly, and reliable petroleum crude blends whose characteristics are not too far away from the designed crude may be misleading [25].
In the LUKOIL Neftohim Burgas (LNB) refinery designed to process Urals crude oil, over the years (from 2010 to now) blends of Urals (Russia) with 27 crude oils from 17 different countries from Europe, Africa, Asia, and South and North America have been processed as the minimum content of Urals in the crude blend has been 50%. The processing of light crude oils like CPC (Kazakhstan; SG of 0.800) in an amount of about 25% in the crude blend along with Urals (SG of 0.8700), at a design throughput of crude distillation unit—1 (CDU-1), which was re-vamped in 2009, led to the rupture of the furnace coil in 2010, a year after the revamp. The root cause analysis revealed that the CDU-1 furnace coil was ruptured due to operation at 130% of the design heat duty of the furnace, while the design margin for the furnace is 10%; that is, 110% of the design heat duty of the furnace is allowable. Thus, the refinement of the light crude oil CPC in an amount of about 25% in the crude blend with the design petroleum Urals was found unsafe and unreliable indicating that the refinery hardware limits the process of crude selection.
In the transition to refine crude oil blends, which do not contain Urals, the LNB refinery started to experience different operational and performance issues. For a period of 61 days, the LNB refinery processed 11 crude oils and an imported atmospheric residue (AR) from Kirkuk crude oil in changing ratios: Urals, Light Siberian, KEBCO, CPC, BTV, BSP, NJS, Helm, Basrah Medium, Arab Light, Es Sider, and Kirkuk AR originating from Russia, Kazakhstan, South America, North Sea, Netherlands, Libya, and the Middle East. During their refining, signs of accelerated corrosion, an increased fouling rate in crude distillation units, and H-Oil ebullated bed vacuum residue in the hydrocracking unit appeared. Besides fouling and corrosion, another issue with a decrease in conversion in both high marginal processes, fluid catalytic cracking (FCC) and H-Oil hydrocracking, was registered during processing some specific crude oils in the LNB refinery. Intercriteria analysis (ICrA) evaluation and multiple regression analysis of the data from the operation of crude distillation, fluid catalytic cracking, H-Oil vacuum residue hydrocracking, and tank farm units was implemented to identify which crude oils may be responsible for the observed operational and performance issues.
The objective of this research is to analyse the performance of a petroleum refinery (LNB) during the transition to the replacement of design crude oil with other petroleum feedstocks, and to quantify the impact of each of the 12 processed oils on refinery performance using various laboratory oil tests, intercriteria, and regression analyses.
2. Materials and Methods
Eleven crude oils and an imported atmospheric residue incorporated into blends were processed in the LNB refinery during this study. Their main properties are summarized in Table 1. The methods used to measure petroleum features are shown in Table 1.

Table 1.
Characteristics of eleven crude oils processed in blends in the LNB refinery during this study.
The variation of content in all individual nine crudes in processed blends during this study is presented in Table 2. The data in Table 2 are calculated on the basis of quantities of processed individual crude oils divided by the total crude blend quantity processed each day. The accuracy of the different petroleum flow meters varies in the range 0.1–2.5%. Having in mind that several flow meters with different accuracy are employed, the exact total error (or standard deviation) is difficult to report on a commercial scale and insert into Table 2.

Table 2.
Alteration of weight percentages of each individual crude oil in the processed blend in the LNB refinery during the study.
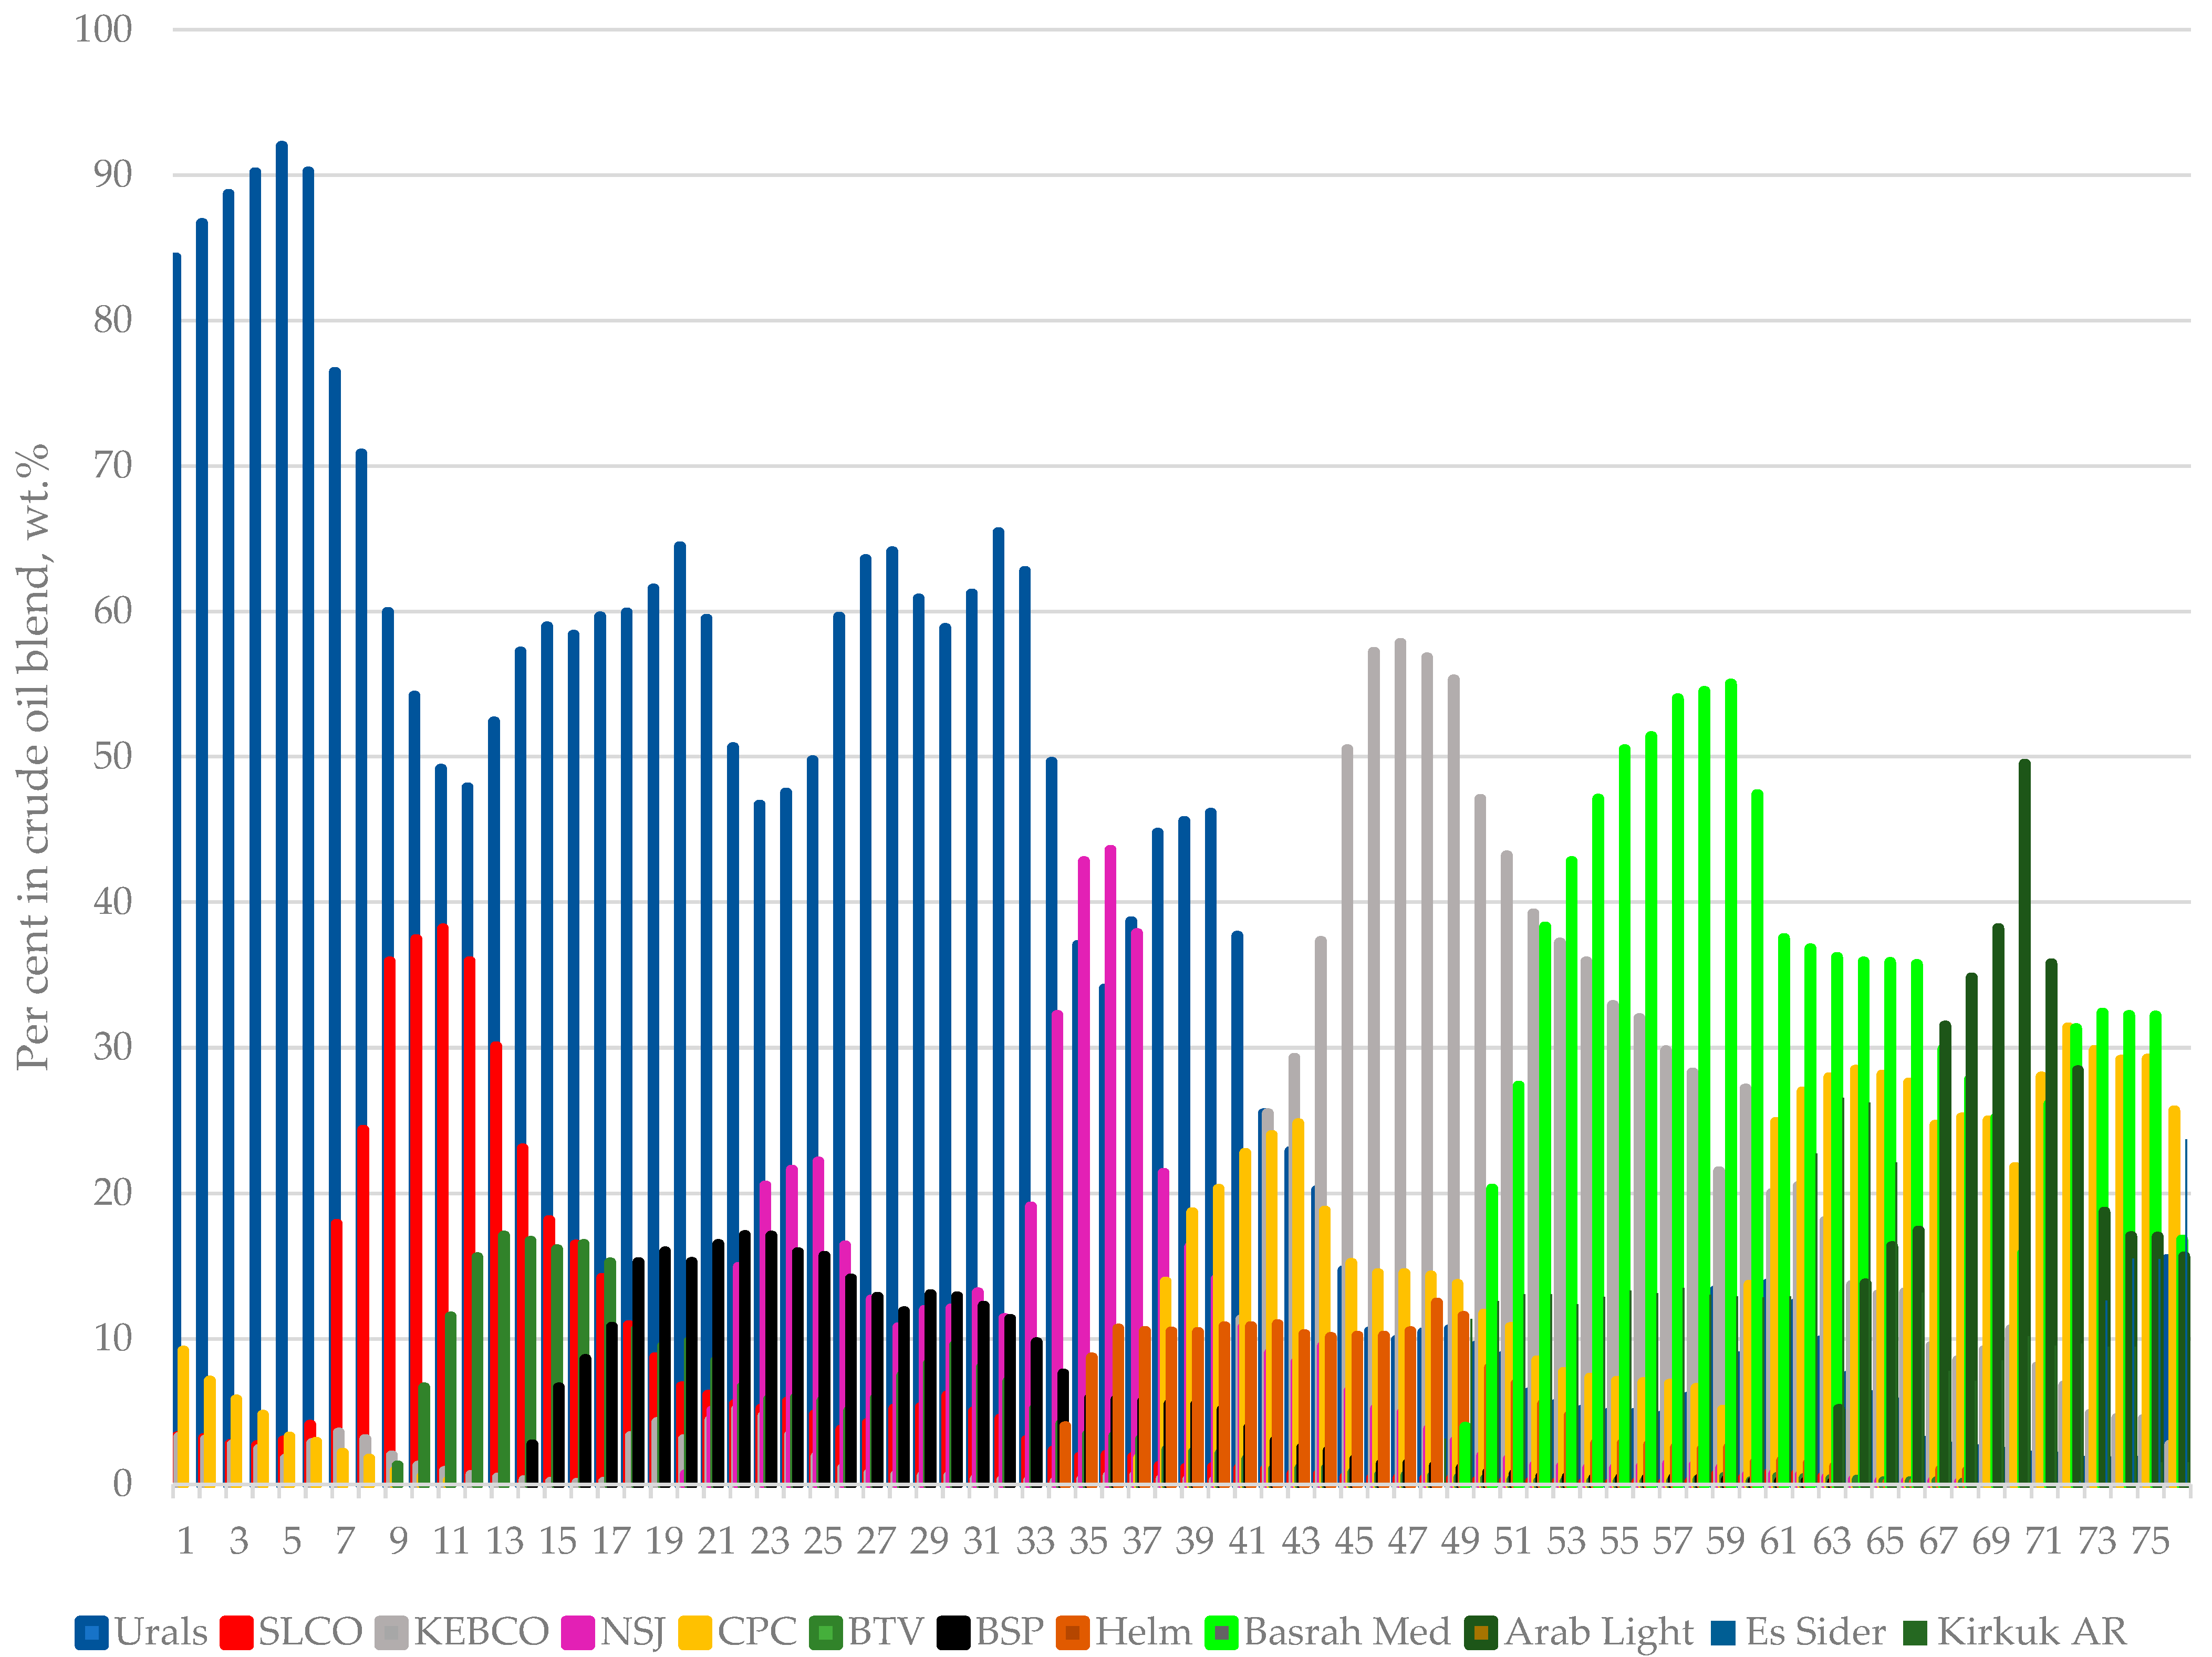
Figure 1 presents the composition variation of crude blends processed in the LNB refinery for the investigated period of 76 days. It shows how the design crude oil, Urals, is substituted by a number of diverse crude oils. The hydrocarbon composition of heavy naphtha fractions obtained with TBP fractionation of the eleven crude oils were analysed using the gas chromatography technique. To quantify the different compounds, gas chromatography equipped with a flame ionization detector was used. To identify the compounds in the fraction, gas chromatography/mass spectrometry was utilized.
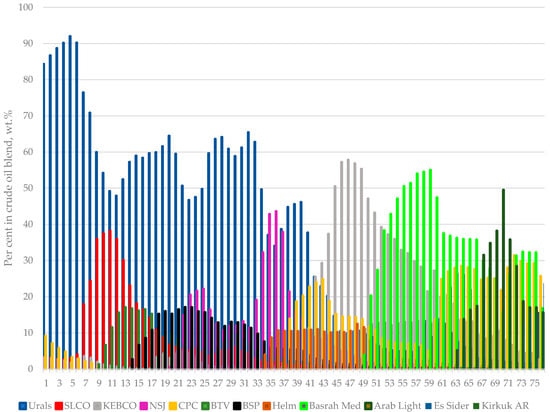
Figure 1.
Variation of individual crude oil content in the petroleum mixtures processed in the LNB refinery for the studied period of time of 76 days.
The cetane index of narrow 20 °C fractions boiling in the middle distillate range (180–360 °C) was calculated by using Equation (1) according to the standard ASTM D 976 [35].
- where the variables have the following representations:
- D15 = Density at 15 °C, g/cm3;
- T50 = Boiling point at 50% evaporate, °C.
The colloidal stability of crude oils and the compatibility of crude oil blends were assessed by using the procedure described by Nemana [36]. It determines the solvent power (SP) and the critical solvent power (Sp critical) of each crude oil by blending a petroleum sample with predetermined quantities of n-hepthane. For the purposes of the Nemana predictive compatibility model, the investigated crude oils and their mixtures with n-heptane were characterized for their distillation properties according to ASTM D 7169 [37]. The distillation data with density at 15 °C (d15) were used to calculate the Watson characterization factor (Kw) as shown in Equation (2).
The solvent power (Sp) of the crude oils was calculated as described in [36] and shown in Equation (3).
- where the variables have the following representations:
- Kco: characterization factor of crude oil;
- Khp: characterization factor of n-heptane = 12.72 [36];
- Kt: characterization factor of toluene = 10.15 [36].
The n-heptane dilution test was used for the determination of the critical solvent power of the crude oil using the point of initial sediment precipitation. The critical solvent power of each crude oil was estimated using Equation (3), but that the Kw of the blend petroleum/n-heptane at the point of initial sludge settling is used.
The linear mixing rule (Equation (4)) was used to estimate the solvent power of the petroleum blend (Sp blend).
The petroleum blend is considered compatible when the Sp blend is greater than the maximum value of the critical solvent power of the crude oils that are blended (Equation (5)) [38].
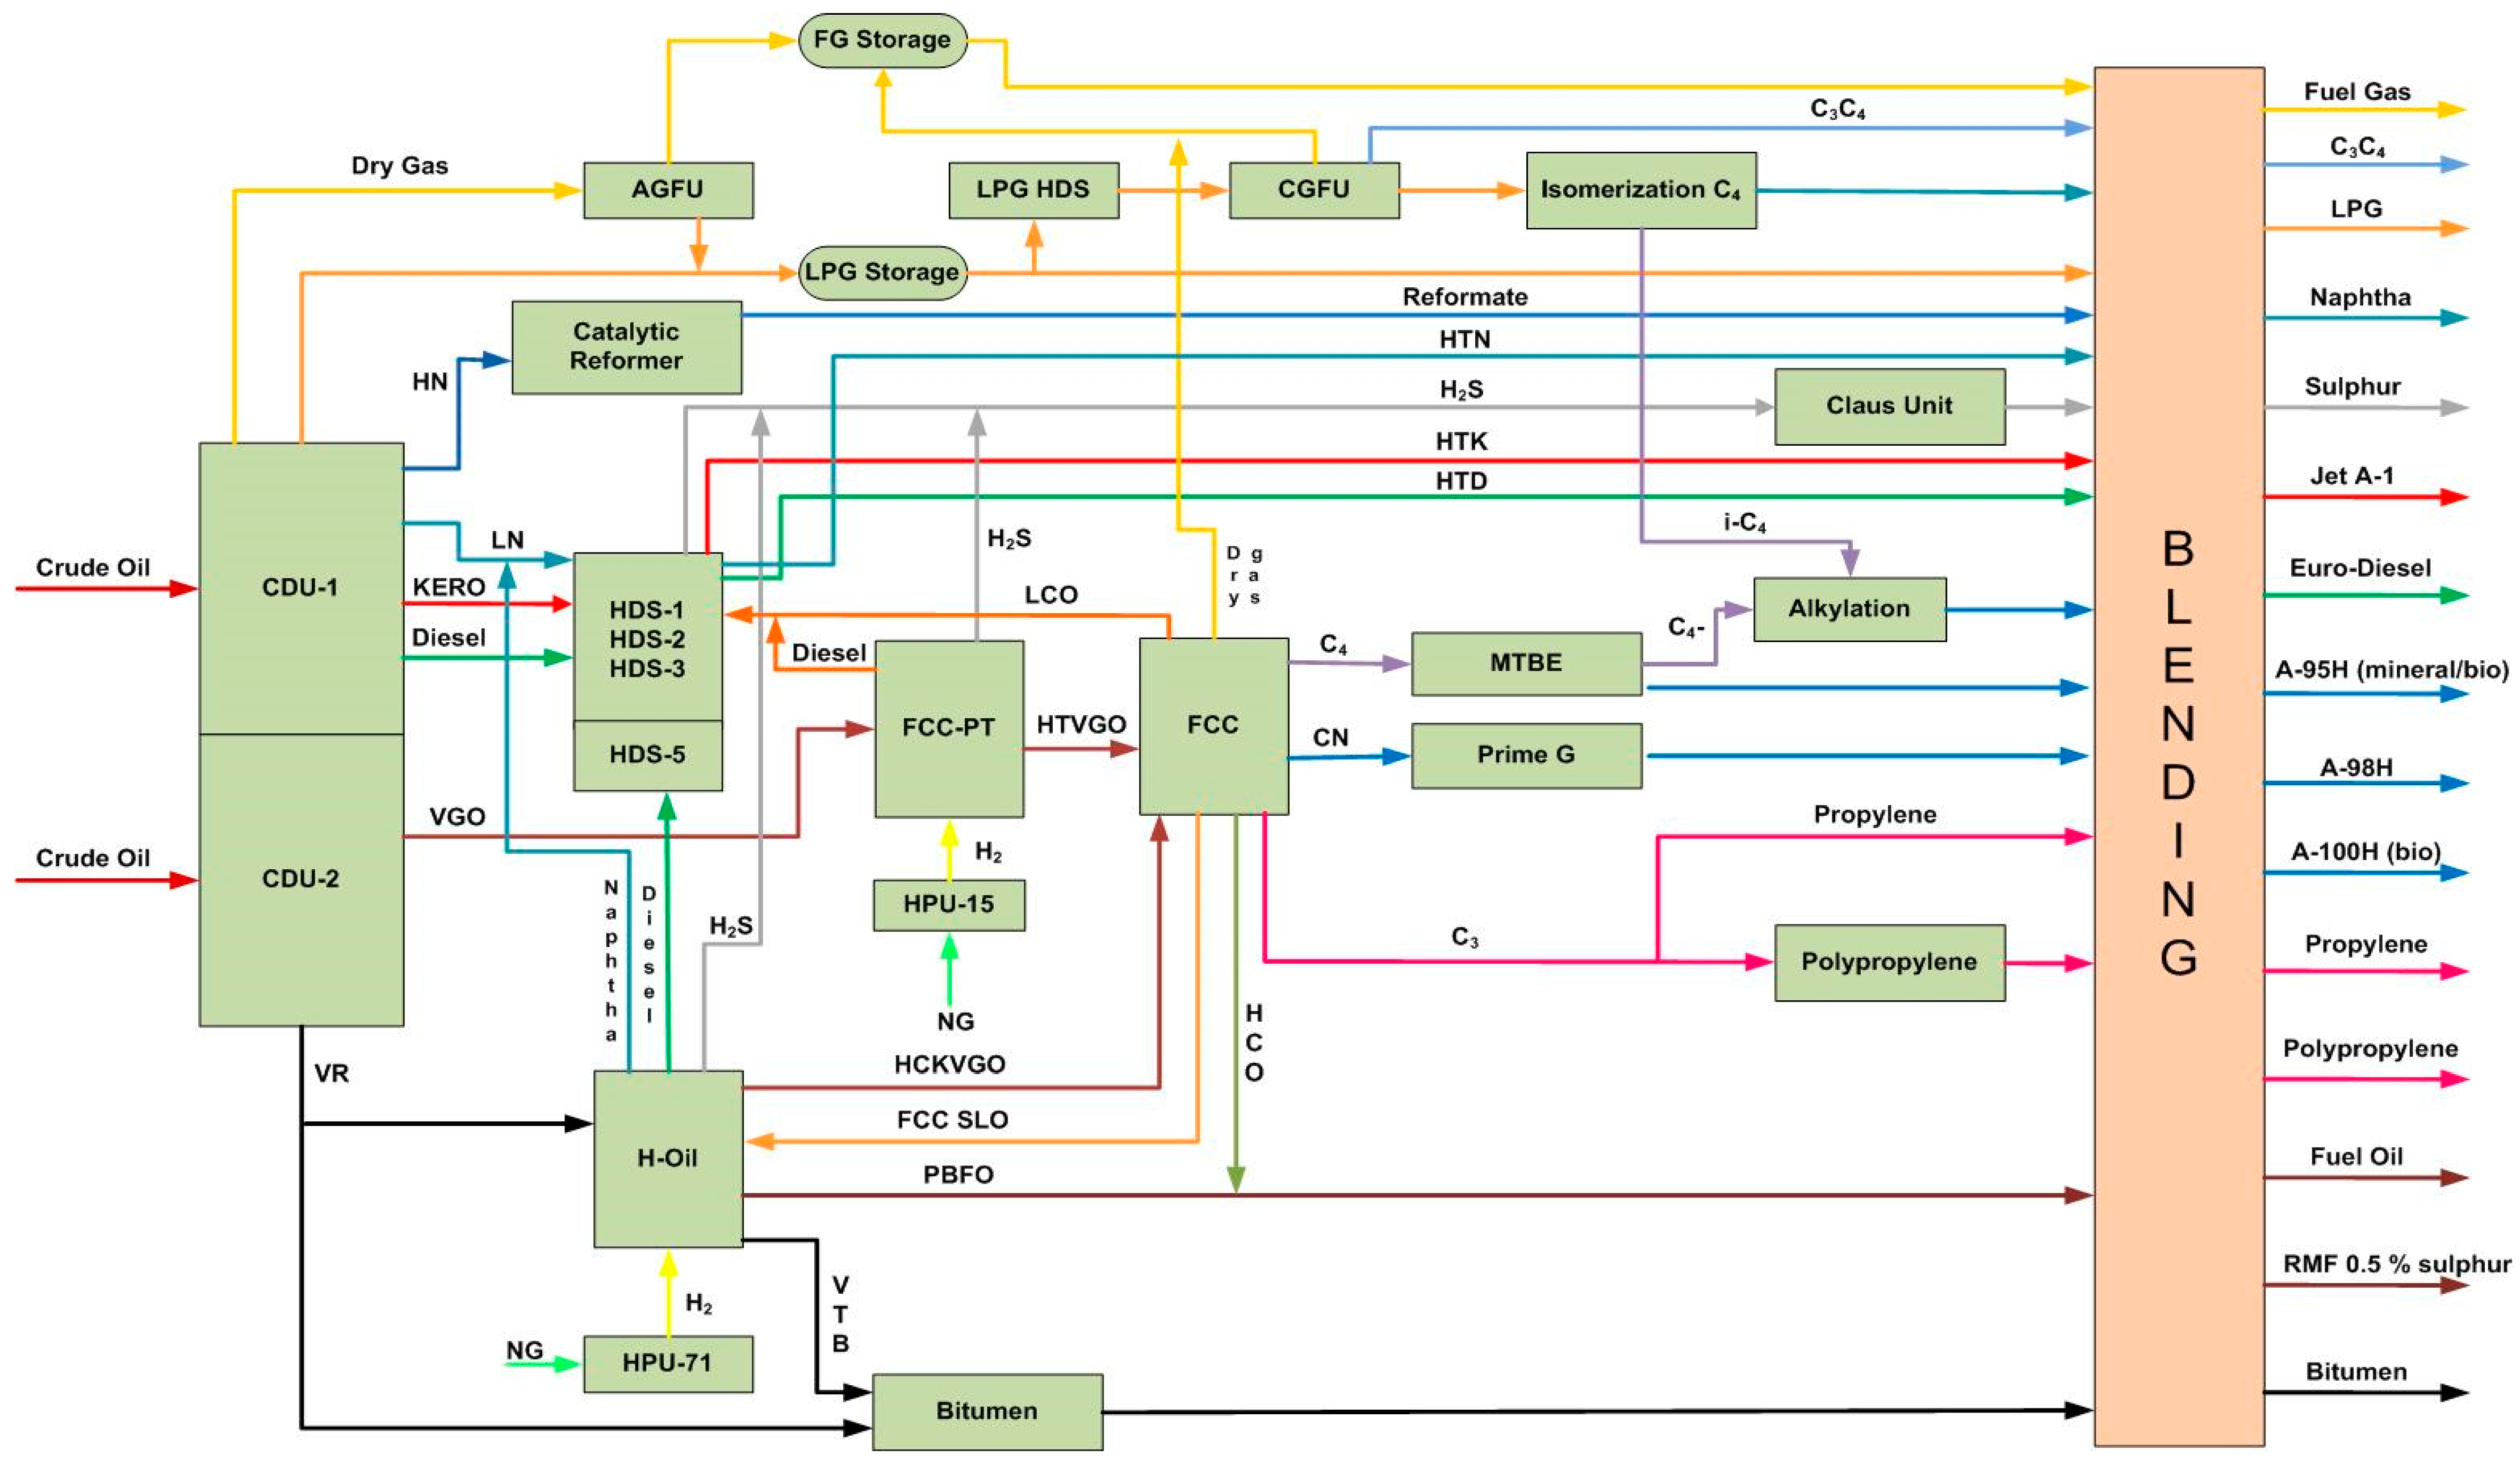
Figure 2 exemplifies a simplified process diagram of the LNB refinery that was investigated during refining of mixtures consisting of eight crude oils.
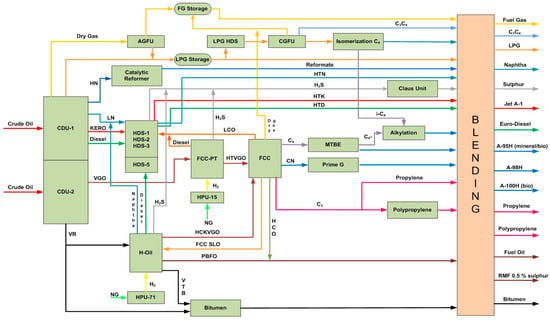
Figure 2.
A simplified process diagram of the LUKOIL Neftohim Burgas refinery (Nelson Complexity Index of 10.6).
The SARA (saturates, aromatics, resins, and asphaltenes) composition of vacuum gas oil and vacuum residue fractions was measured in accordance with the procedure described in [39]. The aromatic content in the middle distillate fractions was determined in accordance with the ASTM D 6591 standard [40].
The conversion of vacuum gas oil in fluid catalytic cracking, and that of vacuum residue in H-Oil hydrocracking, was determined as described in [39].
The concentration of metals in the crude oil and vacuum residue samples was determined following the procedure described in the standard IP 501 [41].
Intercriteria analysis (ICrA) evaluation of the data from the LNB refinery commercial units and from the laboratory test results was carried out in search of the presence of statistically meaningful dependencies on different indicators in a search of an explanation for the observed findings. A statistically significant correlation is deemed at values of μ = 0.70 ÷ 1.00 and υ = 0 ÷ 0.30 whereas the strong positive correlation is present at μ = 0.90 ÷ 1.00 and υ = 0 ÷ 0.1, and weak positive correlation at μ = 0.70 ÷ 0.80 and υ = 0.20 ÷ 0.30. Agreeably, the values of negative consonance with μ = 0 ÷ 0.30 and υ = 0.70 ÷ 1.00 hint at a statistically significant negative dependence, where the strong negative consonance exhibits values of μ = 0 ÷ 0.1 and υ = 0.90 ÷ 1.00, and the weak negative consonance demonstrates values of μ = 0.20 ÷ 0.30 and υ = 0.70 ÷ 0.80. All other cases are deemed as dissonance. A comprehensive description of ICrA application in oil refining is provided in [42].
3. Results
3.1. Laboratory Oil Test Results
The TBP analysis provides the most comprehensive information about petroleum fraction yields, density, and sulphur content. This data set can be used to estimate with empirical methods a great number of fraction characteristics like content of paraffinic, naphthenic, and aromatic carbons, refractive index, molecular weight, cetane index, etc. [43]. Unfortunately, it takes three working days to perform. The ASTM D 86 distillation test needs less than two hours to implement. This makes it convenient for quick evaluation of the distillation characteristics of a petroleum. The data in Table 1 were used to develop regression equations, which allow for the prediction of TBP distillation yields from ASTM D 86 data of yields of fraction boiling up to 200 and 300 °C. These equations are summarized in the Supplementary Materials.
Figure S1 presents parity graphs of measured versus calculated TBP yields using Equations (S1)–(S6) from the data of ASTM D 86 distillation. Additional data of TBP and ASTM D 86 distillations of individual crude oils and crude oil blends shown in Table S1 were used to verify the validity of Equations (S1)–(S6). The data in Figure S1 show that the average absolute deviation (AAD) for all fraction yields except that of the fraction IBP-360 °C are below 1.4 wt.%, that is the reproducibility of the ASTM D 2892 standard [32]. The ASTM D 5236 does not report reproducibility in yields but in °C at evaporate yield. We have found that the slope in °C/wt.% for the studied crudes (their atmospheric residue fractions) of laboratory ASTM D 5236 vacuum distillation is about 3.2 °C/wt.%, and a reproducibility of about 14 °C as reported in ASTM D 5236 [33] would be equal to about 4.4 wt.%. Thus, we may suggest that an AAD of 2.5 wt.% could be considered within reproducibility of the ASTM D 5236 standard.
The data in Figure 1 indicate that, for the first six days of the studied period, the design crude oil Urals is the main petroleum processed in the refinery with content in the crude blend varying between 84 and 92 wt.%. The remaining minor part of crude mixture consisted of Light Siberian (about 3 wt. %), KEBCO (about 3 wt. %), and CPC varying between 3 and 9 wt.%. Then, the content of Urals started to decrease with some kind of variation between 47 and 62 wt.% reaching a minimum of 1.6%. In the first 15 days of the studied period, the South American crude oils BTV and BSP started to be refined. Initially, some tanks containing blends of BTV, Urals, and Light Siberian crude oils, with a variable ratio between these three crude oils, were subject to ASTM D 86 distillation with the aim to verify whether the linear blending rule is valid for these petroleum mixtures, and it was found to not be valid for all crude blends [44,45,46]. The results of ASTM D 86 distillation tests along with some additional property measurements are summarized in Table S2. Surprisingly, during the ASTM D 86 distillation test, foaming was observed for four of the seven crude tank mixture samples when the distillation temperature exceeded 240 °C (see the note in Table S2 and Video S1). An ICrA evaluation of the data in Table S2 was carried out and the μ-values and υ-values are summarized in Tables S3 and S4. The data in Tables S3 and S4 indicate that the content of BTV in the crude oil blend is the parameter controlling foam formation (μ = 0.00; υ = 1.00). The properties of crude blends’ sulphur (μ = 1.00; υ = 0.00), viscosity (μ = 0.10; υ = 0.90), and water content (μ = 0.10; υ = 0.90) are also related to the intensity of foam formation quantified with the ranking. However, these properties are related to the content of BTV in crude mixtures (sulphur: μ = 0.00; υ = 1.00; viscosity: μ = 0.90; υ = 0.10; and water content: μ = 0.90; υ = 0.10), and, therefore, it is difficult to deduce that any of these properties have influence on the foam formation. One thing is clear, BTV content in the crude blend is the pivotal factor that controls foaming during ASTM D 86 distillation. These distillation tests suggest that the content of BTV in crude oil mixture should not go beyond 19% to guarantee absence of foaming during refining.
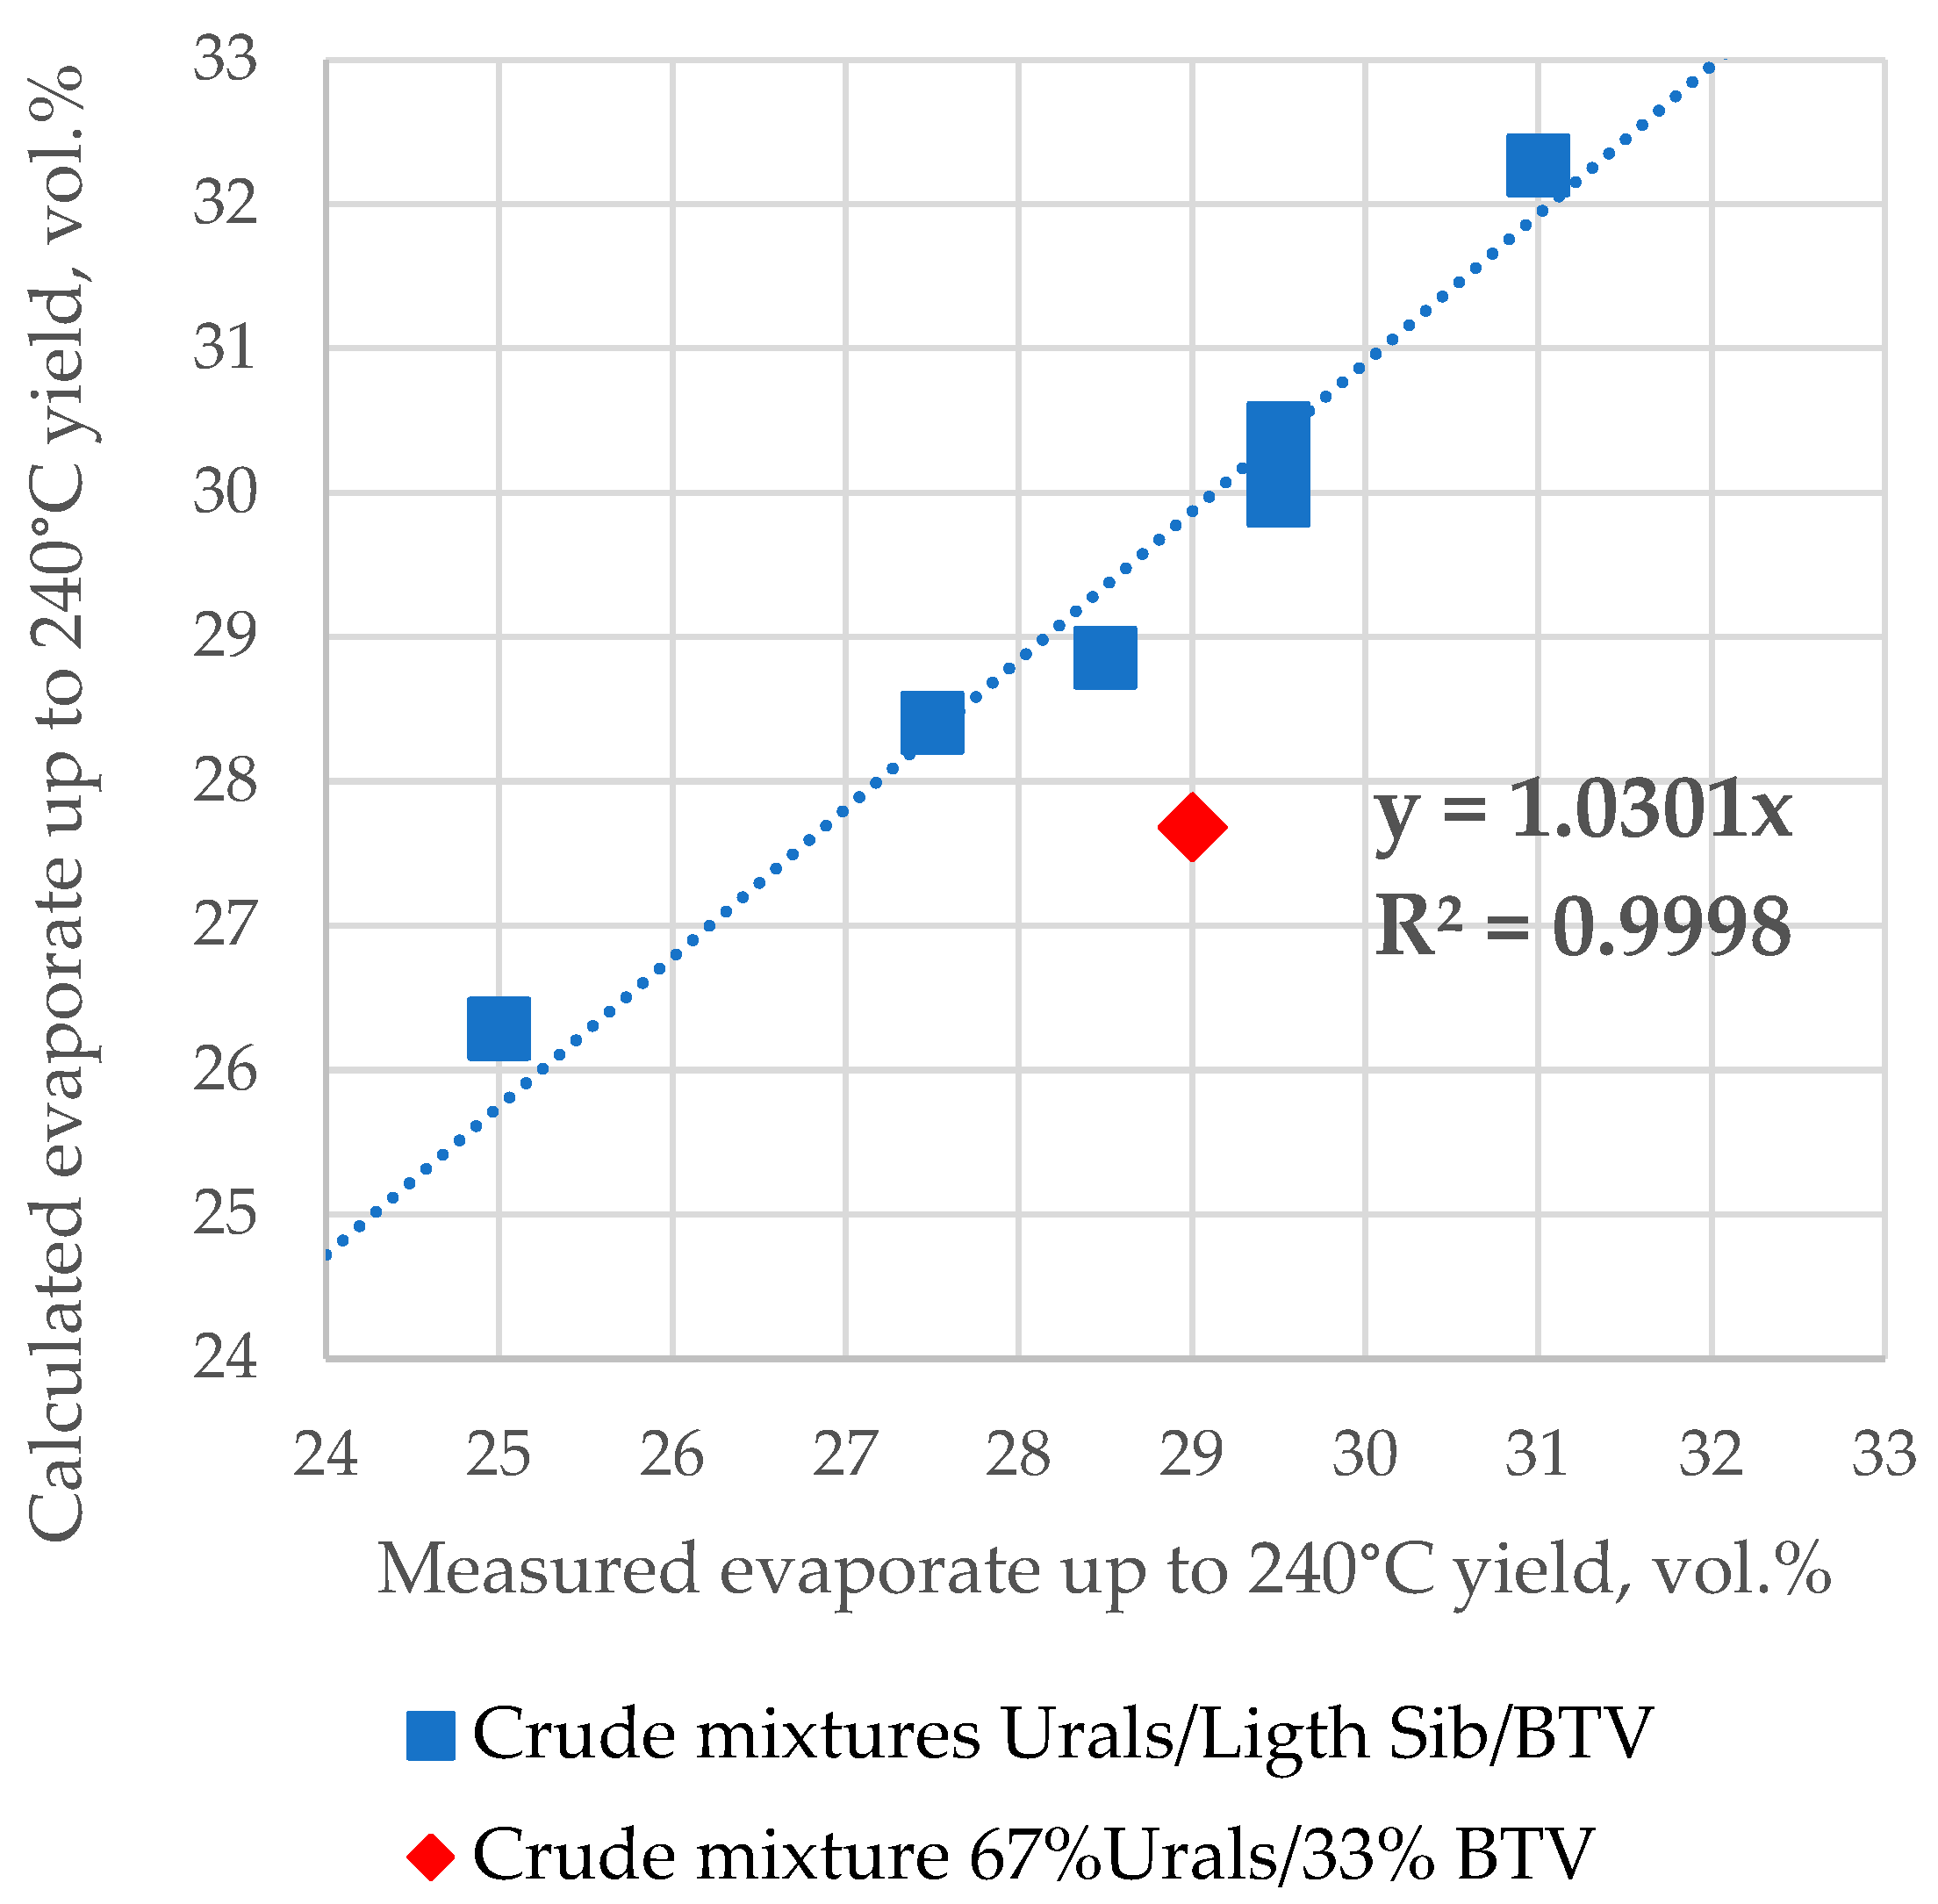
Figure 3 shows a plot of the correlation between the calculated ASTM D 86 boiling fraction volumetric yield up to 240 °C, using the linear mixing rule for the seven mixing tank samples and the measured values reported in Table S2. All three component petroleum mixtures which contain Light Siberian crude oil exhibit the validity of the linear blending rule, while those not containing Light Siberian crude oil indicate a deviation from this rule. The data to calculate the ASTM D 86 boiling fraction volumetric yield up to 240 °C were used from Table S2 (the composition of petroleum blend) and from Table S5 (ASTM D 86 distillation data of crude oils Urals, Light Siberian, and BTV). The data presented in Figure 3 are in line with the results reported in [44,45,46] showing that the crude oil blend distillation characteristics may not be additive for some oil mixtures. In this case, the crude mixture 67% Urals/33% BTV obviously does not follow the linear blending additive rule.
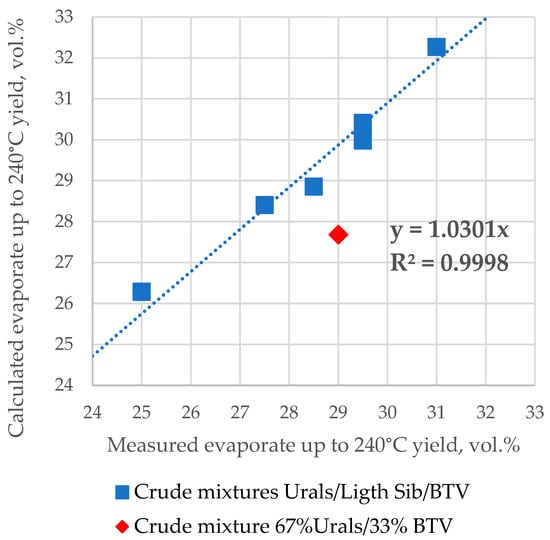
Figure 3.
Measured against calculated ASTM D 86 boiling fraction volumetric yield up to 240 °C using the linear mixing rule for the seven mix tank samples.
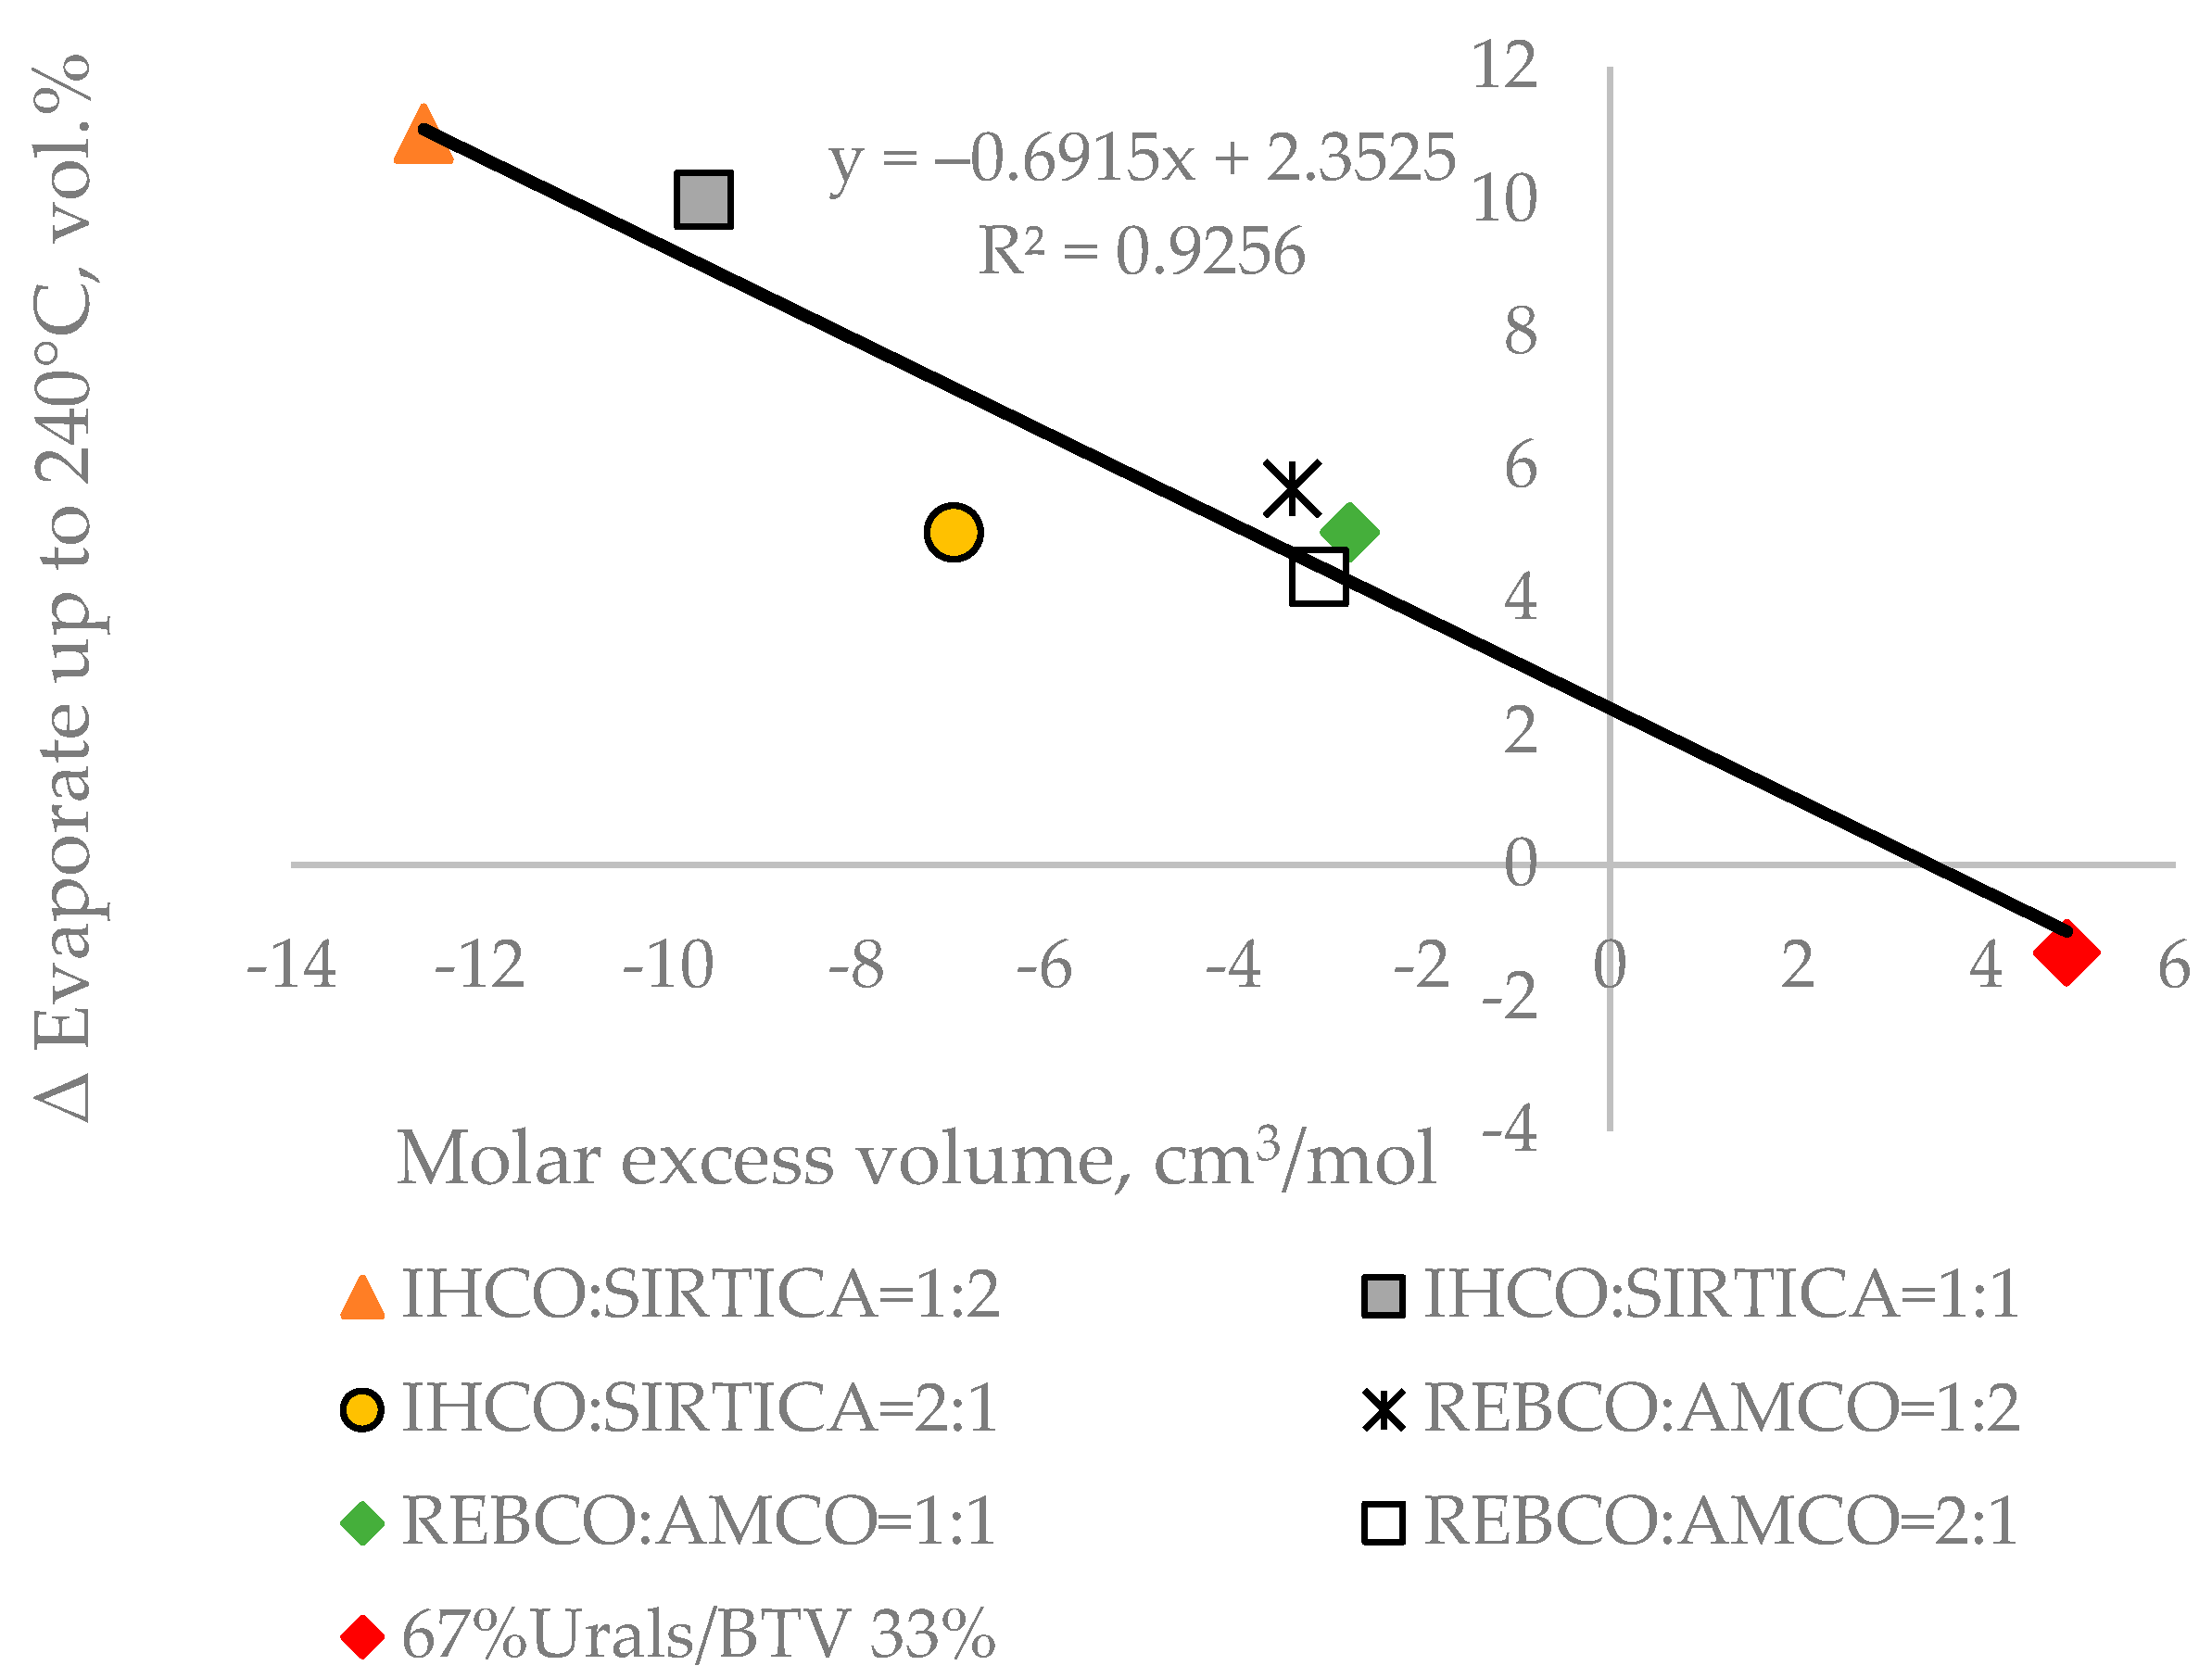
In our recent study [44], where 12 crude oil blends were investigated using TBP distillation apparatus, it was shown that for the petroleum blends which deviate from the linear blending rule, the molar excess volume correlates with the difference between the measured TBP yield and the calculated one using the linear blending rule. Having in mind that the TBP fraction yields correlate with ASTM D 86 distillation yields (Equations (S1)–(S6)), we decided to test the validity of the relation established in [44] between the molar excess volume and the difference between measured and calculated ASTM D 86 boiling fraction volumetric yield up to 240 °C following the linear blending rule. For that purpose, ASTM D-86 distillation characteristics of four crude oils investigated in [44], namely Iranian Heavy (IHCO), Sirtica, Russian Export Crude blend (REBCO), and Arabian medium (AMCO) (shown in Table S6), were used to calculate the ASTM D 86 boiling fraction volumetric yields up to 240 °C following the linear blending rule of their blends: IHCO:SIRTICA = 1:2; IHCO:SIRTICA = 1:1; IHCO:SIRTICA = 2:1; REBCO:AMCO = 1:2; REBCO:AMCO = 1:1; and REBCO:AMCO = 2:1. The measured ASTM D 86 distillation characteristics of the six crude blends aforementioned are presented in Table S7. Then, the molar excessive volume of these blends calculated using the procedure described in [44] were plotted against the difference between measured and estimated ASTM D 86 boiling fraction volumetric yields up to 240 °C. Figure 4 shows the presence of a good correlation between the molar excess volume and ∆ ASTM D 86 boiling fraction volumetric yields up to 240 °C.
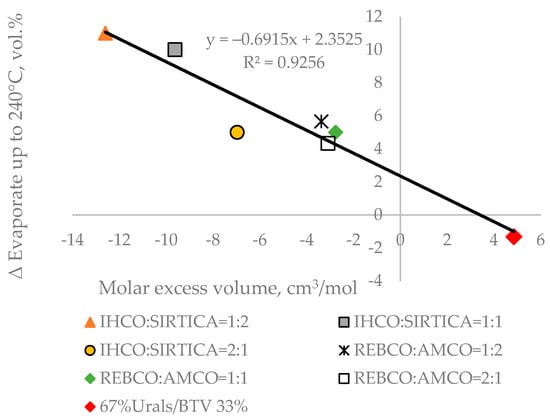
Figure 4.
Relation of the molar excess volume to the ∆ ASTM D 86 boiling fraction volumetric yields up to 240 °C of seven petroleum crude blends.
These data confirm the relation between molar excess volume and Δ fraction yields observed in the TBP apparatus for some crude oil blends as reported in [43]. It is also an indirect corroboration about the good correlation between ASTM D 86 distillation characteristics and TBP ones, suggesting that the much faster ASTM D 86 distillation could be used as a substitute of TBP distillation for daily controlling of crude distillation unit feed variation. Another deduction from these data can be that the molar excess volume or Δ density of a crude blend may be used to verify the validity of the linear blending rule for petroleum mixtures. As evident from the data in Tables S3 and S4, the Light Siberian crude oil has a negative meaningful consonance with crude blend Δ density, which is the difference between measured and calculated density assuming that the crude oil blend is a regular solution (μ = 0.2; υ = 0.8). This implies that the reduction in this crude oil content in the petroleum mixture with Urals and BTV crude oils will lead to augmentation of Δ density. The complete exclusion of Light Siberian crude oil from the blend with Urals and BTV, as shown in Figure 3 and Figure 4, has led to a bigger deviation of the behaviour of crude blends from that of regular solution and a bias from the linear blending rule.
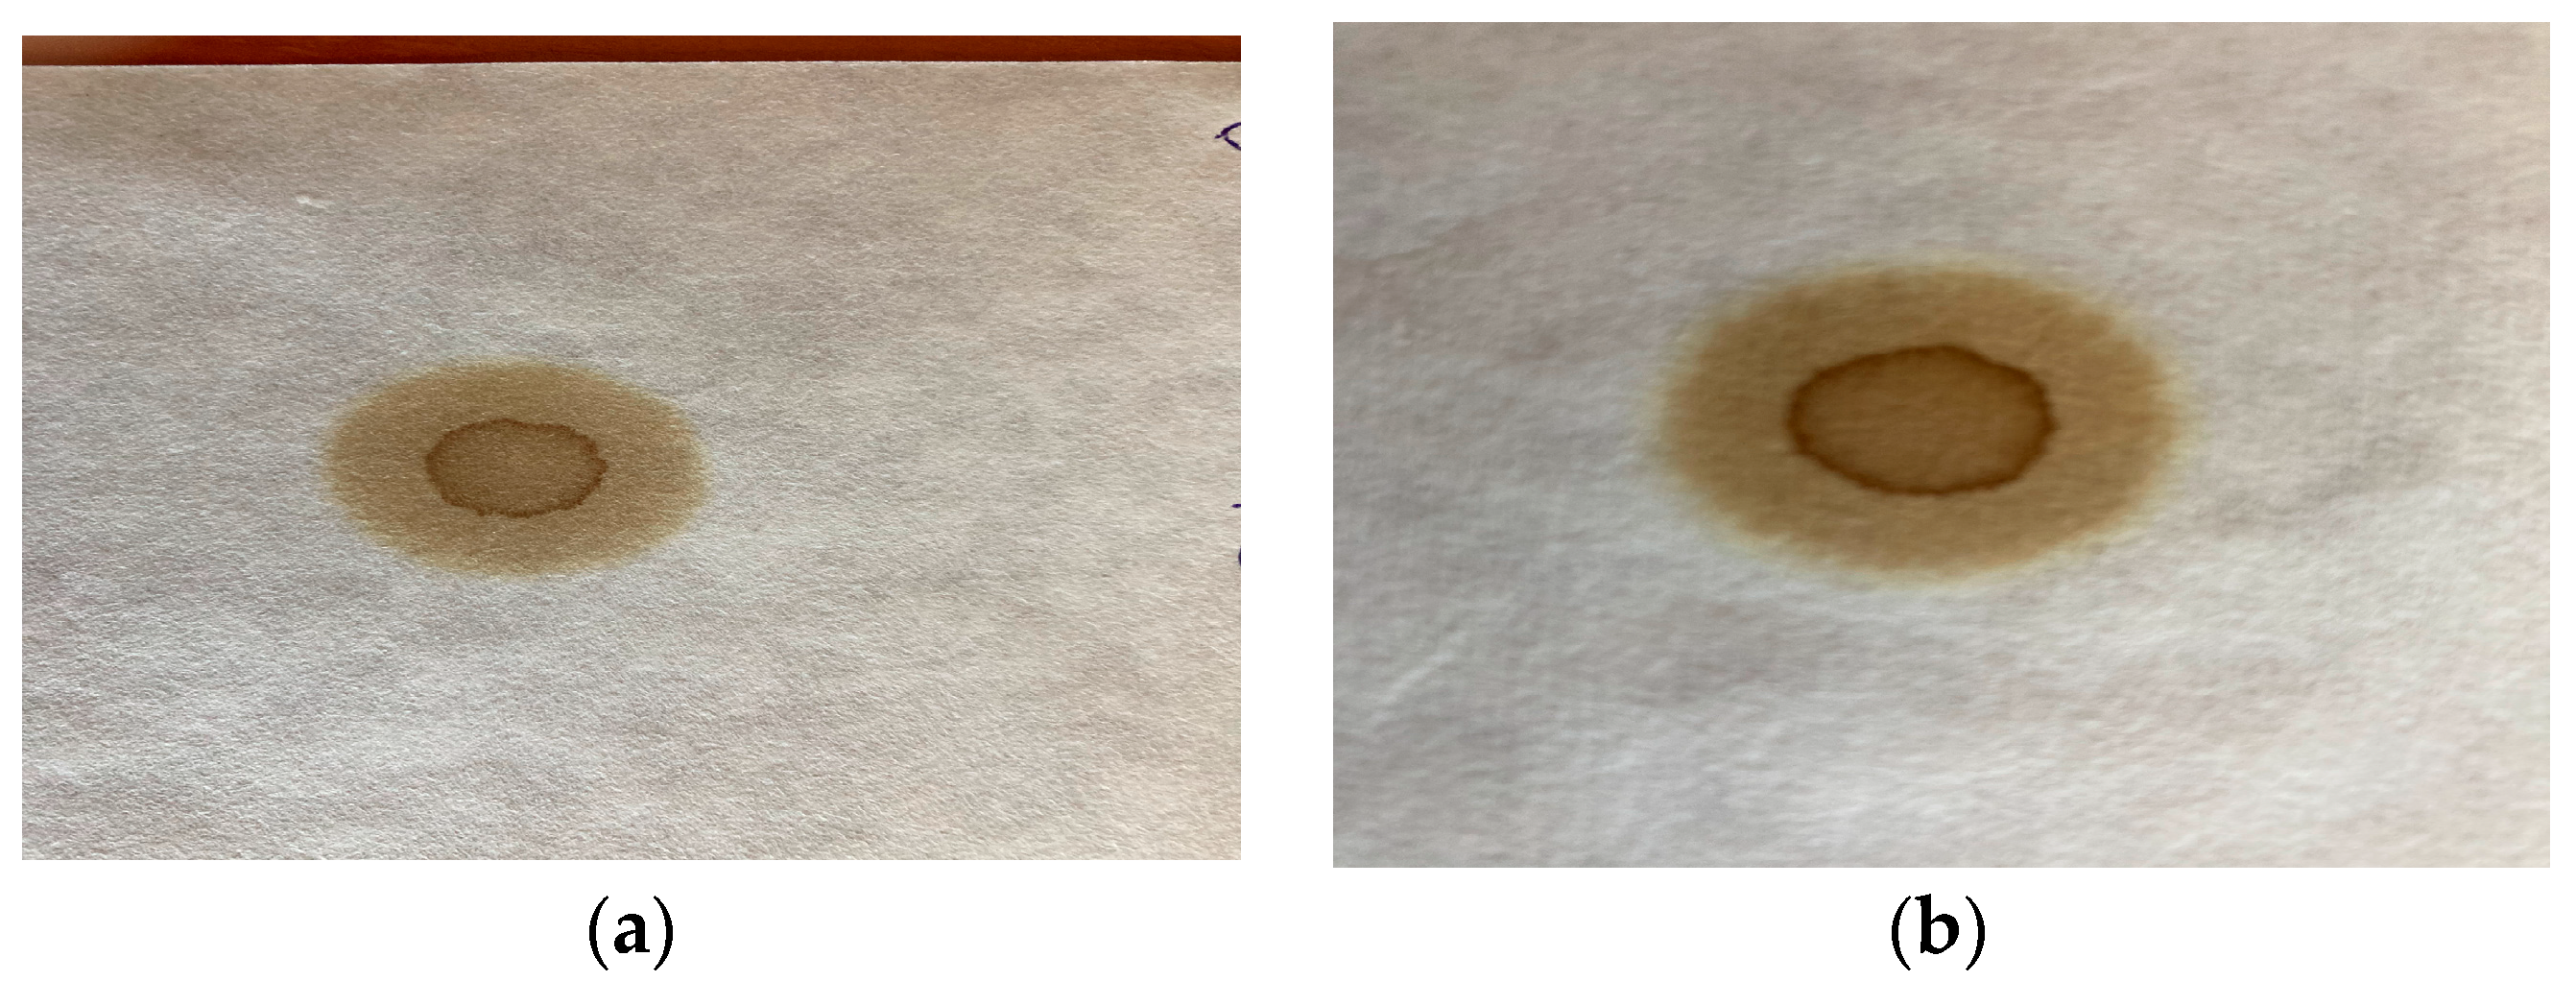
Table 3 summarizes data of oil colloidal stability test results. The CPC crude oil Sp critical was not possible to determine using the n-heptane dilution test when centrifugation was used as described by Nemana et al. [36] because no asphaltene precipitation was registered. However, by using the spot technique as described in [47,48,49], the CPC crude oil can be classified as self-incompatible. Figure 5 indicates photographs of the spot test obtained by performing a toluene equivalence test and heptane dilution test as described by Wiehe in [50,51]. It is seen from Figure 5a that the addition of 10 mL toluen to a 2 mL CPC crude oil sample (toluene equivalence test) does not lead to dissolution of asphaltenes, yielding a dark ring about the centre of the yellow–brown spot. Figure 5b shows that the addition of 10 mL heptane to a 2 mL CPC crude oil sample (heptane dilution test) does not provide a much different picture than that of the toluene equivalence test.

Table 3.
Solubility power (Sp), critical solubility power (Sp critical), and the Sp/Sp critical ratio of the studied 11 crude oils and the imported atmospheric residue.
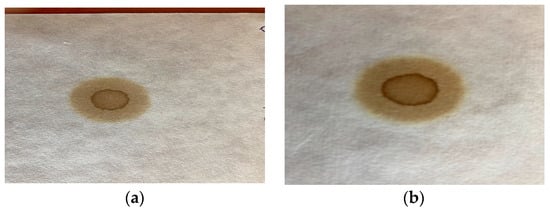
Figure 5.
Spot test result of toluene equivalent test (a) and heptane dilution test (b) of CPC crude oil.
Using data from Table 3 along with data from Figure 1, the calculations using Equation (4) for the Sp blend of crude oil mixture, Sp critical max, and for the studied period of 76 days are summarized in Table 4.

Table 4.
Range of variation in compatibility parameters of the processed 11 crude oils and imported atmospheric residue for the investigated period of 76 days.
Data about complete true boiling point (TBP) analysis along with density and sulphur content of the narrow TBP fractions of the 11 studied crude oils are presented in Tables S8, S9 and S10, respectively. Table S11 shows the cetane index calculated in accordance with the ASTM D 976 standard [34] (Equation (1)) of the narrow middle distillate fractions (180–360 °C) of the 11 crude oils.
Table 5 presents data about density, sulphur content, and group hydrocarbon composition of straight-run heavy naphtha fractions derived from the eleven processed crude oils.

Table 5.
Group hydrocarbon composition, density, and sulphur content of heavy naphtha fractions distilled from the 11 studied crude oils.
Using data from Table 1 and Table 5 and Figure 1, the calculated properties of mixed heavy naphtha fractions for the investigated period of 76 days are presented in Table 6.

Table 6.
Spread of alteration of mixed heavy naphtha features during processing of the eleven crude oils and atmospheric residue in the LNB refinery.
Table 7 presents data on the properties of kerosene fractions, derived from the 11 studied crude oils.

Table 7.
Density, sulphur, cetane index, and aromatic content of kerosene fractions, distilled from the 11 studied crude oils.
By using the data in Table 1 and Table 7 and Figure 1, the variation in mixed kerosene fraction properties was obtained and provided in Table 8.

Table 8.
Variation of density, sulphur, cetane index, and aromatic content of mixed kerosene fractions for the studied period of 76 days.
Table 9 resumes the characteristics of diesel fractions distilled from the 11 crude oils, and the atmospheric residue.

Table 9.
Density, sulphur, nitrogen, cetane index, and aromatic content of diesel fractions, distilled from the 11 studied crude oils and imported atmospheric residue.
Employing the data in Table 1 and Table 9 and Figure 1, the variation in mixed diesel fraction properties was obtained and is shown in Table 10.

Table 10.
Range of oscillation of mixed diesel fraction properties during the study.
Table 11 summarizes the properties of vacuum gas oil fractions obtained from TBP distillation of the 11 crude oils and imported AR.

Table 11.
Group hydrocarbon composition, density, sulphur, and nitrogen contents of vacuum gas oil fractions distilled from the 11 crude oils and imported atmospheric residue.
The scope of alteration of mixed vacuum gas oil properties calculated by using the data in Table 1 and Table 11 and Figure 1 are summarized in Table 12.

Table 12.
Extent of oscillation of traits of mixed vacuum gas oil fractions for the investigated period of 76 days.
Table 13 indicates characteristics of the vacuum residue fractions distilled from the 11 crude oils and imported atmospheric residue.

Table 13.
Properties of vacuum residue fractions distilled from 11 crude oils and imported atmospheric residue.
Using the data in Table 1 and Table 13 and in Figure 1, the calculated characteristics of the blended vacuum residue fractions during processing of the 11 crude oils and imported atmospheric residue were derived. The range of their fluctuation is shown in Table 14.

Table 14.
Range of variation of properties of mixed vacuum residue fractions for the studied period of 76 days.
The data in Table 14 include calculated Na content in the mixed vacuum residue fractions that were measured in vacuum residue sampled from the crude distillation unit. The minimum Na content values that were calculated and measured are very close. However, the maximum content of Na in the measured mixed vacuum residue fraction is higher by 16 ppm, obviously reflecting the increased rate of NaOH addition in CDU when higher-acidity crude oil blends were processed. The latter will be discussed later in this work. Our earlier study has shown that with each 1 ppm of NaOH added to the crude oil in CDU, the vacuum residue sodium content increases by 2.4 ppm [53].
3.2. Commercial Results
3.2.1. Acidity of Processed Crude Oil Blend
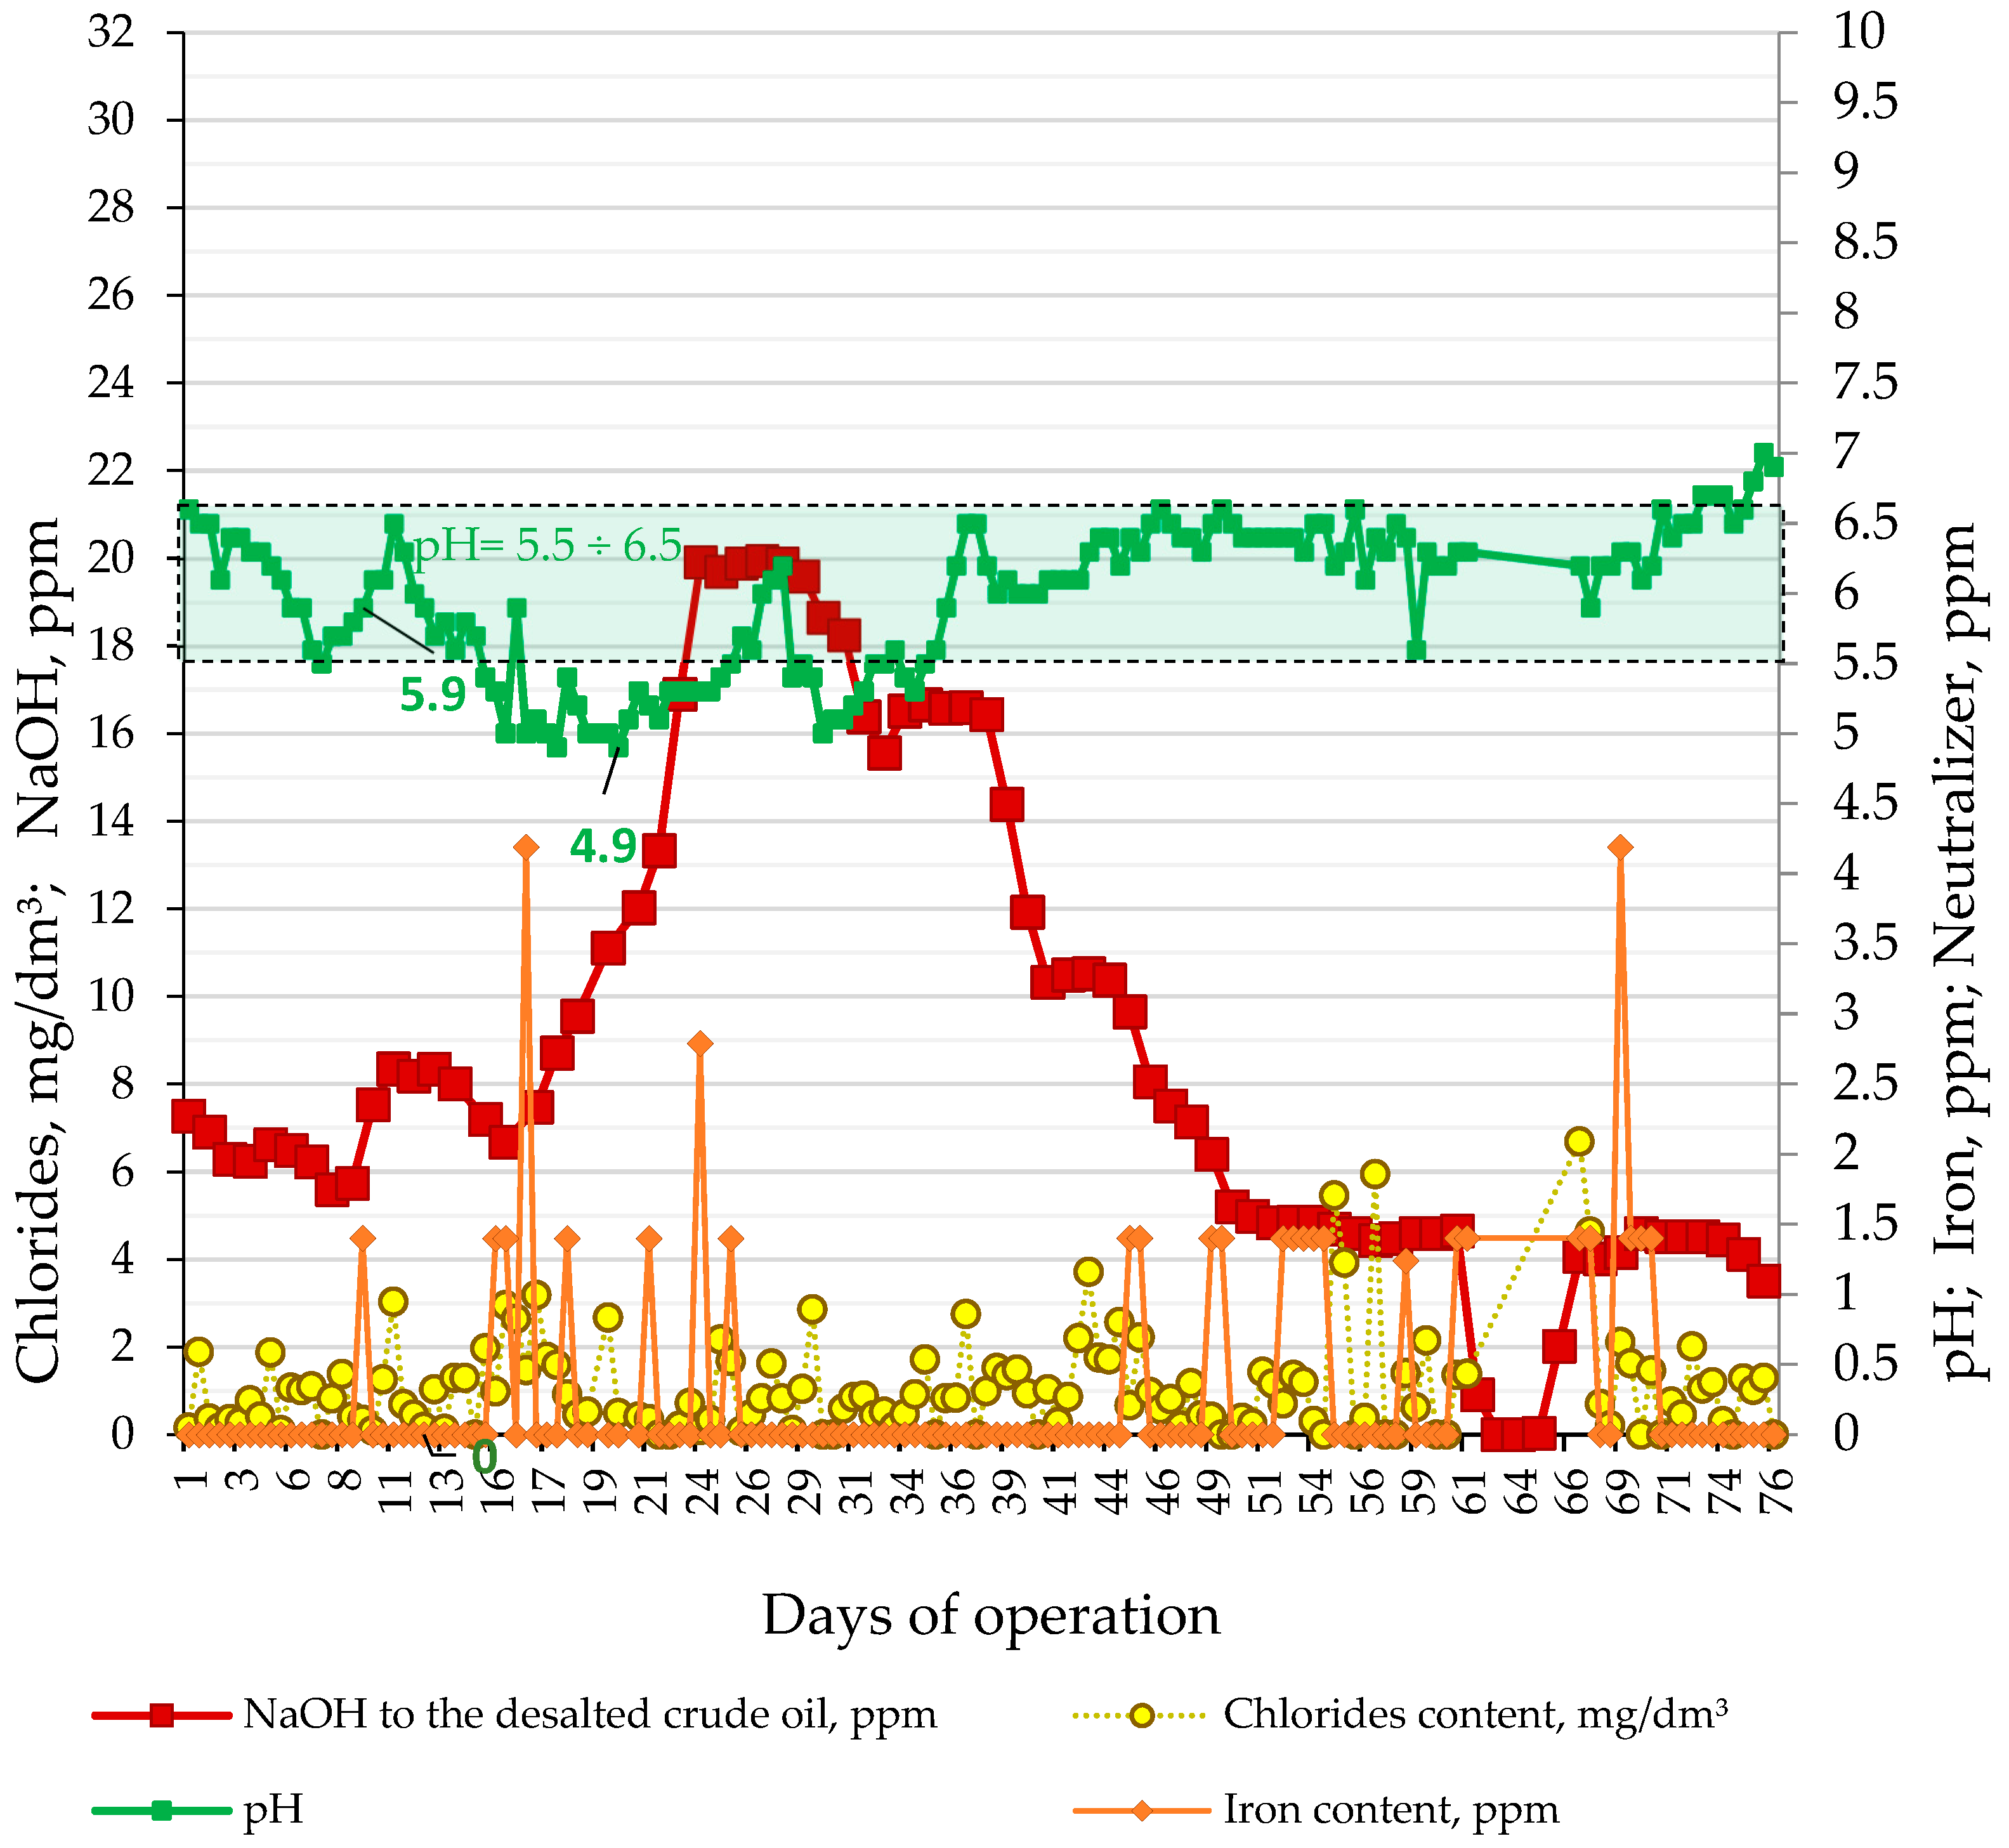
Figure 6 indicates how the pH, NaOH treating rate, iron, and chloride contents in sour water from the LNB refinery crude distillation units have varied during processing of the nine crude oils, and the imported atmospheric residue for 76 days. These data show that the pH of sour water of CDU-2 reached below the minimum allowable value of 5.5 that led to an increase in caustic treating rate from 6 to 20 ppm and an accompanying enhancement of neutralizer rate from 3 to 12.6 ppm starting from the 16th day of the studied period of 76 days. It is also evident from the data in Figure 6 that, occasionally, iron presence was detected in the sour water suggesting some exporting of material from the equipment due to possible corrosion. In order to understand how the crude slate affects acidity expressed with the rate of caustic treatment, an ICrA evaluation of the data from the commercial LNB crude distillation units (Table S12) was performed. Tables S13 and S14 present μ-values and υ-values of the ICrA evaluation of CDU NaOH treating rate and contents of the individual crude oils in the petroleum mixture.
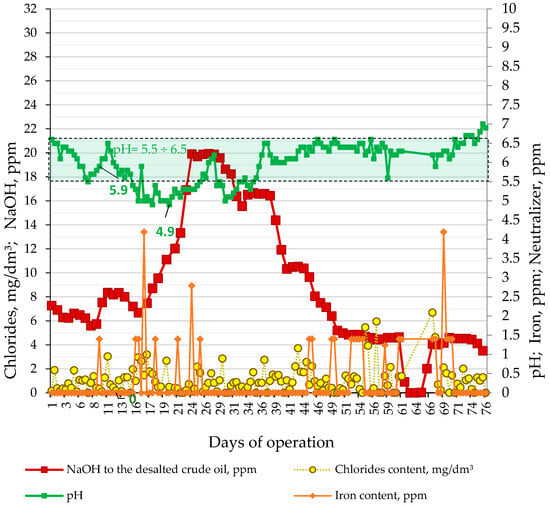
Figure 6.
Variation of pH, NaOH treating rate, iron, and chloride contents in sour water in the LNB refinery CDU-2 during processing of the nine crude oils and the imported atmospheric residue for 76 days.
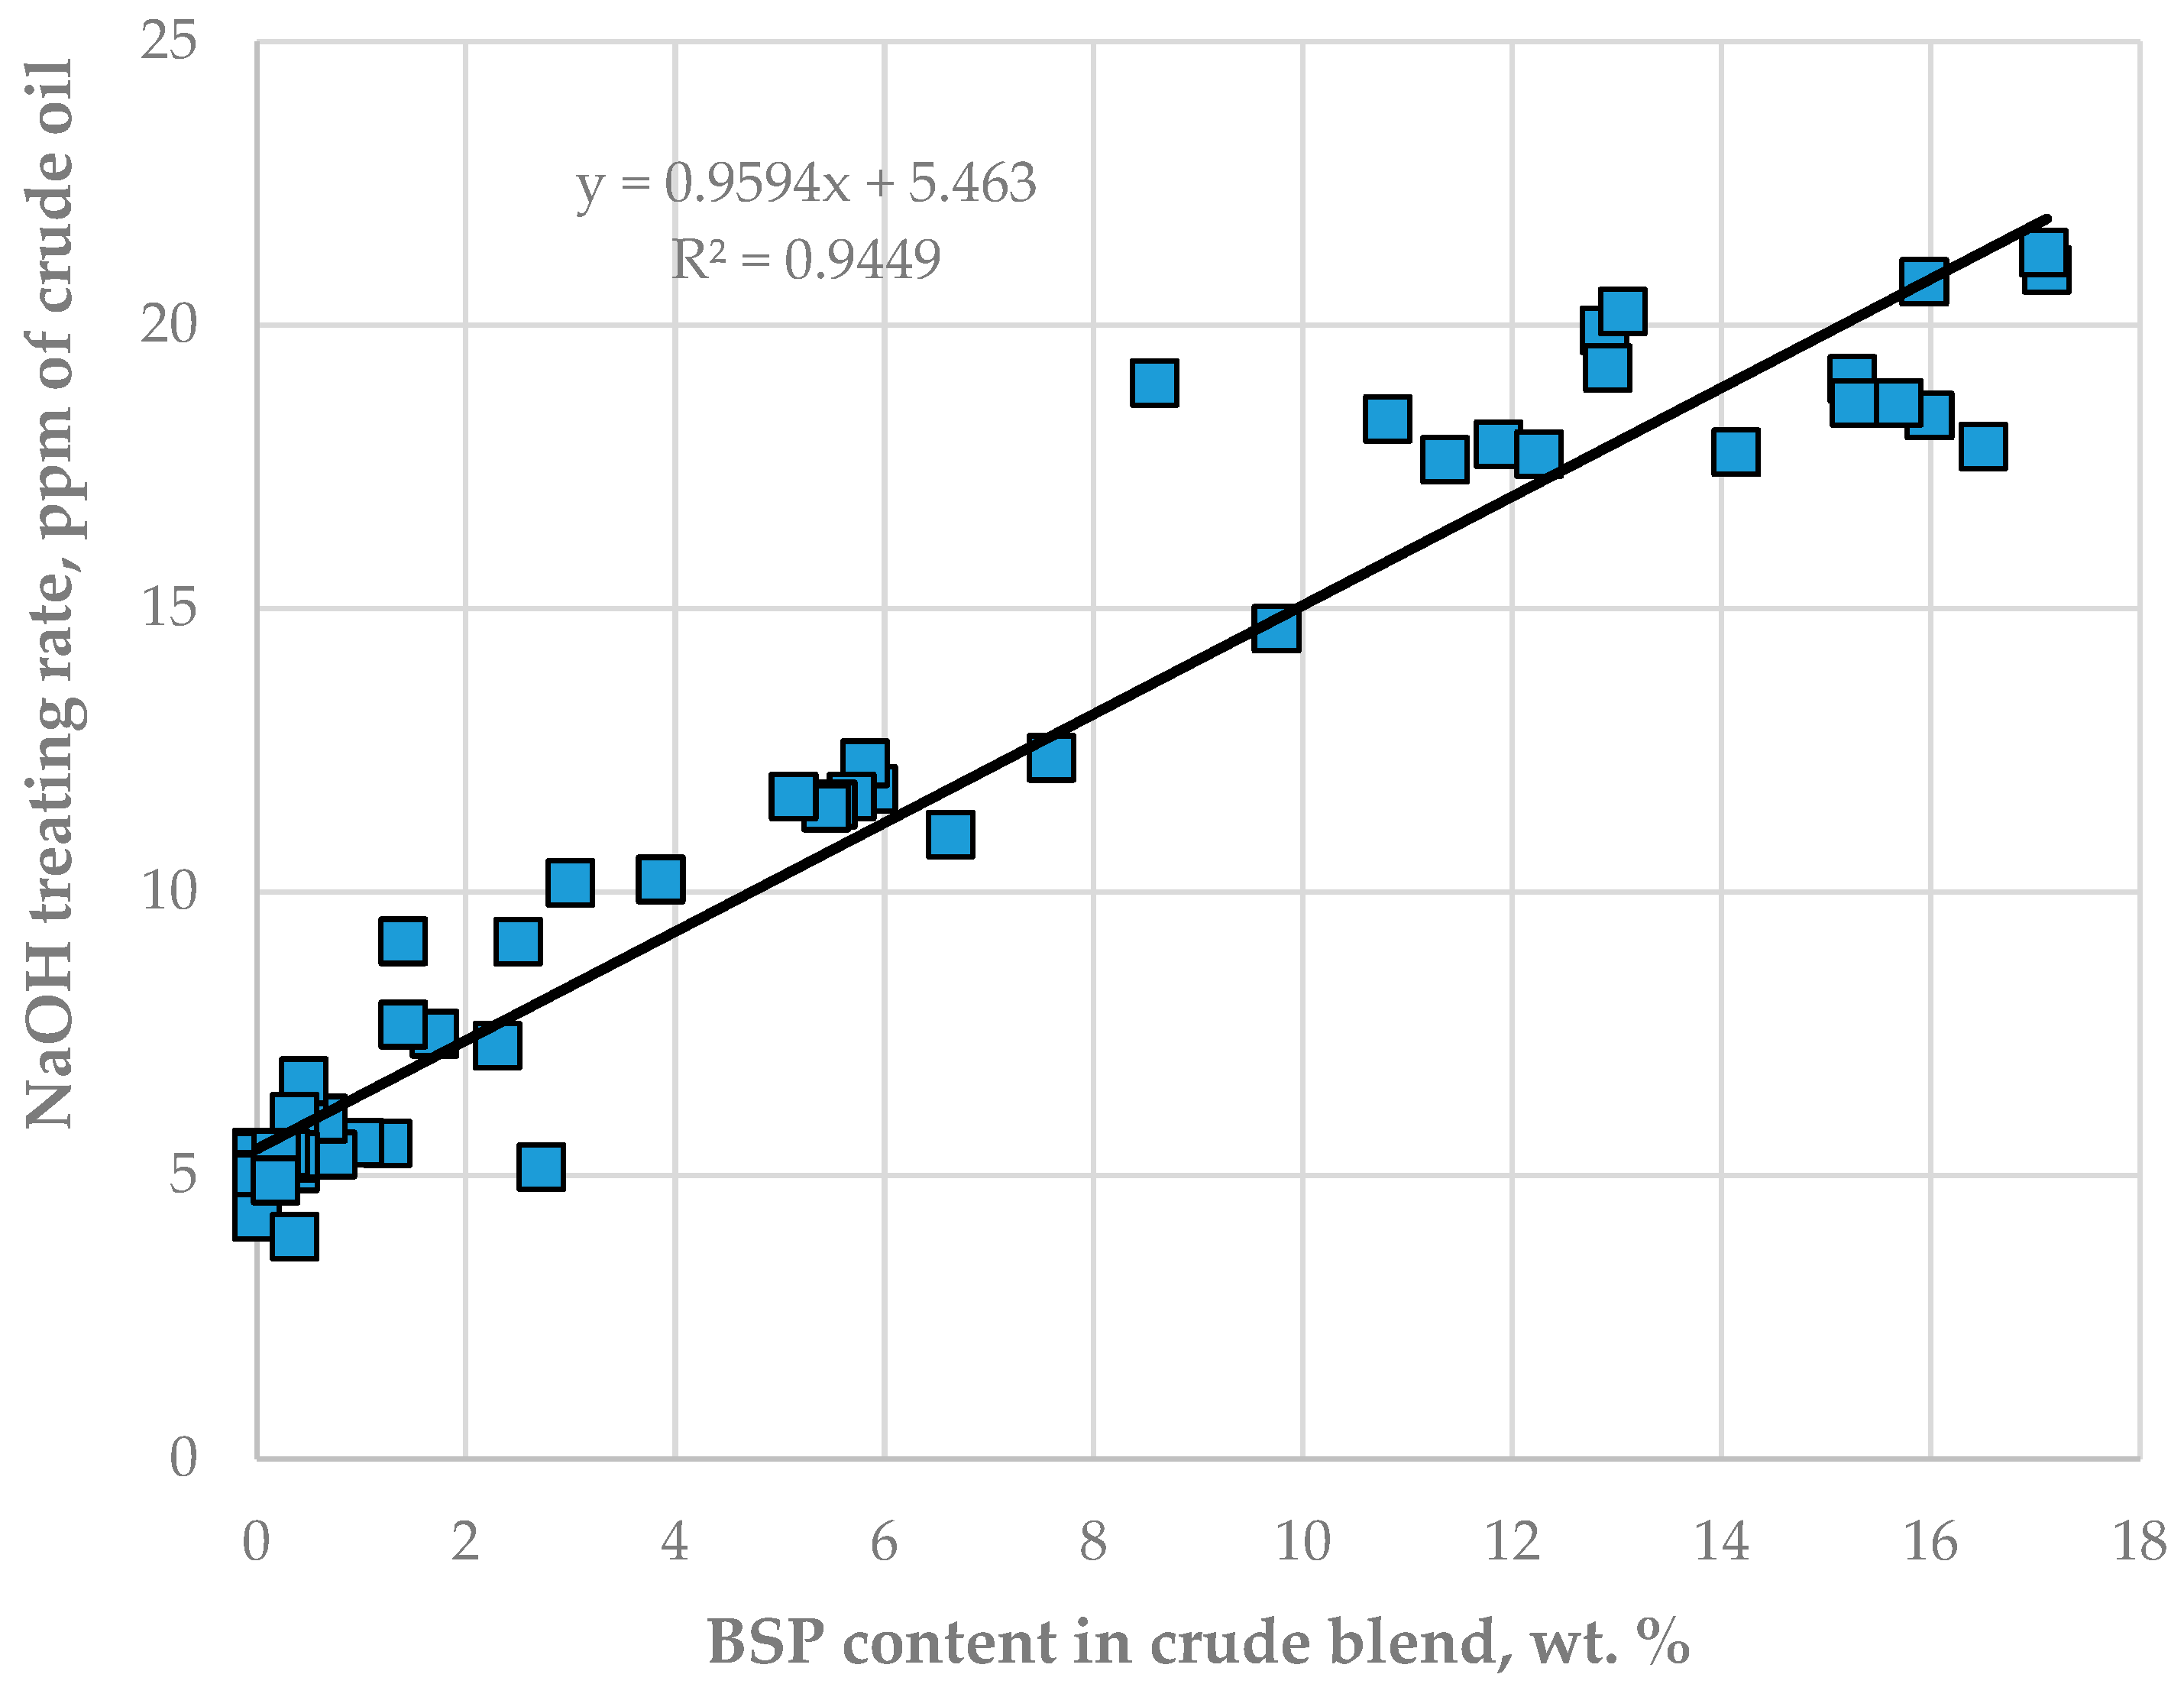
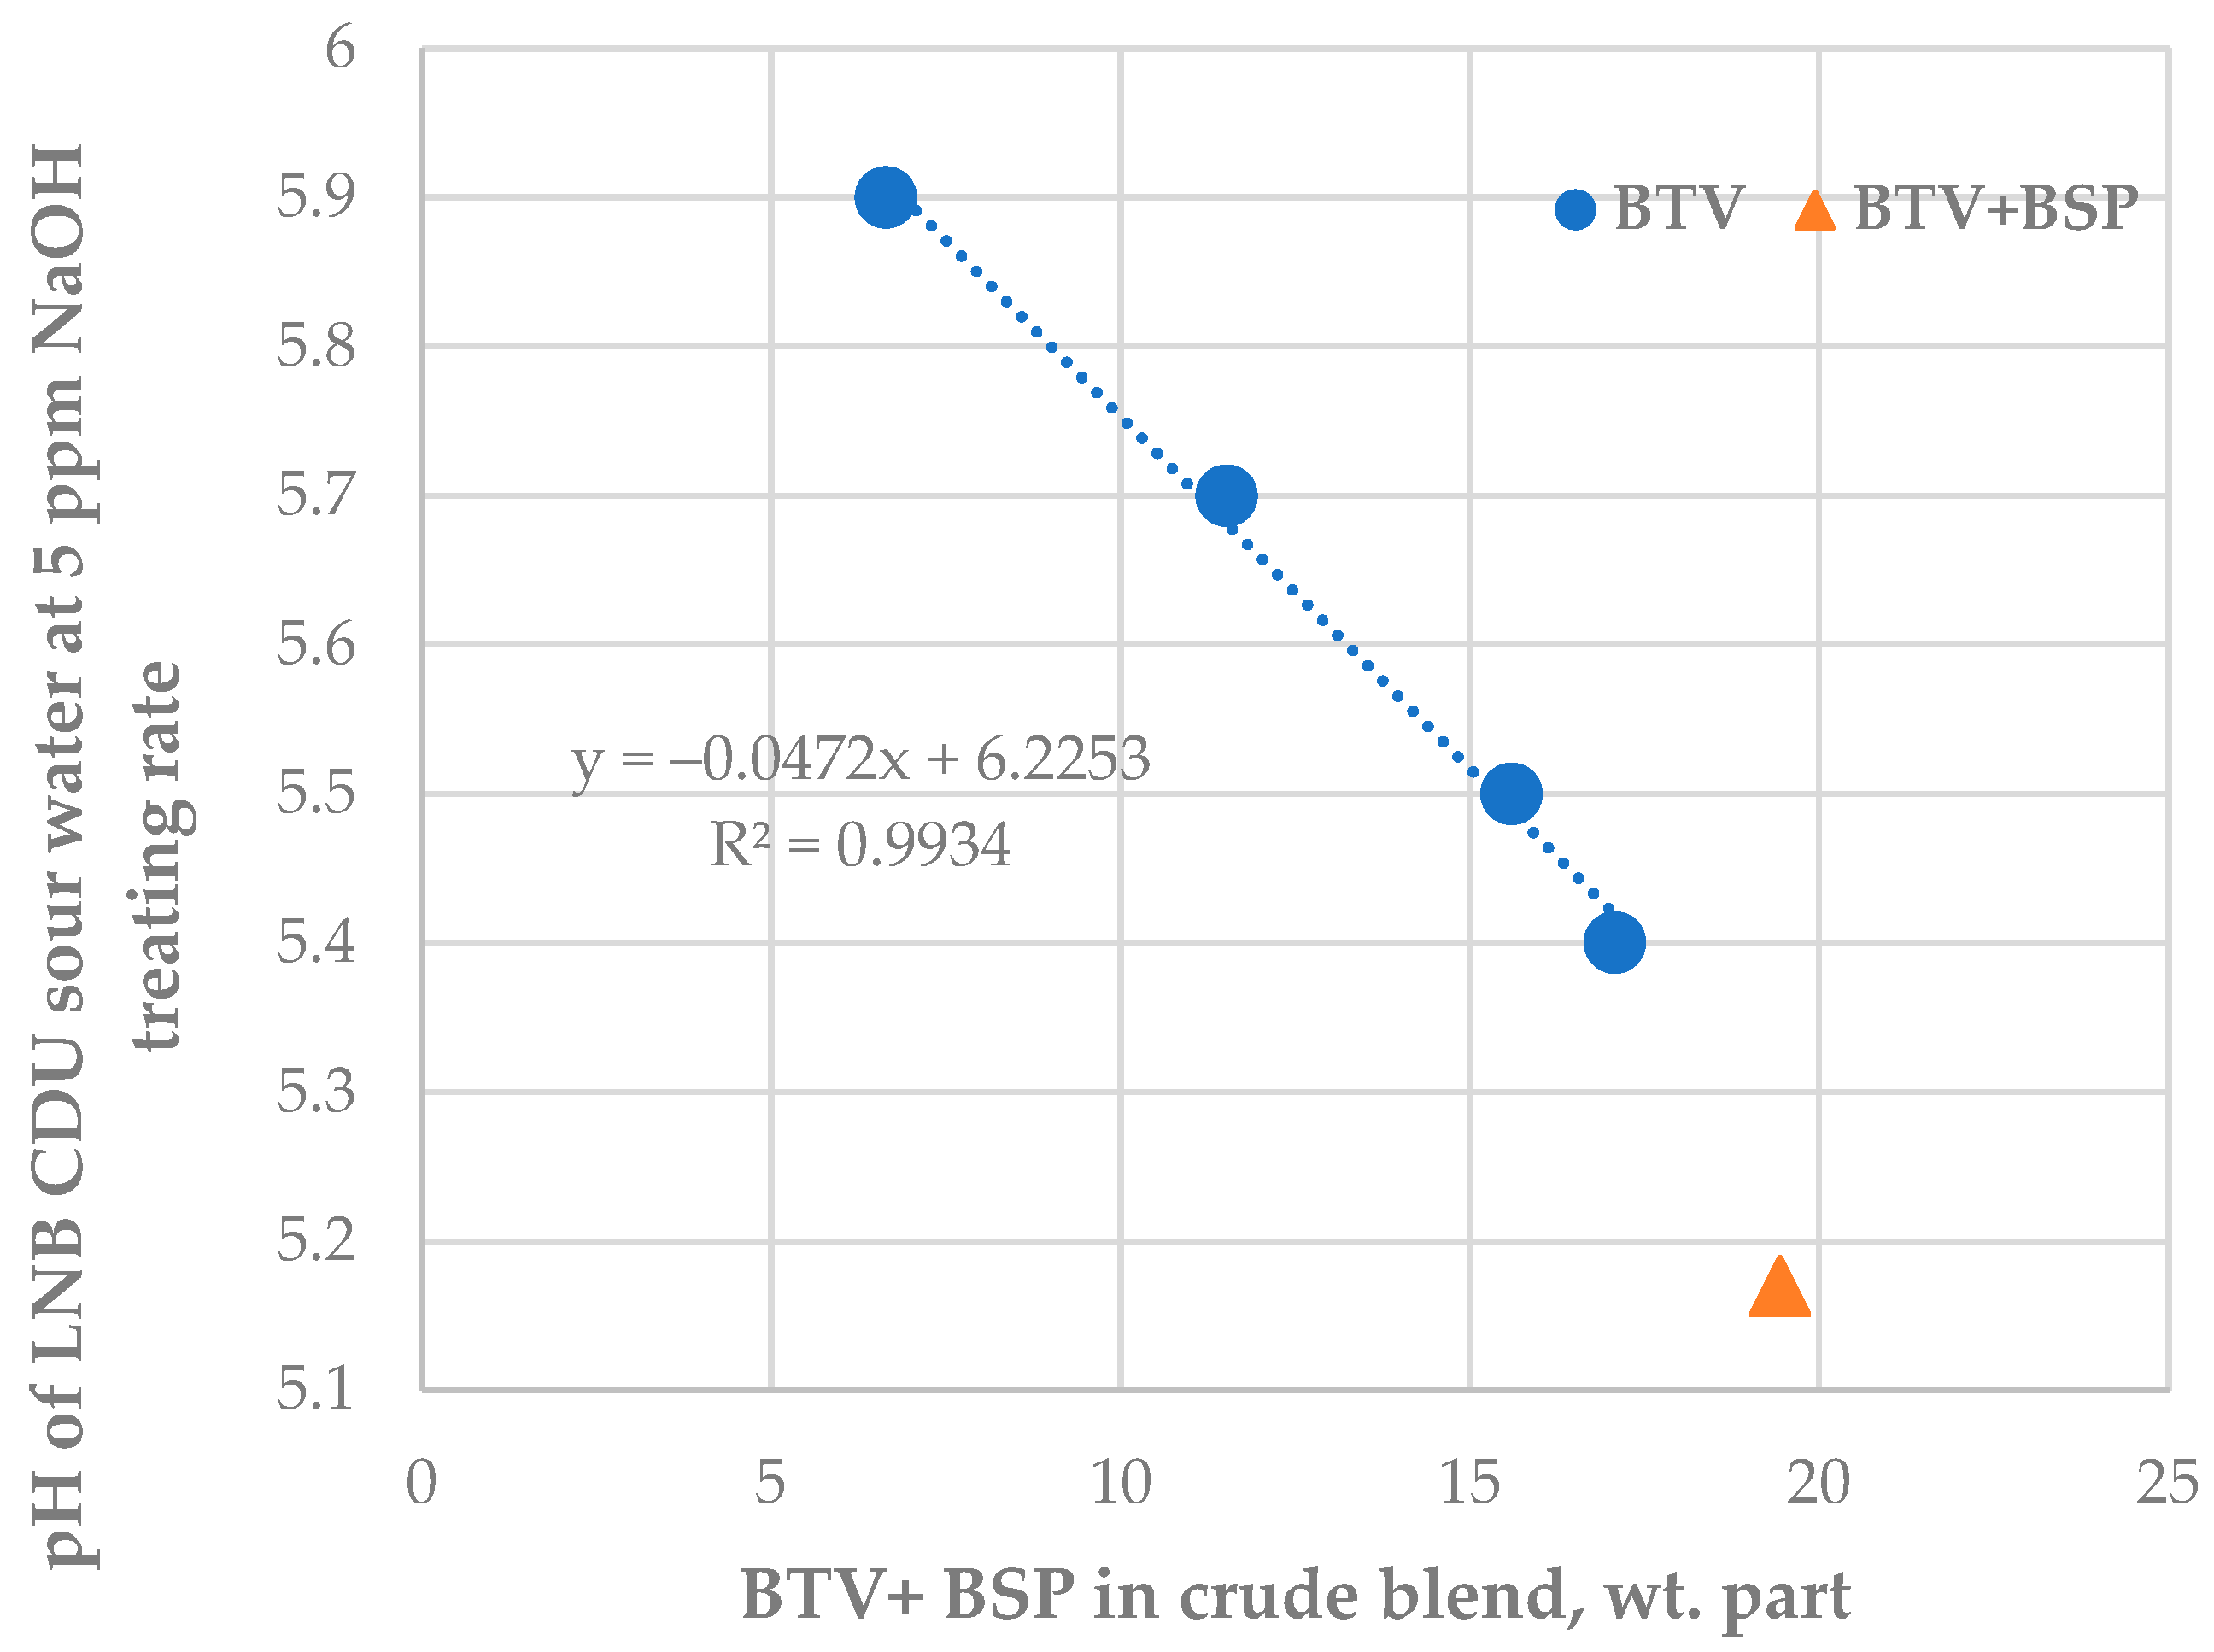
The data in Tables S13 and S14 indicate that the caustic treatment rate has positive statistically meaningful consonance with both crude oils BSP (μ = 0.87; υ = 0.08) and BTV (μ = 0.75; υ = 0.21) with a stronger effect of BSP over BTV. The data in Figure 7 also confirm the strong relation of NaOH treatment rate with the content of crude oils BSP in the processed crude oil mixture. The caustic treatment rate was increased to neutralize the increased acidity of sour water during processing blends containing a higher share of the crude oils BTV and BSP (see Figure 8).
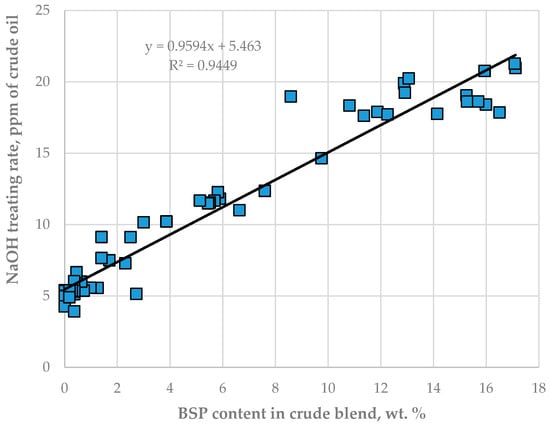
Figure 7.
Relationship between caustic treatment rate in LNB crude distillation units and the content of crude oil BSP.
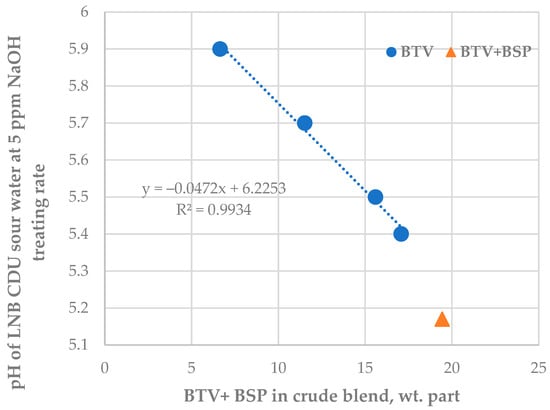
Figure 8.
Relationship between LNB crude distillation unit sour water pH at a constant caustic treatment rate of 5 ppm and the content of BTV and BSP crude oils in processed petroleum blend.
3.2.2. Crude Blend Effect on Fouling in H-Oil Vacuum Residue Hydocracker, Cetane Improver Treating Rate in Diesel Production Unit, and Performance of Fluid Catalytic Cracking, Vacuum Gas Oil Hydrotreatment, and Naphtha Reforming Units
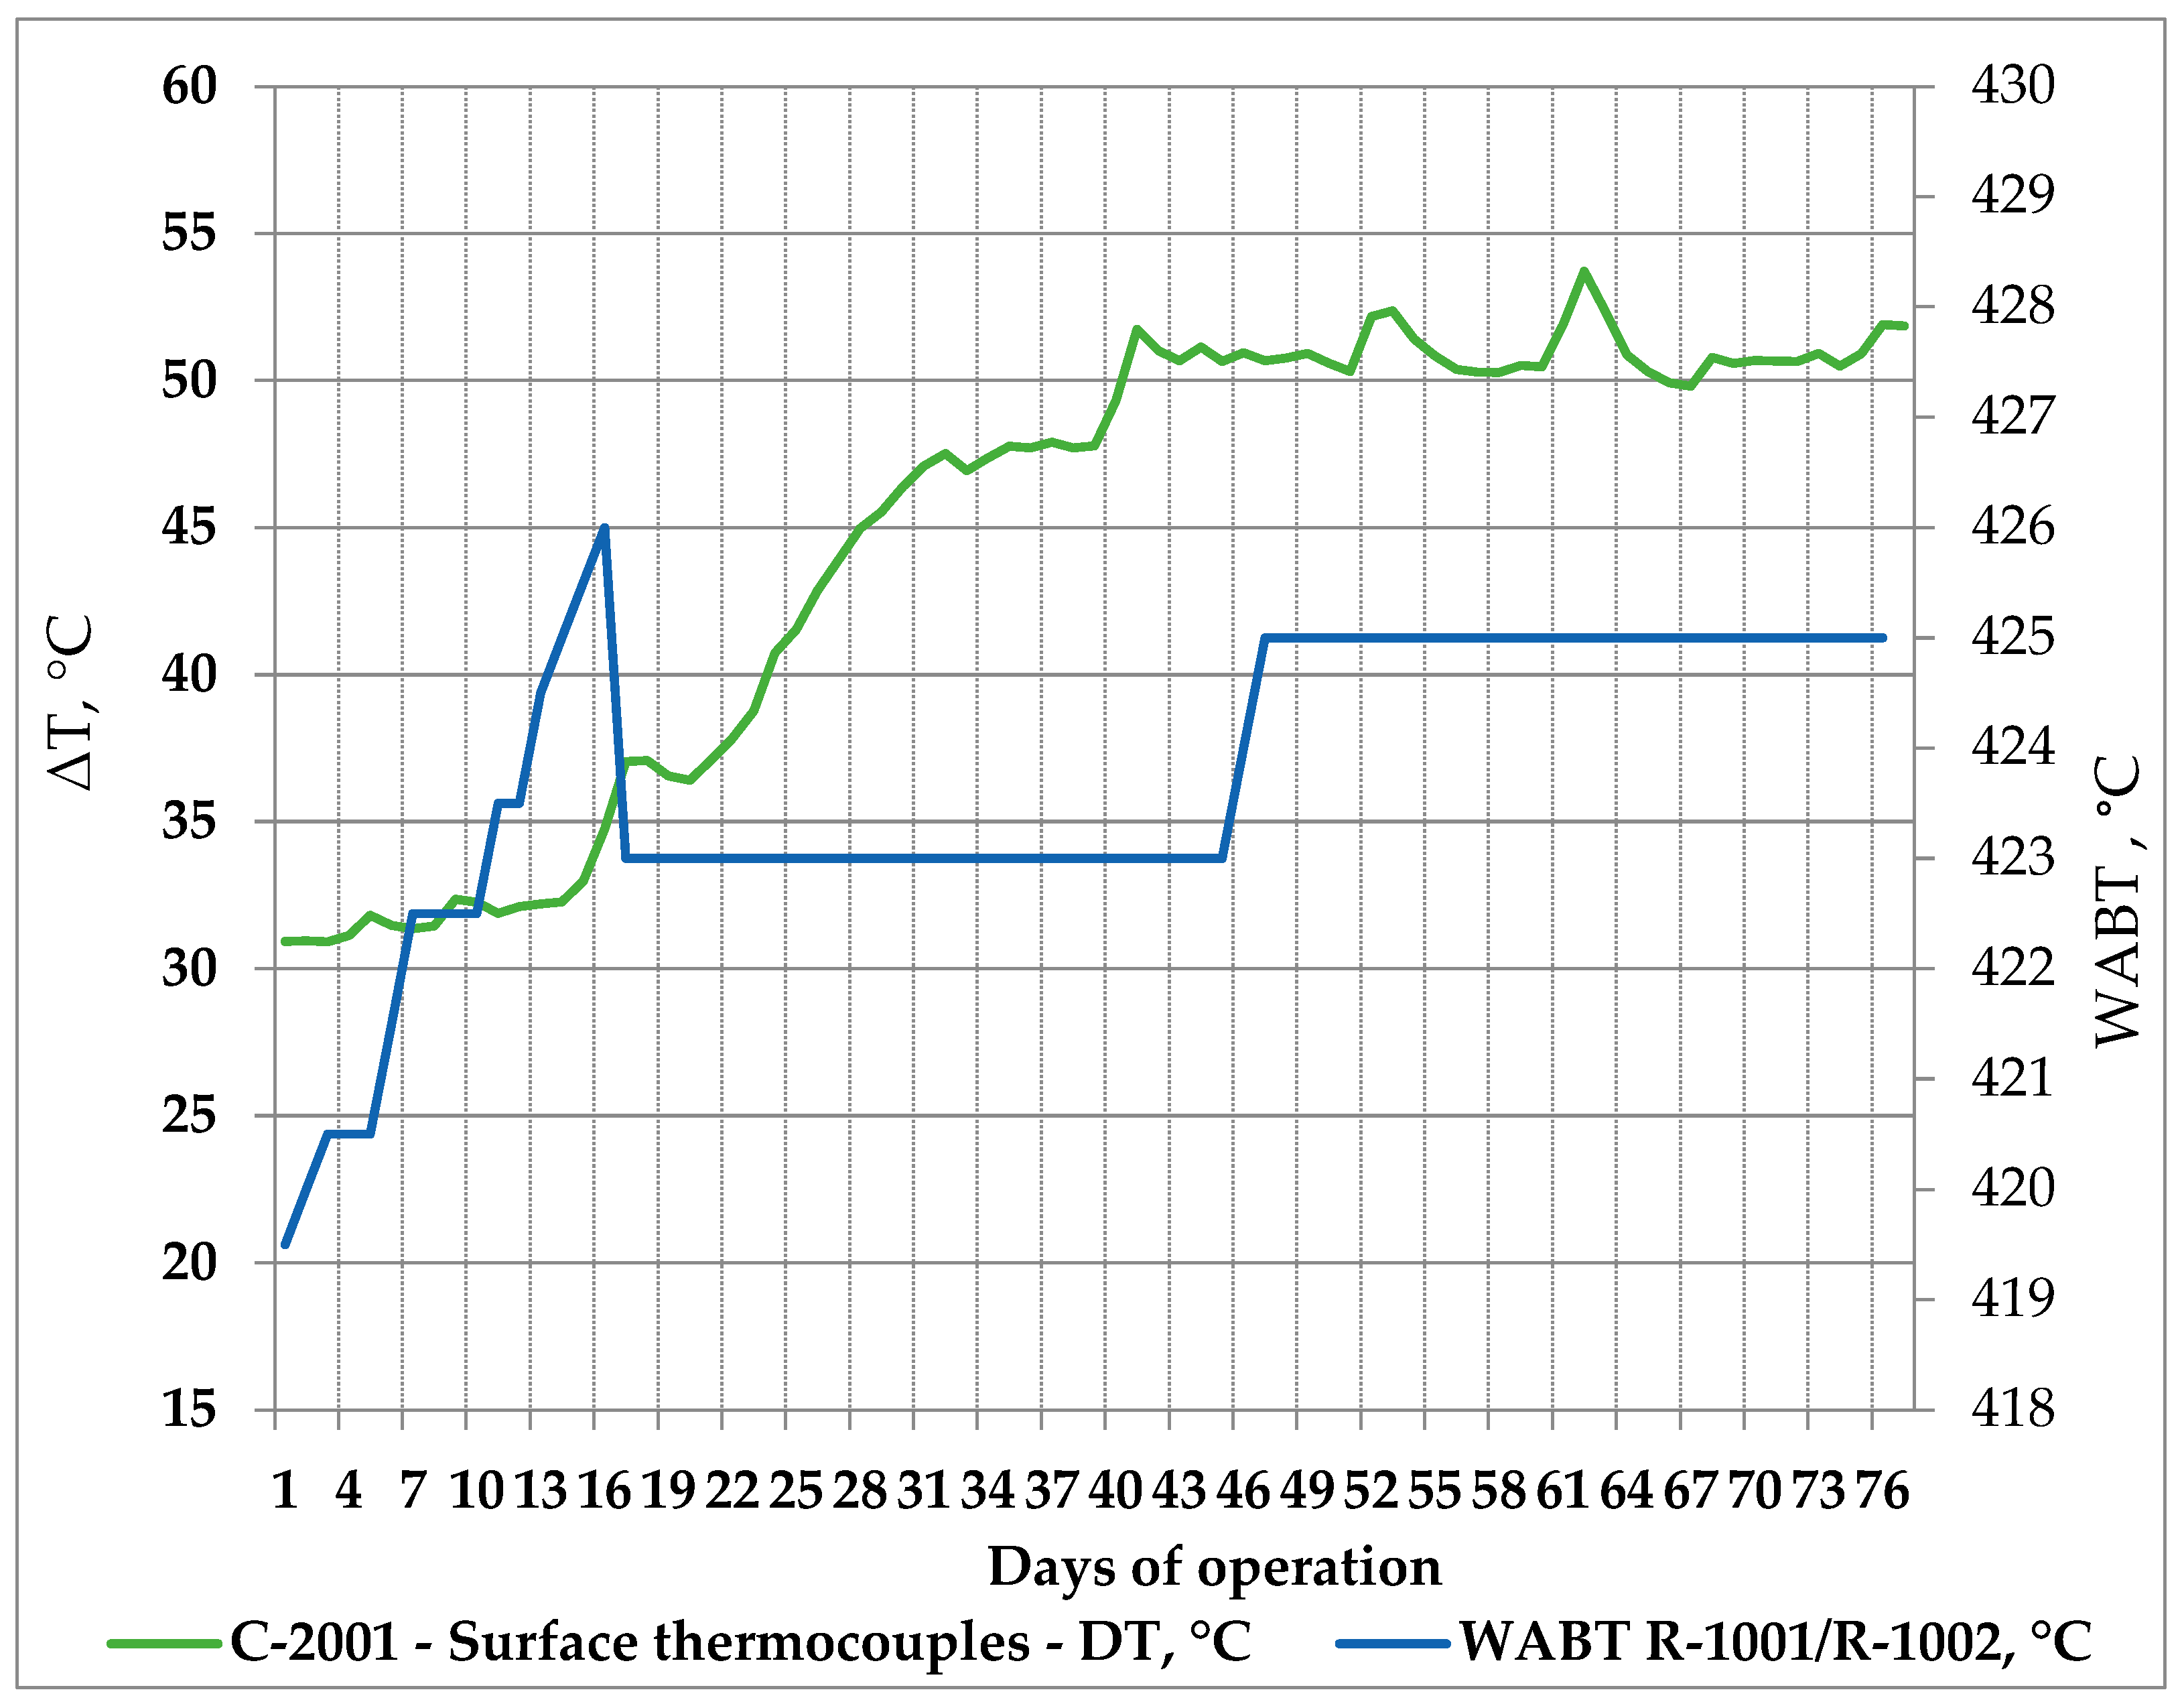
The processing of 11 crude oils and atmospheric residue in the LNB refinery for 76 days was also associated with an increased fouling rate in the ebullated bed vacuum residue hydrocracking unit as displayed in Figure 9. More about H-Oil fouling and the variation of the difference between readings of the ATB product temperature and the atmospheric tower bottom skin temperatures can be found in [54].
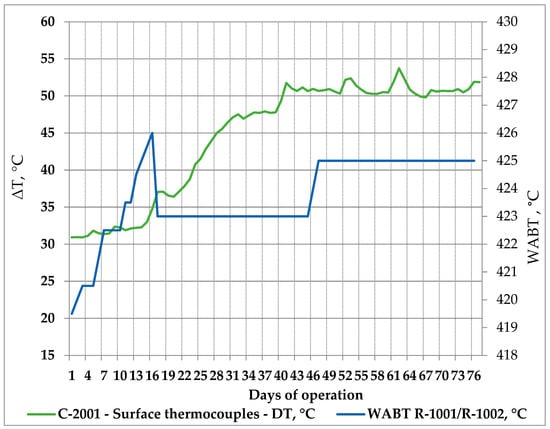
Figure 9.
H-Oil vacuum residue hydrocracking fouling rate and reactor temperature variation during processing of the nine crude oils and atmospheric residue in LNB refinery for 76 days.
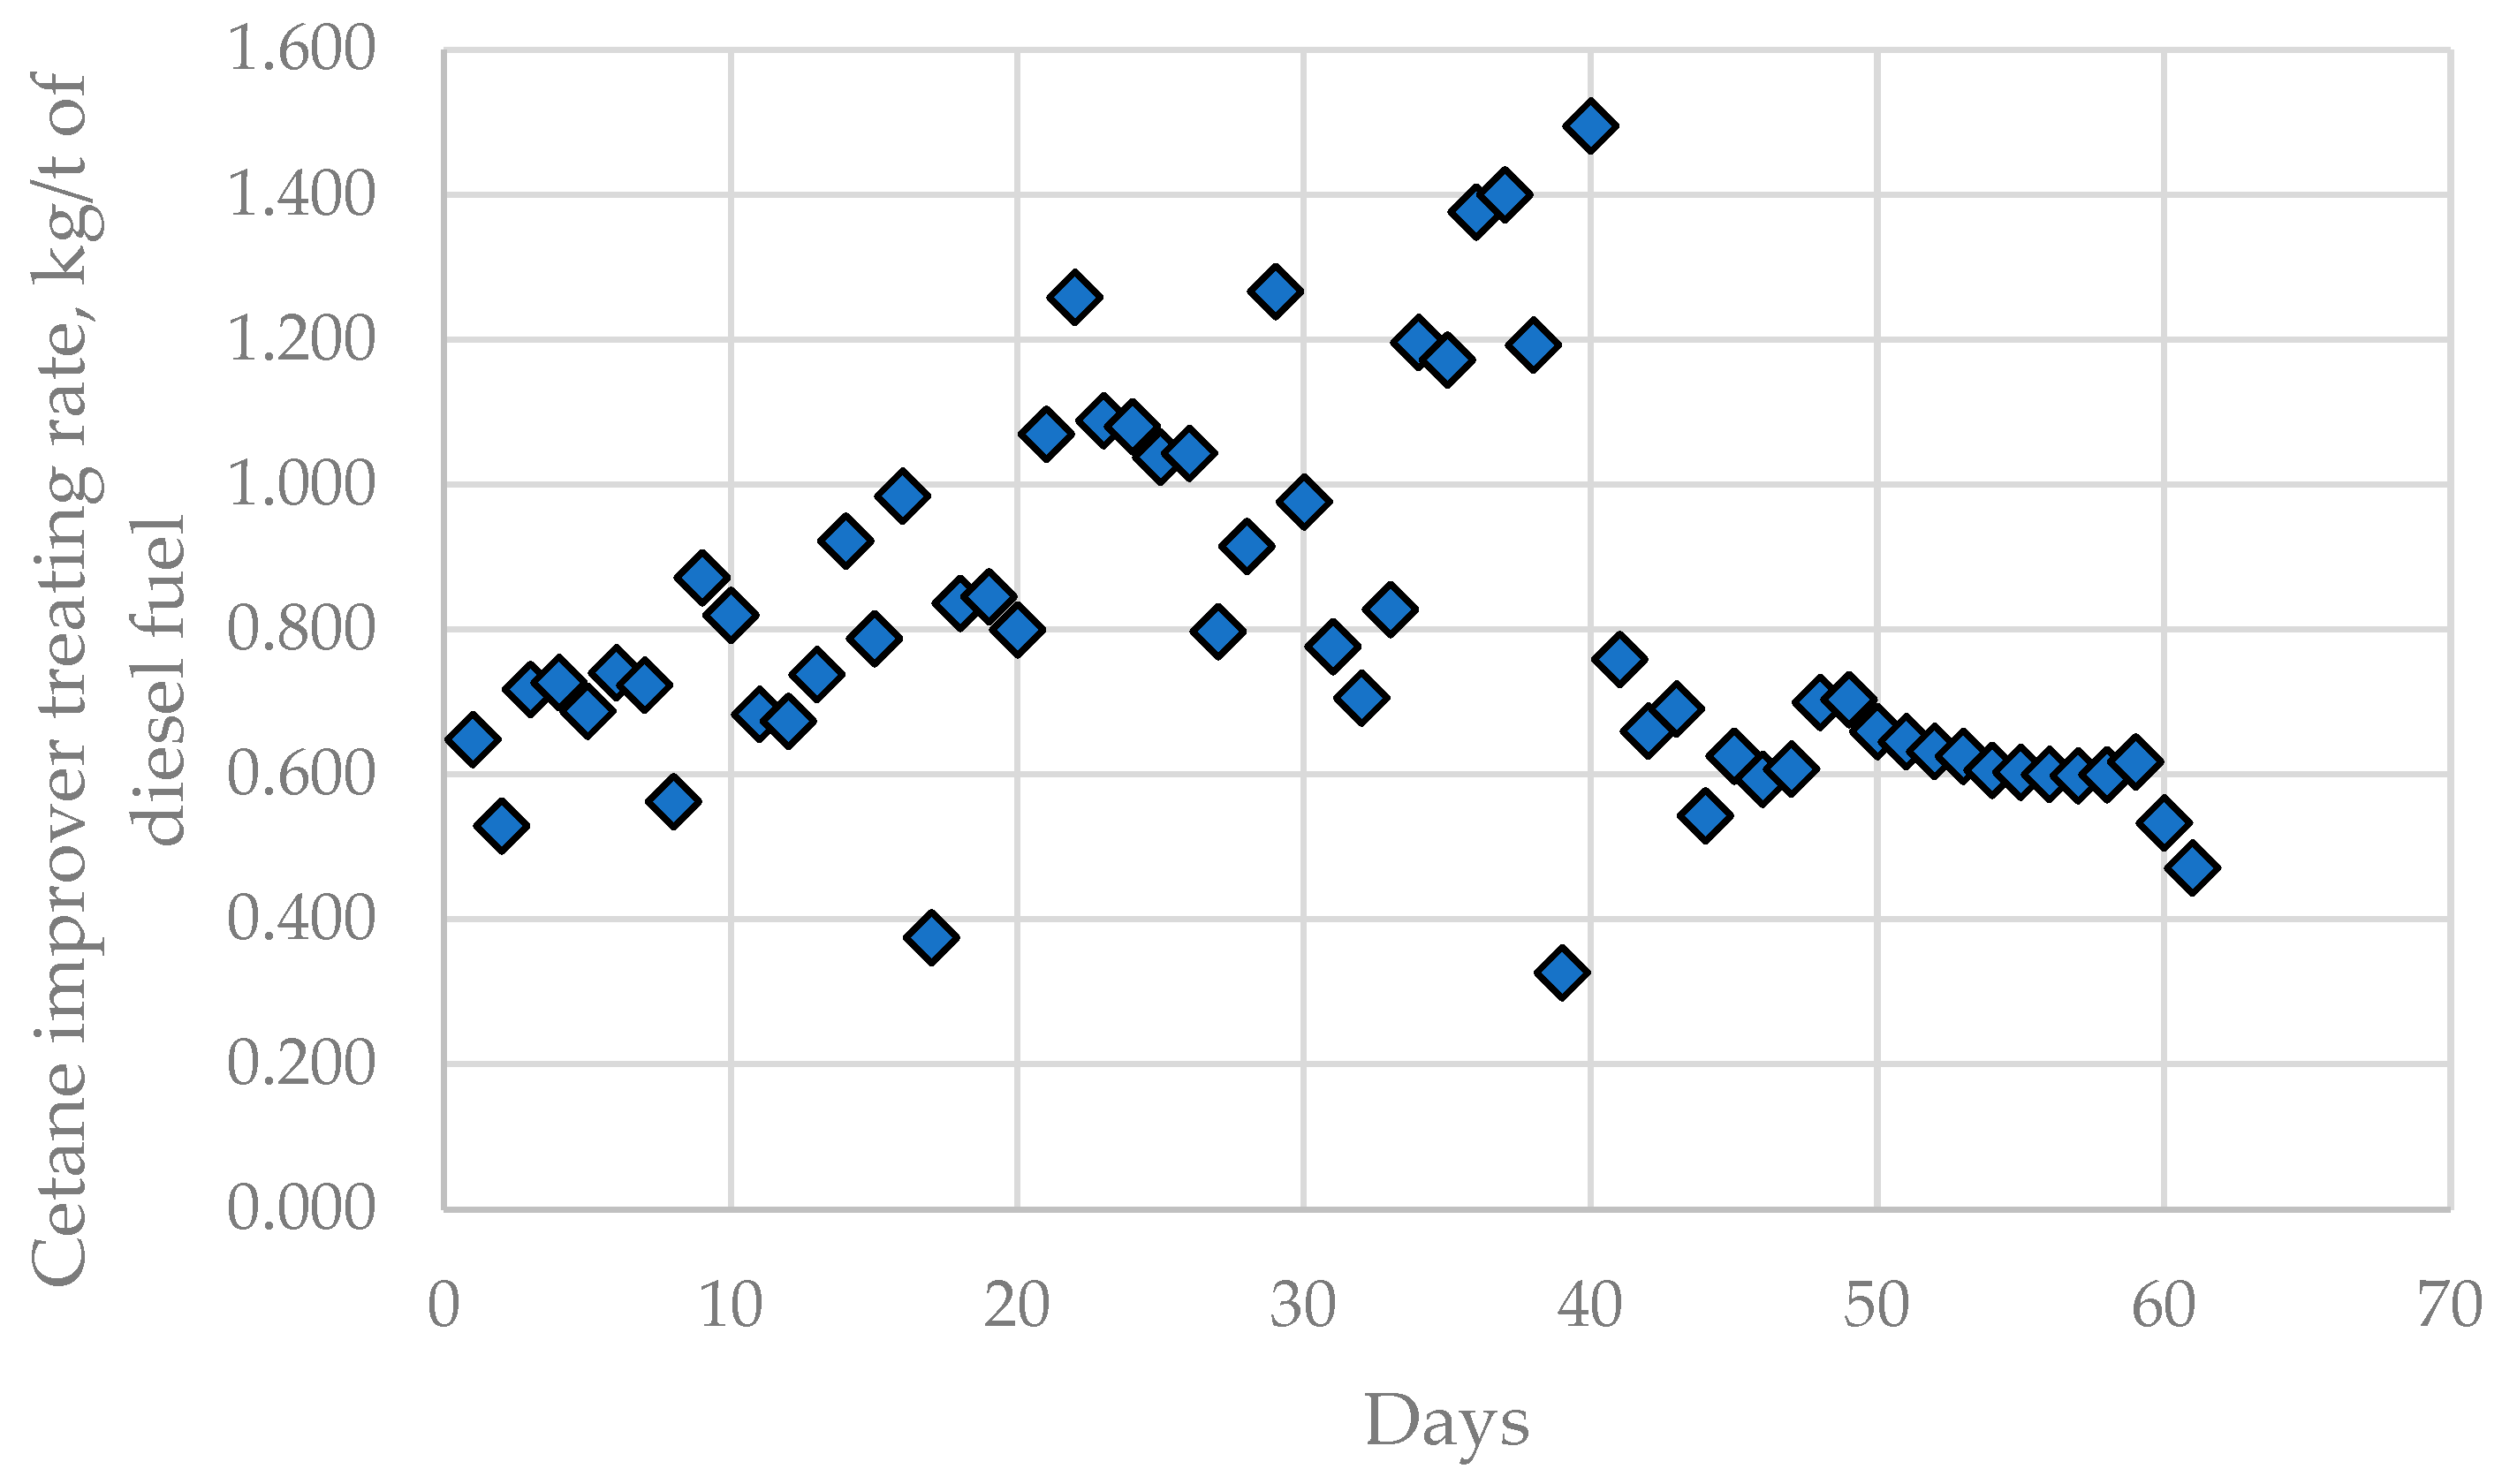
In addition to alteration of the caustic treatment rate in LNB CDUs, the fouling rate in the H-Oil vacuum residue hydrocracker cetane improver treating rate was also found to fluctuate during processing the nine crude oils and imported residue, as shown in Figure 10.
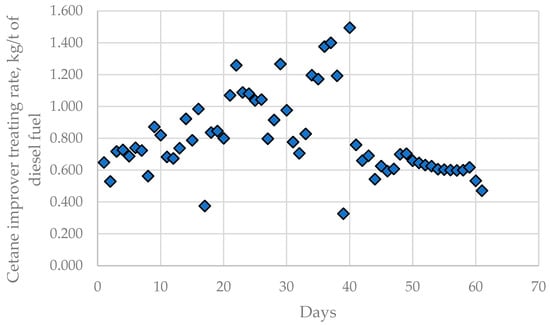
Figure 10.
Cetane improver treating rate variation in LNB diesel blending unit during processing of the nine crude oils and imported residue for the investigated period of 61 days.
Data from the performance of commercial LNB refinery units, namely CDU, H-Oil, fluid catalytic cracking (FCC), and diesel blending, are shown in Table S12 and were evaluated using ICrA. Tables S15 and S16 summarize μ-values and υ-values from the ICrA evaluation of data from Table S12 and Figure 1. Concerning H-Oil vacuum residue hydrocracker fouling, three variables are seen from the data, in Tables S15 and S16, that have statistically meaningful consonances: negative consonances with the content of KEBCO in the crude blend (μ = 0.22; υ = 0.77) and with the middle distillate cetane index (μ = 0.14; υ = 0.85) and a positive consonance with the cetane improver treating rate (μ = 0.78; υ = 0.22). This implies that the increase in content of KEBCO in the crude blend and cetane index of the middle distillate fraction is associated with a decrease in the H-Oil fouling rate, while the enhancement of the cetane improver treating rate is in line with fouling rate augmentation.
The level of vacuum residue conversion in H-Oil unit obvious from the data in Tables S15 and S16 and has statistically meaningful negative consonance with the content of BSP in the crude blend and positive consonance with the cetane index of middle distillate fraction. Thus, the magnification of BSP content in the crude blend will be associated with H-Oil conversion reduction, while the increment in the middle distillate cetane index will be related to H-Oil conversion augmentation.
The cetane improver treating rate has a statistically meaningful negative consonance with the middle distillate cetane index (μ = 0.19; υ = 0.80). Figure S2 depicts the dependence of the cetane improver treating rate on the cetane index of the mixed middle distillate fraction calculated on the basis of the data in Table 1, Figure 1, and Table S11. The data in Figure S2 indicate that the calculated cetane index of the mixed middle distillate fraction correlates with the cetane improver treating rate. One can see from the data in Figure S2 that with each 1 point reduction in the cetane index an increment of 0.19 kg/t cetane improver treating rate is required.
Data about characteristics of the mixed vacuum residue, H-Oil fouling, and conversion level was also evaluated with ICrA, and μ-values and υ-values from this ICrA assessment are presented in Tables S17 and S18. The variables affecting H-Oil fouling, H-Oil conversion level, the sediment content in the ATB product, and the sediment content after thermal ageing in the PBFO product determined via the ICrA evaluation are summarized in Table 15. Summary of the results of the ICrA evaluation shown in Table 15 clearly indicate that the parameters negatively affecting H-Oil conversion favour H-Oil fouling. This is supported by the negative consonance of fouling with the vacuum residue conversion. The level of sediments in both ATB and PBFO is favoured by saturate level in the vacuum residue H-Oil feed, and asphaltenes seem to suppress the sediment formation in both heavy oil hydrocracked products because they exhibit negative consonances with ATB, TSE, and PBFO TSP.

Table 15.
Statistically meaningful positive and negative consonances between H-Oil fouling, H-Oil conversion, and the sediment content in the ATB and PBFO products.
The data from the LNB refinery processing units, H-Oil, FCC, FCC feed hydrotreater (Tables S12 and S19–S21), and naphtha reformer, were evaluated using regression analysis, and the following equations were developed.
- where the variables have the following descriptions:
- = Ratio of sulphur to nitrogen content in wt.% in H-Oil vacuum residue feed;
- FR = H-Oil feed rate, t/h.
H-Oil fouling = The difference between the temperatures of the atmospheric tower bottom (ATB) product and the skin thermocouple readings of the bottom of the atmospheric tower column, °C/month
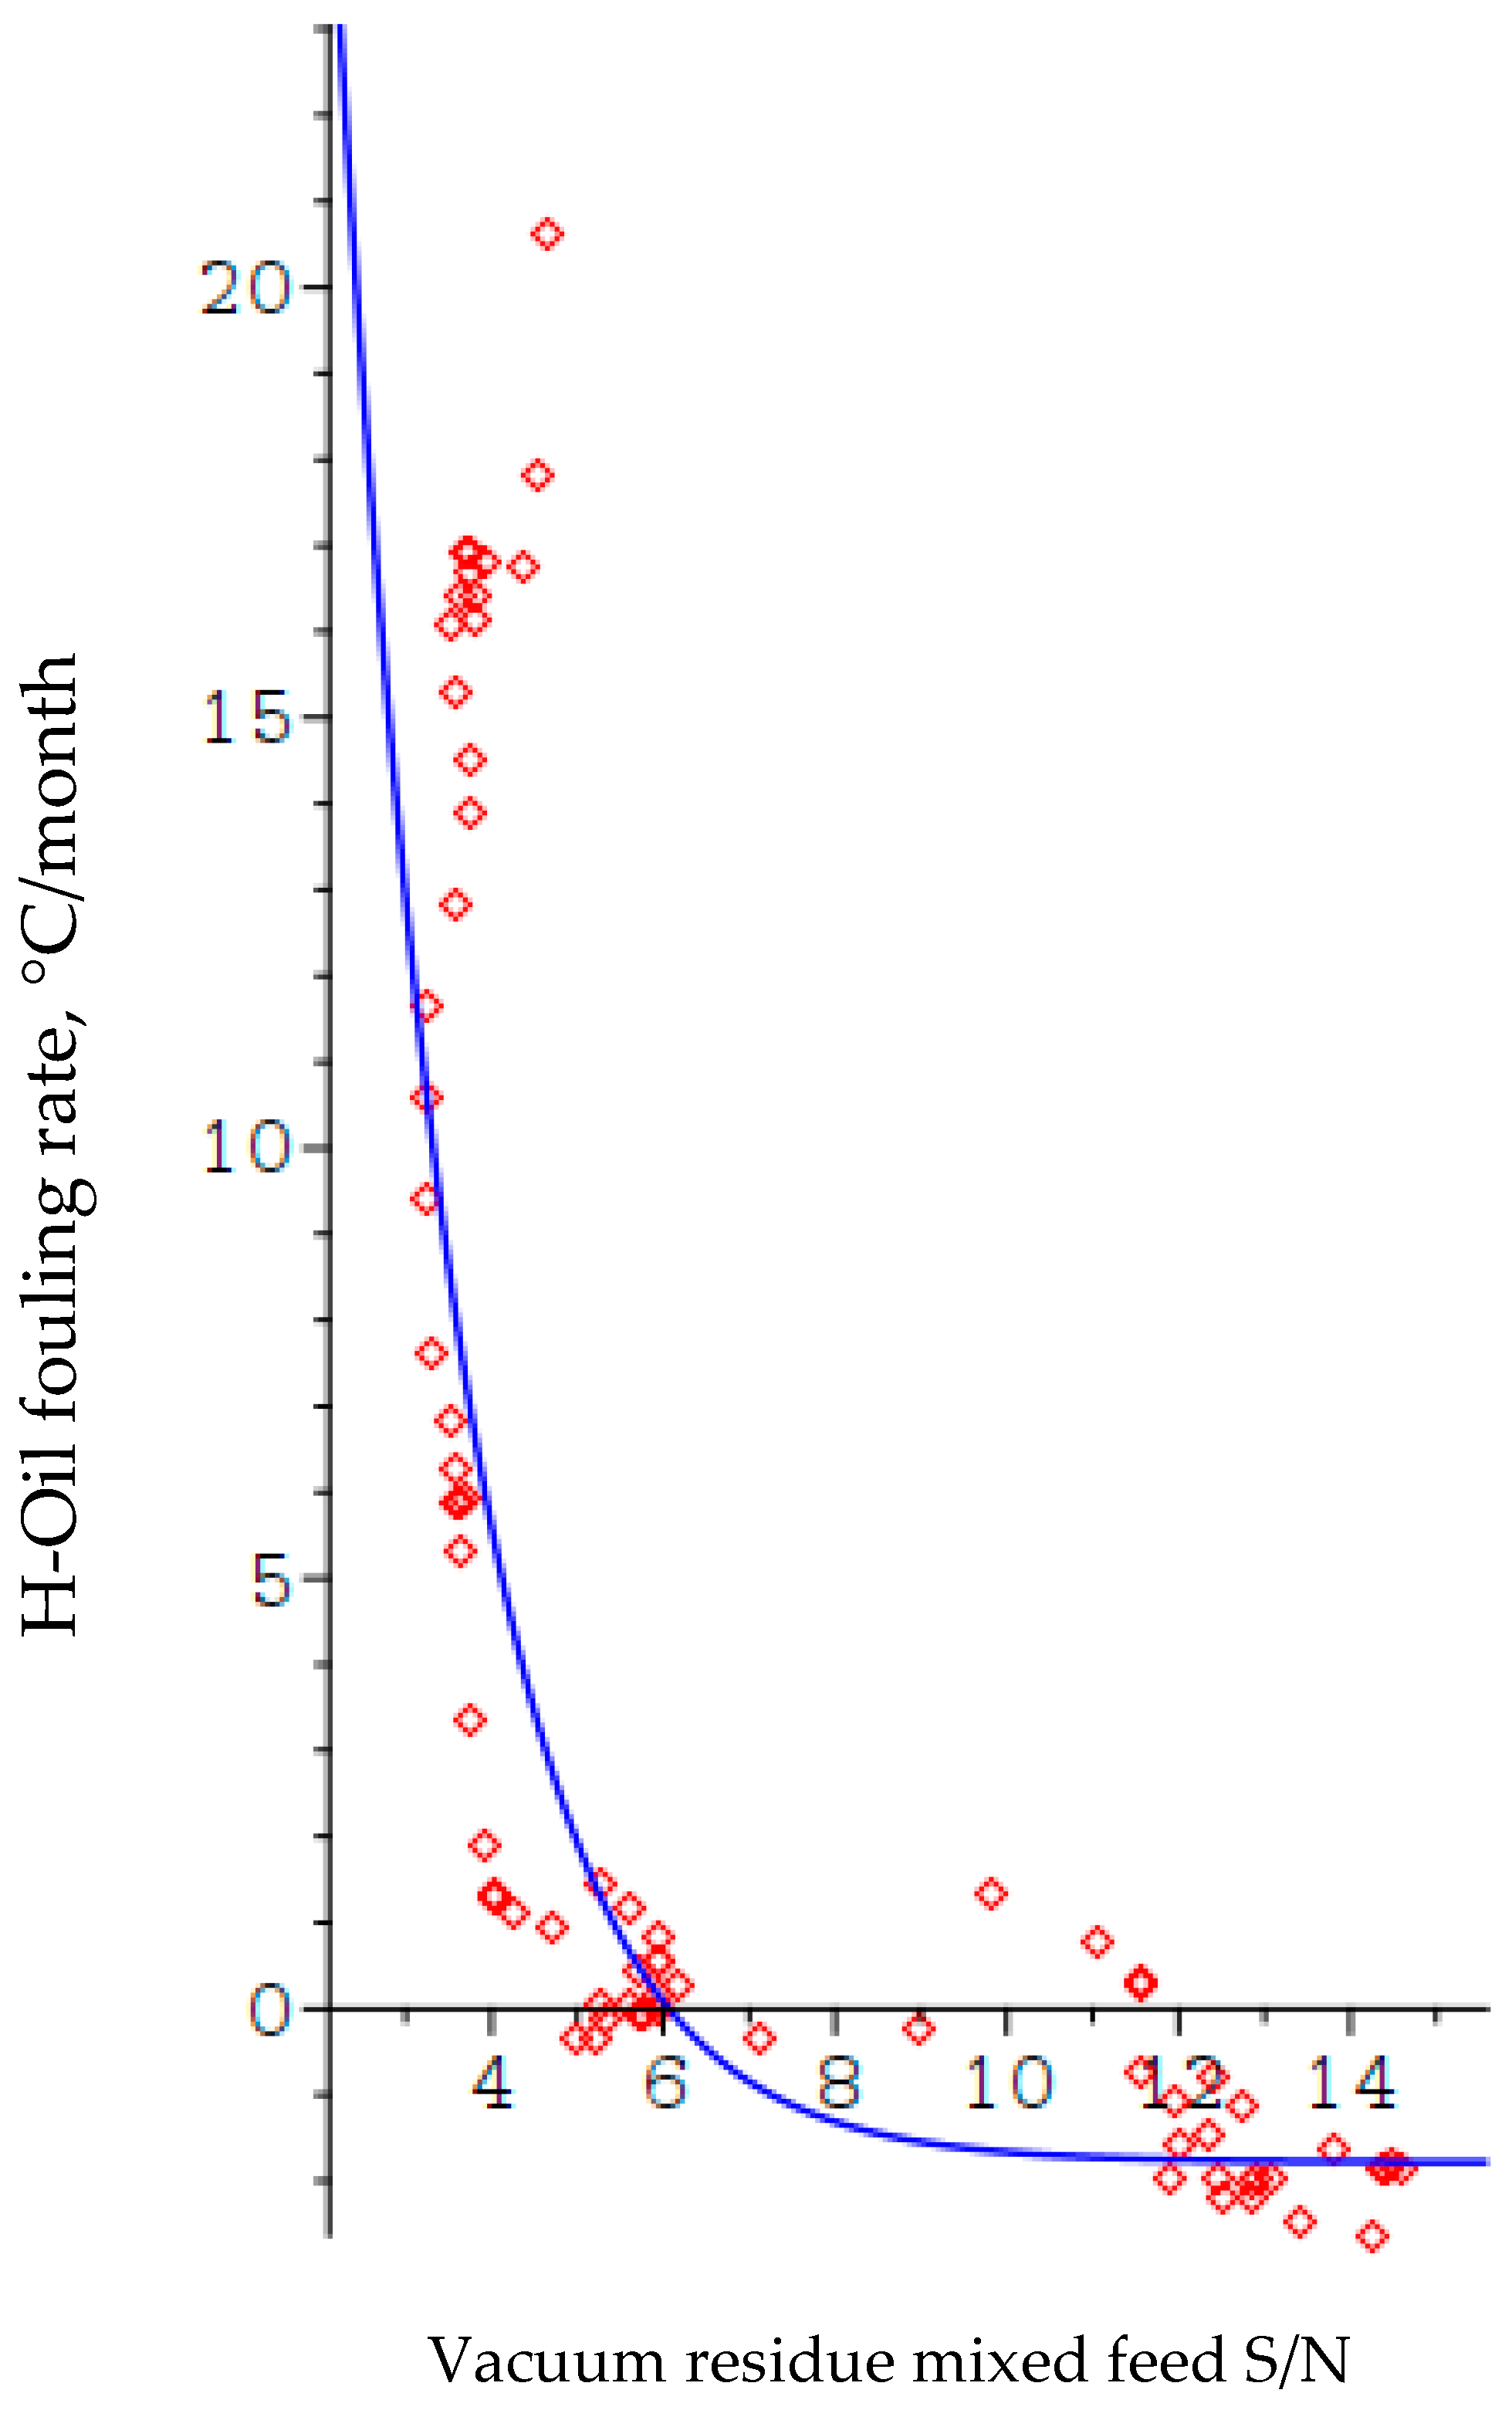
Figure 11 illustrates the dependence of the H-Oil fouling rate on the ratio. The blue line is the model shown as Equation (7), and the red diamonds are the experimental points.
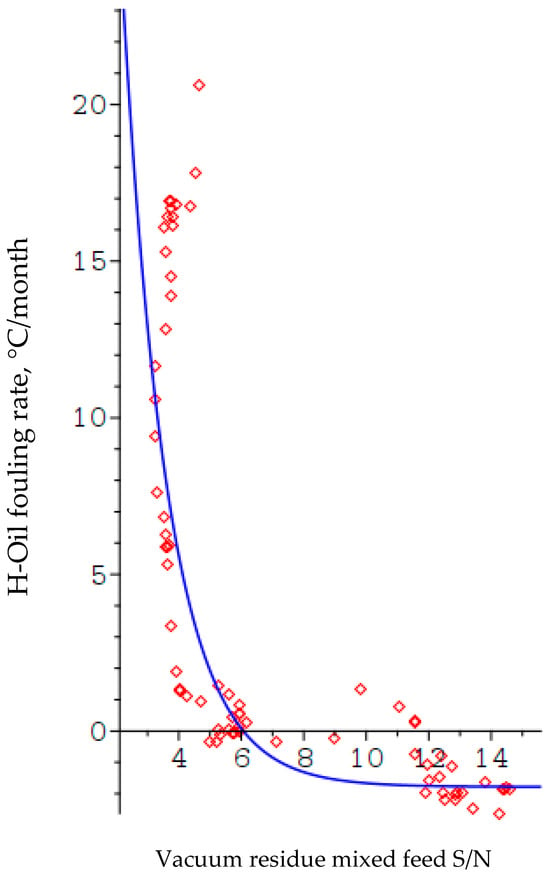
Figure 11.
Relation of ratio of H-Oil vacuum residue feed to fouling rate.
- where the variables have the following descriptions:
- FCC conversion = 210 °C conversion of FCC vacuum gas oil feed, wt.%;
- VGOD15 = Density at 15 °C of FCC vacuum gas oil feed, g/cm3;
- VGON = Content of nitrogen in FCC vacuum gas oil feed, wt.%.
- where the variables have the following descriptions:
- FCCPT WABT norm = Normalized weight average bed temperature in FCC feed hydrotreater reactors, °C;
- VGOS = Content of sulphur in FCC feed hydrotreater vacuum gas oil feed, wt.%;
- VGON = Content of nitrogen in FCC feed hydrotreater vacuum gas oil feed, wt.%.
For each mixed VGO FCCPT feed WABT norm was computed using Equations (10)–(12) as described in [55].
- where the variables have the following descriptions:
- WABT norm = Normalized weighted average bed temperature, K;
- R = Gas constant (=1.987), mol-cal/K;
- Ea = Activation energy, cal/mol (Ea = 32600 cal/mol [56]);
- K = Reaction rate, h−1.wt.%−0.6;
- K ref = Reference reaction rate, h−1.wt.%−0.6;
- WABT act = Actual weighted average bed temperature, K;
- LHSV ref = Reference liquid hourly space velocity, h−1;
- n = Reaction order (in FCCPT HDS n = 1.6 [56]);
- C ref = Desired product sulphur concentration, wt.%;
- C f,ref = Reference feed sulphur concentration, wt.%.
- where the variables have the following descriptions:
- Reformate yield = Yield of reformate in naphtha reformer, wt.%;
- Naph = Content of naphtheneds naphtha reformer feed, wt.%;
- ReformerFR = Feed rate in the naphtha reformer, m3/h;
- WAIT = Weight average inlet temperature of the four reforming reactors, °C.
All studied nine crude oils and the imported atmospheric residue were compared for their performance in the petroleum refinery using Equations (6)–(13), and the results of calculations are summarized in Table 16.

Table 16.
The calculated LNB refinery performance indicators for all studied 11 crude oils and imported atmospheric residue employing Equations (6)–(13).
The data in Table 16 indicate that the crude oils BTV, BSP, and NSJ exhibit poor refinery performance in terms of very-high H-Oil fouling rate and lower conversion in the most profitable oil refining processes, H-Oil and FCC. The high-sulphur Middle East oils (Basrah Medium and Kirkuk) display relatively high FCCPT WABT norm that suggests the presence of species which inhibit hydrodesulphurization in the vacuum gas oils derived from these crudes.
4. Discussion
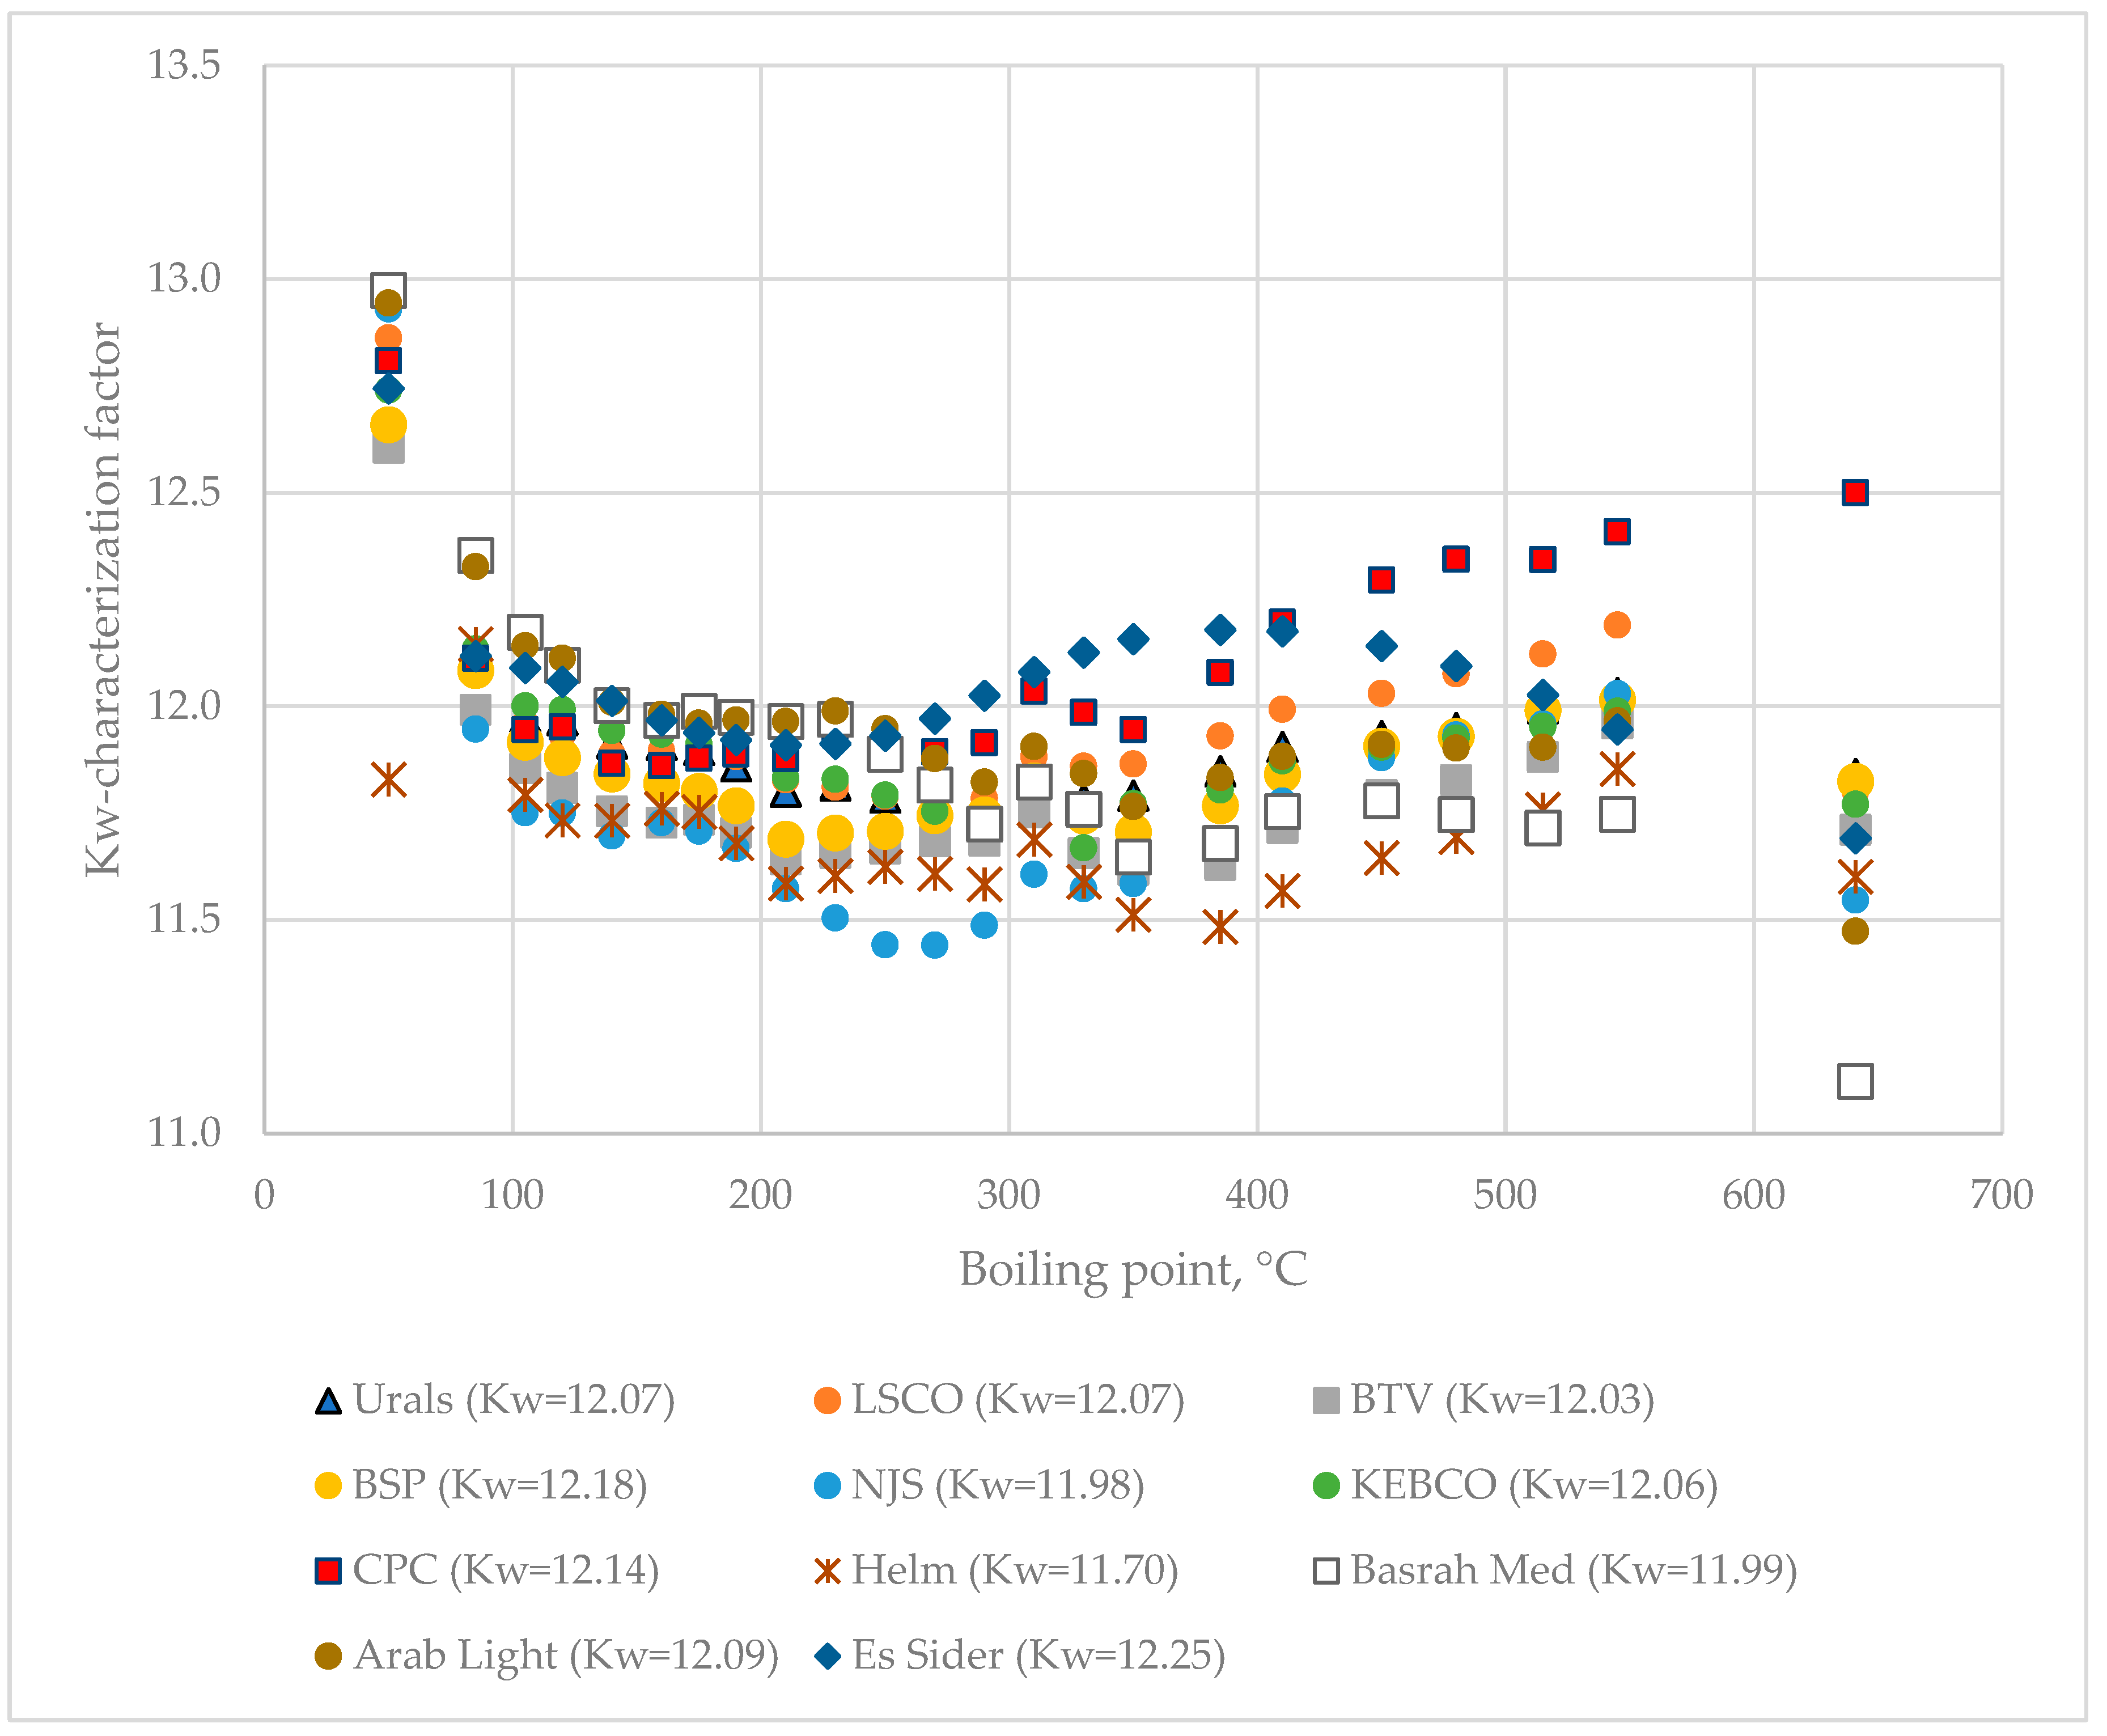
The data for distillation characteristics of crude oils (Table 1 and Table S1) according to true boiling point (TBP) and ASTM D 86 methods and the developed Equations (S1)–(S6) show that the faster lower-separation-efficiency Engler distillation can be used as a substitute of the higher-separation-efficiency and much slower TBP analysis for quick monitoring of distillation characteristics of crude oils processed in a petroleum refinery. The relation established in this work between molar excess volume and the difference between measured volumetric yield of fraction boiling up to 240 °C and the estimated yield using the linear blending rule on the basis of ASTM D 86 distillation data (Figure 4) is completely in line with that observed in [44], where TBP distillation data were employed. This can be considered as another testimony to the good agreement between TBP and ASTM D 86 distillation data of crude oils. Another option for rapid and accurate determination of the TBP distillation curve could be the combination of the ASTM D 86 method with HTSD, which was shown to be equivalent to TBP for petroleum fluids boiling at temperatures above 180 °C [56], which would take 4 h instead of the three working days required for TBP analysis. While the TBP characteristics of a crude oil can be quickly obtained using the methods mentioned above, the density of oil fractions, a very important parameter in oil characterization [43,57,58,59,60,61,62,63] cannot be simulated. The assumption that the Kw-characterization factor is invariable throughout the petroleum [64,65,66] is not valid for the studied eleven crude oils as shown in Figure 12. The data in Figure 12 indicate that the difference between the maximum and minimum Kw-characterization factor of oil fractions oscillates between 0.7 and 1.9 being the lowest for Helm crude oil and the highest for Basrah Medium petroleum. If the Kw-characterization data for CPC and Basrah Medium crude oils are compared, one can see that, up to 230 °C, the oil fractions from Basrah Medium have a higher Kw-factor (≥12.0), while above this boiling temperature the CPC oil fraction Kw-factor starts to increase, reaching 12.5 for the vacuum residue, while that of Basrah Medium gradually decreases, reaching a Kw-factor of 11.1 for the vacuum residue.
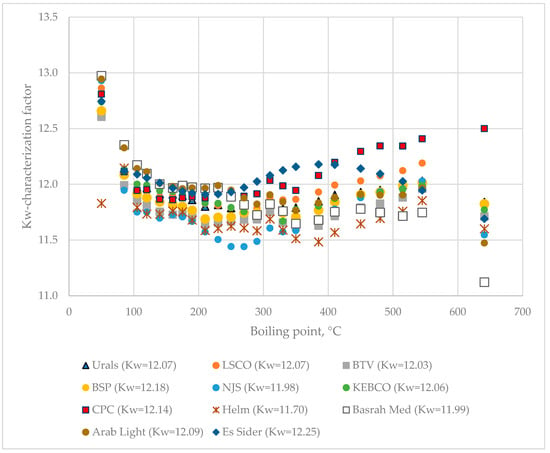
Figure 12.
Kw-characterization factor variation with boiling point alteration of the nine studied crude oils.
Thus, although slow, the TBP analysis with density and sulphur measurement of distilled fractions provides very valuable information about oil fraction physicochemical characterization. This was proved with the correlation found between the calculated mixed middle distillate cetane index and the cetane improver treating rate (Tables S13 and S14, Figure S2).
The foaming observed during ASTM D 86 distillation of pure BTV crude oil (Video S1) and some blends of BTV with the crude oils Urals and Light Siberian is supposed to be due to water present in BTV crude oil. This is supported by the fact that the pure BTV was not possible to distill, as illustrated in Figure S3, until the crude oil sample was treated with a desiccant (CaSO4). Then, even after drying the pure BTV crude oil sample, the foaming shown in Video S1 was observed. The ICrA evaluation (Tables S3 and S4) with statistically meaningful μ-values and υ-values between ranking (the lower ranking means higher intensity of foaming) with water content (μ = 0.9 and υ = 0.10) confirms that water seems to be the reason for foaming. The statistically meaningful μ-values and υ-values with viscosity (μ = 0.9 and υ = 0.10) suggest that the higher the viscosity, the higher the intensity of foaming is, which is in line with the reports of Koczo et al. [67], Wang et al. [68], and Pooladi-Darvish and Firoozabadi [69]. Unfortunately, the root cause for petroleum fluid foaming is still unclear [70]. The asphaltene content in oil and the presence of hydroxyl groups, carboxylic groups, amine, and heterocyclic rings are reported by Sun et al. [70] to have considerable influence on the oil foaming phenomenon. For the studied samples demonstrating foaming (Table S2), it is difficult to deduce which is the underlying reason for the observed foaming. The reason why foaming occurs at boiling temperatures above 240 °C, given the presumed involvement of water in this process, is also unclear.
The employed procedure in this work, used to calculate the properties of mixed naphtha, kerosene, diesel, vacuum gas oil, and vacuum residue on the basis of crude blend composition, TBP fraction yields of each crude oil, and measured characteristics of oil fractions, allowed for the obtainment of the properties of feedstocks for refining processing units. Figure S4, for example, illustrates the very good agreement between sulphur content in the VGO, feed for the FCC feed hydrotreater, and that calculated using the method explained above.
The results of oil colloidal stability tests (Table 3), calculated on their base oil compatibility as displayed in Table 6, indicate that the processed crude oil blends were compatible. This is in line with the observed good performance of the crude oil desalting unit and the absence of fouling in CDUs. Despite the high salt content of some of the processed crude oils (BTV, BSP, NSJ, and Helm, see Table 1), the desalted crude contained levels not higher than the specified maximum of 5 ppm chlorides content for the studied period of 76 days.
The data in Figure 6 indicate that, as from the 15th day of the study period, the pH of CDU sour water got lower than the specified minimum limit of 5.5. In order to neutralize the higher crude blend acidity, the caustic treatment rate was increased from 5.6 to 20 ppm. The ICrA evaluation (Tables S13 and S14) revealed that both crude oils BTV and BSP (Figure 8) contributed to the higher crude blend acidity, with BSP being the dominant factor (Figure 7). A rule of thumb is that crude oils which have a total acid number (TAN) higher than 0.5 mg KOH/g are considered acidic and probably problematic from a corrosion point of view [71,72]. Qu et al. [73] announced that the higher-TAN crudes are more corrosive. Jayaraman, et al. [74], however, communicated that some petroleum crudes demonstrate high corrosiveness although they have low TAN, and their corrosion activity is close to that of high-TAN crudes. Despite the low TAN of the crude oils BTV and BSP (0.15 and 0.34 mg KOH/g, respectively) their acidity was obviously much higher than that of the design Urals crude oil (TAN of 0.11 mg KOH/g). This observation is in line with the conclusion of Barrow et al. [75], that TAN is not a reliable tool for assessing the acid content of petroleum, because it also measures species which have “mobile protons” like esters, phenols, resins, etc. [72]. The acid structures identified in petroleum crudes were found to contain functional groups of oxygen, nitrogen, aromatics, and sulphur, such as alkyl sulphonic acids [76]. That is why the corrosivity of crude oil does not always correlate to the TAN [77] and is dependent on the size and structure of acid species [71,72,78,79]. The higher molecular weight acids were announced to have lower corrosion activity, while the low molecular weight acids manifest a very high corrosivity [80]. Unfortunately, TAN does not provide valuable information about the molecular composition of acidic species that are linked to the corrosivity of the petroleum. The acidity of the crude blends processed in the LNB refinery during the studied period started to decrease with the reduction in BSP content. Laredo, et al. [18] mentioned that high corrosivity, low-TAN crudes had lower sulphur content. Indeed, the BSP crude oil has the highest ratio (0.829) among all nine studied crude oils. The calculated ratio for the crude blend was found to statistically meaningfully correlate with the caustic treatment rate with a correlation coefficient R of 0.8, suggesting that this ratio might be used to distinguish crude oils which have the potential to be acidic during processing.
Figure S5 presents graphs of variations in Na content in vacuum residue, the NaOH treating rate in CDU-1, and hydrocracking catalyst Na content. These data clearly show that the increased caustic treatment rate (from 5 to 20 ppm) leads to increased Na content in the vacuum residue (from about 20 to about 50 ppm), that resulted in incremental hydrocracking catalyst contamination with Na (from 0.8 to 2.5 wt.%). The usage of nano-dispersed Mo containing HCAT catalyst requires the Na level in the vacuum residual H-Oil feed to not be higher than 20 ppm, and for that reason, its application in the H-Oil unit was stopped from the 18th day of the investigated period of time. Na deposition on hydroprocessing catalysts is known to have a detrimental effect on their activity [81]. Na deposition on ebullated bed vacuum residue catalyst is expected to result in at least equal and more likely stronger deactivation (per weight percent deposited) than vanadium and nickel deposition [82]. The Na deposition mechanism is different to vanadium as its higher reactivity results in forming a skin on the catalyst particle surface which blocks access to the active sites in the catalyst pores [82].
The data in Figure 9 indicate that, as from the 15th day of the studied period, the ΔT between H-Oil atmospheric residue product and atmospheric tower bottom skin temperatures got increased. The enhancement of ΔT implies a reduction in skin temperature readings at a constant atmospheric residue product temperature. This parameter is typically used as an indicator for fouling [83]. Thus, fouling augmentation was registered from the 15th day to the 41st day. In this period, the dominant crude oils processed in the oil blend were BTV, BSP, and NSJ, which is proved with the data in Table 16.
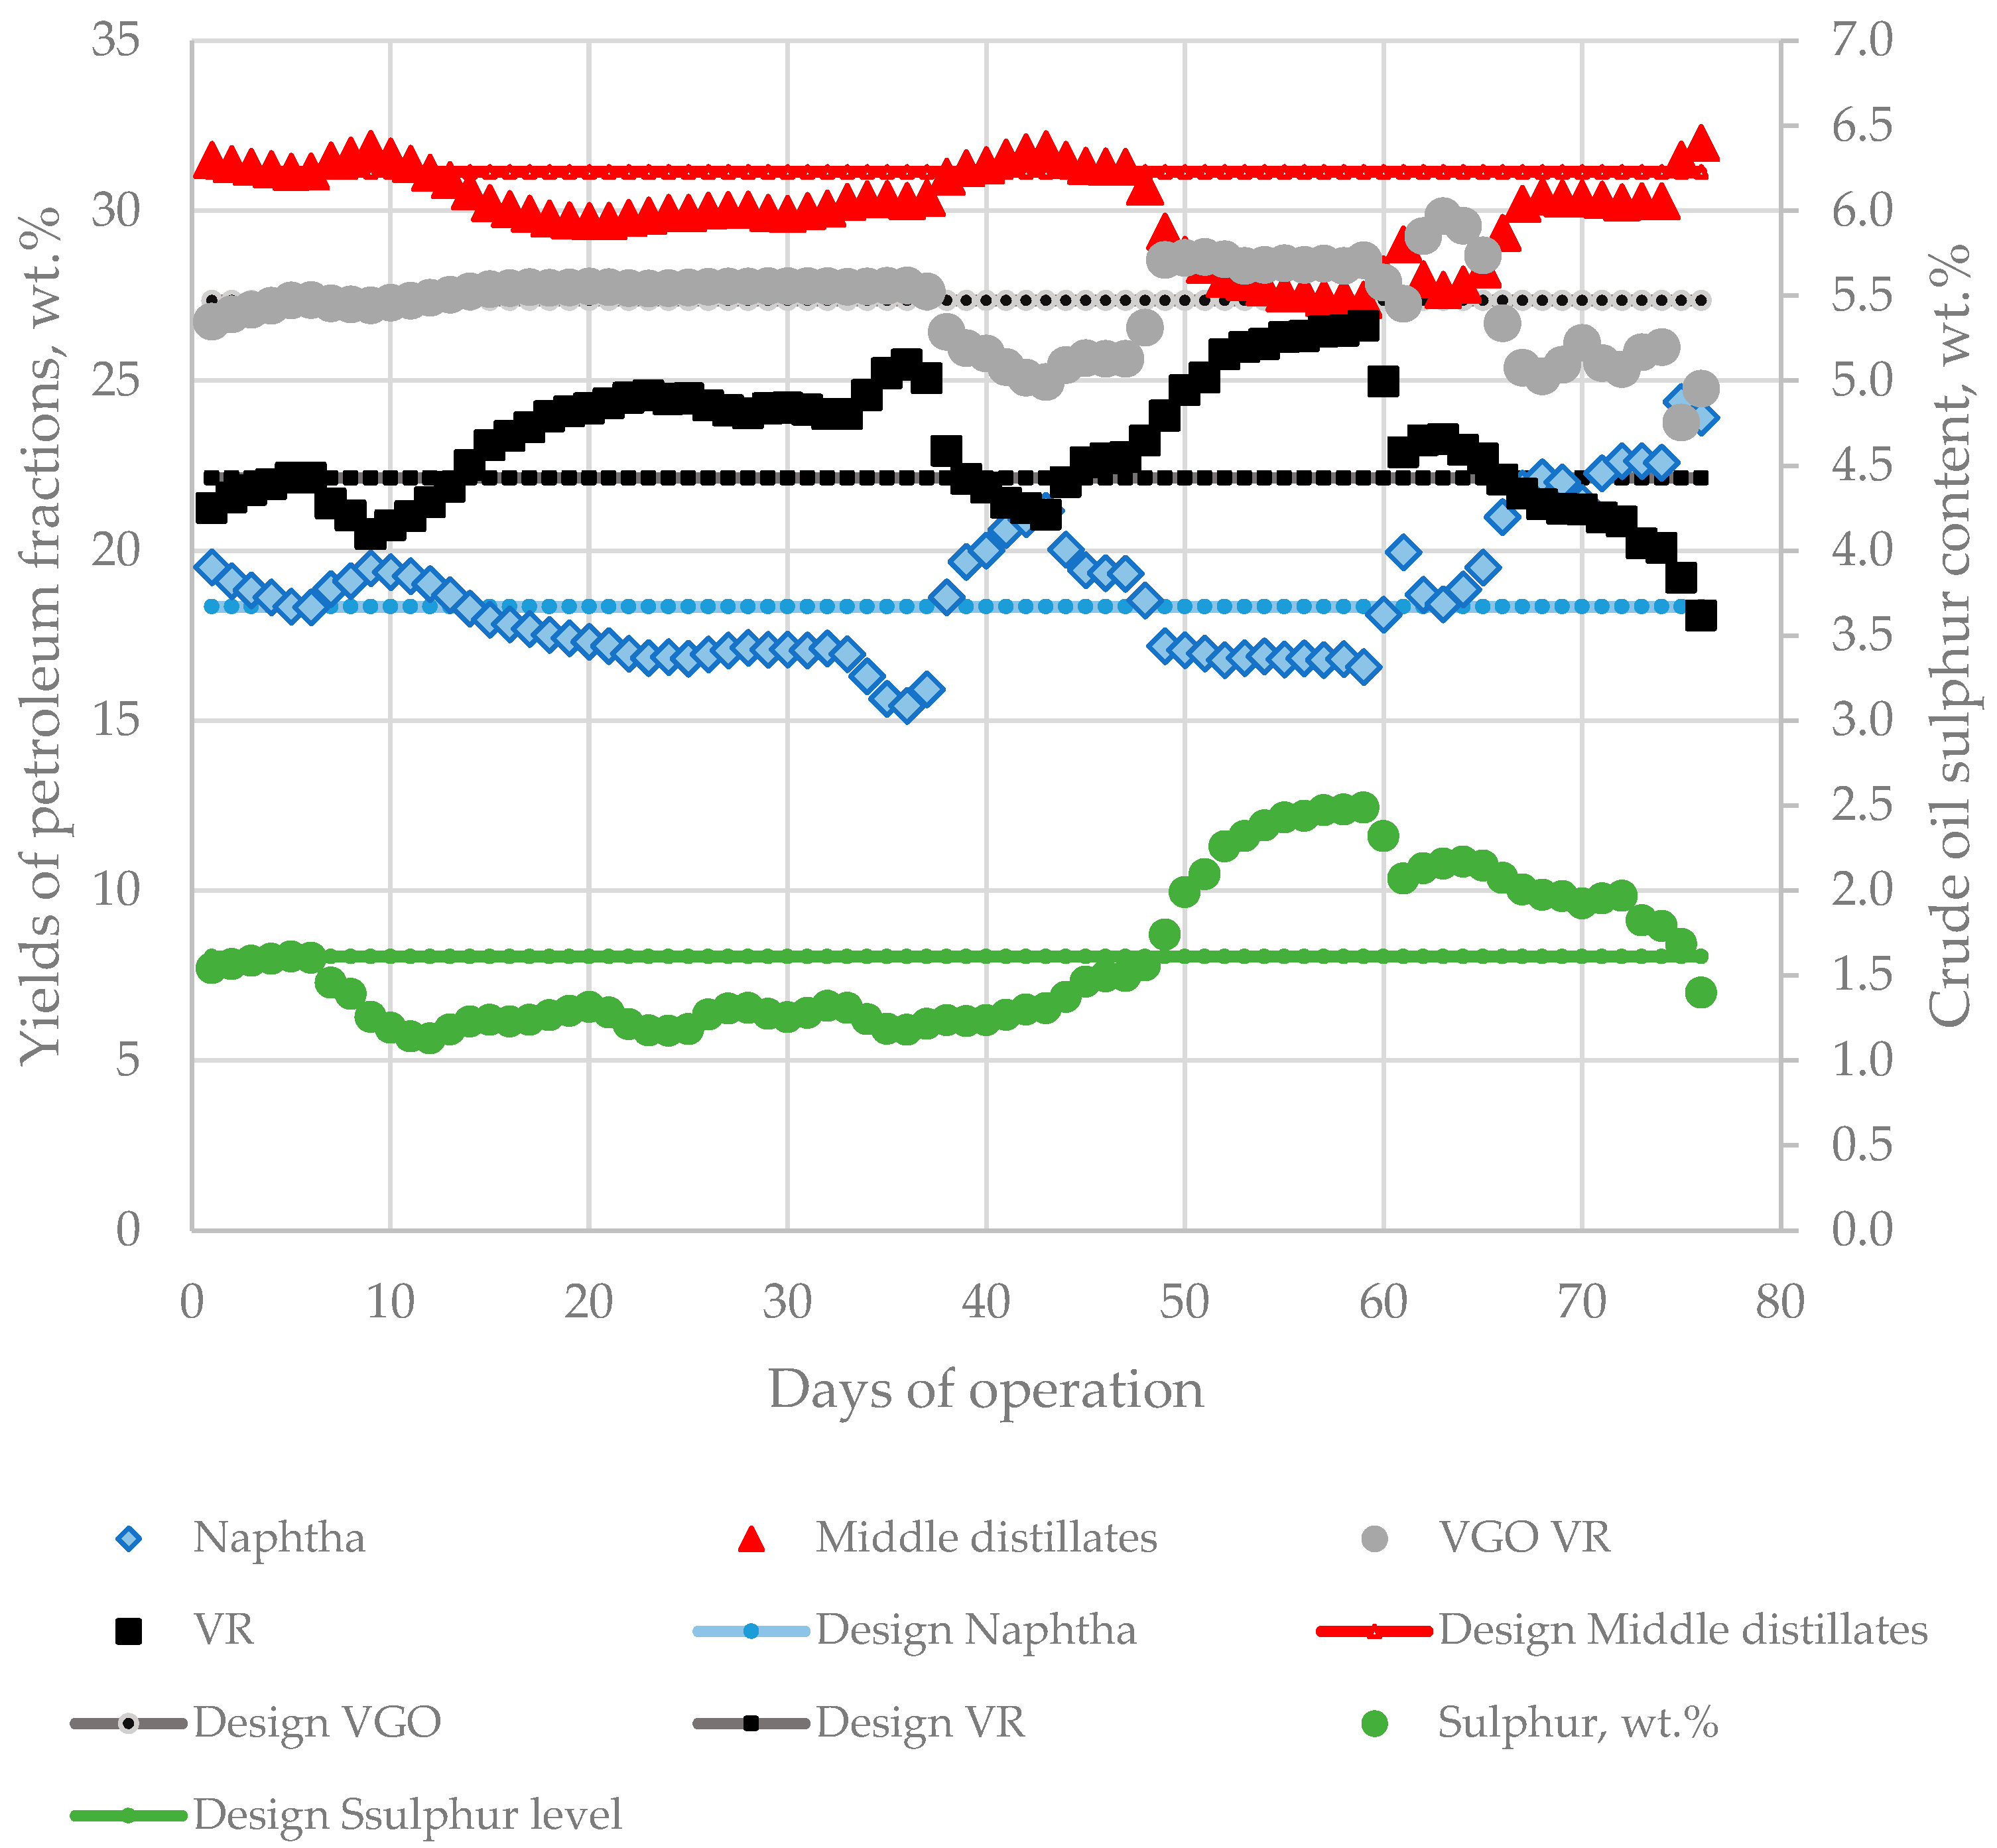
Replacing the design crude in a petroleum refinery is a challenging task due to variation of crude blend fraction composition and sulphur content, which, as shown in Figure 13, for some operating days, differed significantly from the design crude characteristics. This exerts pressure on the operating equipment (furnaces, columns, separators, reactors, etc.) design to work at specific flow rates, which, as indicated in Figure 13, fluctuated considerably during the studied period.
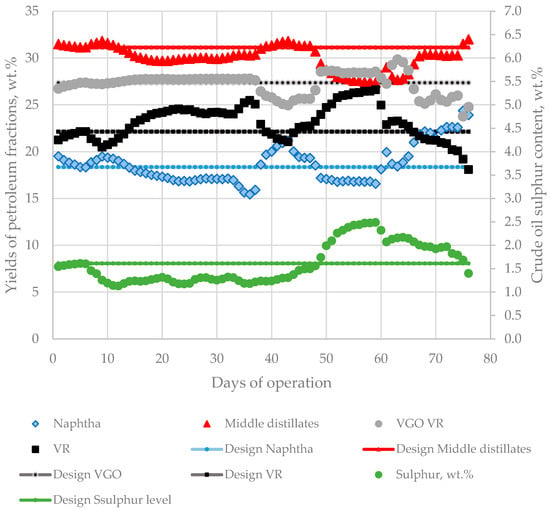
Figure 13.
Variation of fraction yields and sulphur content in processed crude oil blends during the investigated period of 76 days compared with the design characteristics of Urals crude oil.
This, along with crude blend acidity and sulphur content, being for some space of time much higher than the design crude characteristics, presented a high risk for the reliable operation of the refinery equipment. The data in Figure 6 exhibit that, between the 63rd and 65th days, the CDU-2 got out of operation because of the appearance a leakage in some coils from the petroleum heater. It was found that some of the material used to make the furnace coils was incompatible with the higher corrosion activity of the processed crude oil blend. The appearance of iron in sour water in CDU-2 as evident from the data in Figure 6 implies that entrainment of iron from CDU-2 equipment with the petroleum fluid has taken place during processing the investigated crude blends, probably a result from the presence of aggressive acidic compounds in the crude mixture. Having in mind that some specific acidic components, which as discussed before are not very well characterized using TAN, together with some sulphur species can provoke a high corrosion rate, especially when equipment material has not been selected considering these aspects during the design phase made on the basis of design petroleum characteristics [84].
5. Conclusions
The process of transition of a high-complexity petroleum refinery to substitute the design Urals petroleum crude with nine alternative crude oils and an imported atmospheric residue were investigated for a period of 76 days using different laboratory tests, intercriteria, and regression analyses. As a result of this investigation, the following conclusions were made:
- 1.
- The ASTM D 86 distillation data correlate with the TBP distillation characteristics, and the derived equations can allow for the use of the the quicker Engler distillation method to monitor the daily variation in crude blend distillation features;
- 2.
- The molar excess volume was confirmed to correlate with the difference between the calculated light fraction yield using the linear blending rule and the measured one availing ASTM D 86 distillation;
- 3.
- The high viscosity and water content in BTV crude oil have a high consonance with the intensity of foaming observed during ASTM D 86 distillation of crude blends made of Urals and Siberian Light crude oils confirming reports about petroleum fluid foaming that high viscosity favours foaming;
- 4.
- The TBP analysis of crude oil along with density and sulphur content measurements of narrow oil fractions provide information about the variation of physicochemical properties with boiling point alterations that cannot be delivered using other faster distillation methods like ASTM D 86 and the high-temperature simulated distillation;
- 5.
- The TBP analysis data, along with characterization of the naphtha fraction (PIONA), vacuum residue, and information about crude blend composition, can be used to calculate all required feed characterization data for the processes: reformer, FCC, VGO HDS, and H-Oil vacuum residue hydrocracking;
- 6.
- The TAN of crude oil was confirmed to be incapable of providing reliable information about the acidity of the crude oil. The ratio was found to correlate with the caustic treatment rate in CDUs;
- 7.
- The fourfold enhanced caustic treatment rate in CDUs results in threefold augmentation of the Na content on the H-Oil catalyst;
- 8.
- The vacuum residue characteristics, sulphur, and nitrogen contents affect both H-Oil conversion and fouling. Increasing sulphur content and decreasing nitrogen content favour H-Oil conversion enhancement and inhibit fouling rate;
- 9.
- The vacuum residues with high saturate content (low density and low Conradson carbon content) have higher propensity to form sediments in hydrocracked residual oil products than the high asphaltene content vacuum residues;
- 10.
- The data in this study confirmed that the density and nitrogen content in vacuum gas oil can be used to quantitatively predict FCC conversion;
- 11.
- A regression equation was established to predict WABT norm of hydrodesulphurization of vacuum gas oil via sulphur and nitrogen contents;
- 12.
- Using regression analysis, an equation was derived showing that the yield of reformate depends on naphthene content, feed flow rate, and reaction temperature;
- 13.
- A preliminary detection, identification, and quantification of aggressive acidic species in a petroleum crude oil can help refiners to avoid excessive equipment corrosion and catalyst poisoning via sodium and nitrogen resulting from increased treatment rates using neutralizers like caustic and nitrogen-containing organic bases [85]. Procedures need to be developed and applied in the petroleum refinery to select the most appropriate strategy to mitigate the adverse effect of refinement of acidic crudes;
- 14.
- Besides oil compatibility and petroleum acidity, another important aspect of providing reliable and safe operation of the refinery is to keep the crude blend distillation characteristics close to those of the design crude. Otherwise, disturbances of operation regimes of refinery units can occur due to operating outside of safe process parameters set by the distillation characteristics of the design crude;
- 15.
- The performed investigation highlights the importance of proper utilization of petroleum as a valuable resource, and that an oil refinery should select the optimal crude blend that is as close as possible to the design crude oil characteristics of the refinery. This implies that, with appropriate blend preparation, diverse petroleum resources can be employed which can improve economics, energy saving, and environmental protection activity of the petroleum refining.
Supplementary Materials
The following supporting information can be downloaded at: https://www.mdpi.com/article/10.3390/resources13060086/s1, Figure S1: Agreement between measured and estimated, using Equations (S1)–(S7), TBP yields of petroleum wide fractions; Figure S2: A relation of cetane improver treating rate to middle distillate cetane index; Figure S3: A photograph of ASTM D 86 distillation of pure BTV crude oil sample before drying; Figure S4: Agreement between measured and calculated sulphur content in VGO—feed for the FCC feed hydrotreater; Figure S5: Variation of Na content in vacuum residue, NaOH treating rate in CDU-1 (a), and hydrocracking catalyst Na content (b); Table S1: Additional data for TBP distillation fraction yields (according to ASTM D 2892 and ASTM D 5236) and Evaporate up to 200 and 300 °C determined with ASTM D 86 standard; Table S2: Physicochemical properties and ASTM D 86 test results of samples taken from seven tanks which contain different amounts of BTV crude oil in mixtures with Urals and Light Siberian crude oils; Table S3: μ-values obtained from ICrA of parameters reported in Table S2; Table S4: υ-values obtained from ICrA of parameters reported in Table S2; Table S5: ASTM D 86 distillation data of crude oils Urals, Light Siberian, and BTV; Table S6: ASTM D 86 distillation data of the crude oils Iranian Heavy (IHCO), Sirtica, Russian Export Crude blend (REBCO), and Arabian medium (AMCO); Table S7: ASTM D 86 distillation data of blends of the crude oils Iranian Heavy (IHCO), Sirtica, Russian Export Crude blend (REBCO), and Arabian medium (AMCO); Table S8: True boiling point distillation data of the 11 studied crude oils and atmospheric residue (AR); Table S9: Density of fractions obtained from the true boiling point distillation of the 11 studied crude oils; Table S10: Sulphur of fractions obtained from the true boiling point distillation of the 11 studied crude oils and atmospheric residue; Table S11: Cetane index (ASTM D 976) of middle distillate fraction (180–360 °C) obtained from the 11 studied crude oils and AR using true boiling point distillation; Table S12: Data from the performance of commercial LNB refinery units: CDU, H-Oil, fluid catalytic cracking (FCC), and diesel blending; Table S13: μ-values obtained from ICrA evaluation of data for NaOH treating rate and contents of crude oils processed in LNB CDUs oil blend; Table S14: υ-values obtained from ICrA evaluation of data for NaOH treating rate and contents of crude oils processed in LNB CDUs oil blend; Table S15: μ-values obtained from ICrA evaluation of data for the performance of commercial LNB refinery units: H-Oil, fluid catalytic cracking (FCC), and diesel blending; Table S16: υ-values obtained from ICrA evaluation of data for the performance of commercial LNB refinery units: H-Oil, FCC, and diesel blending; Table S17: μ-values obtained from ICrA evaluation of data for characteristics of mixed vacuum residue, H-Oil fouling, and conversion. Table S18: υ-values obtained from ICrA evaluation of data for characteristics of mixed vacuum residue, H-Oil fouling, and conversion; Table S19: Data of mixed straight-run vacuum gas oil, H-Oil vacuum gas oil, blended vacuum gas oil (feed for FCC unit), and FCC conversion; Table S20: μ-values obtained from ICrA evaluation of data for characteristics of mixed vacuum gas oil and fluid catalytic cracking conversion, and regenerator temperatures; Table S21: υ-values obtained from ICrA evaluation of data for characteristics of mixed vacuum gas oil, fluid catalytic cracking conversion, and regenerator temperatures; Video S1: BTV ASTM D-86 Distillation (Foaming).
Author Contributions
Conceptualization, D.S.; methodology, G.G.; software, S.R., V.B. and S.N.; validation, K.A. and I.S.; formal analysis, G.A. and R.D.; investigation, I.K., I.P., R.N. and A.V.; data curation, S.S.; writing—original draft preparation, D.S. and I.S.; writing—review and editing, D.S. and I.S.; visualization, V.T.; funding acquisition, V.T.; project administration, D.S. All authors have read and agreed to the published version of the manuscript.
Funding
This research was funded by the European Union’s NextGenerationEU through the National Recovery and Resilience Plan of the Republic of Bulgaria project № BG-RRP-2.004-0002, “Bi-OrgaMCT”.
Data Availability Statement
Data are contained within the article.
Acknowledgments
The authors would like to thank Saybold Bulgaria Testing Centre for the performed ASTM D 86 distillations, viscosity, and water content of crude blends, and TAN of the individual crudes. The authors would like also to thank the chemical engineers from the Research laboratory and the Process department of LUKOIL Neftohim Burgas.
Conflicts of Interest
The authors Dicho Stratiev, Ivelina Shiskova, Georgi Georgiev, Rosen Dinkov, Iliyan Kolev, Ivan Petrov, Georgi Argirov were employed by the company LUKOIL Neftohim Burgas. The remaining authors declare that the research was conducted in the absence of any commercial or financial relationships that could be construed as a potential conflict of interest.
Correction Statement
This article has been republished with a minor correction to resolve typographical errors. This change does not affect the scientific content of the article.
Nomenclature
| A | Aromatics content |
| AAD | Average absolute deviation |
| AR | Atmospheric residue |
| ATB | Atmospheric tower bottom |
| CDU | Crude distillation unit |
| C5-asp | Content of asphaltenes insoluble in n-pentane, wt.% |
| C7-asp | Content of asphaltenes insoluble in n-heptane, wt.% |
| CO | Crude oil |
| conv. | Conversion |
| CCR | Conradson carbon residue |
| C ref | Desired product sulphur concentration |
| C f,ref | Reference feed sulphur concentration, wt.% |
| D15 | Density at 15 °C, g/cm3 |
| Ea | Activation energy |
| Evaporate 200 °C | Yield of fraction boiling up to 200 °C of ASTM D 86 distillation, vol.% |
| Evaporate 300 °C | Yield of fraction boiling up to 300 °C of ASTM D 86 distillation, vol.% |
| FCC | Fluid catalytic cracking |
| FCCPT | FCC feed hydrotreater |
| FCCPT WABT norm | Normalized weight average bed temperature in FCC feed hydrotreater reactors, °C |
| FR | H-Oil hydrocracker feed rate, t/h |
| HDS | Hydrodesulfurization |
| IBP | Initial boiling point |
| CII | Colloidal Instability Index |
| CII (C5) | Colloidal Instability Index calculated on the base of C5-asp |
| CII (C7) | Colloidal Instability Index calculated on the base of C7-asp |
| ICrA | Intercriteria analysis |
| K | Reaction rate |
| Kco | Characterization factor of crude oil |
| Khp | Characterization factor of n-heptane |
| K ref | Reference reaction rate |
| Kt | Characterization factor of toluene |
| Kw | Watson characterization factor |
| LHSV ref | Reference liquid hourly space velocity |
| LNB | LUKOIL Neftohim Burgas Refinery |
| N | Nitrogen content |
| n | Reaction order |
| Naph | Naphthenes content |
| PBFO | Partially blended fuel oil |
| PIANO | Paraffins, iso-parafiins, aromatics, naphthenes, and olefins |
| R | Gas constant |
| ReformerFR | Feed rate in the naphtha reformer |
| S | Sulphur content |
| SARA | Saturates, aromatics, resins, asphaltenes |
| Sp | Solvent power |
| Sp blend | Solvent power of petroleum blend |
| Sp critical | Critical solvent power |
| Spi | Solvent power of i component |
| TAN | Total acid number |
| T10 | Boiling point of evaporate at 10%, °C |
| T30 | Boiling point of evaporate at 30%, °C |
| T50 | Boiling point of evaporate at 50%, °C |
| T70 | Boiling point of evaporate at 70%, °C |
| T90 | Boiling point of evaporate at 90%, °C |
| TBP | True boiling point |
| TBP yield (IBP-110 °C) | Yield of TBP fraction IBP-110 °C, wt.%; |
| TBP yield (110–180 °C) | Yield of TBP fraction 110–180 °C, wt.% |
| TBP yield (180–240 °C) | Yield of TBP fraction 180–240 °C, wt.%; |
| TBP yield (IBP-360 °C) | Yield of TBP fraction IBP-360 °C, wt.%; |
| TBP yield (360–540 °C) | Yield of TBP fraction 360–540 °C, wt.%; |
| TBP yield (>540 °C) | Yield of TBP fraction >540 °C, wt.%; |
| TBP yieldexp | Yield of TBP fraction measured at the TBP distillation experiment |
| TBP yieldcalc | Yield of TBP fraction calculated by any of Equations (5)–(10), wt.%. |
| TRG dense | FCC Regenerator dense-phase temperature |
| TRG dil | FCC Regenerator dilute-phase temperature |
| TSE | Total sediments existent, wt.% |
| TSP | Total sediments potential, wt.% |
| VGO | Vacuum gas oil |
| VGOD15 | Density at 15 °C of vacuum gas oil, g/cm3; |
| VGON | Content of nitrogen in vacuum gas oil, wt.% |
| VGOS | Content of sulphur in FCC feed hydrotreater vacuum gas oil feed, wt.%; |
| VIS | Viscosity |
| VR | Vacuum residue |
| WABT | Weight average bed temperature |
| WABT act | Actual weighted average bed temperature |
| WABT norm | Normalized weighted average bed temperature |
| WAIT | Weight average inlet temperature of the four reforming reactors, °C |
| μ | Positive consonance |
| υ | Negative consonance |
| Χi | Weight fraction of i component |
References
- OPEC Secretariat. 2023 World Oil Outlook 2045; OPEC Secretariat, October 2023 Helferstorferstrasse 17 A-1010; Organization of the Petroleum Exporting Countries: Vienna, Austria, 2023; Available online: www.opec.org (accessed on 18 February 2024).
- Liu, Y.; Yan, G.; Settanni, A. Forecasting the transportation energy demand with the help of optimization artificial neural network using an improved red fox optimizer (IRFO). Heliyon 2023, 9, e21599. [Google Scholar] [CrossRef] [PubMed]
- Kaza, N. Urban form and transportation energy consumption. Energy Pol. 2020, 136, 111049. [Google Scholar] [CrossRef]
- Wang, Z.; Li, S.; Jin, Z.; Li, Z.; Liu, Q.; Zhang, K. Oil and gas pathway to net-zero: Review and outlook. Energy Strategy Rev. 2023, 45, 101048. [Google Scholar] [CrossRef]
- Gautam, R.; AlAbbad, M.; Guevara, E.R.; Sarathy, S.M. On the products from the pyrolysis of heavy fuel and vacuum residue oil. JAAP 2023, 173, 106060. [Google Scholar] [CrossRef]
- Bozuwa, J.; Burke, M.; Cox, S.; Skandierd, C.S. Chapter 8. Democratic governance of fossil fuel decline. In Energy Democracies for Sustainable Futures, 1st ed.; Academic Press: Cambridge, MA, USA, 2023; pp. 73–82. [Google Scholar]
- Muhammed, N.S.; Gbadamosi, A.O.; Epelle, E.I.; Abdulrasheed, A.A.; Haq, B.; Patil, S.; Al-Shehri, D.; Kamal, M.S. Hydrogen production, transportation, utilization, and storage: Recent advances towards sustainable energy. J. Energy Storage 2023, 73, 109207. [Google Scholar] [CrossRef]
- Kumar, R.; Voolapallia, R.K.; Upadhyayula, S. Prediction of crude oil blends compatibility and blend optimization for increasing heavy oil processing. Fuel Process. Technol. 2018, 177, 309–327. [Google Scholar] [CrossRef]
- Schobert, H. Chapter 11: Composition, classification, and properties of petroleum. In Chemistry of Fossil Fuels and Biofuels; Cambridge University Press: Cambridge, UK, 2013. [Google Scholar]
- Viswanathan, B. Chapter 2: Petroleum. In Energy Sources: Fundamentals of Chemical Conversion Processes and Applications; Elsevier: Amserdam, The Netherlands, 2017. [Google Scholar]
- Ramirez-Corredores, M.M. The Science and Technology of Unconventional Oils Finding Refining Opportunities; Academic Press: Cambridge, MA, USA, 2017. [Google Scholar]
- Rogel, E.; Lezcano, M.; Yee, N.; Witt, M. Effect of Aging on Deposit Characteristics Obtained by Crude Oil Blending. Energy Fuels 2023, 37, 1848–1856. [Google Scholar] [CrossRef]
- Rogel, E.; Hench, K.; Cibotti, F.; Forbes, E.; Jackowski, L. Investigation on Crude Oil Fouling Behavior. Energy Fuels 2022, 36, 818–825. [Google Scholar] [CrossRef]
- Kondyli, A.; Schrader, W. Study of Crude Oil Fouling from Sulfur-Containing Compounds Using High-Resolution Mass Spectrometry. Energy Fuels 2021, 35, 13022–13029. [Google Scholar] [CrossRef]
- Moubaraki, A.H.; Obot, I.B. Corrosion challenges in petroleum refinery operations: Sources, mechanisms, mitigation, and future outlook. J. Saudi Chem. Soc. 2021, 25, 101370. [Google Scholar] [CrossRef]
- Meriem-Benziane, M.; Bou-Saïd, B.; Bassam Gamal Muthanna, B.G.N.; Ismail Boudissa, I. Numerical study of elbow corrosion in the presence of sodium chloride, calcium chloride, naphthenic acids, and sulfur in crude oil. J. Petrol. Sci. Eng. 2021, 198, 108124. [Google Scholar] [CrossRef]
- Patrick, B.N. Understanding Naphthenic Acid Corrosion in Refinery Settings. Ph.D. Thesis, University of California, Berkeley, CA, USA, 2015. [Google Scholar]
- Laredo, G.C.; Lopez, C.R.; Alvarez, R.E.E.; Cano, J.L. Naphthenic acids, total acid number and sulfur content profile characterization in Isthmus and Maya crude oils. Fuel 2004, 83, 1689–1695. [Google Scholar] [CrossRef]
- Huang, B.S.; Yin, W.F.; Sang, D.H.; Jiang, Z.Y. Synergy effect of naphthenic acid corrosion and sulfur corrosion in crude oil distillation unit. Appl. Surf. Sci. 2012, 259, 664–670. [Google Scholar] [CrossRef]
- Flego, C.; Galasso, L.; Montanari, L.; Maria Gennaro, M.E. Evolution of Naphthenic Acids during the Corrosion Process. Energy Fuels 2014, 28, 1701–1708. [Google Scholar] [CrossRef]
- Guo, L.; Kuang, J.; Liu, S.; Shen, S.; Liang, L. Failure mechanism of a coil type crude oil heater and optimization method. Case Stud. Therm. Eng. 2022, 39, 102398. [Google Scholar] [CrossRef]
- Alabdullah, M.; Shoinkhorova, T.; Dikhtiarenko, A.; Ould-Chikh, S.; Rodriguez-Gomez, A.; Chung, S.; Alahmadi, A.; Hita, I.; Pairis, S.; Hazemann, J.; et al. Understanding catalyst deactivation during the direct cracking of crude oil. Catal. Sci. Technol. 2022, 12, 5657–5670. [Google Scholar] [CrossRef]
- Hart, A. Modern Techniques to Minimize Catalyst Deactivation Due to Coke Deposition in Catalytic Upgrading of Heavy Oil In Situ Processes. Pet. Chem. 2022, 62, 714–731. [Google Scholar] [CrossRef]
- Nazarova, G.Y.; Ivashkina, E.N.; Ivanchina, E.D.; Mezhova, M.Y. A Model of Catalytic Cracking: Catalyst Deactivation Induced by Feedstock and Process Variables. Catalysts 2022, 12, 98. [Google Scholar] [CrossRef]
- Bambinek, K.; Przyjazny, A.; Boczkaj, G. Compatibility of Crude Oil Blends Processing Issues Related to Asphaltene Precipitation, Methods of Instability Prediction-A Review. Ind. Eng. Chem. Res. 2023, 62, 2–15. [Google Scholar] [CrossRef]
- ASTM D5002-22; Standard Test Method for Density, Relative Density, and API Gravity of Crude Oils by Digital Density Analyzer. ASTM: West Conshohocken, PA, USA, 2022.
- ASTM D4294-21; Standard Test Method for Sulfur in Petroleum and Petroleum Products by Energy Dispersive X-ray Fluorescence Spectrometry. ASTM: West Conshohocken, PA, USA, 2021.
- ASTM D3230-19; Standard Test Method for Salts in Crude Oil (Electrometric Method). ASTM: West Conshohocken, PA, USA, 2019.
- ASTM D664-18e2; Standard Test Method for Acid Number of Petroleum Products by Potentiometric Titration. ASTM: West Conshohocken, PA, USA, 2018.
- ASTM D4928-12; Standard Test Method for Water in Crude Oils by Coulometric Karl Fischer Titration. ASTM: West Conshohocken, PA, USA, 2018.
- ASTM D5853-17a; Standard Test Method for Pour Point of Crude Oils. ASTM: West Conshohocken, PA, USA, 2017.
- ASTM D2892-20; Standard Test Method for Distillation of Crude Petroleum (15-Theoretical Plate Column). ASTM: West Conshohocken, PA, USA, 2020.
- ASTM D5236-18a; Standard Test Method for Distillation of Heavy Hydrocarbon Mixtures (Vacuum Potstill Method). ASTM: West Conshohocken, PA, USA, 2018.
- ASTM D86-23; Standard Test Method for Distillation of Petroleum Products and Liquid Fuels at Atmospheric Pressure. ASTM: West Conshohocken, PA, USA, 2023.
- ASTM D976-21e1; Standard Test Method for Calculated Cetane Index of Distillate Fuels. ASTM: West Conshohocken, PA, USA, 2021.
- Nemana, S.; Kimbrell, M.; Zaluzec, E. Predictive Crude Oil Compatibility Model. U.S. Patent No 7.618,822 B2, 17 November 2009. [Google Scholar]
- ASTM D7169-20e1; Standard Test Method for Boiling Point Distribution of Samples with Residues Such as Crude Oils and Atmospheric and Vacuum Residues by High Temperature Gas Chromatography. ASTM: West Conshohocken, PA, USA, 2020.
- Ancheyta, J. Relative compatibility index for evaluation of the compatibility of crude oil blends. Geoenergy Sci. Eng. 2023, 230, 212246. [Google Scholar] [CrossRef]
- Mitkova, M.; Stratiev, D.; Shishkova, I.; Dobrev, D. Thermal and Thermos-Catalytic Processes for Heavy Oil Conversion; Professor Marin Drinov Publishing House of Bulgarian Academy of Sciences: Sofia, Bulgaria, 2017; ISBN 978-954-322-892-8. [Google Scholar]
- ASTM D6591-19; Standard Test Method for Determination of Aromatic Hydrocarbon Types in Middle Distillates—High Performance Liquid Chromatography Method with Refractive Index Detection. ASTM: West Conshohocken, PA, USA, 2019.
- IP 501/05; Standard Test Method; Determination of Aluminium, Silicon, Vanadium, Nickel, Iron, Sodium, Calcium, Zinc and Phosphorus in Residual Fuel Oil by Ashing, Fusion and Inductively Coupled Plasma Emission Spectrometry. Energy Institute: London, UK, 2019.
- Stratiev, D.; Shishkova, I.; Dinkov, R.; Kolev, I.; Argirov, G.; Ivanov, V.; Ribagin, S.; Atanassova, V.; Atanassov, K.; Stratiev, D.; et al. Intercriteria analysis to diagnose the reasons for increased fouling in a commercial ebullated bed vacuum residue hydrocracker. ACS Omega 2022, 7, 30462–30476. [Google Scholar] [CrossRef] [PubMed]
- Riazi, M.R. Characterization and Properties of Petroleum Fractions; ASTM International: West Conshohocken, PA, USA, 2005. [Google Scholar]
- Stratiev, D.; Shishkova, I.; Dinkov, R.; Sotirov, S.; Sotirova, E.; Atanassov, K.; Ribagin, S.; Nikolova, R.; Veli, A.; Palichev, G.; et al. Do the True Boiling-Point Distillation Yields of Crude Oil Blends Obey the Additive Blending Rule? Processes 2023, 11, 1879. [Google Scholar] [CrossRef]
- Li, S.; Zhang, Q.; Yao, Y.; Sun, X.; Fan, Q.; Chen, J. Distillation yields and properties from blending crude oils: Maxila and Cabinda crude oils. Energy Fuels 2007, 21, 1145–1150. [Google Scholar] [CrossRef]
- Li, S.; Liu, J.; Shen, B.; Xu, X.; Fan, Q.; Chen, J.; Zhao, G. Distillation yields from blending Cabinda crude oil and Oman crude oil. Pet. Sci. Technol. 2006, 24, 737–747. [Google Scholar] [CrossRef]
- ASTM D4740-20; Standard Test Method for Cleanliness and Compatibility of Residual Fuels by Spot Test. ASTM: West Conshohocken, PA, USA, 2020.
- Kataria, K.L.; Kulkarni, R.P.; Aniruddha, B.; Pandit, A.B.; Joshi, J.B.; Kumar, M. Kinetic Studies of Low Severity Visbreaking. Ind. Eng. Chem. Res. 2004, 43, 1373–1387. [Google Scholar] [CrossRef]
- Wiehe, I.A.; Kennedy, R.J. Process for Blending Potentially Incompatible Petroleum Oils. U.S. Patent No US5871634, 16 February 1999. [Google Scholar]
- Wiehe, I.A. Asphaltene solubility and fluid compatibility. Energy Fuels 2012, 26, 4004–4016. [Google Scholar] [CrossRef]
- Wiehe, I.A. Process Chemistry of Petroleum Macromolecules; Taylor & Francis Group: Abingdon UK; CRC Press: Boca Raton, FL, USA, 2008. [Google Scholar]
- Oyekan, S. Catalytic Naphtha Reforming Process; CRC Press: Boca Raton, FL, USA, 2018; ISBN 9781315270319. [Google Scholar]
- Stratiev, D.; Dinkov, R.; Shishkova, I.; Petrov, I. Controlling sodium content in vacuum residue during its hydroprocessing. Oxid. Commun. 2020, 43, 819–828. [Google Scholar]
- Georgiev, B.E.; Stratiev, D.S.; Argirov, G.S.; Nedelchev, A.; Dinkov, R.; Shishkova, I.K.; Ivanov, M.; Atanassov, K.; Ribagin, S.; Nikolov Palichev, G.; et al. Commercial Ebullated Bed Vacuum Residue Hydrocracking Performance Improvement during Processing Difficult Feeds. Appl. Sci. 2023, 13, 3755. [Google Scholar] [CrossRef]
- Novaes, L.; Pacheco, M.; Salim, V.; Resende, N. Accelerated deactivation studies of hydrotreating catalysts in pilot unit. Appl. Catal. A 2017, 548, 114–121. [Google Scholar] [CrossRef]
- Stratiev, D. Hydrotreatment of Fluid catalytic cracking Feed a way to increase heavy vacuum gas oil conversion and produce near zero sulphur gasoline. Oil Gas Eur. Mag. 2009, 35, 187–190. [Google Scholar]
- Stratiev, D.; Shishkova, I.; Ivanov, M.; Dinkov, R.; Argirov, G.; Vasilev, S.; Yordanov, D. Validation of Diesel Fraction Content in Heavy Oils Measured by High Temperature Simulated Distillation and Physical Vacuum Distillation by Performance of Commercial Distillation Test and Process Simulation. Appl. Sci. 2022, 12, 11824. [Google Scholar] [CrossRef]
- de Camargo, M.A.C.; Manea, G.K.B.; de Oliveira, E.C. A Comparative Study of Fuel Density Precision Data Using Digital Densimeter Meters at Two Different Temperatures. Energies 2024, 17, 23. [Google Scholar] [CrossRef]
- Shang, Y.; Xing, X.; Yang, H.; Yang, M. Optimization of Mixing Crude Oil Density for Batch Transportation Based on Sales Benefit. In Computational and Experimental Simulations in Engineering; Li, S., Ed.; ICCES; Mechanisms and Machine Science; Springer: Cham, Switzerland, 2023; Volume 146. [Google Scholar]
- Carreón-Calderón, B.; Uribe-Vargas, V.; Aguayo, J. Characterization of Petroleum Fractions. In Thermophysical Properties of Heavy Petroleum; Springer: Berlin/Heidelberg, Germany, 2021. [Google Scholar]
- Wang, X.; Jia, T.; Pan, L.; Liu, Q.; Fang, Y.; Zou, J.; Zhang, X. Review on the Relationship Between Liquid Aerospace Fuel Composition and Their Physicochemical Properties. Trans. Tianjin Univ. 2021, 27, 87–109. [Google Scholar] [CrossRef]
- Vozka, P.; Kilaz, G. A review of aviation turbine fuel chemical composition-property relations. Fuel 2020, 268, 117391. [Google Scholar] [CrossRef]
- AlMulla, H.; Albahri, T. Predicting the properties of petroleum blends. Pet. Sci. Technol. 2017, 35, 775–782. [Google Scholar] [CrossRef]
- He, P.; Ghoniem, A.F. A Group contribution pseudocomponent method for phase equilibrium modeling of mixtures of petroleum fluids and a solvent. Ind. Eng. Chem. Res. 2015, 54, 8809–8820. [Google Scholar] [CrossRef]
- Mlquel, J.; Hernandez, J.; Castells, F. A New method for petroleum fractions and crude oil characterization. SPE Reserv. Eng. 1992, 7, 265–270. [Google Scholar]
- Wauquier, J.-P. Crude Oil Petroleum Products. Process Flowsheets; Editions Technip: Paris, France, 1995. [Google Scholar]
- Koczo, K.; Leatherman, M.; Wylde, J. Chapter 4: Foam control. In Surface Process, Transportation, and Storage; Gulf Professional Publishing: Houston, TX, USA, 2023. [Google Scholar]
- Wang, J.; Yuan, Z.; Zhang, H.; Wang, H. The influence of viscosity on stability of foamy oil in the process of heavy oil solution gas drive. J. Pet. Sci. Eng. 2009, 66, 69–74. [Google Scholar] [CrossRef]
- Pooladi-Darvish, M.; Firoozabadi, A. Solution-gas drive in heavy oil reservoirs. J. Can Pet. Technol. 1999, 38, 54–61. [Google Scholar] [CrossRef]
- Sun, X.; Zhang, Y.; Gai, Z.; Zhao, H.; Chen, G.; Song, Z. Comprehensive experimental study of the interfacial stability of foamy oil and identification of the characteristic responsible for foamy oil formation. Fuel 2019, 238, 514–525. [Google Scholar] [CrossRef]
- Speight, J.G. High Acid Crudes; Gulf Professional Publishing: Waltham, MA, USA, 2014. [Google Scholar]
- Ramirez-Corredores, M. Chapter 4—Acidity in Crude Oils: Naphthenic Acids and Naphthenates. In Proceedings of the Science and Technology of Unconventional Oils; Elsevier Academic Press: Cambridge, MA, USA, 2017; pp. 295–385. [Google Scholar]
- Qu, D.; Zheng, Y.; Jing, H.; Yao, Z.; Ke, W. High temperature naphthenic acid corrosion and sulphidic corrosion of Q235 and 5cr1/2mo steels in synthetic refining media. Corros. Sci. 2006, 48, 1960–1985. [Google Scholar] [CrossRef]
- Jayaraman, A.; Singh, H.; Lefebvre, Y. Naphthenic Acid Corrosion in Petroleum Refineries. A Review. Rev. L’institut Français Pétrole 1986, 41, 265. [Google Scholar] [CrossRef]
- Barrow, M.; Headley, J.; Peru, K.; Derrick, P. Data Visualization for the Characterization of Naphthenic Acids within Petroleum Samples. Energy Fuels 2009, 23, 2592–2599. [Google Scholar] [CrossRef]
- Barros, E.; Filgueiras, P.; Lacerda, V., Jr.; Rodgers, R.; Romão, W. Characterization of naphthenic acids in crude oil samples—A literature review. Fuel 2022, 319, 123775. [Google Scholar] [CrossRef]
- Smith, D.; Rodgers, R.; Rahimi, P.; Teclemariam, A.; Marshall, A. Effect of thermal treatment on acidic organic species from athabasca bitumen heavy vacuum gas oil, analyzed by negative-ion electrospray fourier transform ion cyclotron resonance (ft-icr) mass spectrometry. Energy Fuel 2008, 23, 314–319. [Google Scholar] [CrossRef]
- Yang, B.; Xu, C.; Zhao, S.; Hsu, C.S.; Chung, K.H.; Shi, Q. Thermal transformation of acid compounds in high TAN crude oil. Sci. China-Chem. 2013, 56, 848–855. [Google Scholar] [CrossRef]
- Shafizadeh, A.; McAteer, G.; Sigmon, J. High-Acid Crudes. In Proceedings of the Crude Oil Quality Group Meeting, New Orleans, LA, USA, 30 January 2003. [Google Scholar]
- Yang, C.; Zhang, G.; Serhan, M.; Koivu, G.; Yang, Z.; Hollebone, B.; Lambert, P.; Brown, C.E. Characterization of naphthenic acids in crude oils and refined petroleum products. Fuel 2019, 255, 115849. [Google Scholar] [CrossRef]
- Siegel, J.; Olsen, C.; Feed Contaminants in Hydroprocessing Units. ART Catalagram® 2008, 104 Special Edition Fall, 2–6. Available online: https://www.scribd.com/document/290889530/104SE-Feed-Contaminants-in-Hydroprocessing-Units (accessed on 18 February 2024).
- IJlstra, W. LukOil Burgas H-OilRC Unit–Addressing Na & As Contamination Issues. In Proceedings of the Criterion—LUKOIL Workshop, Burgas, Bulgaria, 13 June 2017. [Google Scholar]
- Rogel, E.; Hench, K.; Miao, T.; Lee, E.; Dickakian, G. Evaluation of the Compatibility of Crude Oil Blends and Its Impact on Fouling. Energy Fuels 2018, 32, 9233–9242. [Google Scholar] [CrossRef]
- Kane, R.D.; Chambers, B. High temperature crude oil corrosivity: Where sulfur and naphthenic acid chemistry and metallurgy meet. In Proceedings of the Corrosion Solutions Conference, Houston, TX, USA, 13–17 March 2011. [Google Scholar]
- Petrov, I.; Stratiev, D.; Shishkova, I.; Yordanov, D. A hybrid reformer performance analysis reveals the reason for reformate octane deterioration. OGEM 2021, 47, 14–20. [Google Scholar]
Disclaimer/Publisher’s Note: The statements, opinions and data contained in all publications are solely those of the individual author(s) and contributor(s) and not of MDPI and/or the editor(s). MDPI and/or the editor(s) disclaim responsibility for any injury to people or property resulting from any ideas, methods, instructions or products referred to in the content. |
© 2024 by the authors. Licensee MDPI, Basel, Switzerland. This article is an open access article distributed under the terms and conditions of the Creative Commons Attribution (CC BY) license (https://creativecommons.org/licenses/by/4.0/).

