Abstract
This study provides a comprehensive analysis of the environmental impacts associated with the synthesis of polyurethane (PUR) aerogels. The synthesis process incorporates various solvents and solids contents into the formulation, with the primary objective of enhancing the physical properties of the aerogels for broad industrial applications. Nine experimental scenarios were explored, grouped into two sets based on the variables studied. A detailed Life Cycle Assessment (LCA) was conducted to evaluate the environmental impacts of all formulated PUR aerogels. The findings indicate that a solvent solution of 100% ethyl acetate (EtOAc) results in lower environmental impacts compared to other tested formulations. Notably, a solvent solution comprising 75% acetonitrile (ACN) and 25% EtOAc exhibited the highest environmental Key Performance Indicator (εKPI) among the tested material formulations, closely followed by the PUR aerogel obtained using acetone as a solvent. Furthermore, this study underscores the necessity of performing an integrated LCA that considers both environmental and functional aspects. While reducing the solids content is environmentally advantageous, it may present challenges in terms of material functionality. This is illustrated by the PUR aerogel synthesized with the lowest solids content of 3.2 wt.%, which demonstrated high deformability, thereby complicating the determination of a reliable Young’s modulus for analysis.
1. Introduction
In terms of meeting national and international sustainability goals, the construction sector is crucial. The International Energy Agency (IEA) reported in 2019 that this sector accounts for 36% of the global final energy consumption and 39% of CO2 emissions, making it one of the sectors with the highest energy consumption and emissions worldwide [1]. In this context, thermal insulation is necessary to reduce heating and cooling energy consumption and, consequently, to minimize energy needs in buildings since it plays a crucial role in reducing environmental impacts throughout their lifetime [2,3]. In addition, in order to meet demanding energy requirements across a wide range of transport applications, like railway passenger cars, public transport cars, trucks, or buses, it is important to regulate indoor environmental conditions by mitigating heat transfer, which limits the need for cooling and heating [4].
In this sense, aerogels have emerged as a promising alternative to conventional insulating materials, presenting improved properties such as lower thermal conductivities compared to classic materials like foams. Thus, they have become an excellent replacement for traditional insulation materials. The unique class of porous materials known as aerogels possesses a variety of remarkable physicochemical characteristics, including low density, high porosity, high surface area, and tunable surface chemistry [5,6]. There are multiple types of aerogels with various properties and applications. Inorganic aerogels, primarily composed of metal oxides, feature a three-dimensional porous structure and are known for their low density and high thermal insulation capacity. Organic aerogels, due to their porous structure and low thermal conductivity, can trap air and reduce heat transfer. Additionally, organic aerogels are flexible, lightweight, and fire-resistant, making them even more versatile as low-density thermal insulators. Hybrid aerogels combine inorganic and organic components to leverage the benefits of both types.
Among the organic aerogels, polyurethane (PUR)-based ones have been extensively investigated over the past decade to produce materials with very low conductivity and density [7,8,9]. These aerogels are primarily based on PUR polymer chains, and their main properties include high thermal insulation (induced by their low thermal conductivity, making them effective in reducing heat transfer), low density, high porosity (they have a highly porous structure, providing a large surface area for enhanced insulation performance), flexibility (they can be flexible and can conform to different shapes and surfaces, allowing for easy installation), moisture resistance (PUR-based aerogels are typically hydrophobic, meaning they repel moisture and maintain their insulation properties even in humid environments), and fire resistance.
Overall, PUR-based aerogels offer a combination of thermal insulation efficiency, lightweight construction, and versatility in various applications. Several techniques have been developed in recent years to produce aerogels, but the freeze-drying method has gained prominence because it is regarded as a cost-effective, environmentally friendly, and efficient process [10,11].
The utilization of the acetone-based method in producing PUR aerogels gives rise to inherent operational challenges during the synthesis of these materials, as evidenced in a recent study [12]. Consequently, there is a compelling need to explore alternative solvents capable of effectively replacing acetone while primarily maintaining its essential physicochemical characteristics. To address this issue, a practical approach involves substituting acetone with other solvents—either in their pure form or as part of different volumetric mixtures—that possess similar Hansen solubility parameters to those of acetone in order to prevent unintended interactions occurring during the chemical reaction. Furthermore, it is of paramount importance that the boiling points of these alternative solvents are slightly higher than that of acetone, which is 56 °C, to ensure that they do not evaporate prematurely upon their introduction into the reaction mixture, as previously reported in the literature [13,14,15].
Moreover, adjusting the solids content during the synthesis of PUR aerogels is essential for creating materials with specific properties for a particular application and reducing their environmental impact. The density of aerogels is believed to depend on the solids content, with samples that have a higher solids content tending to present a higher density compared to those with a lower solids content [12,16].
Consequently, it is vital to assess how these changes affect the environmental impact of these materials during production. The Life Cycle Assessment (LCA) is a common and effective tool for evaluating the environmental impact of products or services throughout their life cycle. It provides valuable insights for enhancing materials and the technology employed in their processing, thereby promoting harmony between the material and its environment [17,18,19]. LCA studies have been carried out to assess the environmental impacts of various insulation aerogels. Dowson et al. [20] specifically focused on conducting a concise LCA of a silica aerogel, providing insights into the environmental consequences associated with the manufacture of aerogels. Research conducted by Liu et al. [21] and Han et al. [22] focused on examining the thermal conductivity and carbon footprint of aerogels, emphasizing their viability as insulation materials with sustainable and environmentally friendly attributes. Furthermore, the research conducted by Huber et al. [23] investigated the environmental impact of a novel method for synthesizing silica aerogel granulate, which involved a one-pot synthesis process and notably reduced the solvent use and production time.
In addition, Carcassi et al. [24] have examined the environmental burden of bio-based aerogels, specifically delving into aspects such as thermal conductivity and carbon footprint. Their research highlights the potential of bio-based aerogels as insulation materials that align with principles of sustainability and environmental friendliness.
Furthermore, various studies have investigated the environmental impact of PUR-based thermal insulation. For instance, research conducted by Malchiodi et al. [25] and Park et al. [26] explored the integration of sustainable and eco-friendly materials into PUR insulation, highlighting the potential for reducing environmental footprints. Additionally, Guolo et al. [27] have underscored the significance of LCA in comprehending the overall environmental effects of PUR panels, particularly in terms of resource consumption and energy savings. However, there exists a research gap concerning the environmental impacts of PUR-based aerogels.
This study aims to provide a comprehensive analysis of the environmental impacts associated with the synthesis of PUR aerogels using different solvents and solids contents in the recipe. The ultimate objective is to improve the physical properties of PUR aerogels for large-scale industrial applications. Therefore, nine different experimental scenarios, categorized into two sets based on the variables studied in each scenario, have been considered. To assess the environmental impacts of all of the formulated PUR aerogels, a detailed LCA analysis was performed. The following sections will outline the methodology employed in this study, including the analysis steps, the underlying assumptions, and the software used for the LCA analysis.
2. Experimental
2.1. Chemicals
For the experiments, the following chemicals were utilized: polyethylene glycol [PEG, number-average molecular weight (Mn) = 2000 g·mol−1, Sigma-Aldrich, St. Louis, MO, USA]; 2,2-bis(hydroxymethyl)propionic acid [DMPA, 98%, Aldrich Chemicals, Milwaukee, WI, USA]; 1-methyl-2-pyrrolidinone anhydrous [NMP, 99.5%, Sigma-Aldrich]; dibutyltin dilaurate [DBTDL, 95%, Aldrich Chemicals]; 4,4′-methylenebis(cyclohexyl isocyanate) [HMDI, 90% mixture of isomers, Sigma-Aldrich]; acetone [HPLC grade, Labkem, Barcelona, Spain]; ethylenediamine [EDA, ≥99%, Sigma-Aldrich]; triethylamine [TEA, ≥99%, Sigma-Aldrich]; acetonitrile anhydrous [ACN, 99.8%, Sigma-Aldrich]; and ethyl acetate anhydrous [EtOAc, 99.8%, PanReac, Barcelona, Spain].
2.2. Methodology
The environmental burdens related to the synthesis of aerogels at the pilot scale were evaluated using the LCA methodology, conducted in accordance with the guidelines of the International Standards Organization (ISO) 14040-44 [28,29].
2.2.1. Goal and Scope
This study was carried out to determine the environmental impact of the synthesis and manufacture of PUR aerogels [12,30], following a cradle-to-gate concept throughout the study. The main goal was to compare different production formulations of these materials, considering different synthesis procedures, in which parameters such as the type of organic solvent used during the synthesis and the solids content of the aerogel (calculated from the total mass of polymer synthesized at the moment of dispersion in water) had been modified. All synthesis procedures using the different production formulations were carried out with a pilot line (PL) that contained a semi-industrial freeze-dryer and using stainless steel trays with dimensions of 43.5 × 34 cm (length × width). A single synthesis procedure allowed the production of an aerogel panel with a surface area of 0.9 m2 and a thickness of 1.5–2 cm. A panel of this size was considered as a Technical Unit (TU) for this study. As already mentioned, different variables influencing the aerogel synthesis process were modified and tested, thus generating nine different scenarios (Table 1), which were then further analyzed. The variables modified for each synthesis were as follows: (i) the ratio of organic solvents (e.g., acetone, ACN, and EtOAc); (ii) the percentage, in weight, of the solids content [12,30].

Table 1.
Overview of synthesis scenarios. All percentages are to be considered in wt.%.
Different characterization techniques were used to provide a complete evaluation of the physicochemical properties of the synthesized aerogels. The density of the obtained aerogels was determined through precise measurements, employing a 3D scanner (REXCANDS3 Silver, eQuality Tech Inc., Shelby Township, MI, USA). In addition, the thermal conductivity of the samples (dimensions required: 30 × 30 cm) was evaluated based on the heat transfer between two parallel plates (HFM 300, Linseis, Robbinsville Twp, NJ, USA) at five medium temperatures: (1) Tm: 0 °C (Ti: −5 °C, Tf: 5 °C); (2) Tm: 10 °C (Ti: 5 °C, Tf: 15 °C); (3) Tm: 20 °C (Ti: 15 °C, Tf: 25 °C); (4) Tm: 30 °C (Ti: 25 °C, Tf: 35 °C); and (5) Tm: 40 °C (Ti: 35 °C, Tf: 45 °C). Finally, the morphological structure was examined through high-resolution scanning electron microscopy (HRSEM, GeminiSEM 500, ZEISS, Jena, Germany) using an energy dispersive spectroscopy (EDS) sensor of 80 mm2 and another one of electron backscatter diffraction (EBDS).
According to the ISO 14040 standard [28], the Functional Unit (FU) serves as the standardized unit for quantifying the performance of a system in an LCA. In order to make this study more comprehensive and informative, the profile of each scenario (PUR aerogel sample) was assessed by integrating functionality properties with environmental impacts. The final comparison was therefore conducted between the environmental Key Performance Indicator (εKPI) values calculated for each category. In this way, we ensured that it would be possible to take into consideration the intrinsic properties of the materials and effectively evaluate the environmental sustainability of the different solutions studied. Equation (1) shows the formula used to calculate εKPI; the indicator is based on the direct connection of the thermal conductivity to the amount of material:
where IC is the absolute environmental impact determined for the TU, λ is the thermal conductivity of the material (unit: W/m·K), and V is the volume of the sample (cm3), while the subscripts i and j represent the evaluated impact category and the PUR sample, respectively.
The data on the characteristics of the aerogel panels, for which λ and V were used for calculating the FU, were obtained through specific analyses and are reported in the Section 3.
The analyzed system was modeled according to a cradle-to-gate approach. This means that the boundaries of the analysis started with an evaluation of the burdens related to the extraction of the raw materials needed to produce all of the inputs (i.e., chemicals, energy, etc.), up to the production of the final PUR panels.
2.2.2. Inventory Analysis
The second step of an LCA involves the collection of all of the data that constitute the process’s inputs and outputs (i.e., materials, energy, emissions, waste, etc.). These flows allow the description and modeling of the analyzed systems. Data from the Ecoinvent 3.7 database were used to model our system.
This study was validated using primary data, with the aerogels under investigation being based on a PUR aqueous dispersion. The synthesis of waterborne PUR aerogels involved a two-step process comprising stepwise polymerization and subsequent freeze-drying at lab scale, as previously described [12,30]. However, in this study, different organic solvents, including acetone, ACN, and EtOAc, or a combination of the final pair, were evaluated at the pilot line scale. Furthermore, the solids content was considered during the final synthesis stage, which consisted of adding the appropriate volume of water to achieve the complete dispersion of the polymer through mechanical agitation for hydrogel formation. Consequently, this resulted in aerogel samples with different solids contents, ranging between 3.2 and 10.8 wt.%. More information on the hydrogel synthesis process can be found in the Supplementary Materials. Table 2 shows the reactants employed in each aerogel synthesis step.

Table 2.
Reagents used in each step of the synthesis of waterborne polyurethane aerogels.
Once the hydrogel was completely dispersed in water, it was then transferred to steel trays (43.5 × 34 cm) and subjected to the freeze-drying process in order to obtain the final aerogel. Thus, a freeze-drying cycle consisting of various stages (freezing, primary drying, and secondary drying) was initiated, which eliminated water from the mixture by sublimation, resulting in the formation of the final aerogel. Specifically, the process conditions involved freezing the mixture for 5.5 h at −40 °C, followed by a primary drying phase lasting 60 h at 25 °C and 200 µbar. Finally, a secondary drying step was conducted for 10 h at 40 °C. During the freeze-drying process, the cooling or heating ramps used to reach the target temperature lasted 1 h.
Below is a list of the assumptions and limitations that we needed to consider in order to avoid problems arising during our evaluation:
- The system was modeled using data (e.g., chemicals, energy mix, etc.) related to the materials synthesized at the Institute of Chemical and Environmental Technology (ITQUIMA) associated with the University of Castilla-La Mancha.
- The environmental impacts associated with chemical use were estimated using “market” datasets. These datasets account for different technological pathways and geographical distributions for chemical production, based on national average data.
- The environmental burdens related to electricity consumption were estimated by modeling processes using the Ecoinvent dataset corresponding to the Spanish electricity mix.
- The environmental impacts of certain chemicals were estimated using proxies. In this context, substitutes such as ethylene glycol in place of polyethylene glycol, methacrylic acid instead of DMPA, and methylene diphenyl diisocyanate in place of HMDI were used. Environmental burdens associated with equipment and human labor were excluded from the evaluation.
- The use phase and end-of-life of the aerogel were excluded from the system boundaries.
2.2.3. Life Cycle Impact Assessment (LCIA)
The LCA approach represents the most comprehensive approach for assessing the environmental sustainability and footprint of newly developed bio-based materials. The aim of the LCIA phase is to convert the collected input–output flows into a handful of environmental impact categories, each of them quantifying a specific impact on a given environmental compartment. The environmental footprint is based on the following 11 impact categories, measured according to the CML 2001 method [31]: Acidification Potential (AP); Climate Change (Global Warming Potential—GWP); Depletion of Abiotic Resources—Elements (ADP); Depletion of Abiotic Resources—Fossil Fuels (ADP-f); Eutrophication (EP); Freshwater Aquatic Ecotoxicity (FAETP); Human Toxicity (HTTP); Marine Aquatic Ecotoxicity (MAETP); Ozone Layer Depletion (ODP); Photochemical Oxidation (POCP); Terrestrial Ecotoxicity (TETP). This set of impact categories includes local and global impact parameters as well as toxicological parameters.
The environmental impacts of each aerogel formulation were calculated based on the following formula:
where IC is the absolute environmental impact determined for the TU; are the characterization factors, which are numerical values that represent the environmental impact of a specific substance (j) in each material (j); and is the amount of each input material in the aerogel formulation.
The uncertainty of the IC values was calculated via propagation of the input error on the calculated values, using the formula below:
where are the characterization factors and is the standard deviation of the measured amount of each input material.
Going through each FU using the calculated IC values and Equation (1) resulted in the value. The propagation of the uncertainty on εKPI was calculated based on the equation below:
where , , and represent the standard deviations of the IC values calculated using Equation (3) and the thermal conductivity and volume of each aerogel, respectively.
3. Results and Discussion
3.1. Influence on the Properties of PUR Aerogels Using Different Solvents and Solids Contents
The influences of the nature of organic solvent and the solids content on the PUR aerogels’ properties were evaluated by adding the different solvents (or their mixtures) to the reaction mixture, prior to gel formation and freeze-drying (Table 1, PUR-1-6), or by varying the solids content from 3.2 to 10.8 wt.% using the optimum solvent (Table 1, PUR-6-9).
Table 2 lists the reactants used in each step of the aerogel synthesis and Table 3 summarizes the characterization results obtained in terms of density, thermal conductivity, and mechanical properties for the synthesized aerogels. As can be observed, the lowest density values were obtained by increasing the amount of EtOAc during the synthesis of the aerogels. On the contrary, aerogels synthesized with acetone showed the highest density values. Regarding thermal conductivity, it was observed that an increase in the δH-bonding parameter (higher EtOAc proportion) resulted in the produced aerogels having a better insulation capacity (lower thermal conductivity). In addition, the mechanical properties of the aerogels, presented according to the Young’s modulus, revealed that the mechanical strength slightly increased as the proportion of EtOAc in the samples increased (PUR-6).

Table 3.
Results of the waterborne polyurethane aerogel characterization.
The aerogels that were prepared using pure EtOAc as the organic solvent were selected because they had slightly higher mechanical strength and, more importantly, lower thermal conductivity. Acetone aerogels were not selected due to their higher density, as well as the experimental issues related to the lower boiling point of the acetone, which may cause the solvent to evaporate during the synthesis.
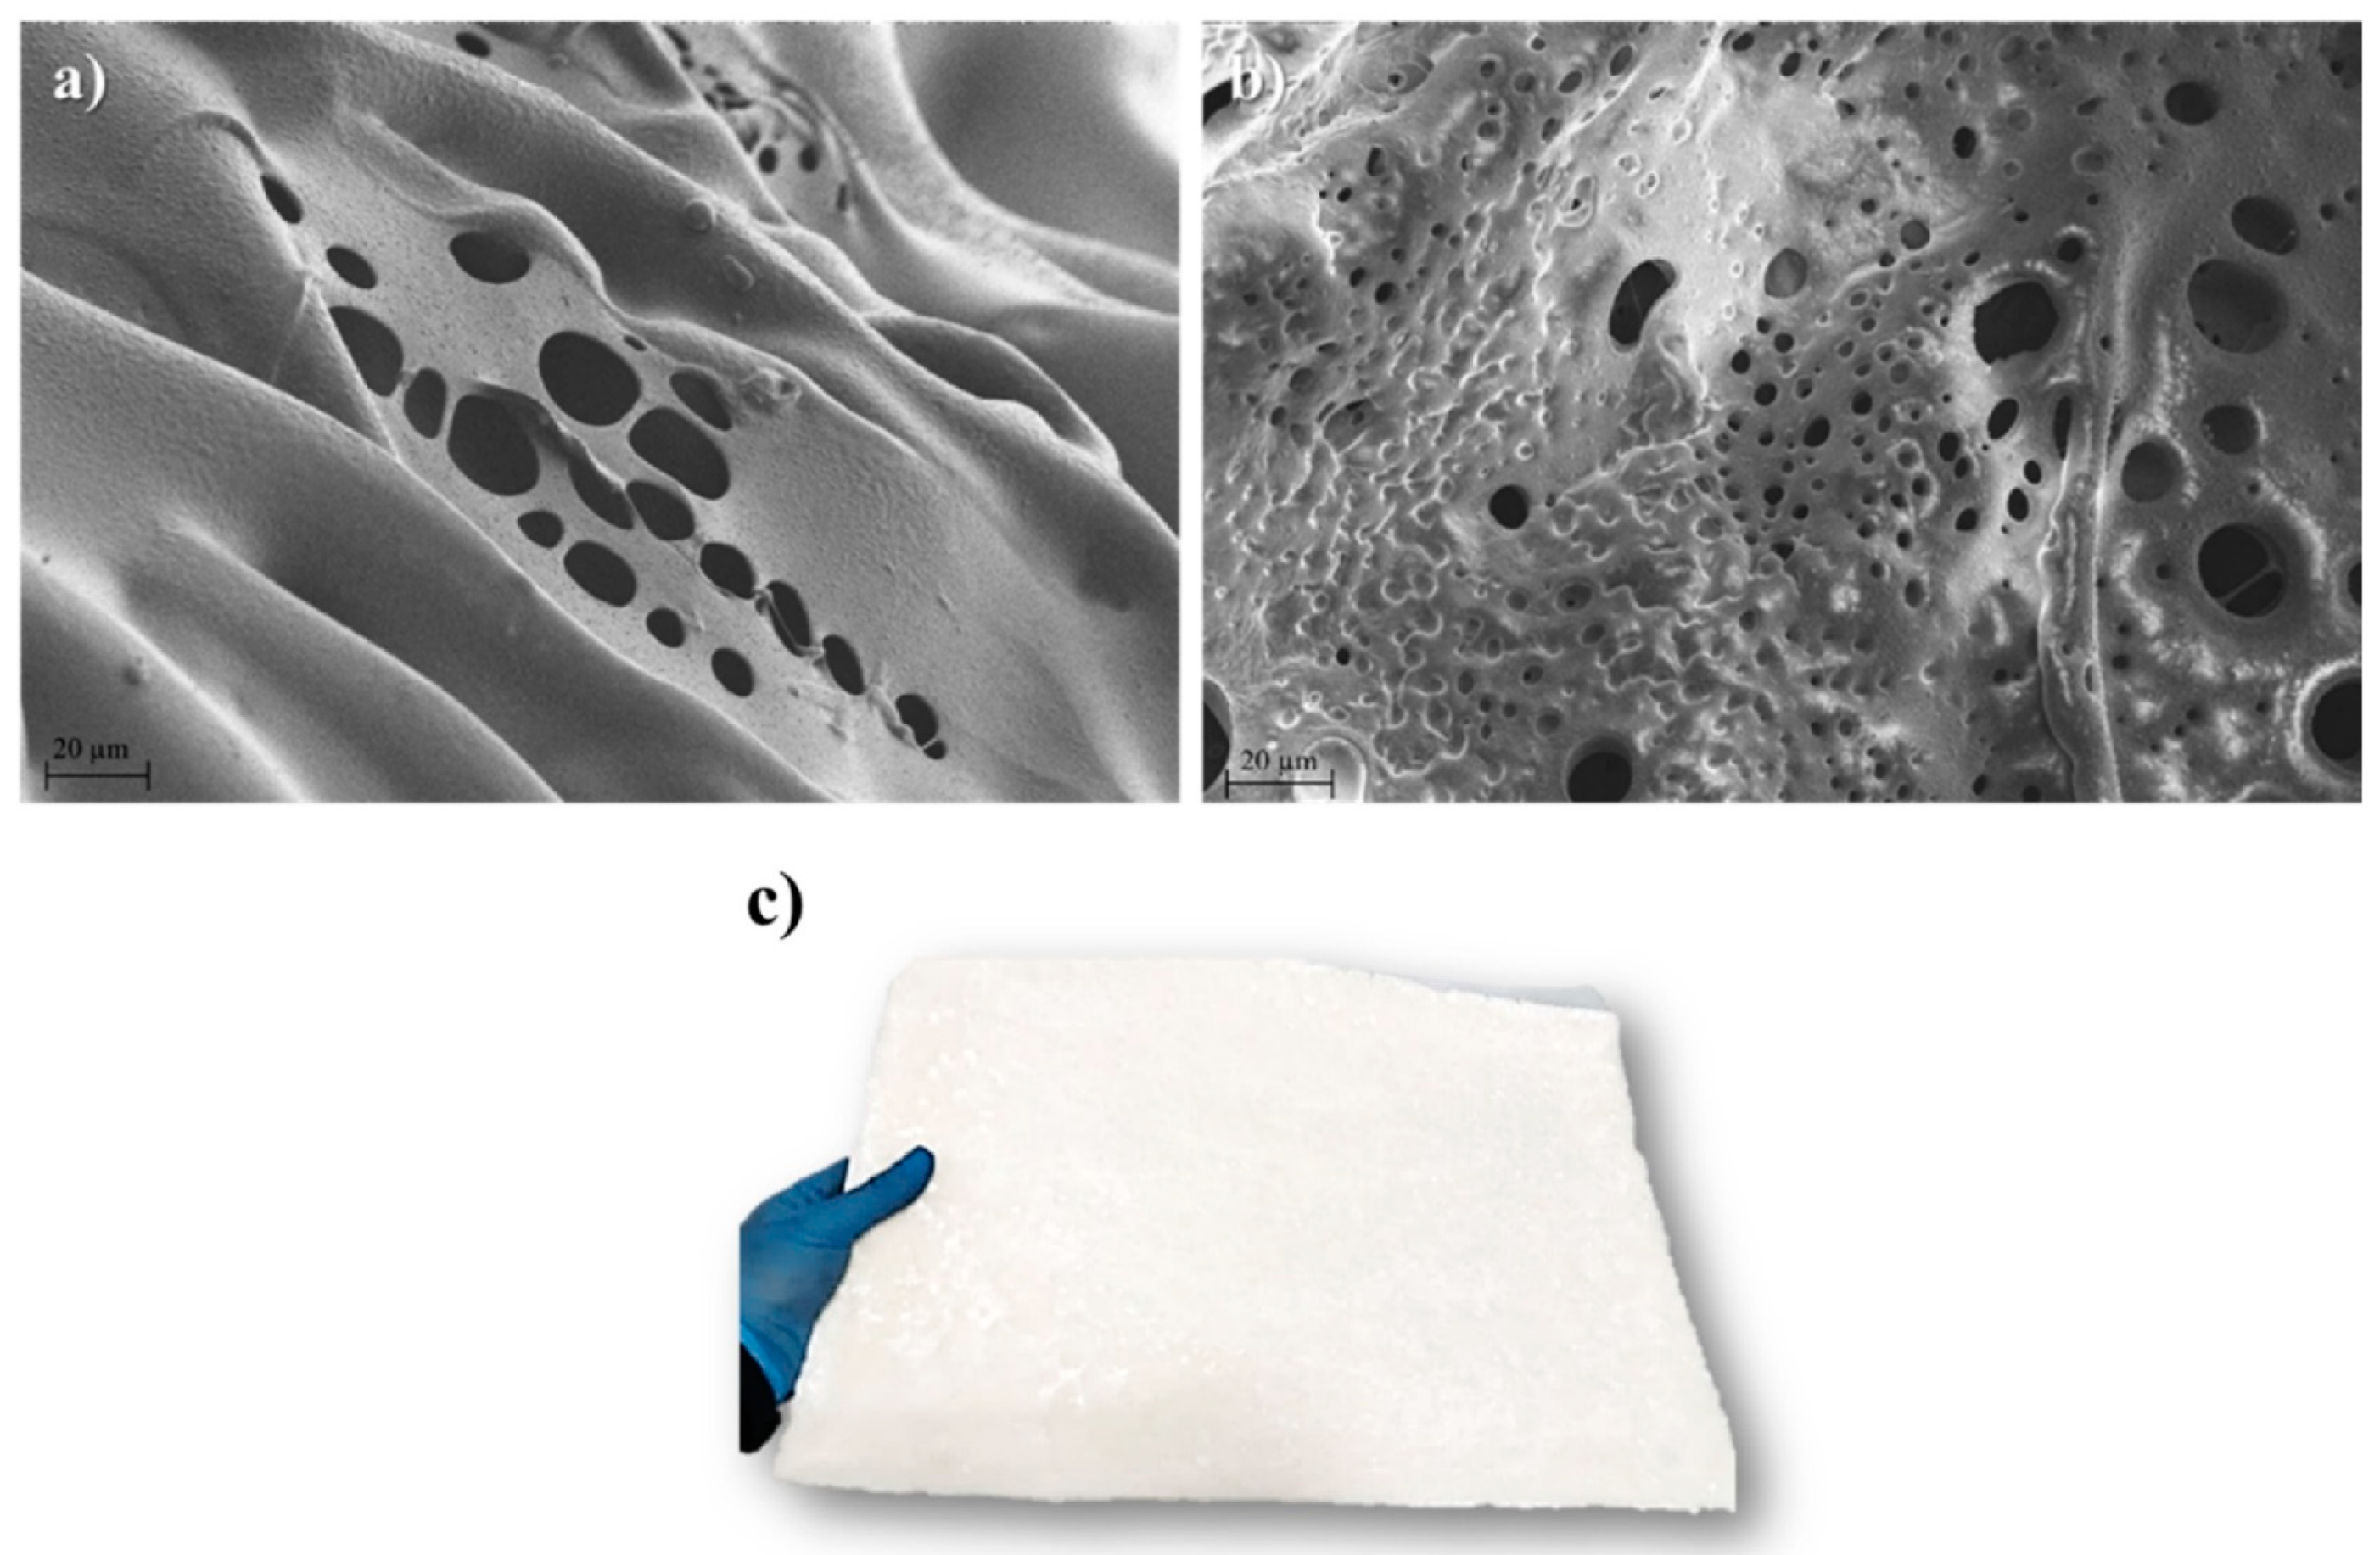
A clear relationship between the solids content and the density of the aerogel samples is observed. Samples with a higher solids content, such as PUR-6, exhibit higher density values compared to those with lower solids contents, like PUR-8 and PUR-9. In particular, samples with a solids content of less than 3.7 wt% (PUR-9) were so light that they were easily deformed, a characteristic that became apparent. These findings are corroborated by the SEM micrographs, where aerogels with a higher solids content (Figure 1a) show more compact structures, while those with lower solids contents exhibit greater porosity (Figure 1b). Figure 1c illustrates the visual appearance of the PUR-8 aerogels, fully prepared for industrial application.
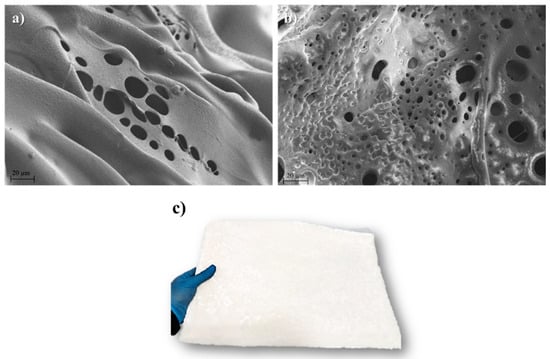
Figure 1.
Selected (a) PUR-6 and (b) PUR-8 SEM micrographs, and (c) the material’s visual appearance.
The impact of the solids content on the thermal conductivities of the PUR aerogels was not significant since all thermal conductivity values were quite similar, with average values ranging from 0.038 to 0.041 W/mK.
Regarding mechanical properties, a clear decrease in Young’s modulus values was observed as the solids content in the sample decreased. Remarkably, it can be observed an almost 10-fold reduction in the Young’s modulus when the solids content ranged from 10.8% (0.195 MPa) to 3.7% (0.020 MPa) by weight. It is worth mentioning that the sample with the lowest solids content, 3.2% by weight, was highly deformable, posing challenges in obtaining a reliable Young’s modulus for this analysis.
Based on the findings, aerogels formulated with a solids content of 3.7 wt.% (PUR-8) may be regarded as the most favorable option due to their comparatively lower density values.
3.2. LCIA Results
In this study, a comprehensive comparative analysis of nine distinct aerogel formulations was conducted, assessing their impacts across eleven environmental categories. This approach aimed to provide a detailed evaluation of each formulation’s environmental performance. The overarching objective was to pinpoint the formulation that exhibited the most favorable overall environmental performance. This would allow for the selection of an aerogel composition that minimizes environmental burdens while maintaining the desired functional properties such as thermal insulation.
The analysis was structured in two phases. The first phase focused on evaluating how different solvents—acetone, acetonitrile (ACN), and ethyl acetate (EtOAc), in varying proportions—affected the overall environmental performance of the aerogels. By systematically altering the solvent ratios, the study aimed to determine which solvent or combination of solvents resulted in the lowest environmental impact across the selected LCIA categories.
After identifying the most sustainable solvent, the second phase shifted focus to assessing how changes in the solids content of the aerogel formulations that utilized the selected solvent influenced their environmental footprint. This phase aimed to evaluate the trade-offs between the solids content and the associated environmental impacts.
Together, these two phases enabled us to identify the most environmentally sustainable aerogel solution.
3.2.1. LCIA Results (Comparison of Six Scenarios with Different Solvents, According to TUs and FUs)
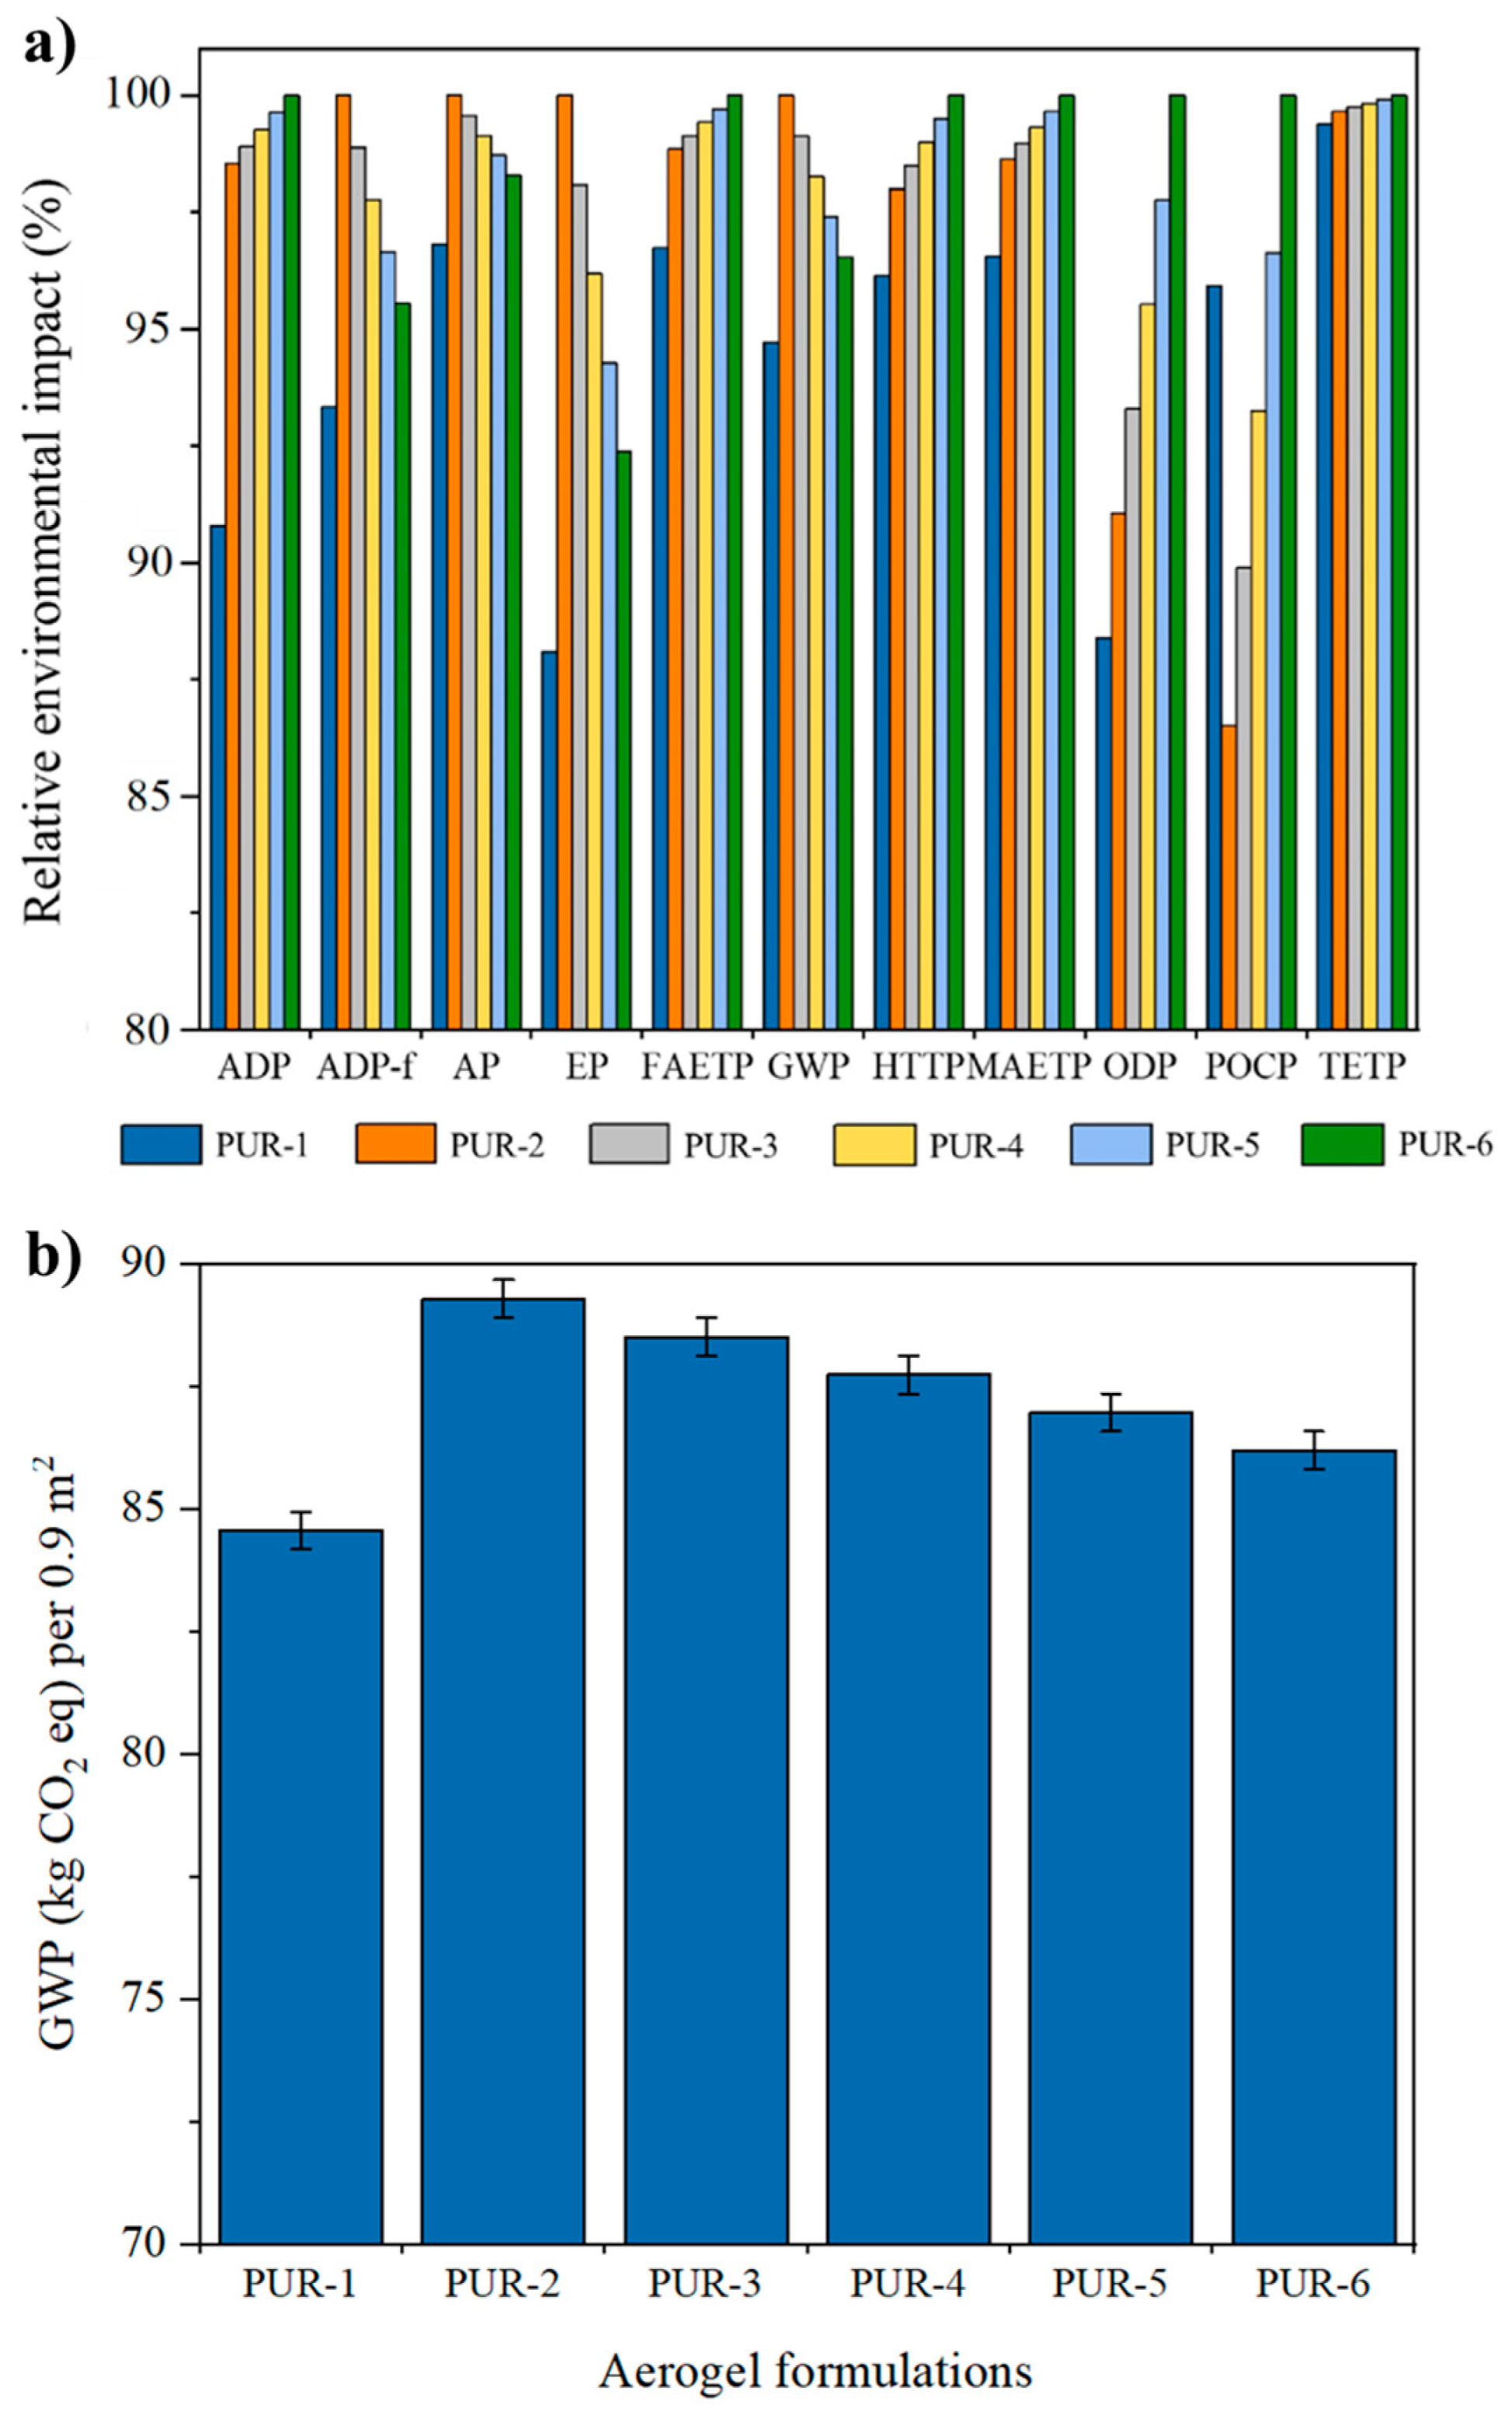
Figure 2a illustrates the relative environmental impacts of the six formulations of aerogels based on their TUs (TU = 0.9 m2). The values presented in this figure are expressed as percentages after normalization, considering the highest value in each impact category as 100%. For the absolute values of the environmental impacts of these first six formulations based on their TUs, please refer to Table S1 in the Supplementary Materials.
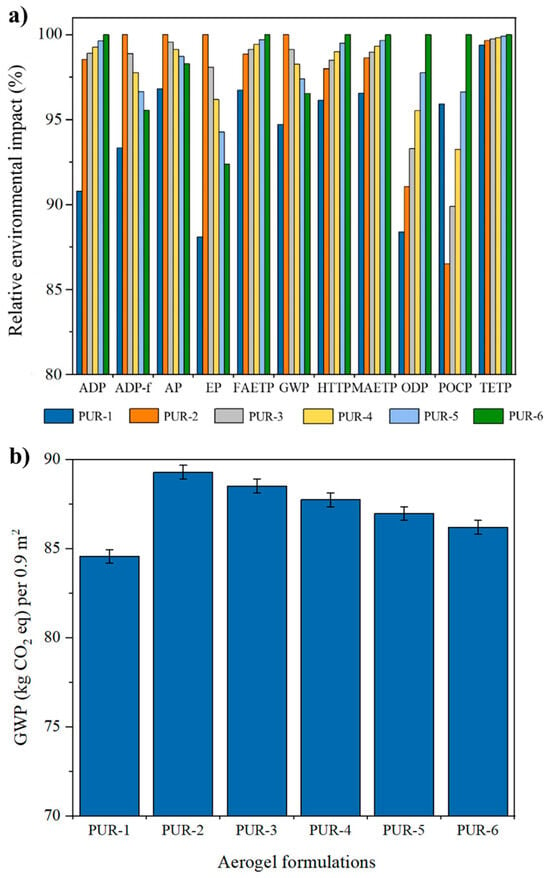
Figure 2.
(a) Relative environmental impacts and (b) GWP (kg CO2 eq) of six PUR aerogel formulations based on their TUs (0.9 m2).
In the synthesis of aerogels based on these six formulations, all parameters—including energy consumption, input chemicals, and water usage—were kept constant. The only variable was the type and ratio of solvents used in each formulation. This controlled approach ensures that any observed differences in environmental impacts can be attributed specifically to the variations in the solvents, allowing for a focused examination of how different solvents influence the overall environmental footprint of the aerogels.
In Figure 2b, the absolute values related to the GWP values for each of the six aerogel formulations are presented based on their TU. The bars in the graph represent the kg CO2 eq. values of the individual aerogels, and the associated error bars were calculated using Equation (3).
Observing the data illustrated in Figure 2a, it becomes evident that employing an equal volume of solvents in the six formulations reveals distinct patterns. The aerogel synthesized with ACN exhibits the highest values for impact categories ADP-f, AD, EP, and GWP. However, for impacts ADP, FAETP, HTTP, ODP, and POCP, the highest values are observed in the case of EtOAc. Notably, utilizing acetone in the production of the aerogels resulted in a lower environmental impact across all impact categories, including GWP (as shown in Figure 2b). However, caution is warranted in making definitive conclusions from these findings, as the analysis does not account for the functionality of the aerogels. As highlighted in the preceding section, the choice of ethyl acetate (EtOAc) as the organic solvent was deliberate, considering its marginally superior mechanical strength and, more significantly, its lower thermal conductivity. This emphasizes the necessity of conducting LCAs on aerogels by considering their functionalities.
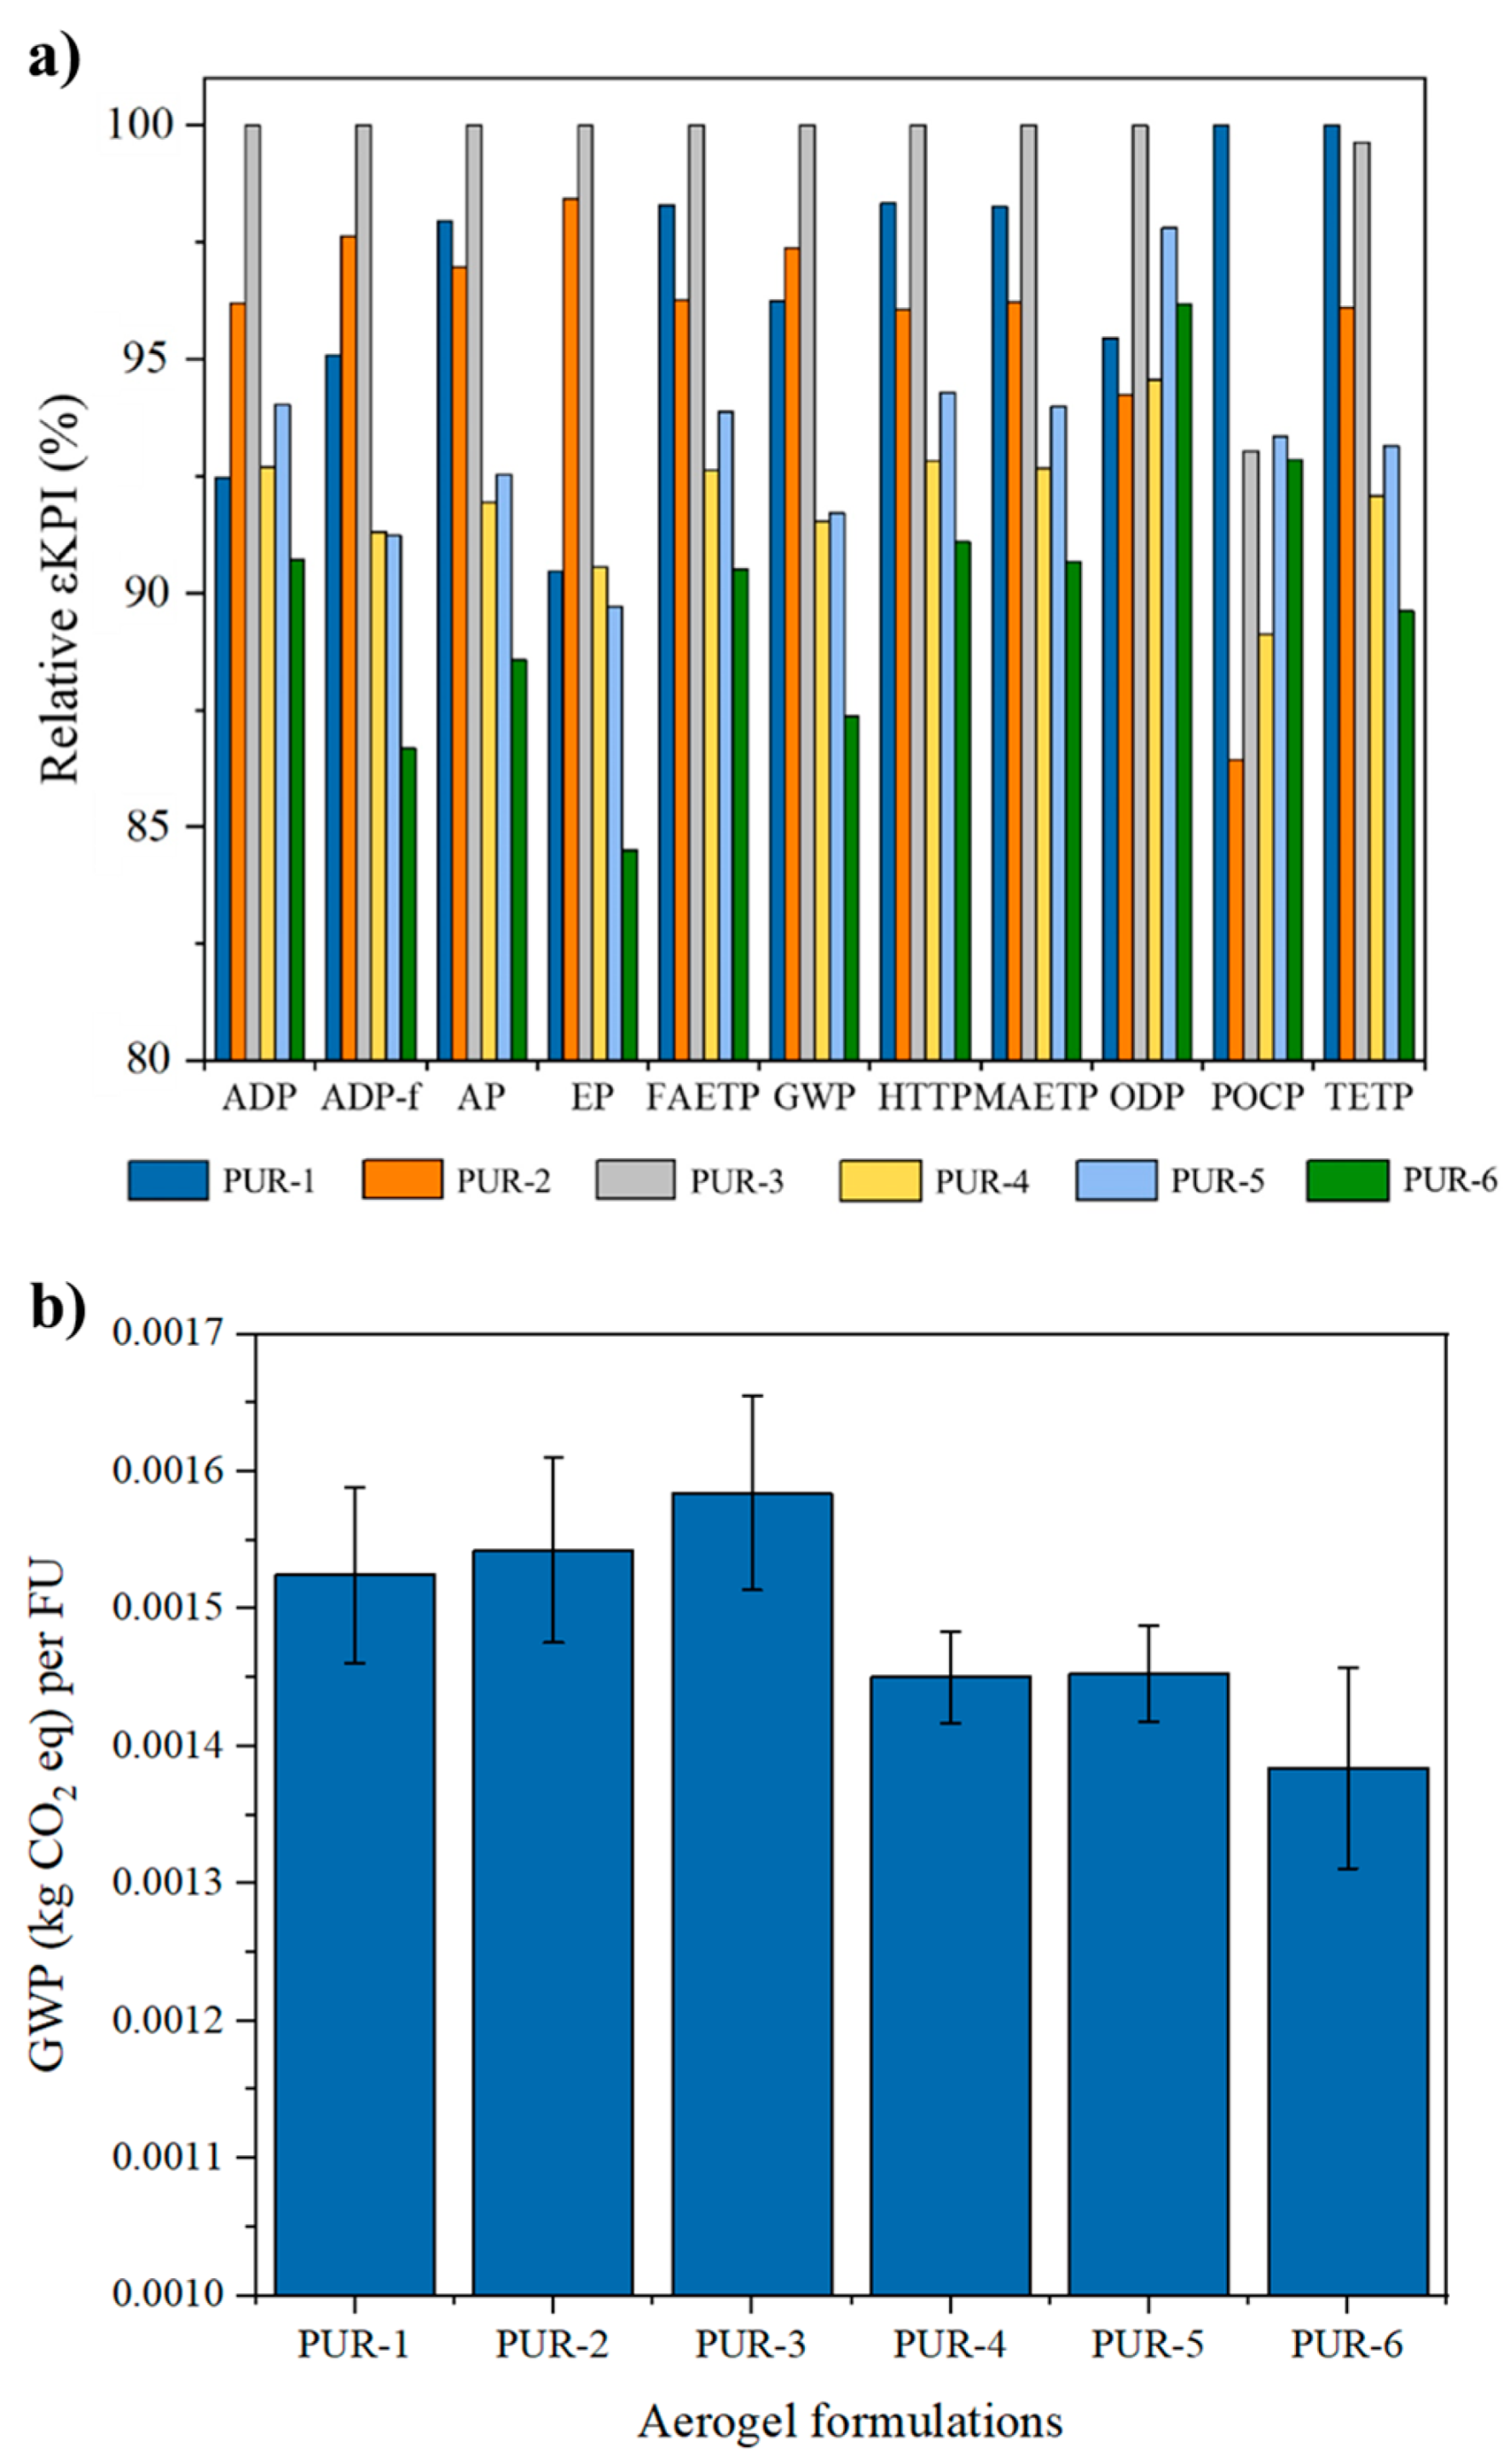
Applying Equation (1) to calculate the transition from TU to FU provides more comprehensive insights into the environmental impacts of these aerogels. Figure 3a illustrates the relative calculated εKPI values for the six aerogel formulations. For the absolute εKPI values for aerogel production across all six formulations, please refer to Table S2 in the Supplementary Materials.
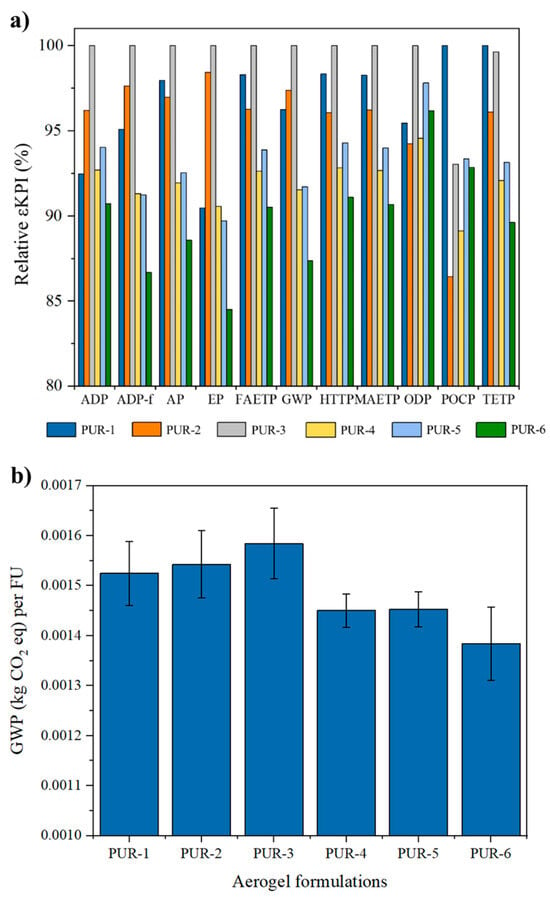
Figure 3.
(a) Relative calculated εKPI values and (b) GWP (kg CO2 eq) of six PUR aerogel formulations based on their FUs.
Based on the findings presented in Figure 3a, it is evident that the environmental profiles of the six aerogel formulations developed by integrating specific properties of the materials are quite different. The trend among the eleven categories is almost constant: PUR-6, while possessing the best thermal conductivity properties (i.e., 0.038 W/mK), shows the lowest εKPI for all categories, except for Ozone Layer Depletion and Photochemical Oxidation. This exception is attributed to the greater impacts of EtOAc on these two categories compared to the other solvents assessed at the same volume, which is further highlighted in the trend observed for PUR-2 to PUR-5 in Figure 2a, where a mixture of acetonitrile and ethyl acetate was used as the solvent. As the proportion of ethyl acetate gradually increases from 0% to 75%, the environmental impact of the synthesized aerogels formulated with this solvent mixture also shows a corresponding rise. However, when shifting the focus of the analysis from the TUs to the FUs, it can be observed based on Table 3 that increasing the amount of EtOAc improved the thermal insulation properties of the aerogels. Therefore, according to the results in Figure 3a, it becomes evident that PUR-6, due to its superior thermal insulation properties, is no longer the formulation with the highest impact in the ODP and POCP categories.
To enhance the clarity of the distinction between the analyses based on TUs and FUs, Figure 3b illustrates the GWP values of the formulations based on their FUs. These values were computed by considering the primary functionality of the aerogels, namely thermal insulation. For this purpose, Equation (1) was employed to calculate the GWP values, and Equation (4) was utilized for determining uncertainty (reflected by the error bars in Figure 3b). A comparison between Figure 2b and Figure 3b highlights the variations in results when transitioning from a TU-based analysis to an FU-based analysis. Based on the results presented in Figure 2b, while PUR-1 may seem to have the lowest impact in the GWP category in comparison with other aerogel formulations when evaluated based solely on the TUs, its functional efficiency tells a different story when assessed from the FU perspective. The FU approach ensures that both sustainability and material performance are fully considered when selecting the optimal aerogel formulation. As shown in Figure 3b, when the functional performance of the aerogels is taken into account, PUR-6 demonstrates the best performance in terms of GWP impact, offering the most favorable balance between environmental impact and functionality.
Based on the data presented in Figure 3a, it is evident that using a solvent solution consisting of 75% ACN and 25% EtOAc results in PUR-3 being associated with the highest environmental εKPI among the tested material formulations. This is followed closely by PUR-1, which employs ACN as a solvent in its formulation. In contrast, the formulation using 100% EtOAc (PUR-6) demonstrates significantly lower environmental impacts when the formulations are compared based on their functionality. Utilizing EtOAc resulted in a more sustainable production process without compromising the aerogel’s performance in terms of thermal insulation and mechanical strength, positioning it as the preferred solvent for polyurethane-based aerogel production.
Therefore, it can be concluded that, among the tested solvent mixtures, the use of a solution composed entirely of 100% EtOAc for aerogel production is the optimal choice since it yields lower environmental impacts while maintaining material functionality.
After analyzing the initial six formulations based on their functionality and environmental performance, the aerogel formulation prepared using pure EtOAc as the organic solvent is deemed the preferred solvent and is thus subjected to further analysis below. This subsequent investigation aims to understand the impact of variations in the solids content on the aerogel’s functionality and environmental impact.
3.2.2. LCIA Results (Comparison of Four Scenarios with Different Solids Contents, According to TUs and FUs)
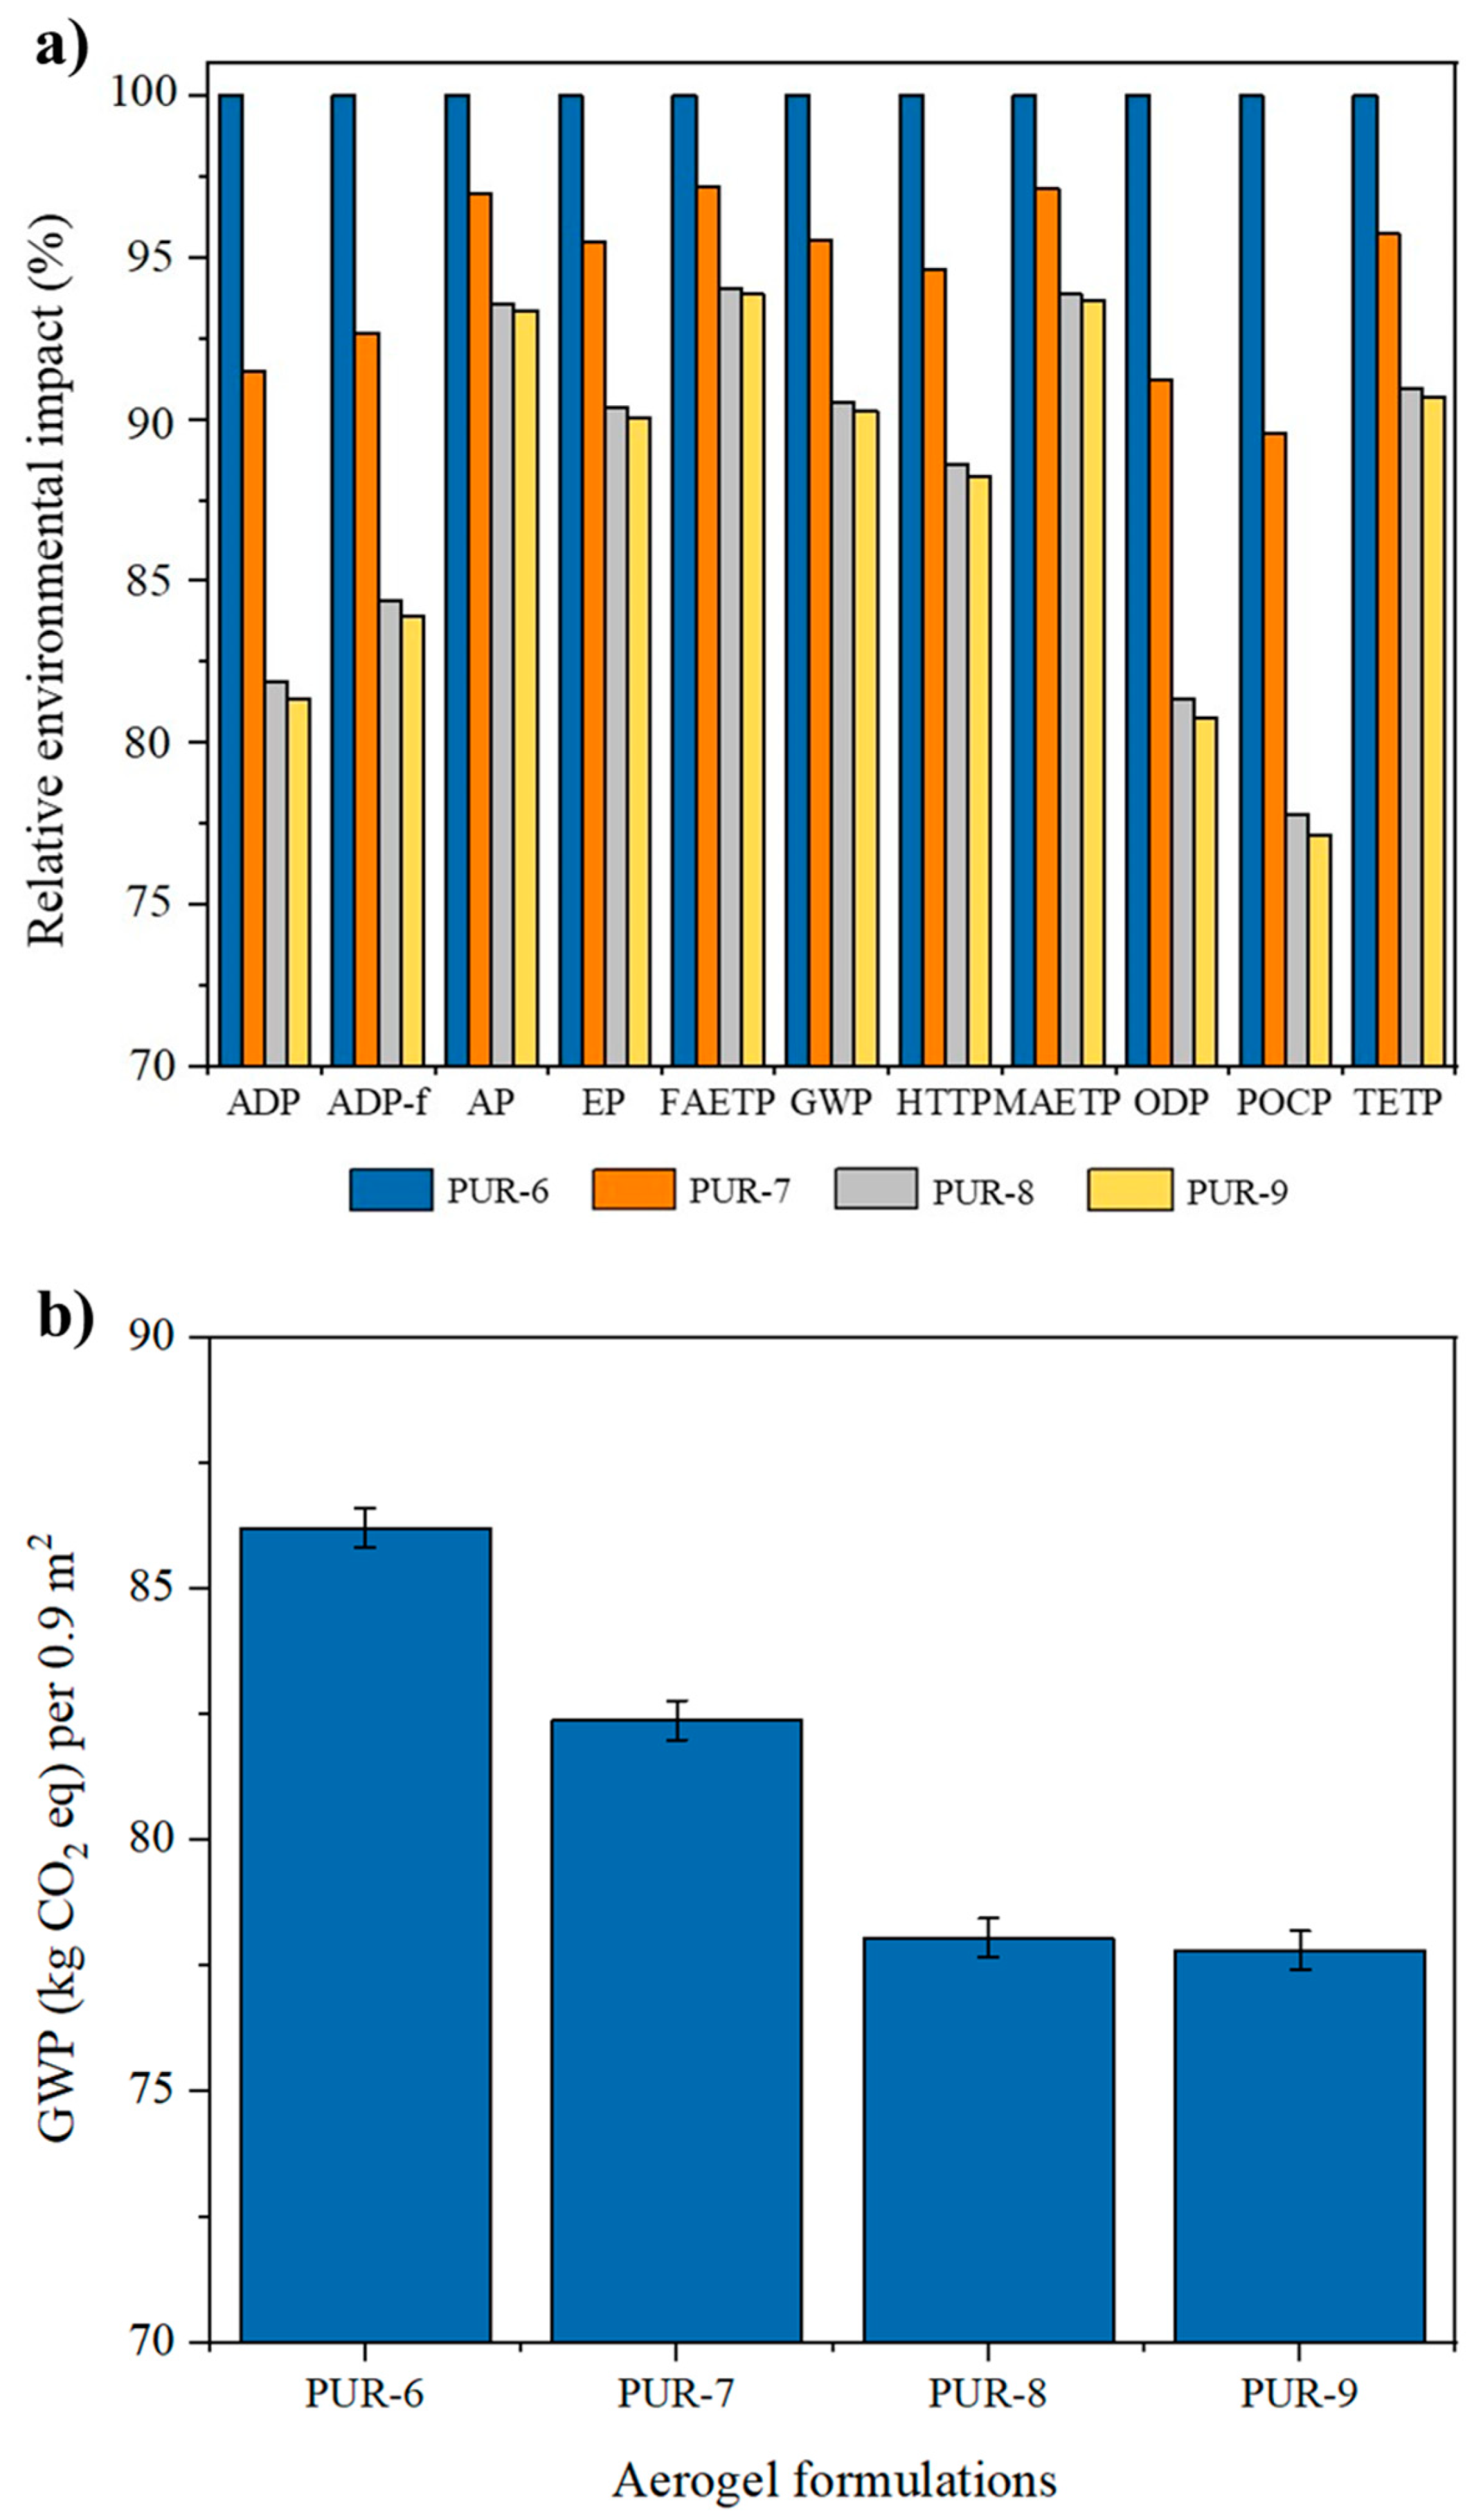
The environmental performance of four different aerogel formulations, denoted as PUR-6 to PUR-9 with solids content percentages of 10.8%, 7.2%, 3.7%, and 3.2%, respectively, has been analyzed. The outcomes of this conducted analysis, aimed at comprehending the relative environmental impacts of aerogels with varying solids contents based on their TUs, are presented in Figure 4a. The absolute values are shown in Table S3 within the Supplementary Materials.
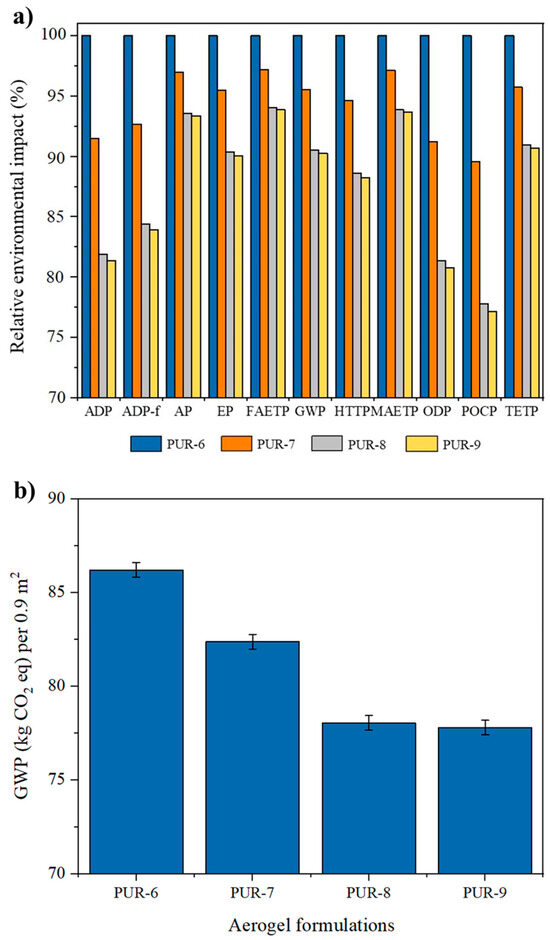
Figure 4.
(a) Relative environmental impacts and (b) GWP (kg CO2 eq) of four PUR aerogel formulations with different solids contents based on the TU (0.9 m2).
In the synthesis of these four aerogels (PUR-6 to PUR-9), a 100% EtOAc solution was consistently used as the solvent. To achieve the variations in solids content across these formulations, the amounts of input materials, including the solvent and water, were adjusted. However, the energy consumption during the production process remained constant for all formulations.
According to Figure 4a, there is a direct relationship between the solids content in the formulation of aerogels and their environmental impact. The conducted analysis suggests that, from an environmental perspective, reducing the solids content as much as possible is beneficial and contributes to a decrease in the overall environmental impact of aerogels since a lower amount of the material is required during synthesis. The results indicate that PUR-6, which has the highest solids content among the four studied formulations, exhibits the highest environmental impact across all categories. In contrast, as the solids content decreases in the formulations, a positive trend emerges in the environmental profiles of the aerogels. This improvement is reflected in the reduced environmental impact across all eleven studied categories. Notably, PUR-9 with a 3.2 wt.% solids content exhibits a 7% to 23% lower impact in different categories compared to PUR-6 with a 10.2 wt.% solids content.
Figure 4b further illustrates the GWP of these four formulations based on the TUs, showing that the impact of PUR-9 is 10% lower than that of PUR-6 in this category. Although the electricity consumption of the synthesis is equivalent for both aerogels, and the amount of water used in the production of PUR-9 is greater than that used for PUR-6, its improved environmental performance is primarily attributed to the reduced material usage in its synthesis.
As previously noted, while reducing the solids content proves advantageous from an environmental standpoint, it may introduce challenges to the functionality of the material. An example of this is seen in PUR-9, which has the lowest solids content at 3.2% by weight, resulting in high deformability and complicating the determination of a reliable Young’s modulus for analysis. Therefore, conducting an LCA that considers the functionality of the material becomes crucial. This integrated approach aids in identifying the optimized amount of solids content that aligns with both environmental and functional considerations.
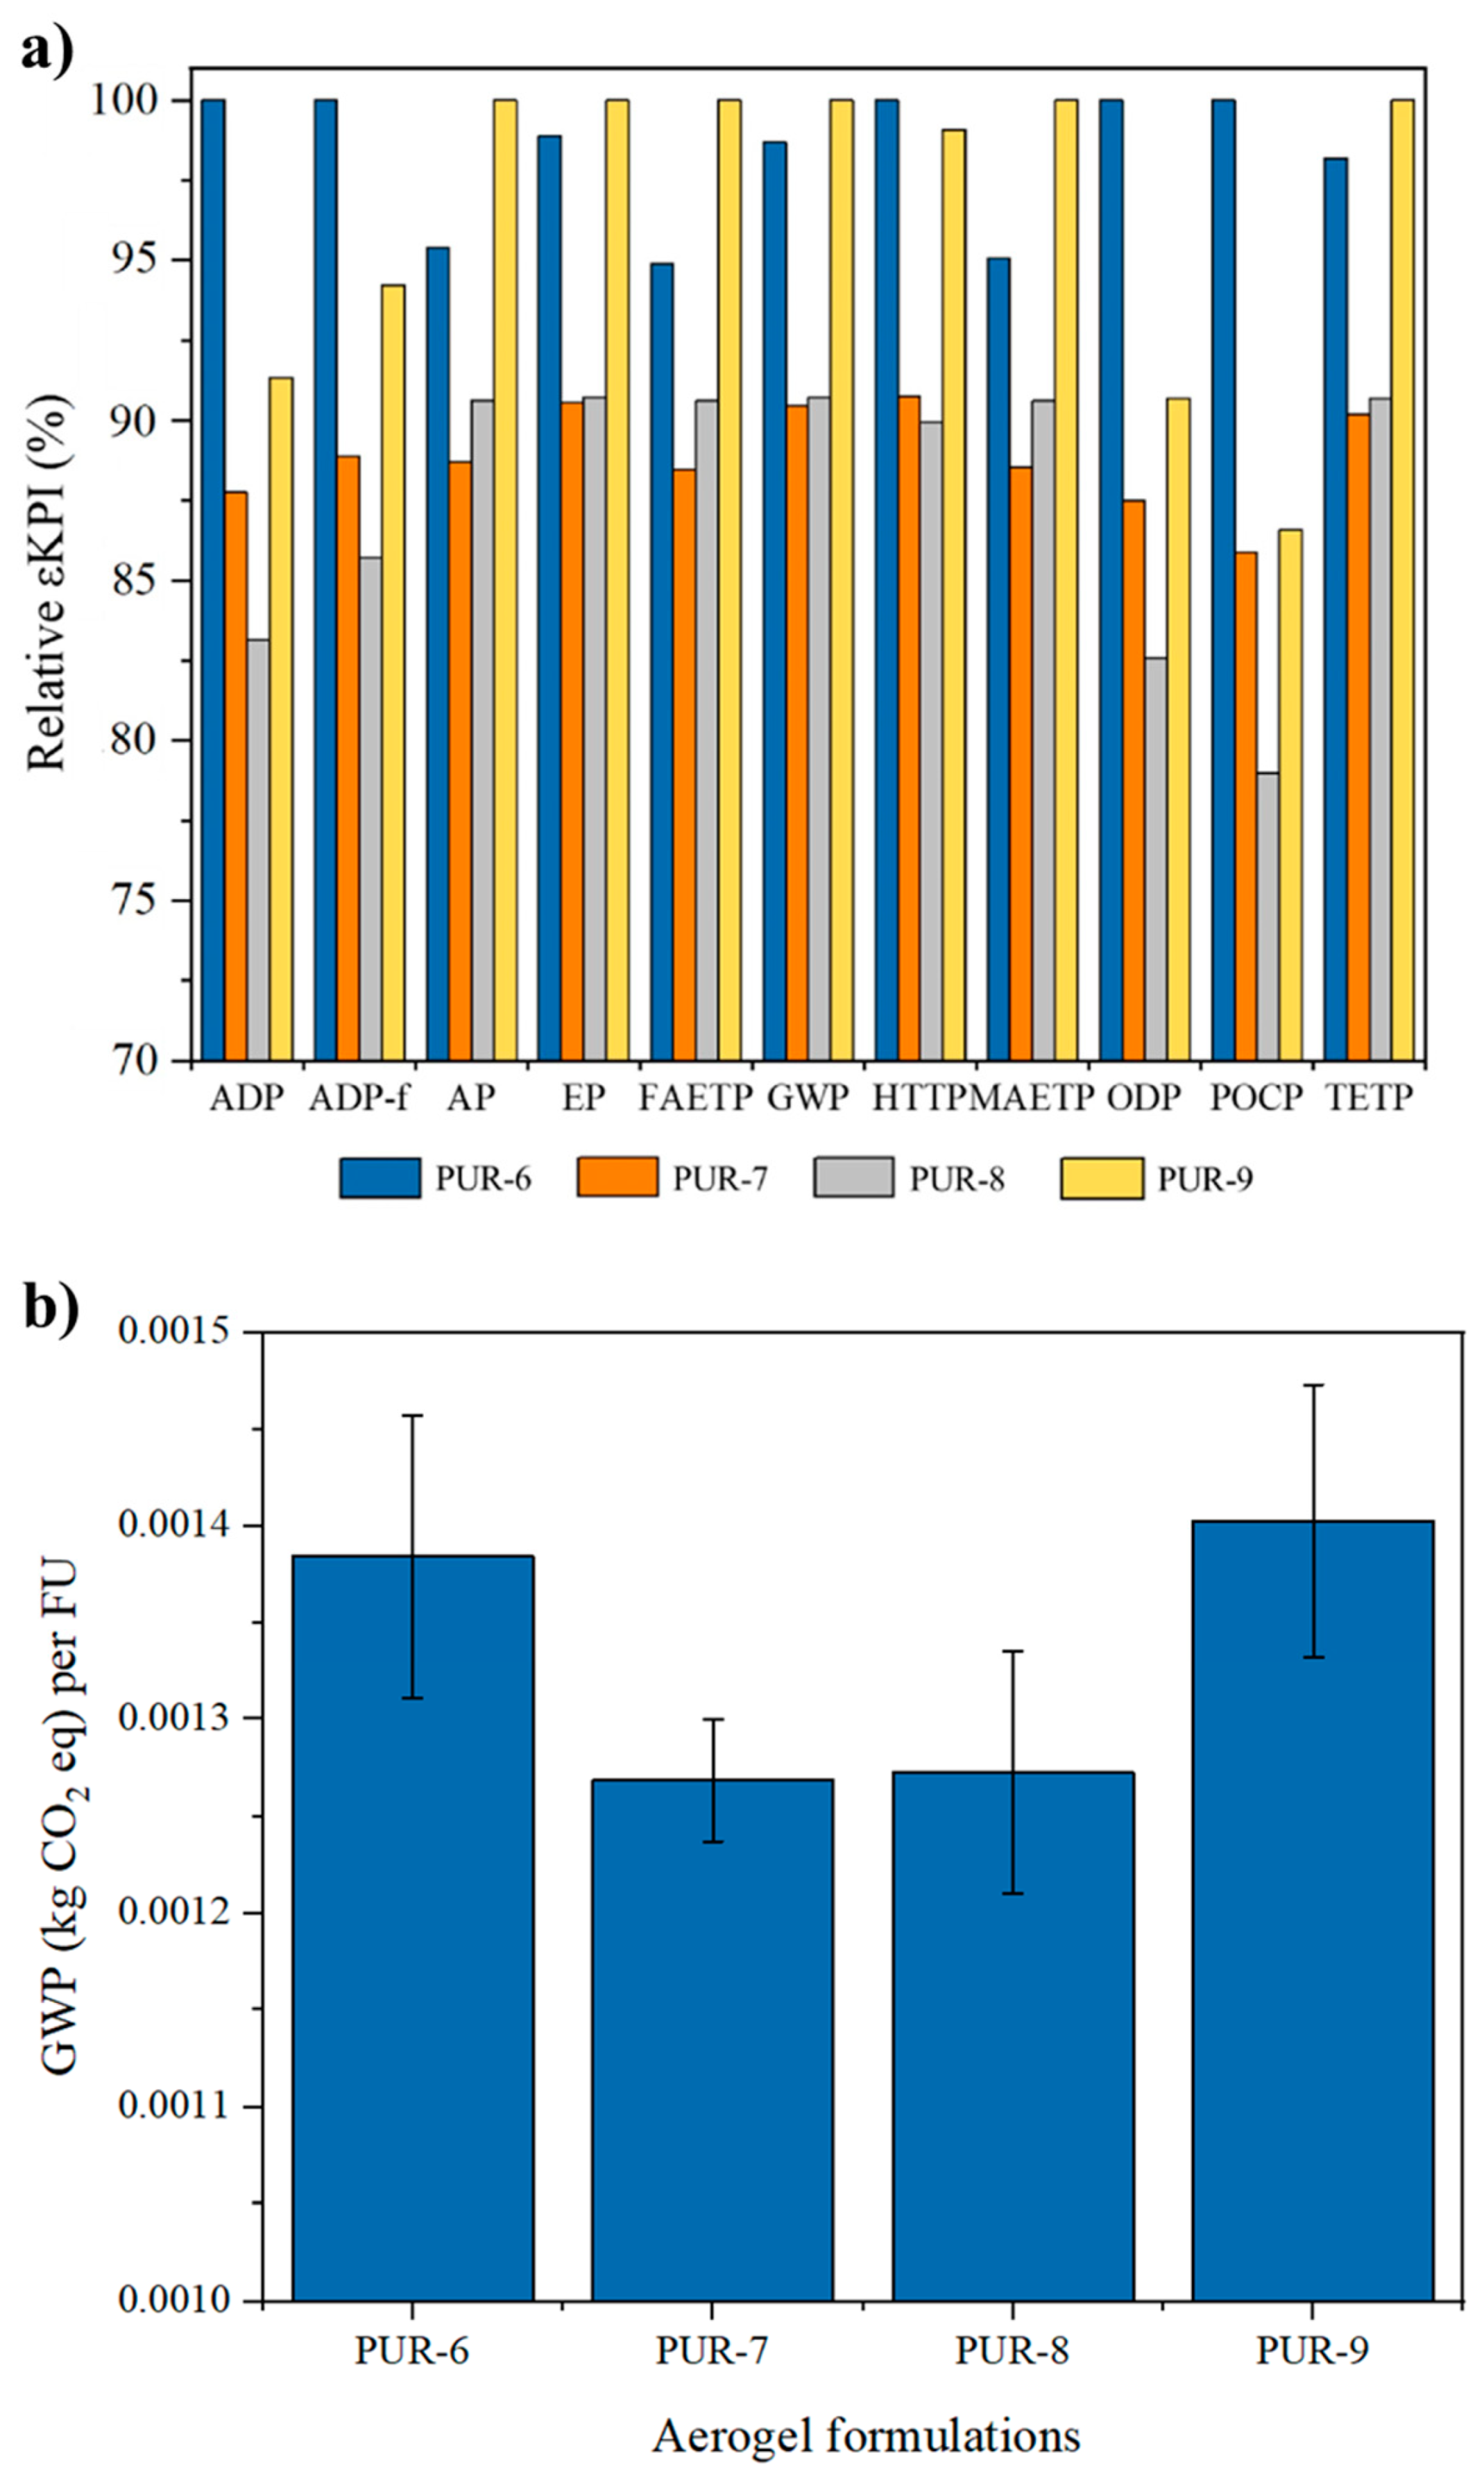
The relative εKPI values for PUR aerogels that are differentiated by their solids contents, derived from the results of the LCA augmented by Equation (1), are presented in Figure 5a. The corresponding absolute values can be found in Table S4 within the Supplementary Materials.
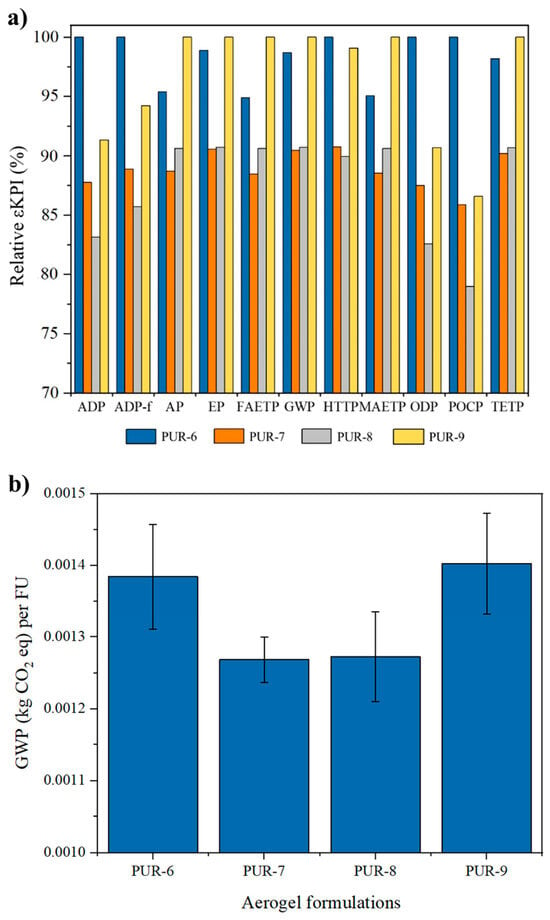
Figure 5.
(a) Relative calculated εKPI values and (b) GWP (kg CO2 eq) of four formulations of aerogels with different solids content based on their FUs.
Figure 5b shows the calculated GWP of aerogel formulations based on their FUs. The bars represent the KPI values calculated via Equation (1) and the error bars represent the uncertainty calculated based on Equation (4).
Based on the results reported in Figure 5a, two formulations, PUR-7 and PUR-8, stand out as the best formulations from an environmental standpoint when the functionality of the aerogels is considered during the analysis. These formulations share the lowest values across all eleven categories, with PUR-7 exhibiting the lowest values in six categories, namely AP, GWP, EP, FAETP, MAETP and TATP and PUR-8 exhibiting the lowest values in the remaining five.
As is evident from Figure 5a, PUR-7 and PUR-8 have slightly lower impacts than the other two formulations. However, as can be understood from Figure 5b, distinguishing between these two formulations in terms of which is the best is challenging. Furthermore, both underscore the presence of an optimized value for reducing the solids content in aerogel formulations, as excessively decreasing it can potentially compromise the functionality of the material.
A comparison of the results presented in Figure 4a and Figure 5a reveals that the weak mechanical performance of PUR-9 renders it the least favorable formulation, despite it showing the lowest environmental impact across all categories based on the TUs. In contrast, PUR-7 and PUR-8, in addition to exhibiting insulation functionality by maintaining sufficient structural integrity for practical applications, demonstrate a more favorable environmental profile compared to PUR-9. These findings further underscore the necessity of transitioning the analysis from the TUs to the FUs.
3.2.3. Analysis of LCIA Hotspots and Breakdown of Impacts for the Most Favorable Cases
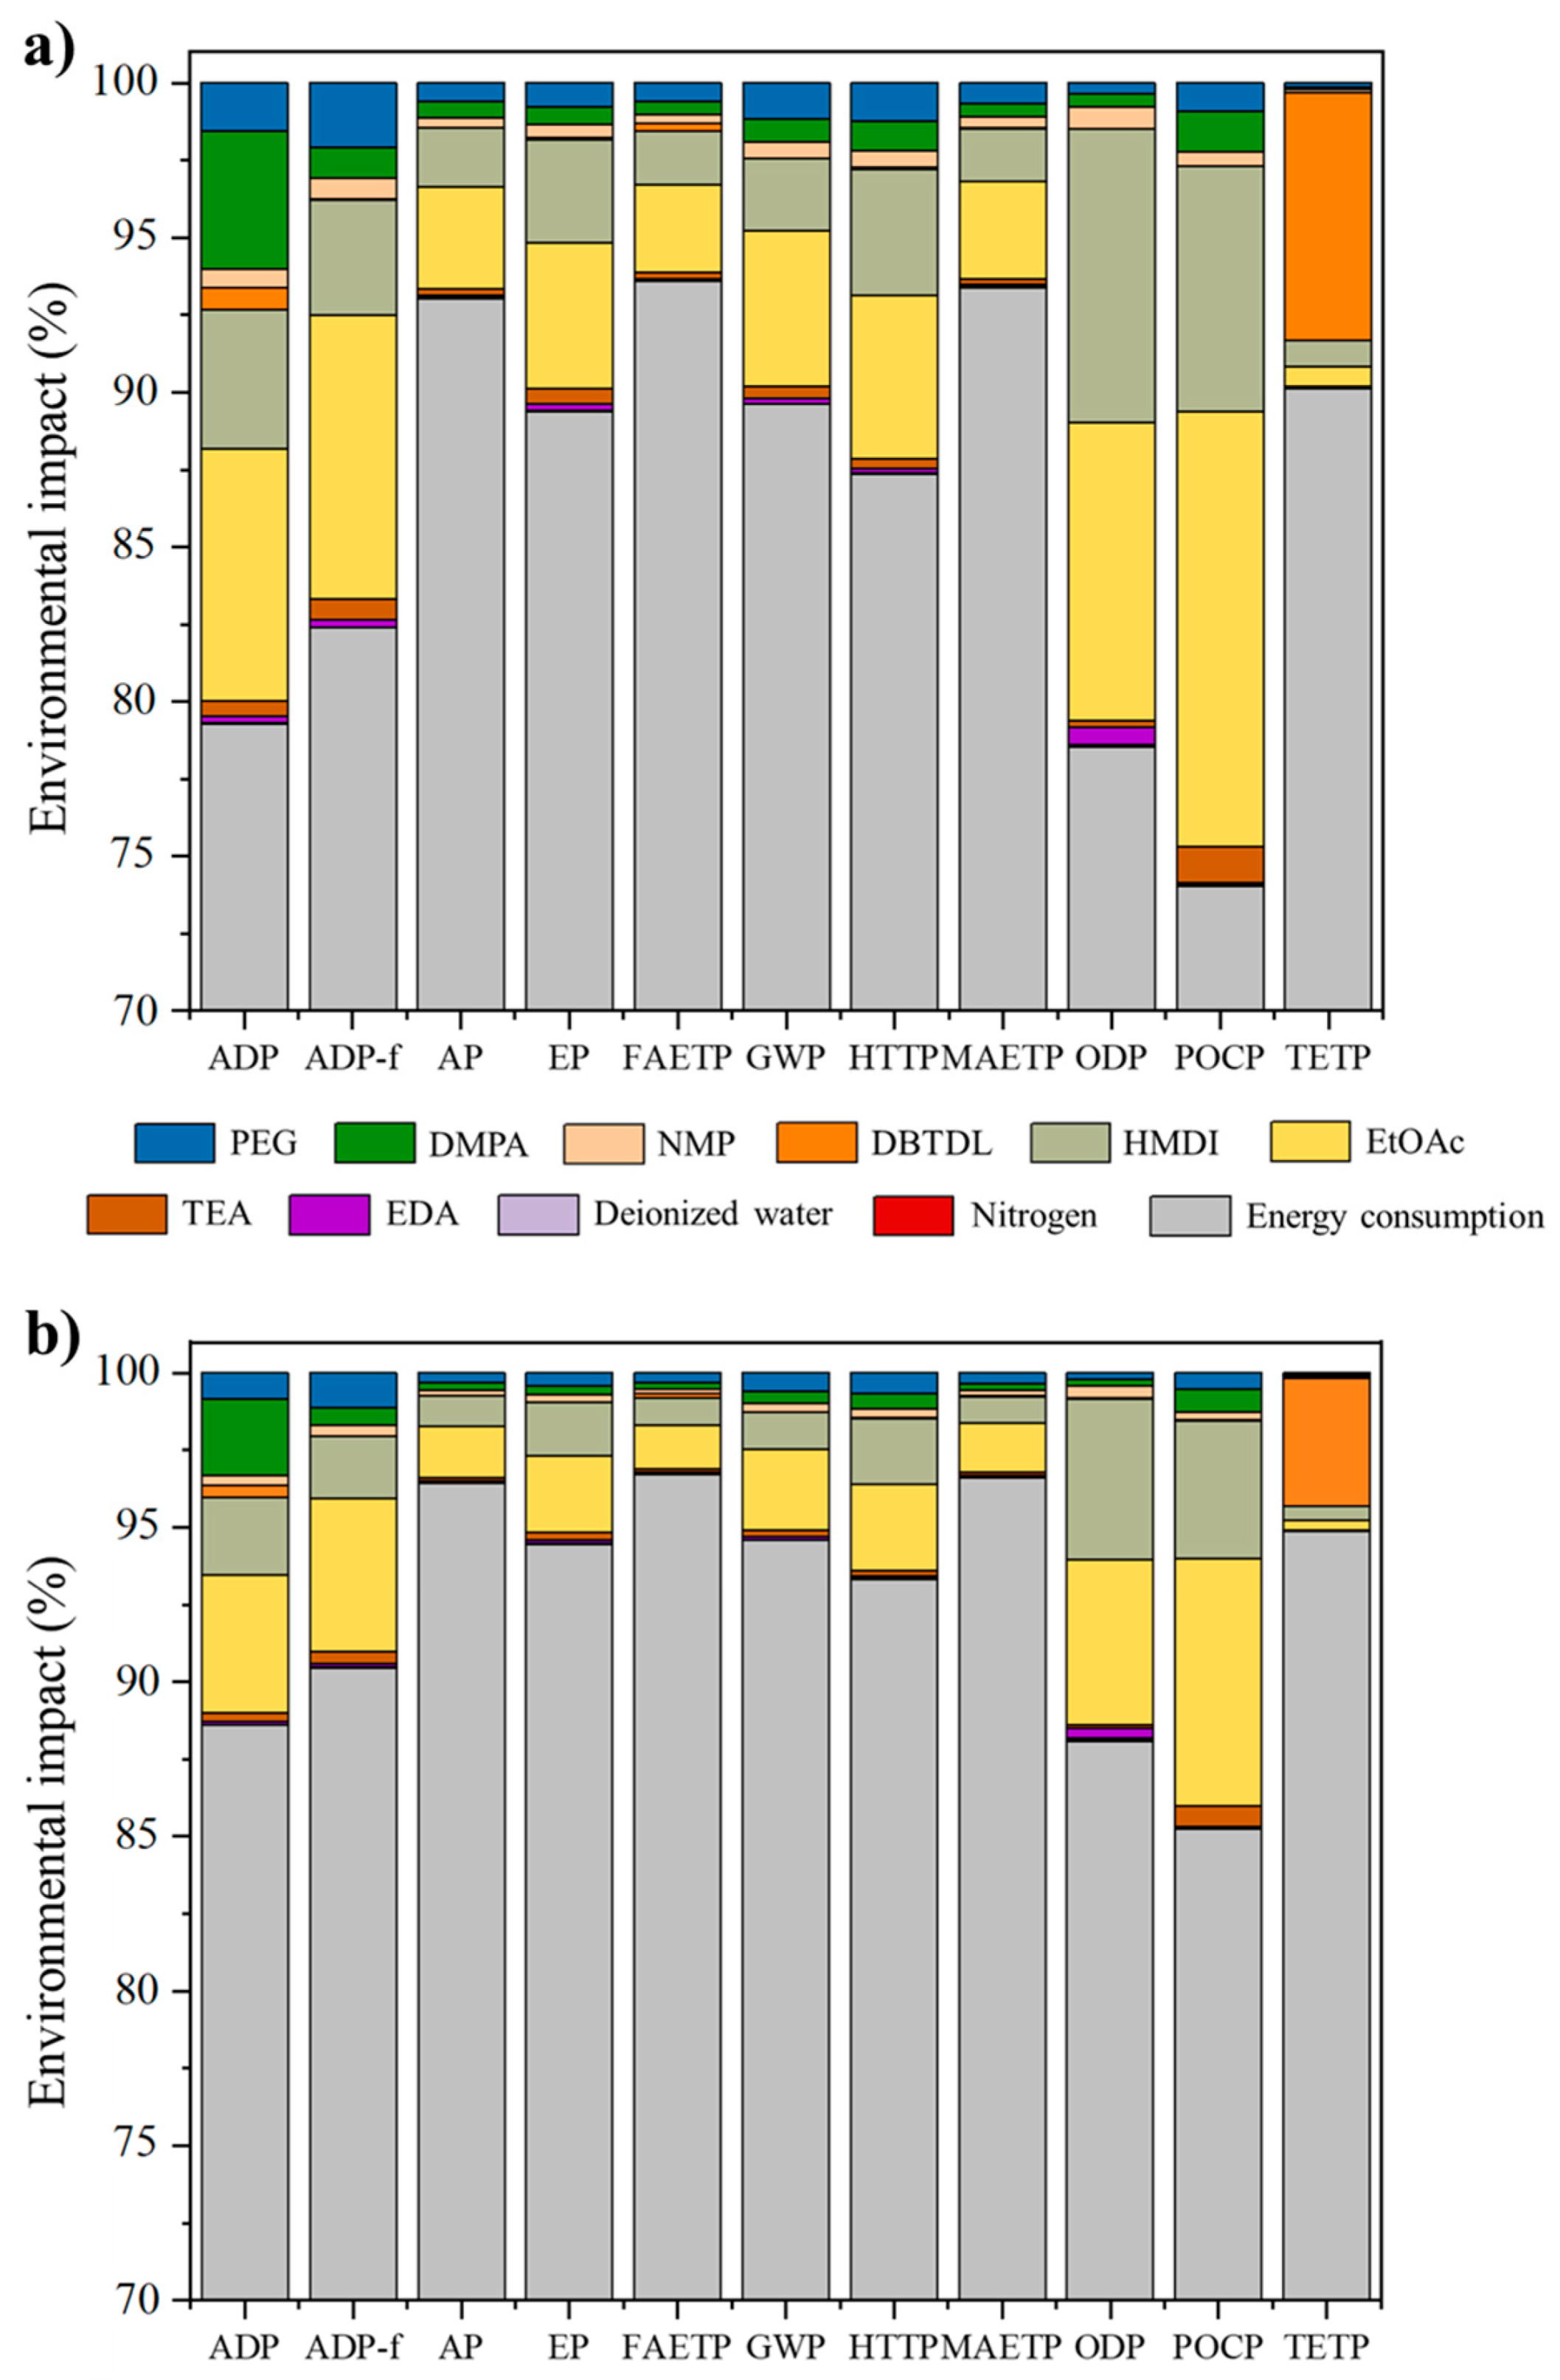
To determine the most significant sources of environmental impacts and to identify the hotspots for the selected impact categories during the synthesis of aerogels PUR-7 and PUR-8, a detailed analysis breaking down the contribution of each material and its energy consumption was conducted. Furthermore, these aerogels exhibited optimal properties from an industrial application standpoint, including low density, low thermal conductivity values, and appropriate mechanical properties (Table 3). Figure 6 illustrates the results of these detailed analyses.
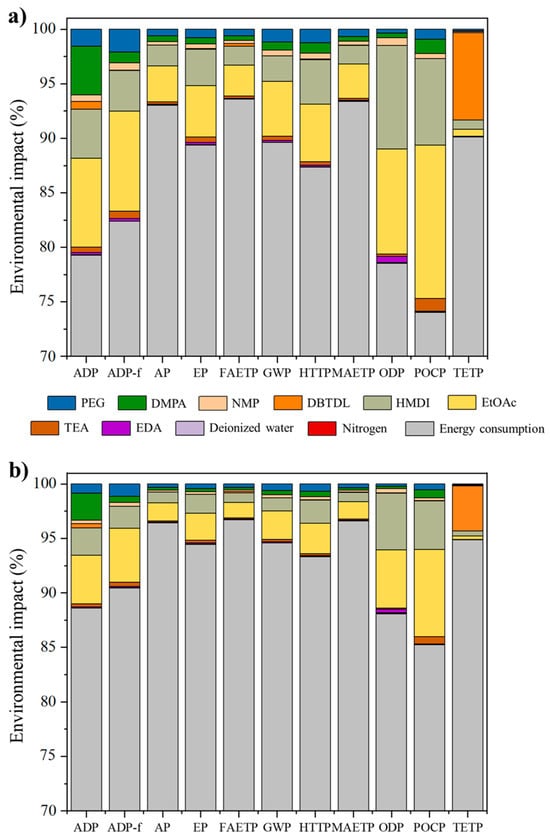
Figure 6.
Distribution of the environmental impact for the raw materials and energy used in the synthesis of (a) PUR-7 and (b) PUR-8. This figure shows a different scale on the Y-axis in order to better represent the factors that cause up to a maximum of 26% (for the PUR-7 case) or 14% (for the PUR-8 case) of the impacts.
According to Figure 6a, electricity consumption shows the highest contribution to the environmental impact of the production of one FU of aerogel PUR-7. The total consumption of the electrical energy in the synthesis of this aerogel is equal to 191 kWh, of which 94% is utilized during the freeze-drying stage of the synthesis. This observation highlights a significant potential for process optimization to reduce the amount of electrical energy used, ultimately leading to a mitigation in the environmental impact associated with the synthesis process. For all categories, with the exclusion of TETP, the second and third major causes of environmental impacts are due to the use of EtOAc and HDMI, respectively. However, their contribution is always lower than 10.2 wt.% of the total impacts for each category. The impact on the TETP category is due to electricity (96%) and DBTDL (48%). The environmental impact on the ecotoxicity category due to the use of DBTDL can be mainly attributed to the cultivation of the coconuts from which lauric acid is extracted.
Figure 6b represents the influence of each input material and energy consumption on the environmental performance of PUR-8. In comparison with PUR-7, there is less material in the formulation of PUR-8, which causes an increment in the relative influence of electricity on the environmental burden of this aerogel. While the percentages may vary, a consistent trend is observed across all other materials. In the TETP category, DBTDL is the second main factor; however, in the remaining 10 categories, EtOAc and HMDI exhibit the highest impact among the chemical materials.
Thus, from Figure 6a,b, it is apparent that the primary contributor to the environmental burden of these aerogels is electricity consumption. This observation suggests the potential for improvement by exploring methods with lower rates of energy consumption or by incorporating renewable sources of energy in the production process.
The obtained results are in line with the works of other authors [10,19,32]. This study provides valuable insights for the production of a sustainable construction material based on both novel material improvements and novel synthesis improvements. As discussed, the performance parameters of the proposed material are comparable with other conventional types, with significantly fewer environmental impacts. Although the novel freeze-drying method does pose some negative environmental externalities due to the large demand for energy during processing, which can be highlighted as a major limitation of this study, potential guidance and improvements can also be derived from this study. Energy usage can be reduced by incorporating the use of equipment with higher energy efficiency rates, using renewable energy sources to meet the electricity requirements of freeze-drying, and reducing the processing time. Once the production and manufacturing process is largely commercialized, larger product batches and a continuous flow process will further improve the environmental performance of the product and process due to the concept of economies of scale.
4. Conclusions
This study conducted a Life Cycle Assessment (LCA) on the synthesis of polyurethane (PUR) aerogels, examining the effects of various solvents and solids contents in the formulation. The analysis revealed that acetonitrile (ACN) exhibited the highest environmental impact, while acetone demonstrated a comparatively lower impact, based on a Technical Unit (TU) of 0.9 m2 aerogel panels. Notably, a solvent solution of 100% ethyl acetate (EtOAc) resulted in the least environmental impacts. This conclusion was drawn by evaluating the thermal conductivity and density of the aerogels using an environmental Key Performance Indicator (εKPI).
The study also determined that reducing the solids content is advantageous for minimizing the overall environmental impact, as measured by the TU. However, it was noted that excessively reducing the solids content could potentially compromise the material’s functionality; therefore, an optimized range for the percentage of solids content in the aerogel formulation was identified. Electricity consumption was identified as the major contributor to the environmental impact of PUR aerogel production.
This research concludes that the environmental performance can be significantly enhanced through commercialization, larger production batches, and the adoption of a continuous flow process, owing to the benefits of economies of scale.
Supplementary Materials
The following supporting information can be downloaded at: https://www.mdpi.com/article/10.3390/resources13100138/s1, Table S1: Environmental impacts of 6 PUR aerogel formulations based on the TU = 0.9 m2. These values are computed utilizing Equations (2) and (3), and are expressed in the format: ICs + σICs; Table S2. Environmental impacts of six PUR aerogel formulations based on the functional unit. The KPIs and uncertainty calculated based on the Equations (1) and (4) respectively; Table S3. Environmental impacts of four PUR aerogel formulations (PUR-6 to PUR-9) with different solids content based on the TU = 0.9 m2. These values are computed utilizing Equations (2) and (3), and are expressed in the format: ICs + σICs; Table S4: Environmental impacts of four PUR aerogel formulations with different solids content based on the functional unit. The KPIs and uncertainty calculated based on the Equations (1) and (4) respectively.
Author Contributions
S.A.A.: conceptualization, methodology, formal analysis, investigation, data curation, writing—original draft; M.C.: conceptualization, methodology, validation, formal analysis, data curation, writing—review and editing, supervision; M.P.: conceptualization, methodology, validation, formal analysis, writing—review and editing, supervision, project administration, funding acquisition; E.P.-P.: investigation, data curation, writing—original draft; D.C.: investigation, data curation, writing—original draft; A.R.: formal analysis, data curation, writing—review and editing, supervision; L.S.-S.: conceptualization, writing—review and editing, supervision, project administration, funding acquisition. All authors have read and agreed to the published version of the manuscript.
Funding
This work was performed within the framework of the BIOMAT project. The BIOMAT project has received funding from the European Union’s Horizon 2020 Research and Innovation Programme under Grant Agreement No. 953270.
Data Availability Statement
The data presented in this study are openly available in the article.
Acknowledgments
The authors would also like to acknowledge B.Sc. O. del Fresno for assisting in the characterization of the aerogels.
Conflicts of Interest
S.A. Aldaghi, M. Costamagna, and M. Perucca were employed by the company ProyectHub360. The remaining authors declare that this research was conducted in the absence of any commercial or financial relationships that could be construed as a potential conflict of interest.
References
- International Energy Agency. Global Status Report for Buildings and Construction 2019; IEA: Paris, France, 2019. [Google Scholar]
- Anh, L.D.H.; Pásztory, Z. An overview of factors influencing thermal conductivity of building insulation materials. J. Build. Eng. 2021, 44, 102604–102619. [Google Scholar] [CrossRef]
- Schiavoni, S.; Bianchi, F.; Asdrubali, F. Insulation materials for the building sector: A review and comparative analysis. Renew. Sustain. Energy Rev. 2016, 62, 988–1011. [Google Scholar] [CrossRef]
- Tam, V.Y.; Le, K.N. Sustainable Construction Technologies: Life-Cycle Assessment; Butterworth-Heinemann: Oxford, UK, 2019. [Google Scholar]
- Maleki, H. Recent advances in aerogels for environmental remediation applications: A review. J. Chem. Eng. 2016, 300, 98–118. [Google Scholar] [CrossRef]
- Pierre, A.C.; Pajonk, G.M. Chemistry of aerogels and their applications. Chem. Rev. 2022, 102, 4243–4266. [Google Scholar] [CrossRef] [PubMed]
- Biesmans, G.; Randall, D.; Francais, E.; Perrut, M. Polyurethane-based organic aerogels’ thermal performance. J. Non Cryst. Solids 1998, 225, 36–40. [Google Scholar] [CrossRef]
- Diascorn, N.; Calas, S.; Sallée, H.; Achard, P.; Rigacci, A. Polyurethane aerogels synthesis for thermal insulation–textural, thermal and mechanical properties. J. Supercrit. Fluids 2015, 106, 76–84. [Google Scholar] [CrossRef]
- Rigacci, A.; Marechal, J.; Repoux, M.; Moreno, M.; Achard, P. Preparation of polyurethane-based aerogels and xerogels for thermal superinsulation. J. Non Cryst. Solids 2004, 350, 372–378. [Google Scholar] [CrossRef]
- Parascanu, M.M.; Esteban-Arranz, A.; de la Osa, A.R.; Romero, A.; Sánchez-Silva, L. Comparison of nanoclay/polyvinyl alcohol aerogels scale production: Life Cycle Assessment. Chem. Eng. Res. Des. 2021, 176, 243–253. [Google Scholar] [CrossRef]
- Vareda, J.P.; Lamy-Mendes, A.; Durães, L. A reconsideration on the definition of the term aerogel based on current drying trends. Microporous Mesoporous Mater. 2018, 258, 211–216. [Google Scholar] [CrossRef]
- Cantero, D.; Pinilla-Peñalver, E.; Romero, A.; Sánchez-Silva, L. Synthesis of waterborne polyurethane aerogels-like materials via freeze-drying: An innovative approach. J. Mater. Sci. 2023, 58, 9087–9102. [Google Scholar] [CrossRef]
- Cheng, K.; Wang, L.; Yu, Y.; Xiang, Y.; Bai, W.; Xu, L.; Li, H. Solubility and thermodynamic analysis of 1-(4-tert-butyl-2, 6-dimethylphenyl) ethenone in different pure and binary solvents. J. Chem. Thermodyn. 2023, 180, 107019–107029. [Google Scholar] [CrossRef]
- Shen, Y.; Bi, Y.; Zhao, P.; Yang, X.; Zhang, Z.; Dang, D.; Wang, H.; Liu, W. Equilibrium solubility of 6-propyl-2-thiouracil in nine pure solvents: Determination, correlation, Hansen solubility parameter and thermodynamic properties. J. Indian Chem. Soc. 2023, 100, 100934–100940. [Google Scholar] [CrossRef]
- Wang, Z.; Peng, Y.; Cheng, X.; Yang, J.; Zhou, B.; Mi, L.; Hu, Y. Investigation on Hansen solubility parameter, solvent effect and thermodynamic properties of 3-methylflavone-8-carboxylic acid dissolved in different solvents. J. Mol. Liq. 2022, 356, 119017. [Google Scholar] [CrossRef]
- Chen, W.; Yu, H.; Li, Q.; Liu, Y.; Li, J. Ultralight and highly flexible aerogels with long cellulose I nanofibers. J. Soft Matter 2011, 7, 10360–10368. [Google Scholar] [CrossRef]
- Llantoy, N.; Chàfer, M.; Cabeza, L.F. A comparative life cycle assessment (LCA) of different insulation materials for buildings in the continental Mediterranean climate. Energy Build. 2020, 225, 110323–110334. [Google Scholar] [CrossRef]
- Recupido, F.; Lama, G.C.; Ammendola, M.; Bossa, F.D.L.; Minigher, A.; Campaner, P.; Morena, A.G.; Tzanov, T.; Ornelas, M.; Barros, A.; et al. Rigid composite bio-based polyurethane foams: From synthesis to LCA analysis. Polymer 2023, 267, 125674–125684. [Google Scholar] [CrossRef]
- Wang, Y.; Rasheed, R.; Jiang, F.; Rizwan, A.; Javed, H.; Su, Y.; Riffat, S. Life cycle assessment of a novel biomass-based aerogel material for building insulation. J. Build. Eng. 2021, 44, 102988–103000. [Google Scholar] [CrossRef]
- Dowson, M.; Grogan, M.; Birks, T.; Harrison, D.; Craig, S. Streamlined life cycle assessment of transparent silica aerogel made by supercritical drying. Appl. Energy 2012, 97, 396–404. [Google Scholar] [CrossRef]
- Liu, Z.; Lyu, J.; Fang, D.; Zhang, X. Nanofibrous kevlar aerogel threads for thermal insulation in harsh environments. ACS Nano 2019, 13, 5703–5711. [Google Scholar] [CrossRef]
- Han, Y.; Zhang, X.; Wu, X.; Lu, C. Flame retardant, heat insulating cellulose aerogels from waste cotton fabrics by in situ formation of magnesium hydroxide nanoparticles in cellulose gel nanostructures. ACS Sustain. Chem. Eng. 2015, 3, 1853–1859. [Google Scholar] [CrossRef]
- Huber, L.; Zhao, S.; Malfait, W.J.; Vares, S.; Koebel, M.M. Fast and minimal-solvent production of superinsulating silica aerogel granulate. Angew. Chem. Int. Ed. 2017, 56, 4753–4756. [Google Scholar] [CrossRef] [PubMed]
- Carcassi, O.B.; Minotti, P.; Habert, G.; Paoletti, I.; Claude, S.; Pittau, F. Carbon footprint assessment of a novel bio-based composite for building insulation. Sustainability 2022, 14, 1384–1406. [Google Scholar] [CrossRef]
- Malchiodi, B.; Barbieri, L.; Lancellotti, I.; Pozzi, P. Char valorization into sustainable and performant polyurethane insulating panels. Macromol. Symp. 2022, 404, 2100333–2100335. [Google Scholar] [CrossRef]
- Park, J.S.; Kim, H.T.; Kim, J.D.; Kim, J.H.; Kim, S.K.; Lee, J.M. Eco-friendly blowing agent, HCFO-1233zd, for the synthesis of polyurethane foam as cryogenic insulation. J. Appl. Polym. Sci. 2022, 139, 51492–51505. [Google Scholar] [CrossRef]
- Guolo, E.; Cappelletti, F.; Romagnoni, P.; Raggiotto, F. Environmental impacts for polyurethane panels. In E3S Web of Conferences; EDP Sciences: Leith, France, 2019; Volume 111, p. 03063. [Google Scholar] [CrossRef]
- ISO 14040:2006; Environmental Management-Life Cycle Assessment-Principles and Framework. International Organization for Standardization: Geneva, Switzerland, 2006.
- ISO 14044:2006; Environmental Management-Life Cycle Assessment-Requirements and Guidelines. International Organization for Standardization: Geneva, Switzerland, 2006.
- Pinilla-Peñalver, E.; Cantero, D.; Romero, A.; Sanchez-Silva, L. Exploring the impact of the synthesis variables involved in the polyurethane aerogels-like materials design. Gels 2024, 10, 209–225. [Google Scholar] [CrossRef]
- Guinée, J.B. Handbook on Life Cycle Assessment: Operational Guide to the ISO Standards; Springer Science & Business Media: Berlin, Germany, 2002. [Google Scholar]
- Füchsl, S.; Rheude, F.; Röder, H. Life cycle assessment (LCA) of thermal insulation materials: A critical review. Clean. Mater. 2022, 5, 100119–100132. [Google Scholar] [CrossRef]
Disclaimer/Publisher’s Note: The statements, opinions and data contained in all publications are solely those of the individual author(s) and contributor(s) and not of MDPI and/or the editor(s). MDPI and/or the editor(s) disclaim responsibility for any injury to people or property resulting from any ideas, methods, instructions or products referred to in the content. |
© 2024 by the authors. Licensee MDPI, Basel, Switzerland. This article is an open access article distributed under the terms and conditions of the Creative Commons Attribution (CC BY) license (https://creativecommons.org/licenses/by/4.0/).

