

Changes in the Active Drainage Network and Their Impact on the Hydrological Response and Flood Risk Management Process: A Case Study for a Flysch Mountain Catchment


Abstract
1. Introduction
2. Materials and Methods
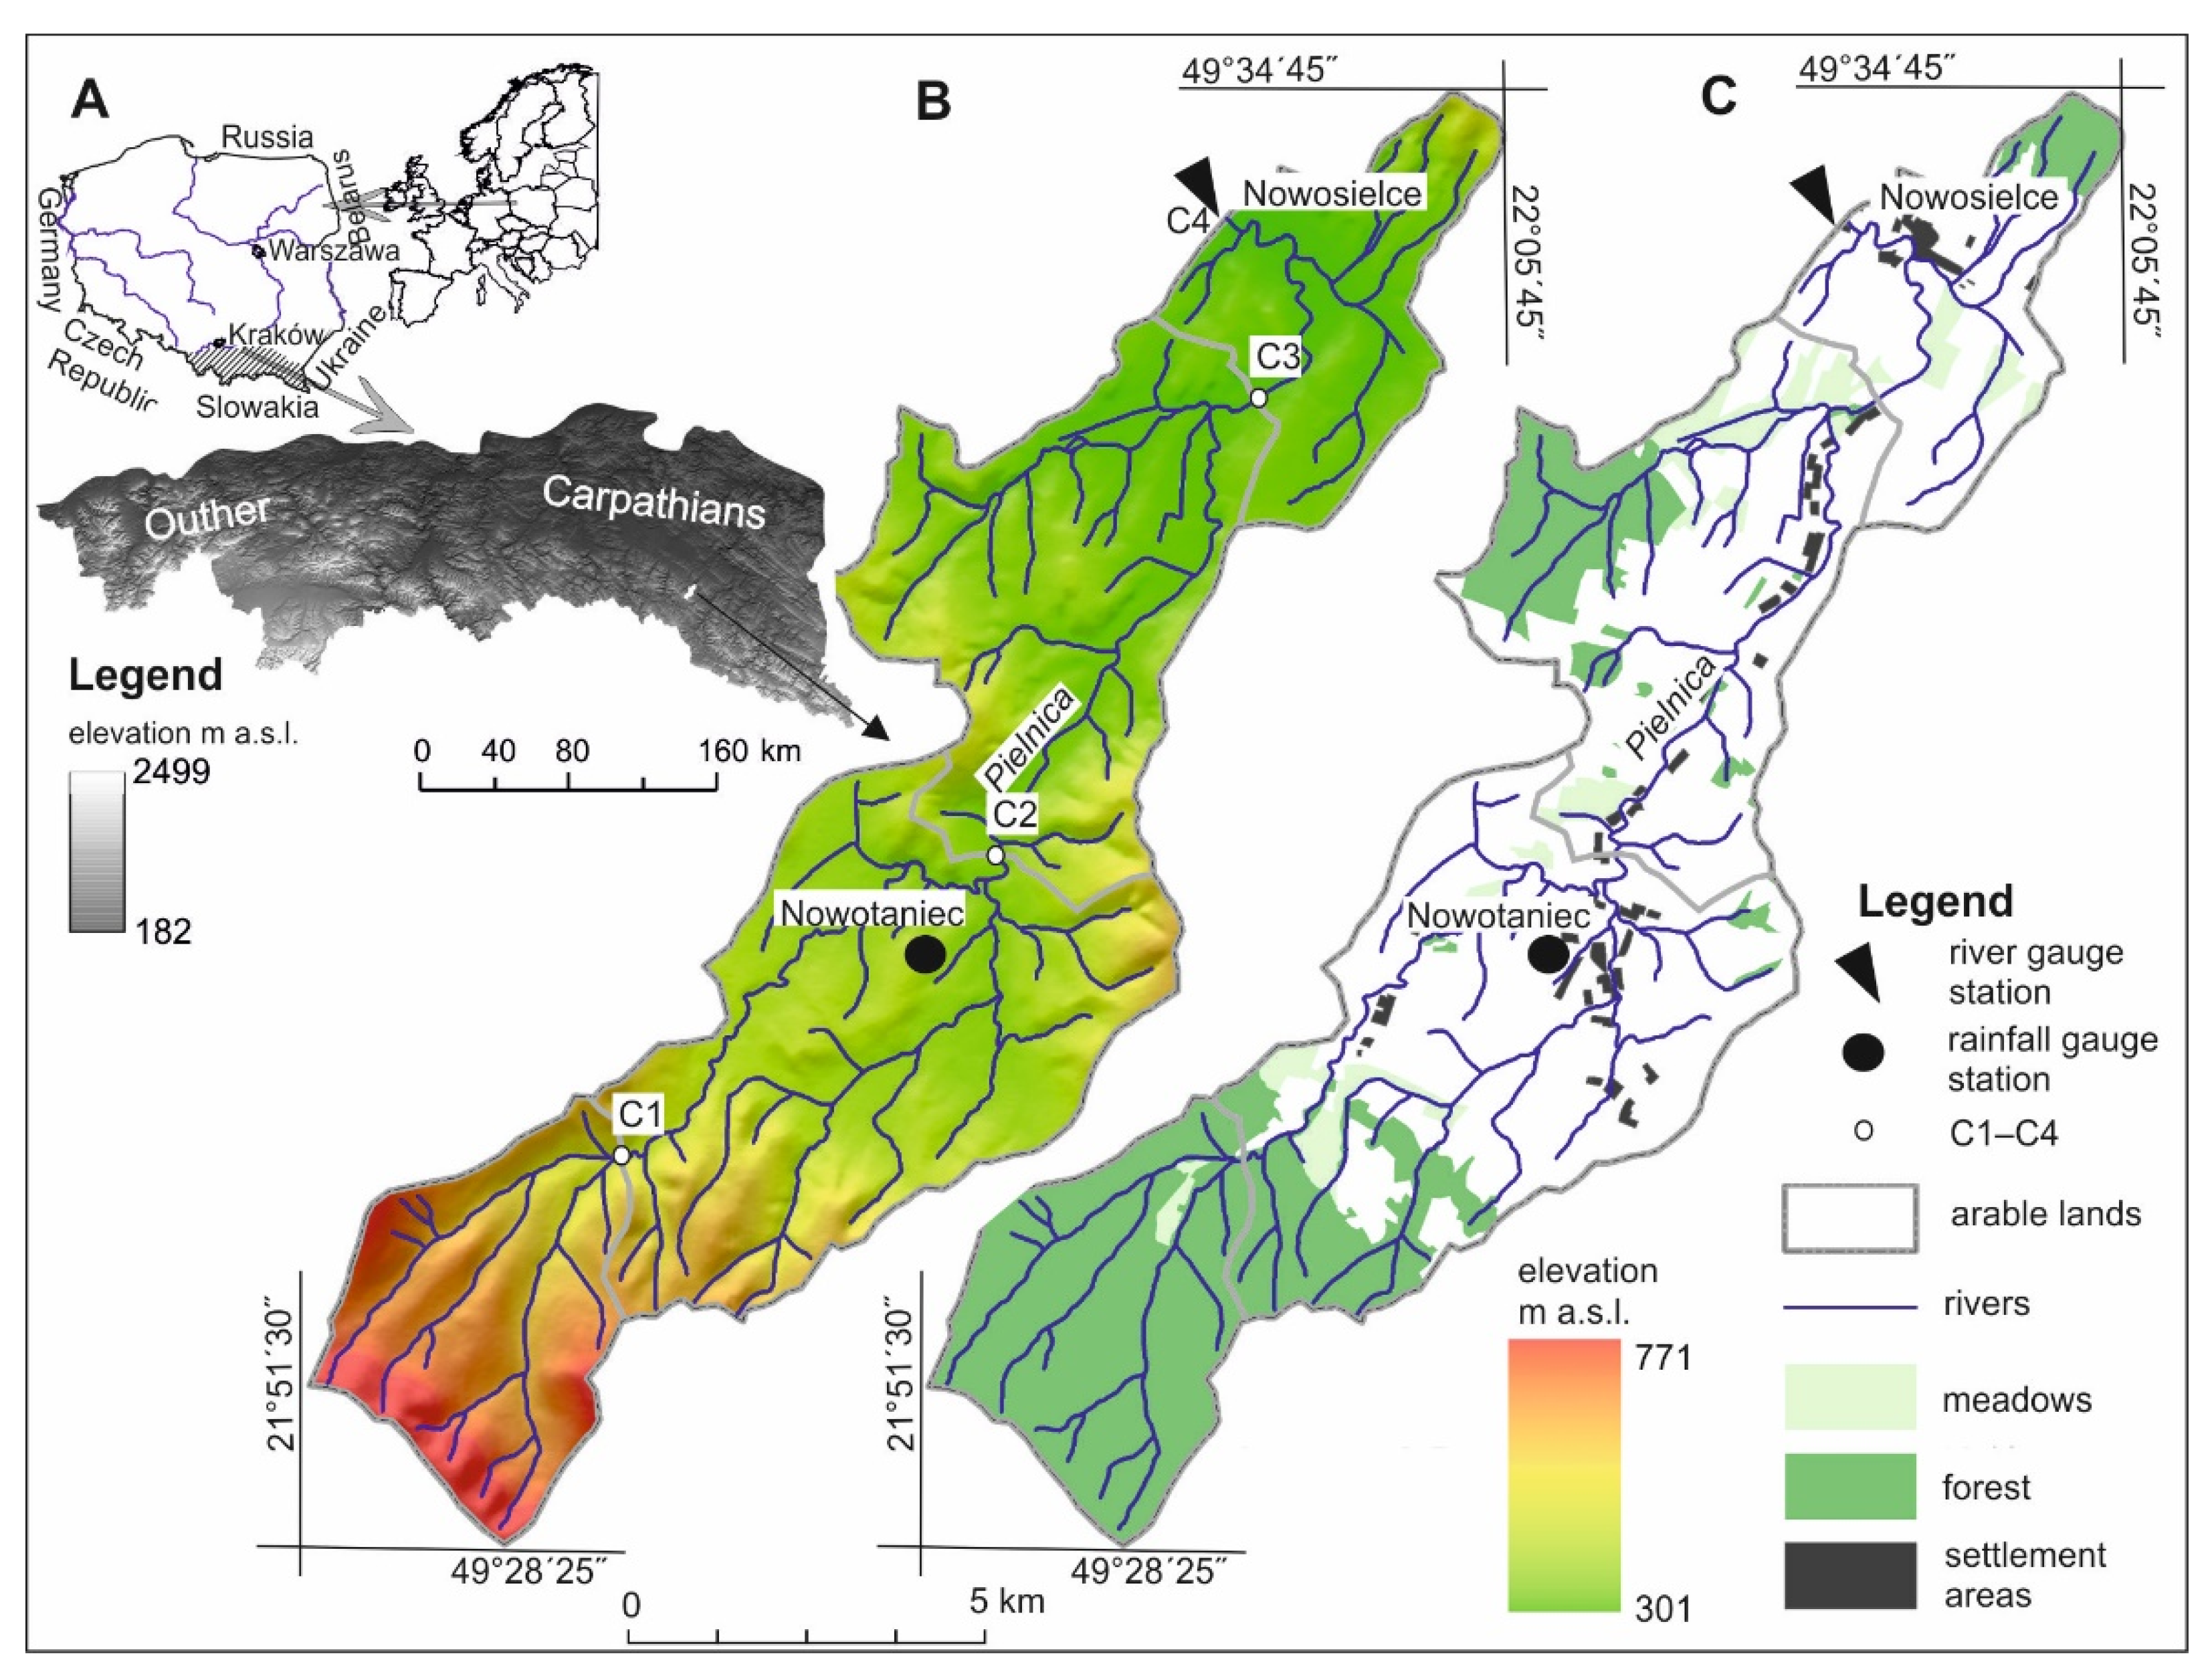
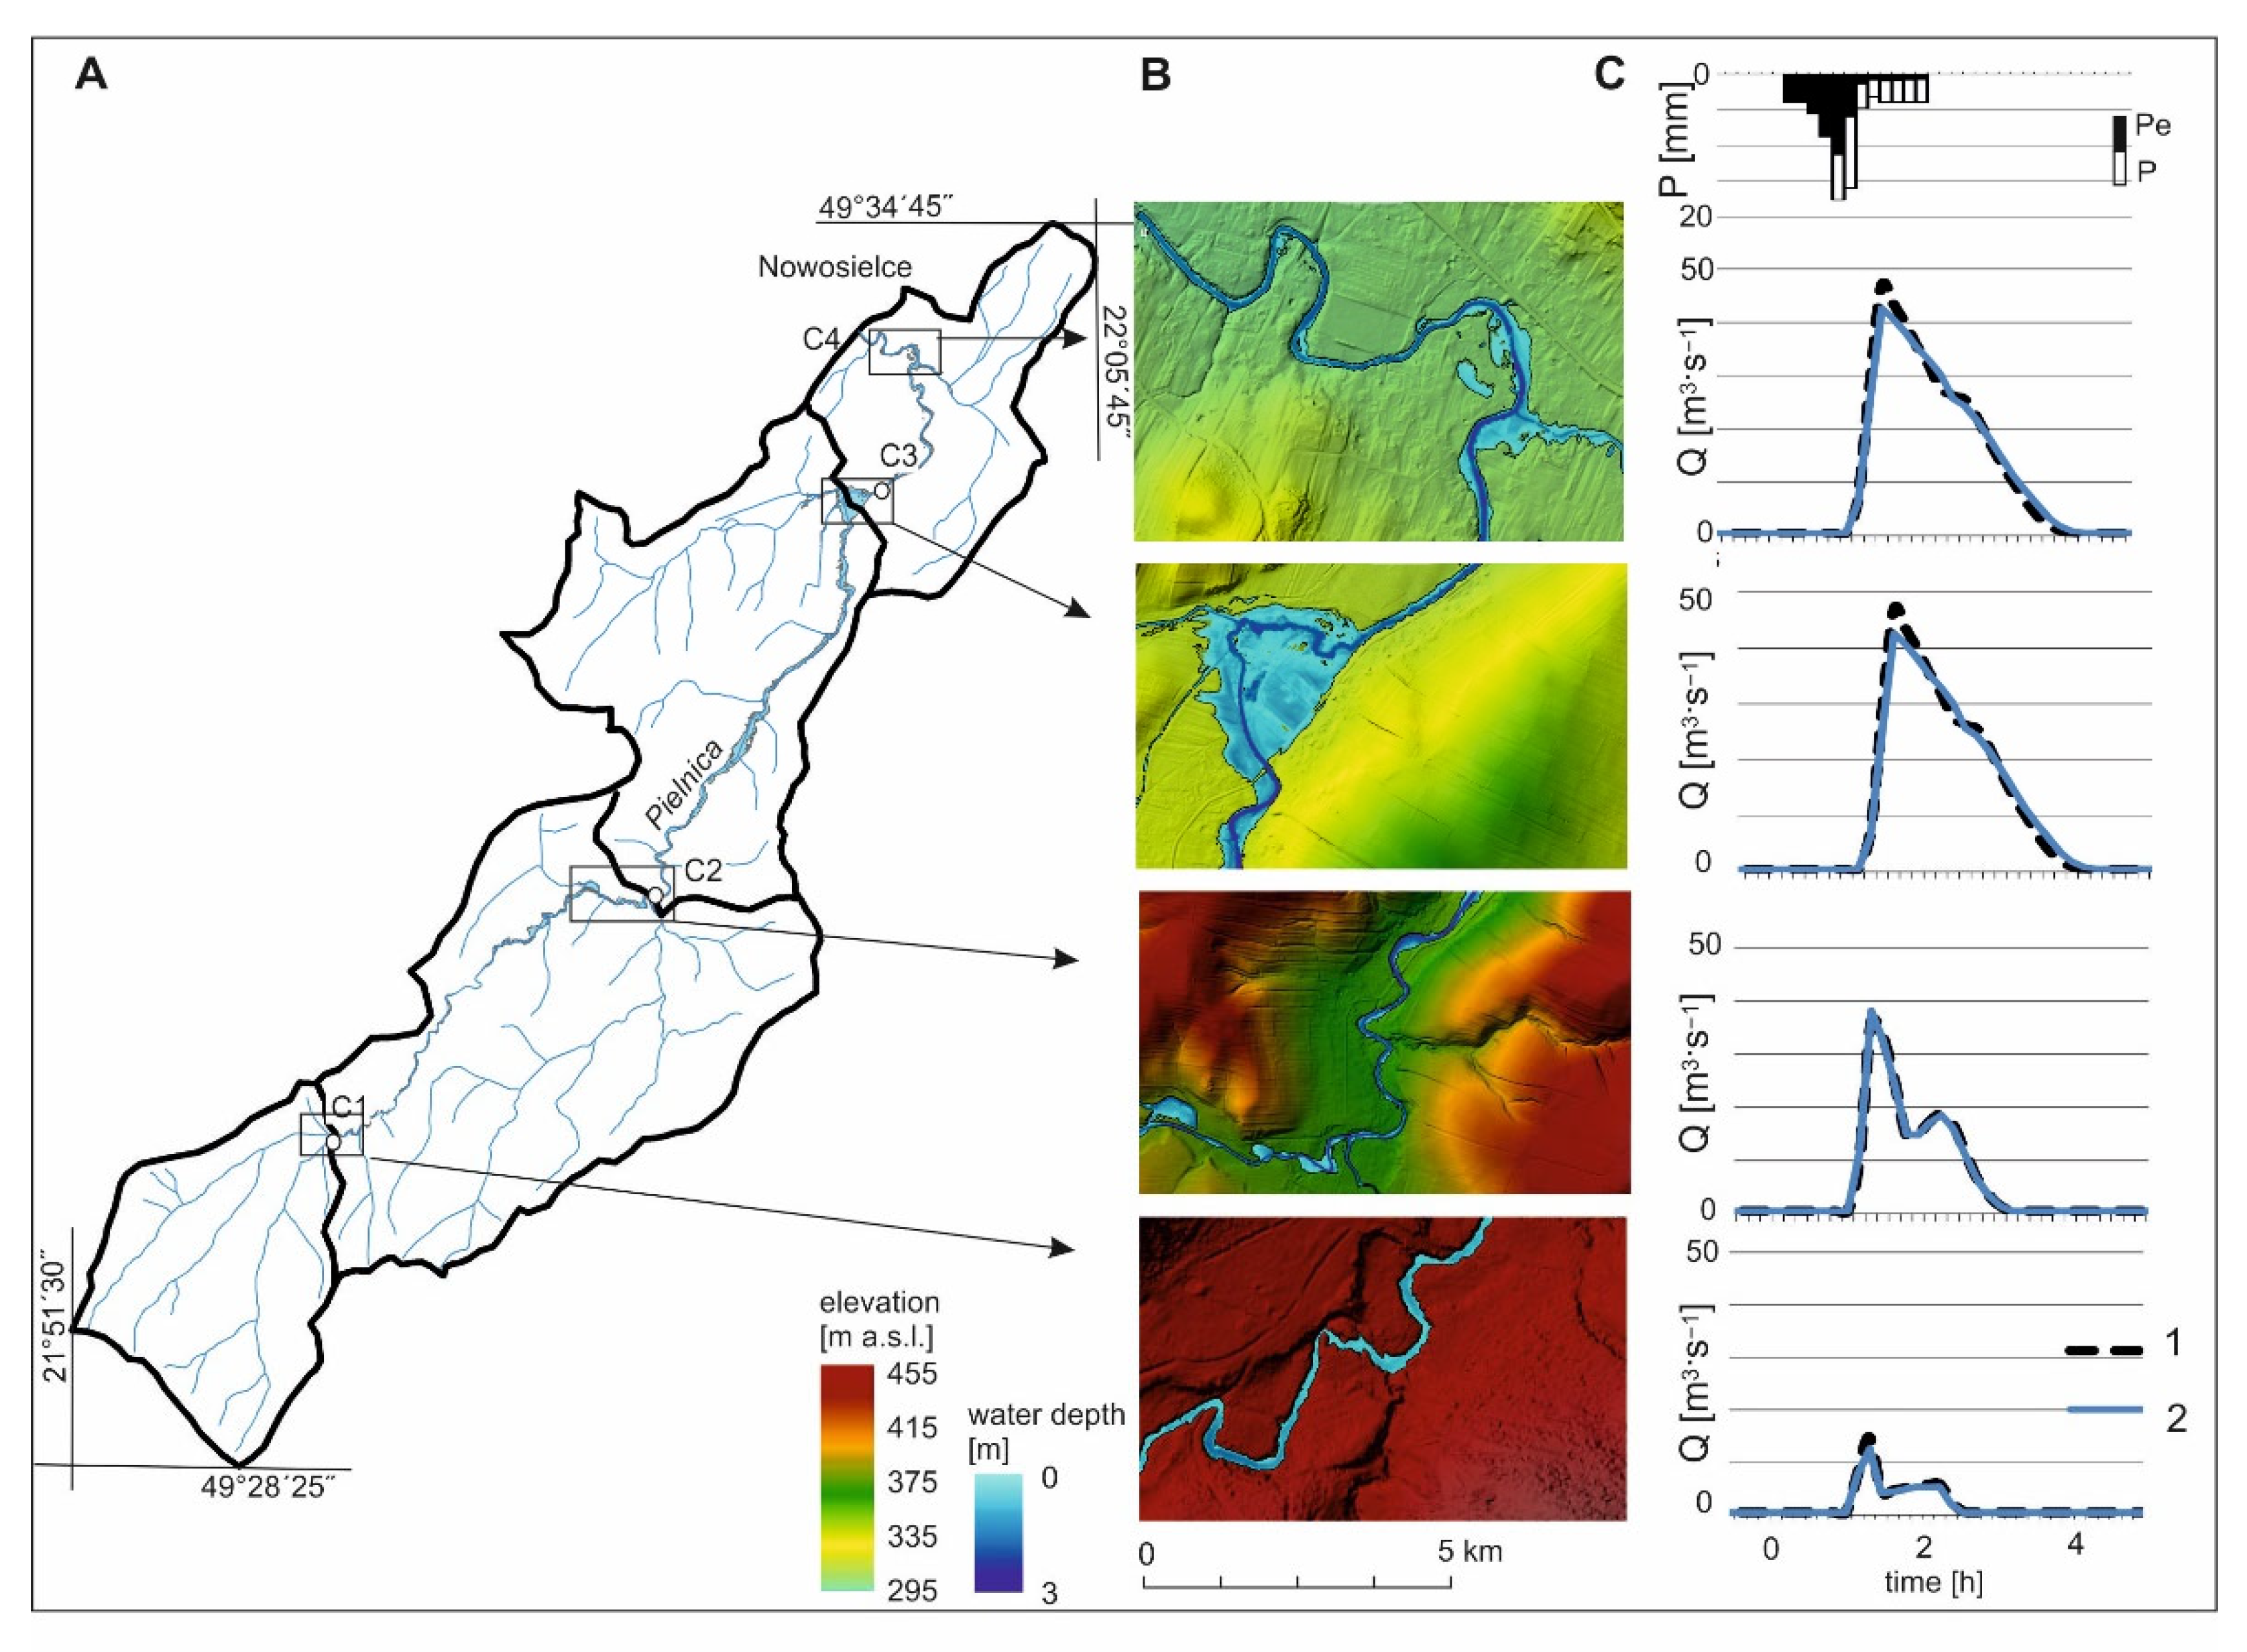
2.1. Study Area
2.2. Reconstruction and Characterization of the ADN Operating during Heavy Rainfall
- (1)
- Developing a high-resolution (0.5 × 0.5 m) digital elevation model (DEM) to enable detection of natural and man-made incisions, which differed in terms of their type and size (e.g., concavities/incisions resulting from relief, paved/unpaved roads, ditches, plough furrows, etc.). The DEM was developed based on ALS-LiDAR data (ground layer). The density of points was 4–6 pct·m−2, and vertical errors were up to 0.15 m.
- (2)
- Pre-processing the DEM and adapting it for hydrological analysis. The DEM, created from LiDAR data, reflects a “real” terrain surface. This means that bridges, culverts, footbridges, etc., which normally allow water to flow through them, are reflected as “artificial dams” disturbing the natural gravity flow. In order to create the ADN, which is similar to a drainage network functioning in real conditions, the DEM must be hydrologically correct. The bridges, culverts, and footbridges were “burned” using a typical algorithm implemented in GIS software according to the procedure presented by Bryndal and Kroczak [40].
- (3)
- Delineating streams. The streams were generated using a typical procedure implemented in GIS software. The D8 algorithm was selected for the flow accumulation procedure. The streams were identified using the head channel areas (Table 2) calculated for models of catchments contributing to first-order stream development, according to the methodology proposed by Bryndal and Kroczak [40].
2.3. Evaluation of the Influence of Human-Induced Changes in the ADN on Flood Wave Parameters
2.3.1. Selection of the Hydrological Model
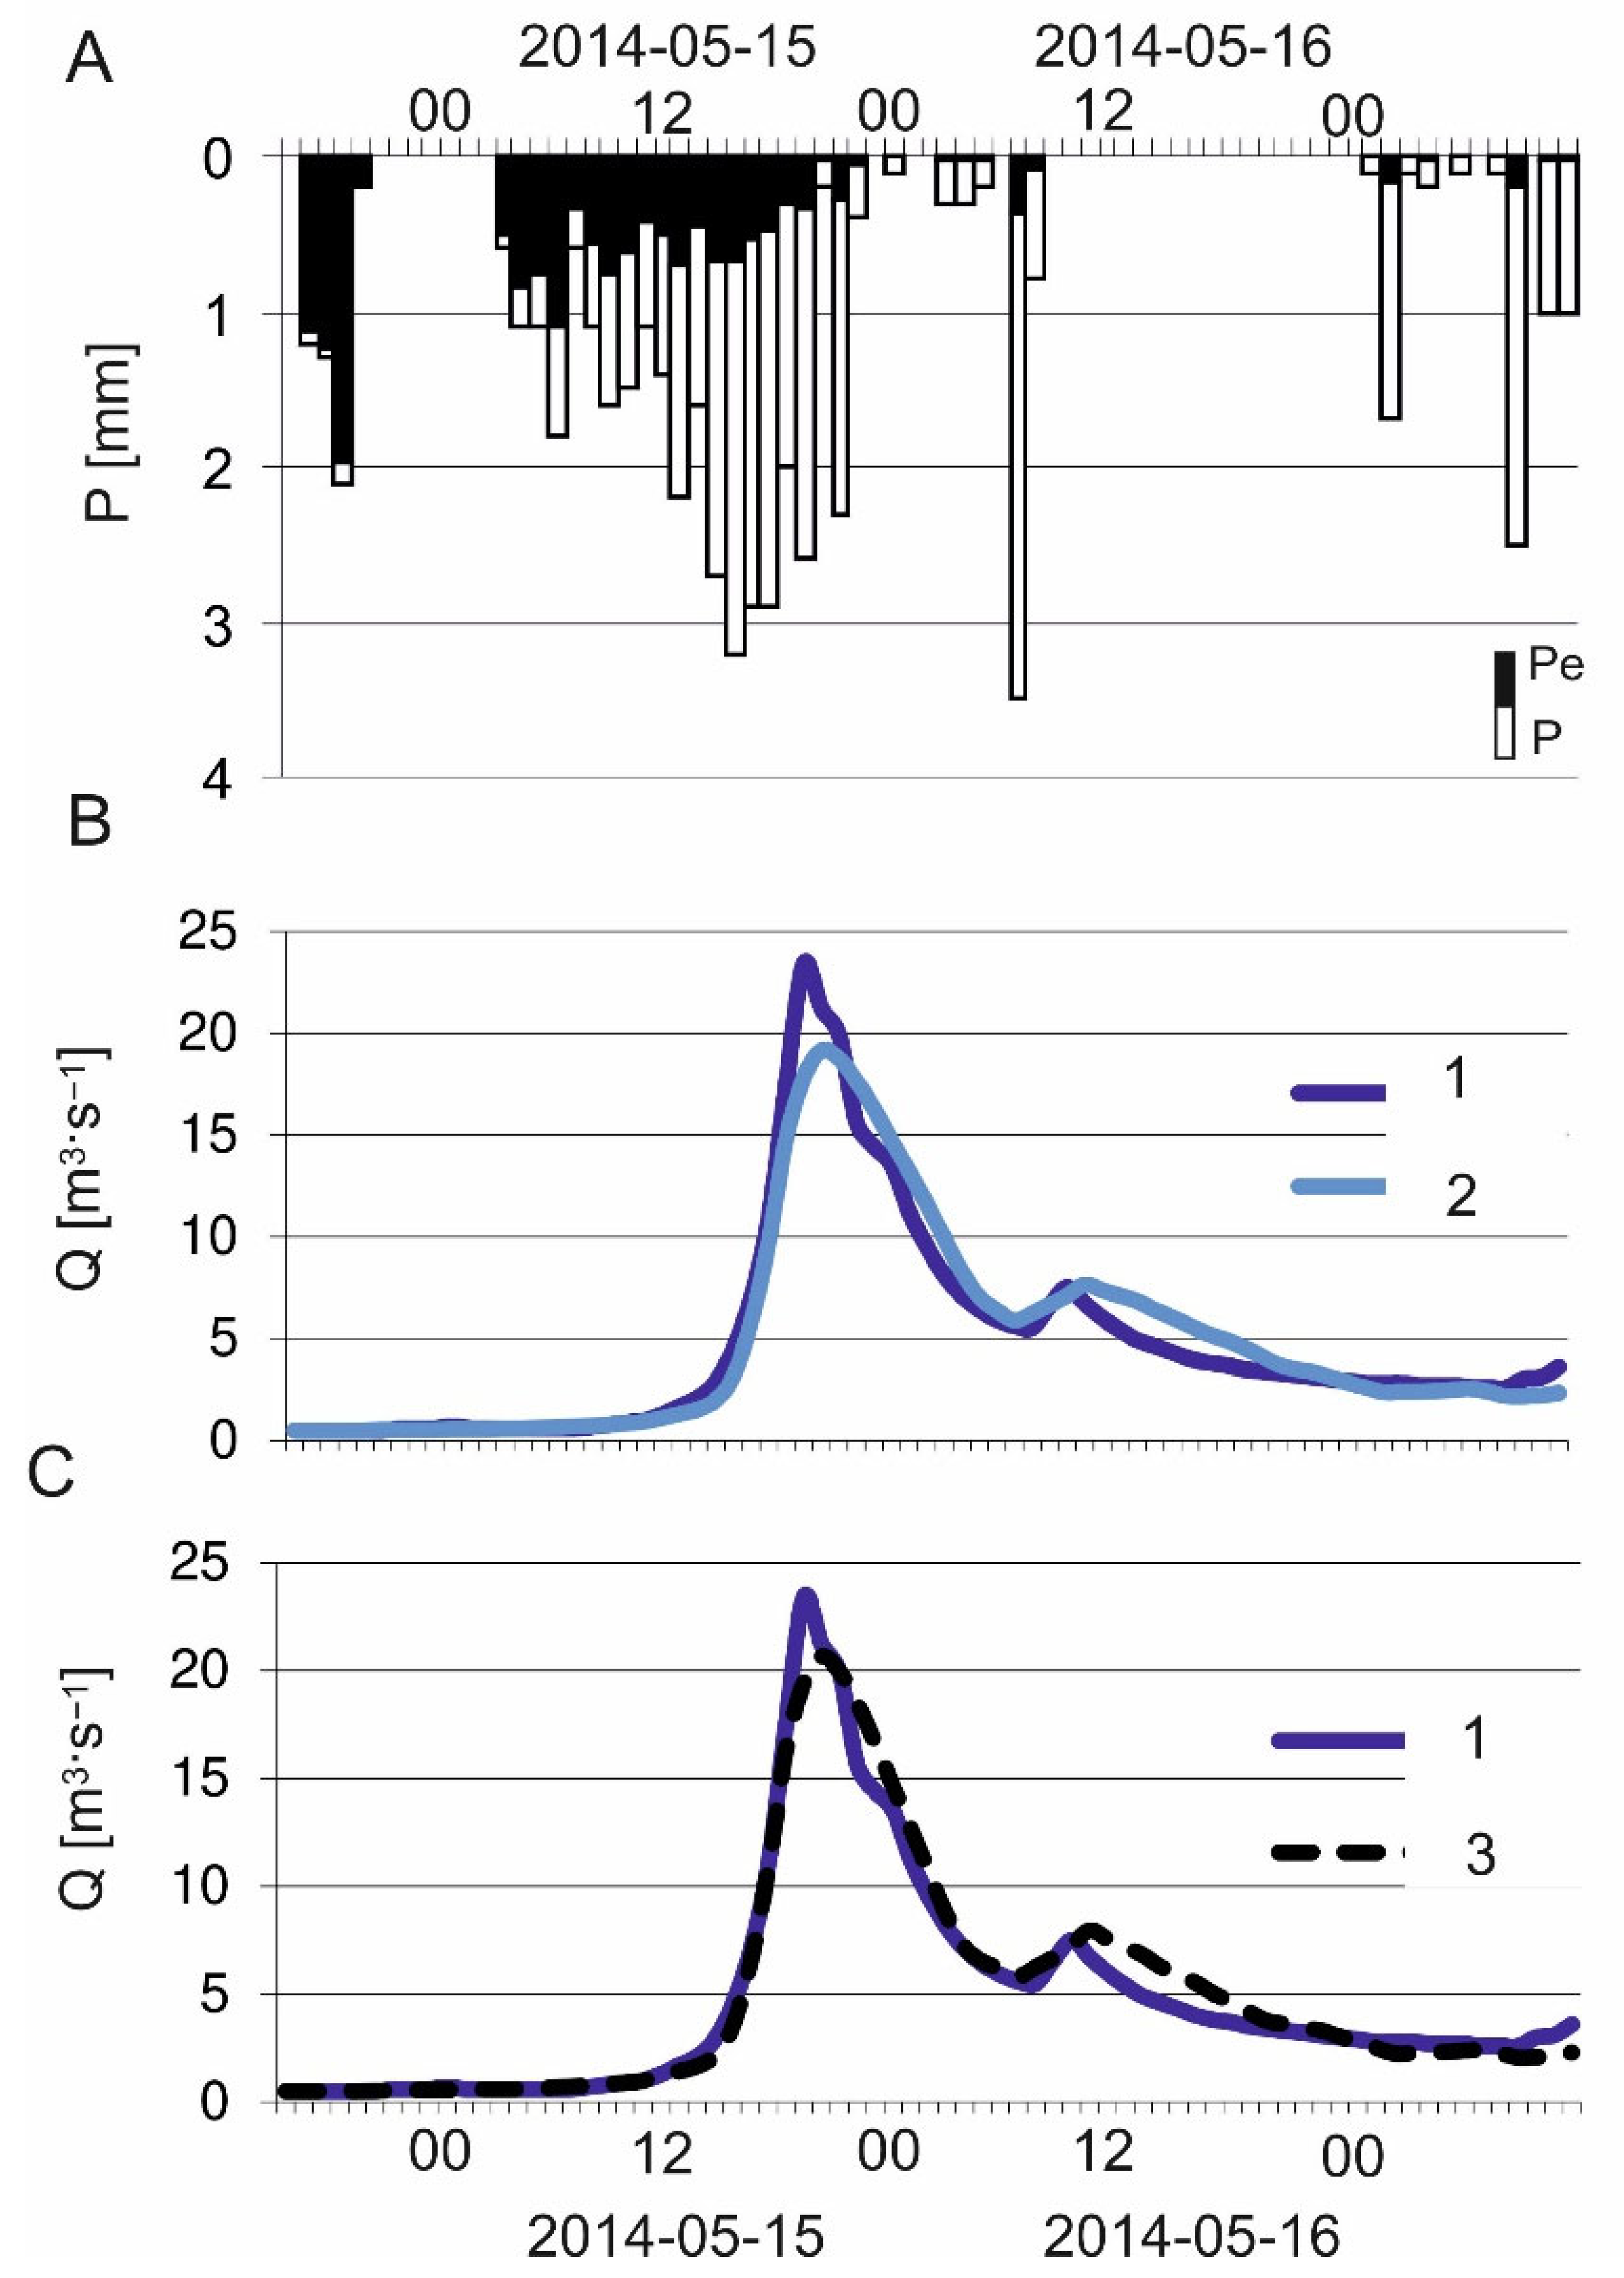
2.3.2. Testing and Evaluation Stages
2.4. Evaluation of Changes in a Flood Hazard Zone Extension Conditioned by Human-Induced Changes in the ADN
3. Results
3.1. Changes in the Active Drainage Network

| Natural-Origin Elements | Human-Origin Elements | |||
|---|---|---|---|---|
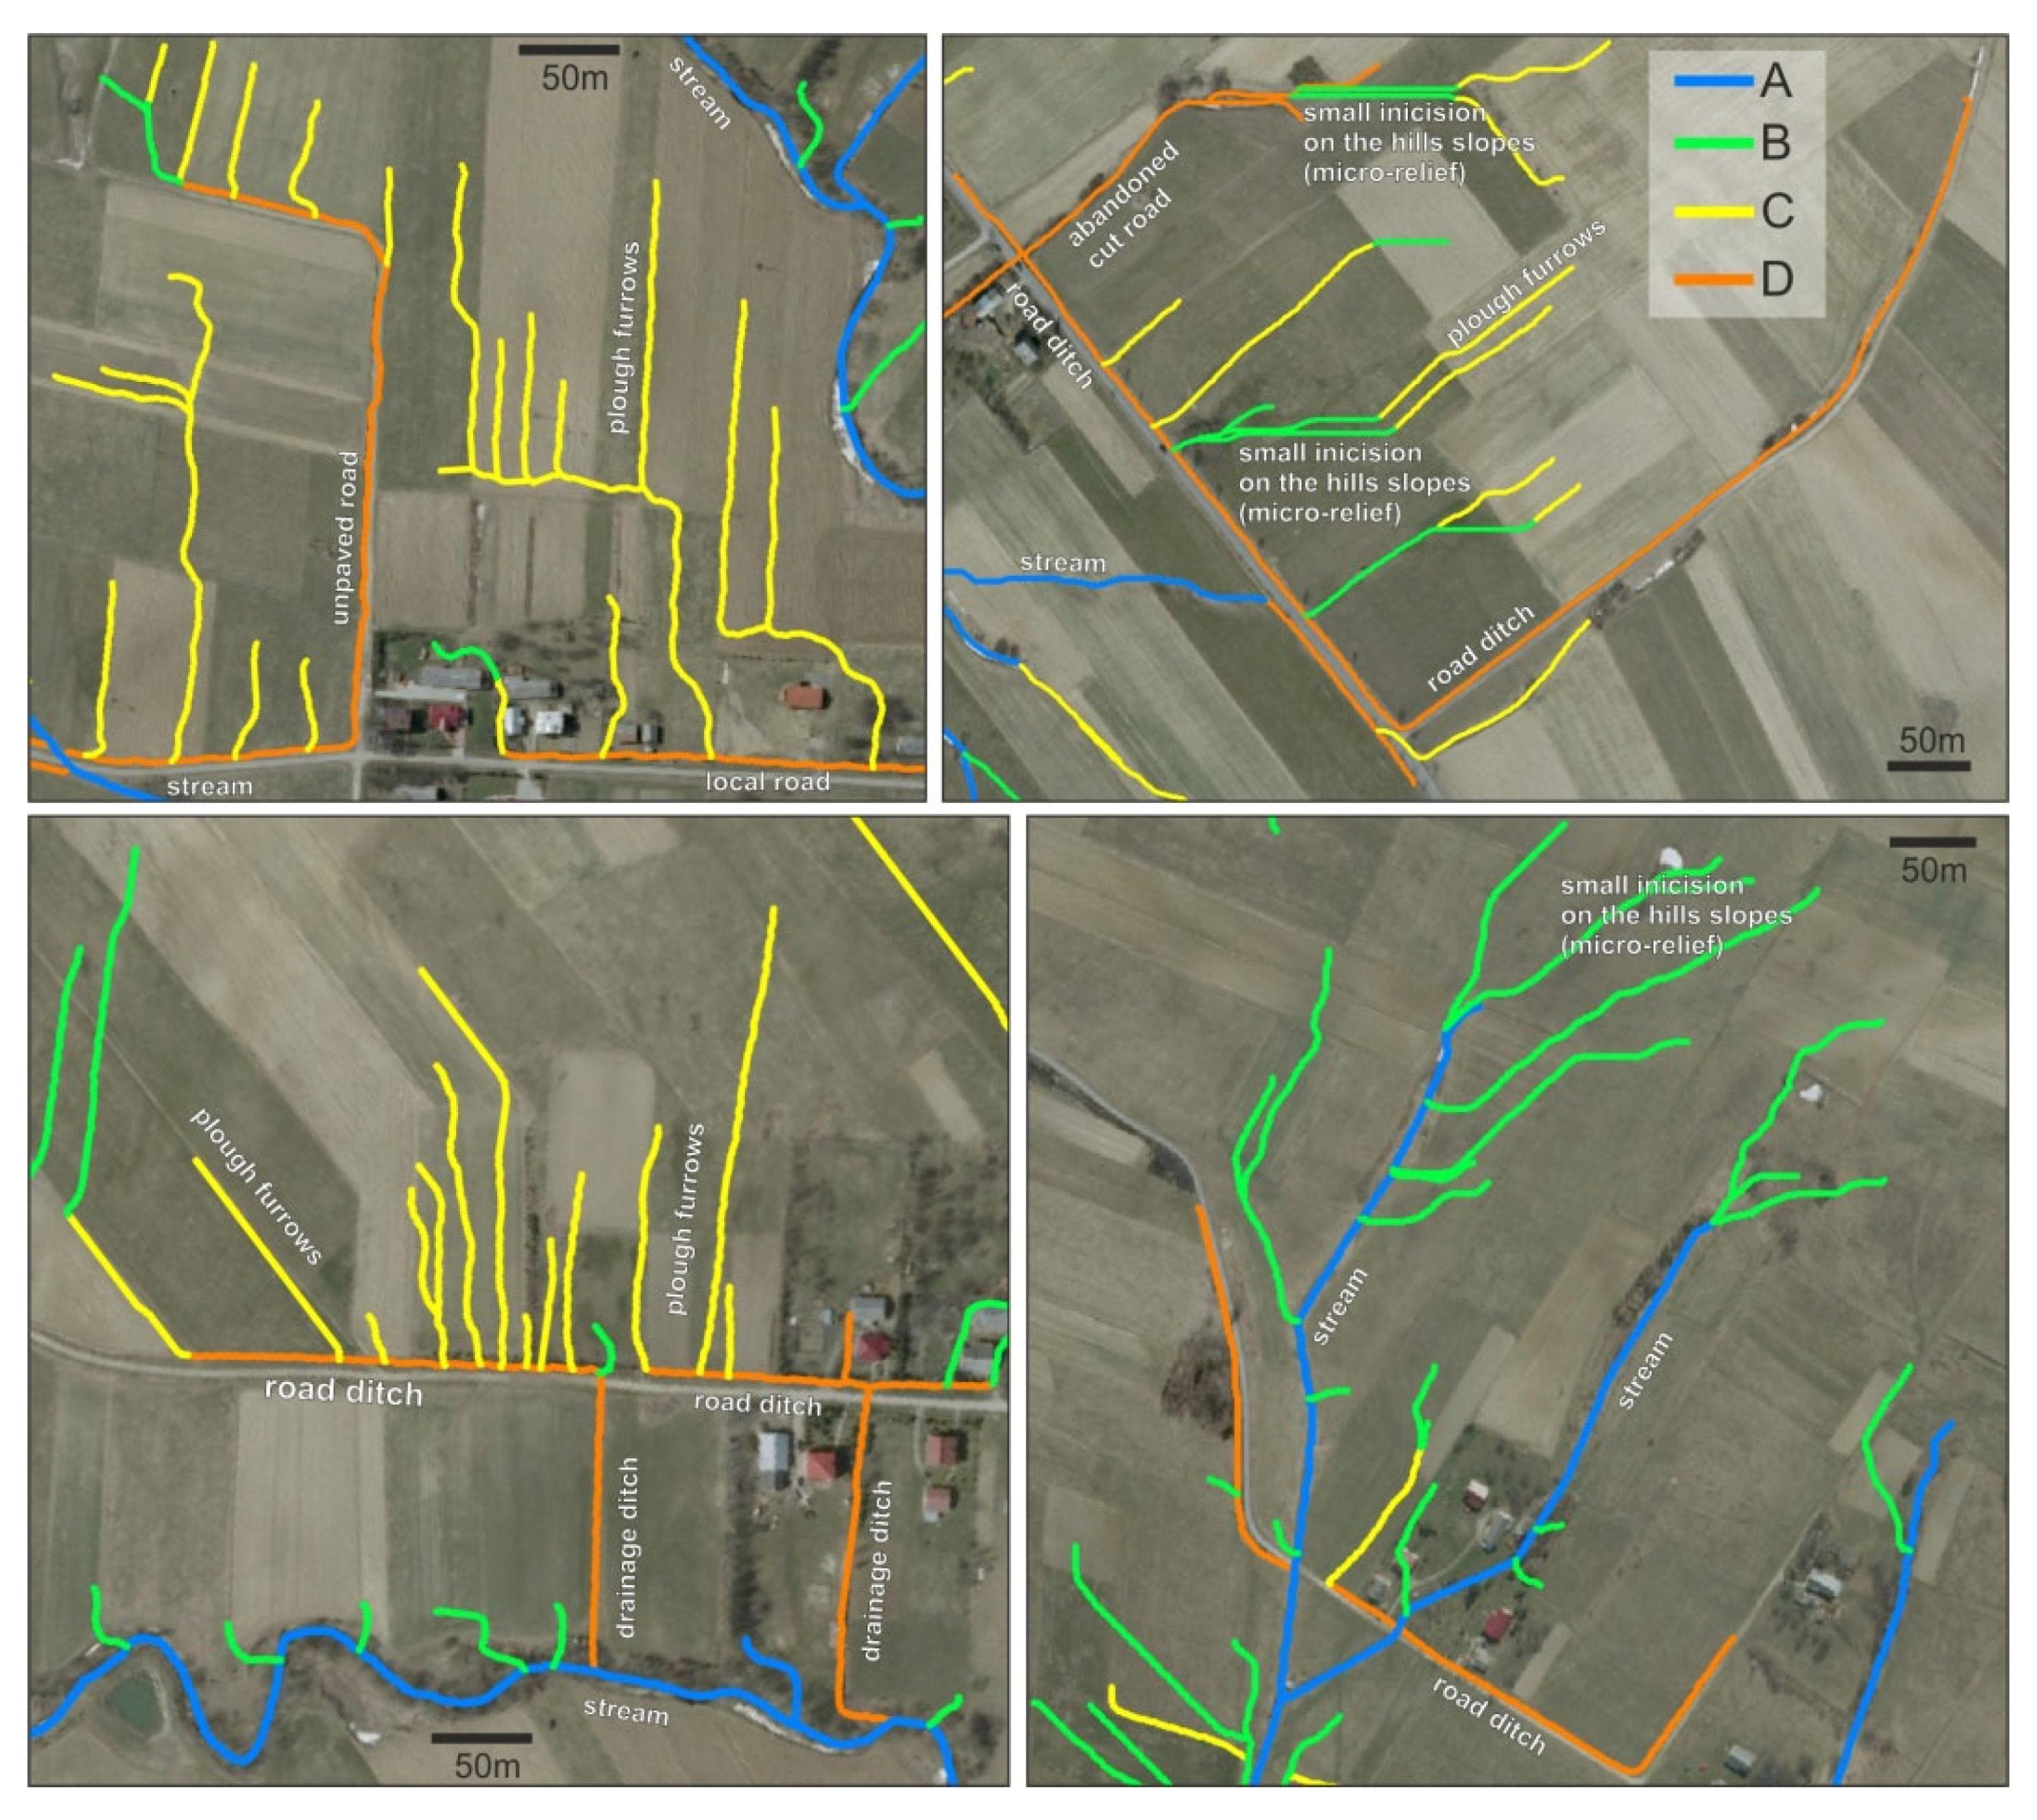
| Sub-Catchment | Rivers and Smaller Lateral Valleys (Figure 4 sig. A) | Flow lines Conditioned by Micro-Relief (Figure 4 sig. B) | Plough Furrows, Unpaved Rural Roads (Figure 4 sig. C) | Paved Roads and Ditches (Figure 4 sig. D) |
| Catchment 1 | 92.4 | - | - | 7.6 |
| Catchment 2 | 37.5 | 26.9 | 20.4 | 15.2 |
| Catchment 3 | 33.8 | 33.4 | 17.9 | 14.9 |
| Catchment 4 | 30.2 | 34.9 | 20 | 14.9 |

3.2. Changes in ADN vs. Hydrological Response of a Catchment and Flood Hazard Zone
3.2.1. Changes in the ADN and Their Influence on Flood Wave Parameters
3.2.2. Changes in Flood Wave Parameters and Their Influence on Flood Hazard Zone Extension
4. Discussion
4.1. Changes in the ADN
4.2. Changes in an ADN and Their Influence on Hydrological Response and Flood Risk Management in a Catchment
4.3. Importance of the Results, Limitations of the Study, and Further Research
- (1)
- A detailed analysis of changes in an ADN gives new insight into the field of catchment hydrology, showing general and internal structural changes in the ADN and the role of human-induced elements in those changes. The easy accessibility of high-resolution data allowing the reconstruction of surface terrain and GIS-supported analysis gives new opportunities for investigation in this research field. It is worth emphasizing that changes in ADNs, apart from the hydrological response and the consequences (presented in this study), also influence many aspects of catchment functioning, including relief transformation, sediment delivery, the intensity of erosion/denudation processes, etc. The author hopes that this research will attract the attention of other researchers and that more studies will be conducted to recognize how changes in ADNs influence catchment functioning.
- (2)
- The results of this study are comparable to those obtained in other small experimental catchments [60,61] in terms of the hydrological response. This suggests that the influence of a modified ADN on hydrological response (increased Qmax) may be comparable in small catchments (up to several km2 in area), and the combination of two simple, well-known models in the scientific community, SCS-CN and GIUH, allows the assessment of the dynamic nature of changes in an ADN. The second conclusion confirms the usefulness of those hydrological tools for further studies in this subject area.
- (3)
- Taking into account the practical importance of the results, this case study reveals that a significant alteration in an ADN can moderately influence flood hazard zone extension. On the one hand, this may suggest that using the GIUH model in its “traditional” form (with the natural river network serving as input data for RB, RL, and RA calculations) gives acceptable results in terms of flood hazard zone delineation. On the other hand, it is worth remembering that flood hazard zone dimensions are conditioned by the river channel and the valley floor relief. The low influence of the modified ADN on the 1% flood hazard area revealed in this study resulted from the large retention capacity of the river channel/river valley floor (deeply incised channel and terraced valley in the study area), resulting from paleogeographical circumstances [29]. In this case, where the channel/valley floor retention capacity is lower, the influence of the modified ADN on the 1% flood hazard area may be more noticeable and have a greater effect on flood hazard/risk assessment. Therefore, more studies are needed in order to expand our knowledge in this research field and draw conclusions that may be important for practitioners, with insights into p-probable flood hazard zone delineation in small ungagged catchments and its influence on flood hazard/risk management.
5. Conclusions
- (1)
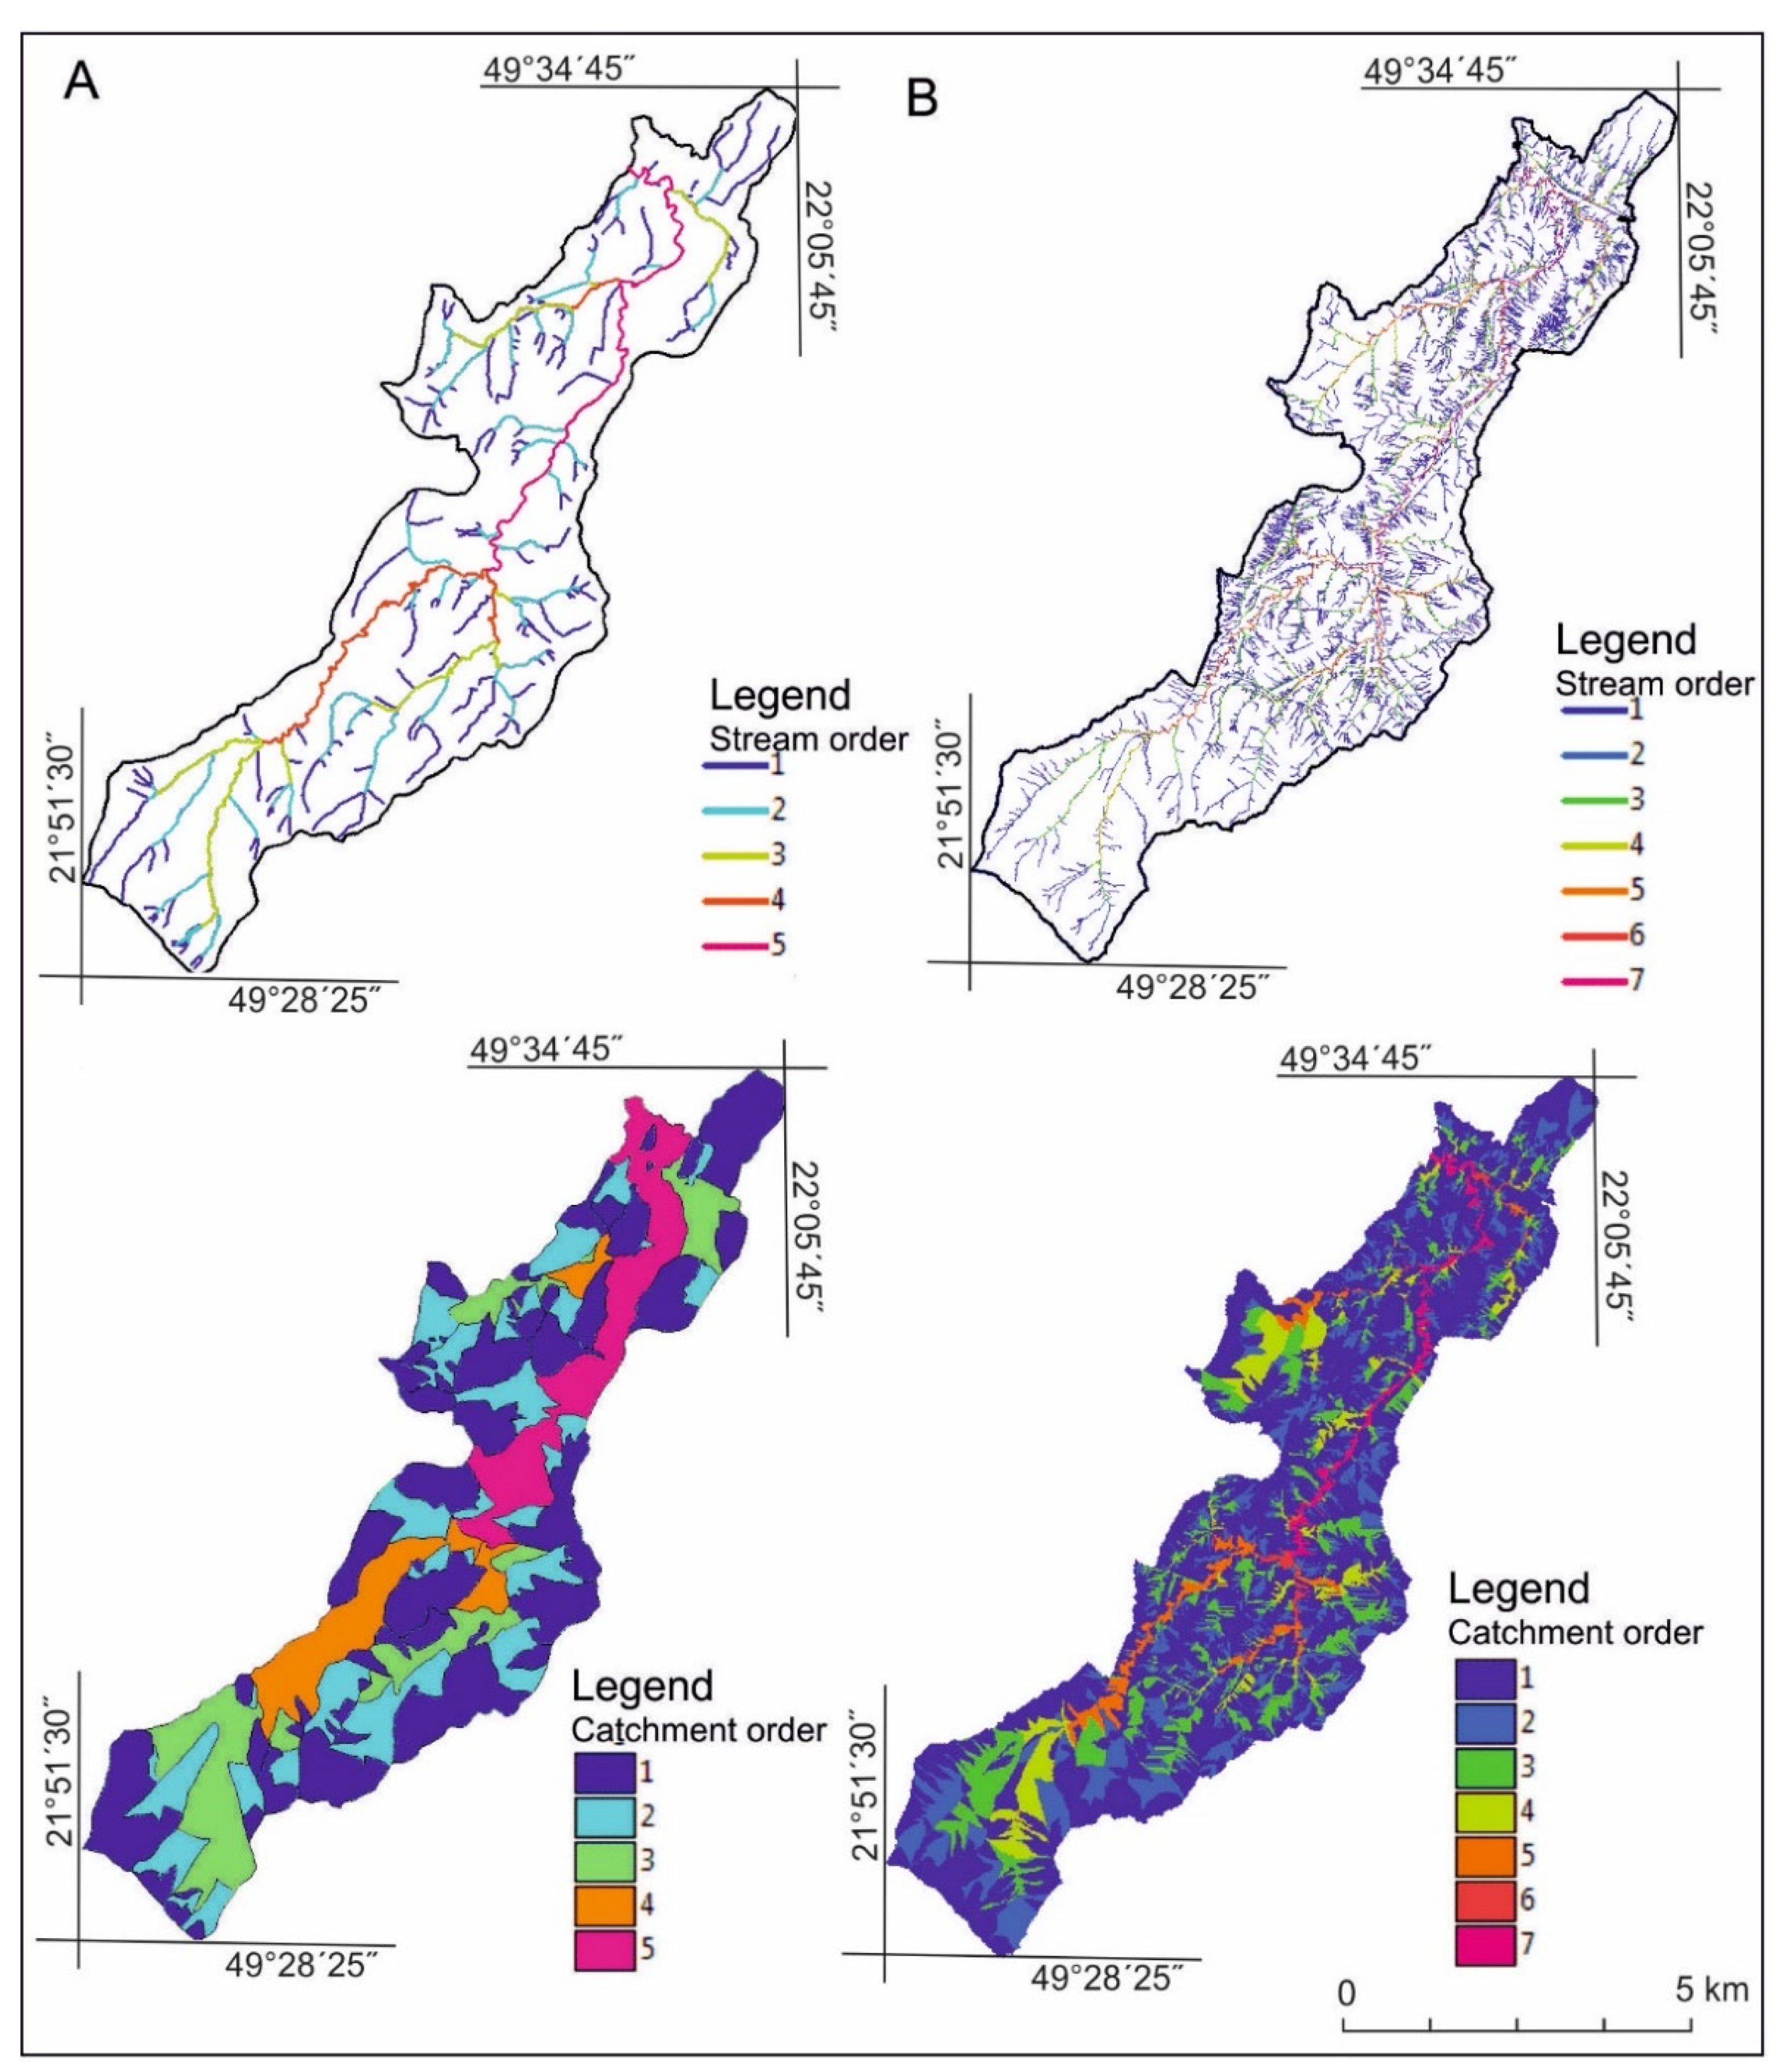
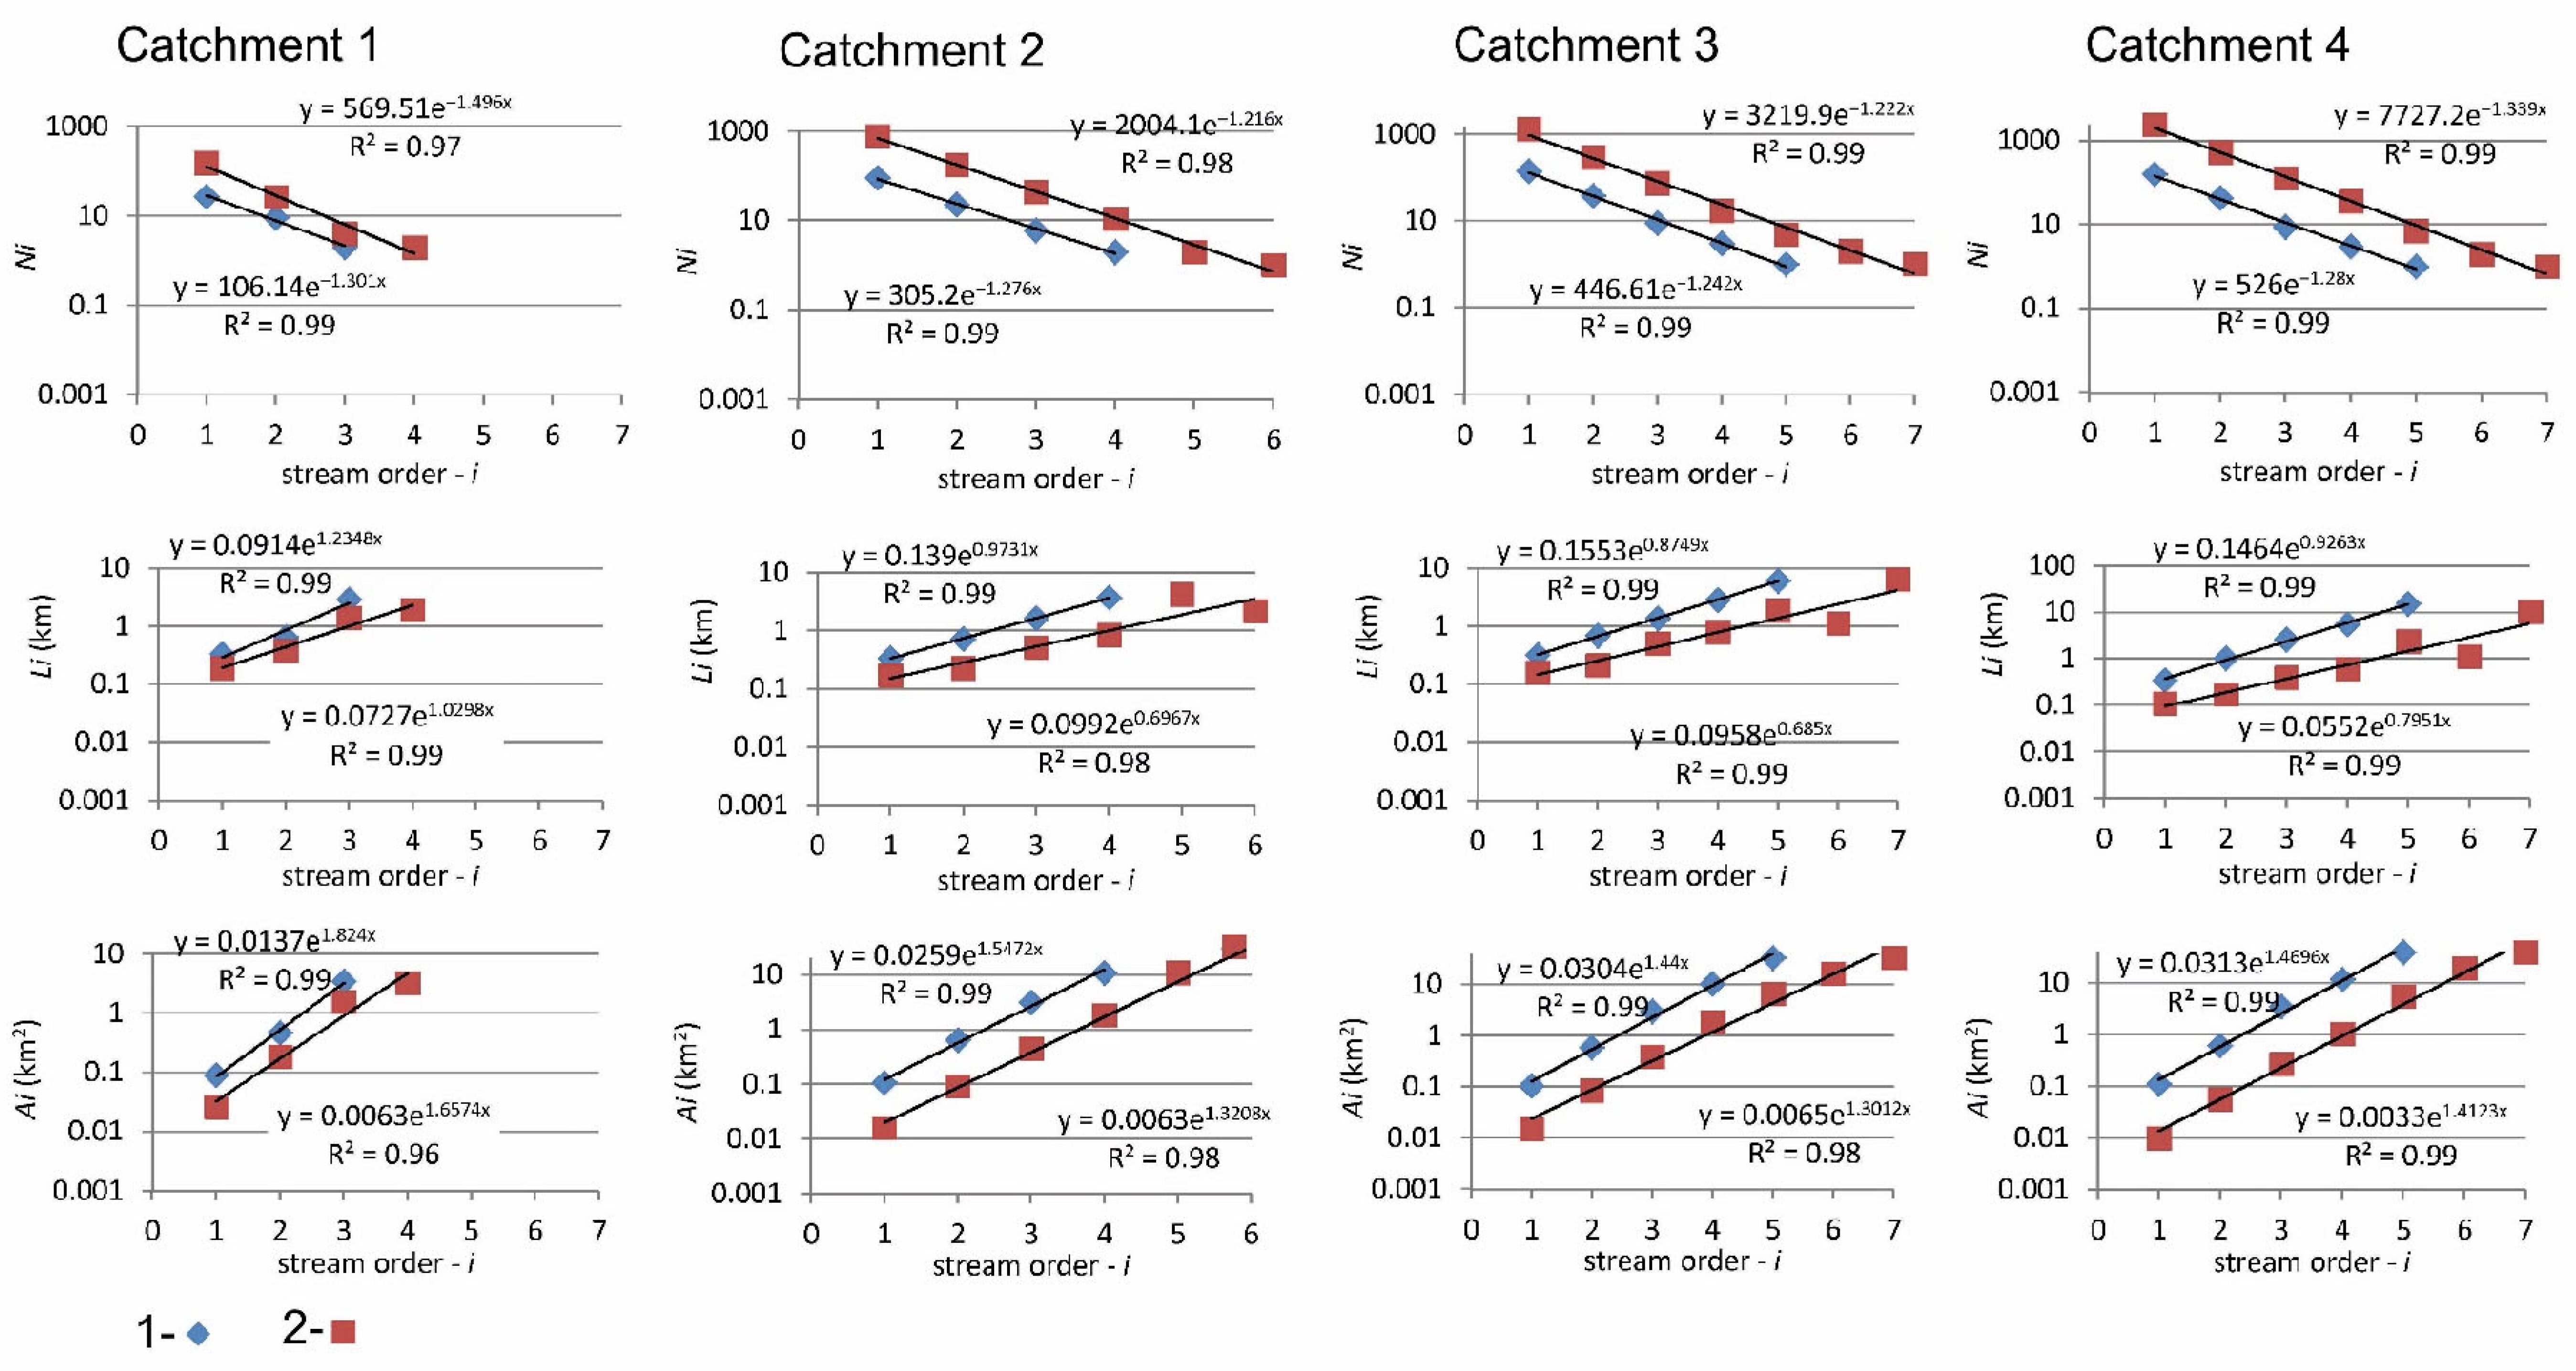
- The ADN operating during heavy rainfall in the Pielnica catchment was several times better developed than the river system (2.9 vs. 11.4 km·km−2), and man-made incisions may contribute up to one-third of the ADN. Changes were also observed in the structure of the ADN, related to (a) an increase in the maximum stream order (by one to two orders), (b) an increase in the number of i-order streams (especially first- to third-order streams draining slopes; by 7–15 times); and (c) a decrease in the mean length of streams (2–9 times) and the mean area drained by i-order streams (2–10 times).
- (2)
- Changes in the ADN caused better drainage of hillslopes and catchment, which was reflected in the hydrological response of the catchment. Assessing these changes using the SCS-SN and GIUH models, in which the dynamic nature of the ADN was reflected in changes in the Horton and Schumm parameters, revealed the following:
- (a)
- The differences between simulated and observed maximum peak flow were smaller when the RB, RL, and RA ratios described a real ADN operating during heavy rainfall, not only the river network, which is a typical approach in practice. It can be concluded that characterizing a real ADN by Horton’s ratio improves the model simulation of flash flood wave parameters in small catchments.
- (b)
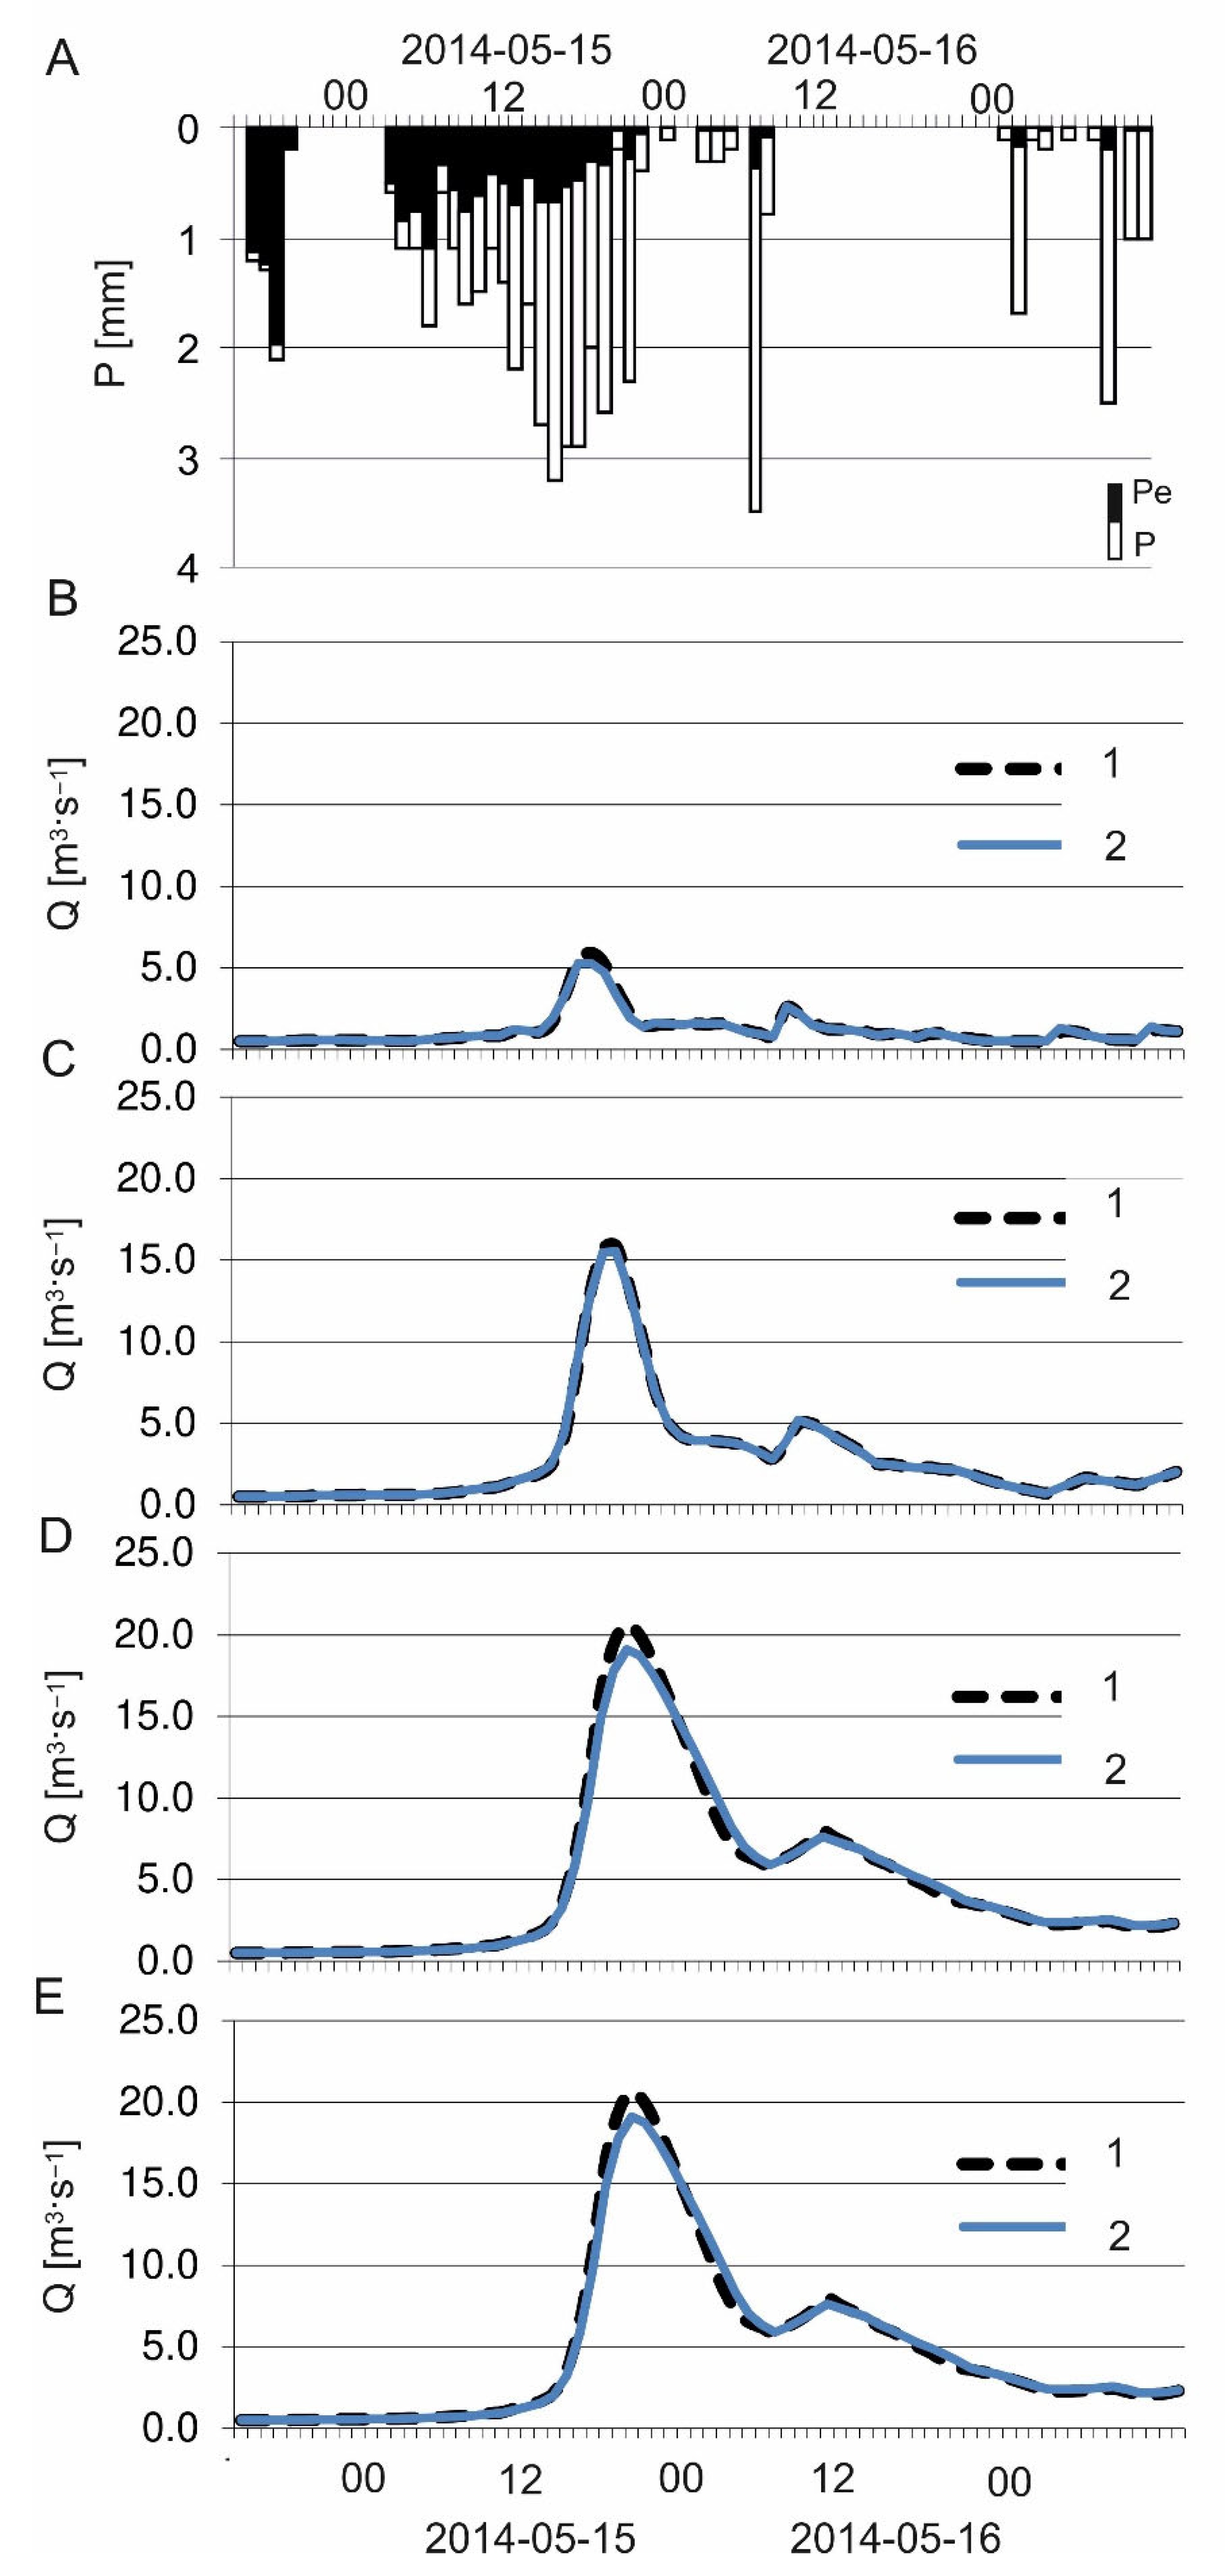
- Changes in the ADN were reflected predominantly in increased peak flow and were within the range of 2 to 7%. This range may be interpreted as a surrogate measure of how changes in an ADN affect the hydrological response of a catchment.
- (3)
- Accurate reconstruction/simulation of flood wave parameters is important for flood hazard zone delineation, the most important element in flood risk assessment and management in a catchment. The delineation of a 1% probable flood inundation area, which is of special interest for flood risk management, revealed that changes in the flood hydrograph resulting from changes in the ADN moderately affected the flood hazard zone (about 5%). It seems that significant changes in an ADN have rather a low impact on flood hazard/risk assessment and management.
- (4)
- This study presents changes in an ADN and its consequences, taking into account (a) the hydrological response of a catchment and (b) the impact on flood hazard assessment and consequently the flood risk management process. These aspects, as a “chain of linkages”, are still not well recognized; therefore, more investigations into this research topic are needed. However, it is worth emphasizing that changes in ADNs affect many aspects of catchment functioning. Therefore, changes in ADNs in relation to relief transformation, sediment delivery, the intensity of erosion/denudation processes, etc., are the research fields that should be explored in the future.
Funding
Institutional Review Board Statement
Informed Consent Statement
Data Availability Statement
Conflicts of Interest
References
- Nguyena, H.Q.; Maathuisb, B.H.P.; Rientjes, T.H.M. Catchment storm runoff modelling using the geomorphologic instantaneous unit hydrograph. Geocarto Int. 2009, 25, 357–375. [Google Scholar] [CrossRef]
- Rodríguez-Iturbe, I.; Muneepeerakul, R.; Bertuzzo, E.; Levin, S.A.; Rinaldo, A. River networks as ecological corridors: A complex systems perspective for integrating hydrologic, geomorphologic, and ecologic dynamics. Water Resour. Res. 2009, 45, 1944–7973. [Google Scholar] [CrossRef]
- Roy, S.; Sahu, A.S. Potential interaction between transport and stream networks over the lowland rivers in Eastern India. J. Environ. Manag. 2017, 197, 316–330. [Google Scholar] [CrossRef] [PubMed]
- Pilotti, M.; Chapra, S.C.; Valerio, G. Steady-state distributed modeling of dissolved oxygen in data-poor, sewage dominated river systems using drainage networks. Environ. Modell. Software 2019, 111, 153–169. [Google Scholar] [CrossRef]
- Horton, R.E. Erosional development of streams and their drainage basins: Hydrophysical approach to the quantitative morphology. Geol. Soc. Am. Bull. 1945, 56, 275–370. [Google Scholar] [CrossRef]
- Strahler, A.N. Quantitative analysis of watershed geomorphology. Trans. Am. Geophys. Union 1957, 63, 913–920. [Google Scholar] [CrossRef]
- Schumm, S.A. Evolution of drainage systems and slopes in badlands and Perth Amboy, NJ. Geolog. Soc. Am. Bull. 1956, 67, 597–646. [Google Scholar] [CrossRef]
- RodrÍguez-Iturbe, I.; Escobar, L.A. The dependence of drainage density on climate and geomorphology. Hydrol. Sci. J. 1982, 27, 129–137. [Google Scholar] [CrossRef][Green Version]
- Dietrich, W.E.; Reneau, S.L.; Wilson, C.J. Overview: Zero-order basins and problems of drainage density, sediment transport and hillslope morphology. IASH Publ. 1987, 165, 49–59. [Google Scholar]
- Montgomery, D.R.; Dietrich, W.E. Where do channels begin? Nature 1988, 336, 232–234. [Google Scholar] [CrossRef]
- Daniel, J.R.K. Drainage density as an index of climatic geomorphology. J. Hydrol. 1981, 50, 147–154. [Google Scholar] [CrossRef]
- Wigington, P.J.; Moser, T.J.; Lindeman, D.R. Stream network expansion: A riparian water quality factor. Hydrol. Process. 2005, 19, 1715–1721. [Google Scholar] [CrossRef]
- Jensen, C.K.; McGuire, K.J.; McLaughlin, D.L.; Scott, D.T. Quantifying spatiotemporal variation in headwater stream length using flow intermittency sensors. Environ. Monit. Assess. 2019, 191, 226–245. [Google Scholar] [CrossRef] [PubMed]
- Jensen, C.K.; McGuire, K.J.; Prince, P.S. Headwater stream length dynamics across four physiographic provinces of the Appalachian highlands. Hydrol. Process. 2017, 31, 3350–3363. [Google Scholar] [CrossRef]
- Ward, J.V.; Tockner, K.; Uehlinger, U.; Malard, F. Understanding natural patterns and processes in river corridors as the basis for effective river restoration. Regul. Rivers-Res. Manag. 2001, 17, 311–323. [Google Scholar] [CrossRef]
- Ward, A.; Schmadel, N.M.; Wondzell, S.M. Simulation of dynamic expansion, contraction, and connectivity in a mountain stream network. Adv. Water Res. 2018, 114, 64–82. [Google Scholar] [CrossRef]
- Prancevic, J.P.; Kirchner, J.W. Topographic controls on the extension and retraction of flowing streams. Geophys. Res. Lett. 2019, 46, 2084–2092. [Google Scholar] [CrossRef]
- Gregory, K.J.; Walling, D.E. The variation of drainage density within a catchment. Int. Ass. Sci. Hydrol. Bull. 1968, 13, 61–68. [Google Scholar] [CrossRef]
- Blyth, K.; Rodda, J.C. A stream length study. Water Resour. Res. 1973, 9, 1454–1461. [Google Scholar] [CrossRef]
- Day, D.G. Drainage density changes during rainfall. Earth Surf. Process. Landf. 1978, 3, 319–326. [Google Scholar] [CrossRef]
- Day, D.G. Lithologic controls of drainage density: A study of six small rural catchments in New England, N.S.W. Catena 1980, 7, 339–351. [Google Scholar] [CrossRef]
- Day, D.G. Drainage density variability and drainage basin outputs. J. Hydrol. 1983, 22, 3–17. [Google Scholar]
- Wharton, G. Progress in the use of drainage network indices for rainfall—Runoff modelling and runoff prediction. Prog. Phys. Geogr. 1994, 18, 539–557. [Google Scholar] [CrossRef]
- Bras, R.L.; Rodriguez-Iturbe, I. A review of the research for quantitative link between hydrologic response and fluvial geomorphology. IAHS Publ. 1989, 181, 149–163. [Google Scholar]
- Hallema, D.W.; Moussa, R. A model for distributed GIUH-based flow routing on natural and anthropogenic hillslopes. Hydrol. Process. 2014, 28, 4877–4895. [Google Scholar] [CrossRef]
- Beven, K.J. Rainfall-Runoff Modelling: The Primer, 2nd ed.; John Wiley and Sons Ltd. Oxford: Oxford, UK, 2012. [Google Scholar]
- Narayan, K.; Dikshit, P.K.S.; Dwivedi, S.B. GIS supported Geomorphologic Instantaneous Unit Hydrograph (GIUH) of Varuna river basin using Geomorphological characteristics. Int. J. Adv. Earth Sci. 2012, 1, 68–76. [Google Scholar] [CrossRef]
- Kroczak, R.; Bryndal, T. Use of the digital terrain models for generation of surface drainage network, functioning during heavy rainfall. Methodological aspects, based on the Zalasówka catchment (Ciężkowickie Foothills). Przegląd Geogr. 2017, 89, 5–24. [Google Scholar] [CrossRef]
- Bryndal, T. A method for identification of small Carpathian catchments more prone to flash flood generation. Based on the example of south-eastern part of the Polish Carpathians. Carpathian J. Earth Environ. Sci. 2014, 9, 109–122. Available online: https://www.cjees.ro/actions/actionDownload.php?fileId=686 (accessed on 23 February 2023).
- Zoccatelli, D.; Borga, M.; Chirico, G.B.; Nikolopoulos, E.I. The relative role of hillslope and river network routing in the hydrologic response to spatially variable rainfall fields. J. Hydrol. 2015, 531, 349–359. [Google Scholar] [CrossRef]
- Kroczak, R.; Bryndal, T.; Bucała, A.; Fidelus, J. The development, temporal evolution and environmental influence of an unpaved road network on mountain terrain: An example from the Carpathian Mts. (Poland). Environ. Earth Sci. 2015, 75, 1–14. [Google Scholar] [CrossRef]
- Luce, C.; Wemple, B. Introduction to special issue on hydrologic and geomorphic effects on forest roads. Earth Surf. Proc. Landf. 2001, 26, 111–113. [Google Scholar] [CrossRef]
- Słupik, J. Use of the aerial photos for evaluation of the furrows and roads on the water circulation on the mountain hillslopes. Prace Naukowe UŚ 126 Fotointerpret. W Geogr. 1976, 11, 31–38. (In Polish) [Google Scholar]
- Starkel, L. Geomorphic role of extreme rainfalls in the Polish Carpathians. Studia Geomorphol. Carpatho-Balc. 1996, 30, 21–38. [Google Scholar]
- Musierowicz, A. (Ed.) Soil Map of Poland 1:300,000, Sheet Nowy Sącz; IUING: Puławy, Poland, 1961. [Google Scholar]
- Obrębska Sterklowa, B.; Hess, M.; Olecki, Z.; Trepińska, J.; Kowaletz, L. Climate. In Polish Carpathians; Warszyńska, I., Ed.; UJ Publisher: Kraków, Poland, 1995; pp. 31–48. [Google Scholar]
- Dynowska, I. Outflow. In Polish Carpathians; Warszyńska, I., Ed.; UJ Publisher: Kraków, Poland, 1995; pp. 49–68. [Google Scholar]
- CODGIK. V-Map Level 2, (Vector Map) Database, 1:50,000; CODGIK: Warszawa, Poland, 2006. [Google Scholar]
- The National Database of Topographic Objects BDOT 10k 1:10,000; GUGIK: Warszawa, Poland. Available online: www.geoportal.gov.pl (accessed on 1 September 2022).
- Bryndal, T.; Kroczak, R. Reconstruction and characterization of the surface drainage system functioning during extreme rainfall: The analysis with use of the ALS-LIDAR data-the case study in two small flysch catchments (Outer Carpathian, Poland). Environ. Earth Sci. 2019, 78, 215. [Google Scholar] [CrossRef]
- Bryndal, T.; Kroczak, R.; Kijowska-Strugała, M.; Bochenek, W. How human interference changes the drainage network operating during heavy rainfalls in a medium-high relief flysch mountain catchment? The case study of the Bystrzanka catchment (Outer Carpathians, Poland). Catena 2020, 194, 104662. [Google Scholar] [CrossRef]
- Gayathri, K.D.; Ganasri, B.P.; Dwarakish, G.S. A Review on Hydrological Models. Aquat. Procedia 2015, 4, 1001–1007. [Google Scholar] [CrossRef]
- Dwarakish, G.S.; Ganasri, B.P. Impact of land use change on hydrological systems: A review of current modeling approaches. Cogent Geosci. 2015, 1, 1–18. [Google Scholar] [CrossRef]
- Rodriguez-Iturbe, I.; Valdes, J.B. The geomorphologic structure of hydrologic Response. Water Resour. Res. 1979, 15, 1409–1420. [Google Scholar] [CrossRef]
- Biswal, B.; Singh, R. Incorporating channel network information in hydrologic response modelling: Development of a model and inter-model comparison. Adv. Water Resour. 2017, 100, 168–182. [Google Scholar] [CrossRef]
- Swain, J.B.; Jha, R.; Patra, K.C. Stream Flow Prediction in a Typical Ungauged Catchment Using GIUH Approach. Aquat. Procedia 2015, 4, 993–1000. [Google Scholar] [CrossRef]
- Mocus, V. Soil Conservation Service; SCS, U.S. Department of Agriculture Washington: Washington, DC, USA, 1964. [Google Scholar]
- Gupta, H.V.; Sorooshian, S.; Yapo, P.O. Toward improved calibration of hydrologic models: Multiple and noncommensurable measures of information. Water Resour. Res. 1998, 34, 751–763. [Google Scholar] [CrossRef]
- Legates, D.R.; McCabe, G.J., Jr. Evaluating the use of goodness-of-fit measures in hydrologic and hydro-climatic model validation. Water Resour. Res. 1999, 35, 233–241. [Google Scholar] [CrossRef]
- Bryndal, T.; Franczak, P.; Kroczak, R.; Cabaj, W.; Kołodziej, A. The impact of extreme rainfall and flash floods on the flood risk management process and geomorphological changes in small Carpathian catchments: A case study of the Kasiniczanka river (Outer Carpathians, Poland). Nat. Hazards 2017, 88, 95–120. [Google Scholar] [CrossRef]
- Brunner, G.W. HEC-RAS, River Analysis System Hydraulic Reference Manual; US Army Corps of Engineers, Hydrologic Engineering Center, Davis: Davis, CA, USA, 2016. [Google Scholar]
- The European Parliament and the Council of the European Union. Directive 2007/60/EC of the European Parliament and the Council of 23 October 2007 on the assessment and management of flood risks. Off. J. Eur. Union 2007, L288/27. Available online: https://eur-lex.europa.eu/legal-content/EN/TXT/?uri=celex%3A32007L0060 (accessed on 1 June 2023).
- Stahy, J. (Ed.) Atlas Hydrologiczny Polski; IMGW: Warszawa, Poland, 1986. [Google Scholar]
- DVWK. Arbeitsanleitung zur Anwendung Niederschlag-Abflub-Modellen in kleinen Einzugsgebieten. Regeln 113 (Teil II: Synthese); Verlag Paul Parey: Hamburg, Germany, 1984. [Google Scholar]
- Kroczak, R.; Fidelus-Orzechowska, J.; Bucała-Hrabia, A.; Bryndal, T. Land use and land cover changes in small Carpathian catchments between the mid-19 th and early 21 st centuries and their record on the land surface. J. Mtn. Sci. 2018, 15, 2561–2578. [Google Scholar] [CrossRef]
- Johnson, E.A.G. Land drainage in England and Wales. In River Engineering and Water Conservation Works; Thorn, R.B., Ed.; Butterwordh: London, UK, 1996; pp. 29–46. [Google Scholar]
- Yildiz, O. An investigation of the effect of drainage density on hydrologic response. Turk. J. Engineer. Environ. Sci. 2004, 28, 85–94. [Google Scholar]
- Loaugue, K.; VanderKwaak, J.E. Simulating hydrologic response for the R-5 catchment: Comparison of two models and the impact of the roads. Hydrol. Proc. 2002, 16, 1015–1032. [Google Scholar] [CrossRef]
- Mirus, B.B.; Ebel, B.A.; Loague, K.; Wemple, B.C. Simulated effect of a forest road on near-surface hydrologic response: Redux. Earth Surf. Proc. Landf. 2007, 32, 126–142. [Google Scholar] [CrossRef]
- Jain, S.K.; Singh, R.D.; Seth, S.M. Design flood estimation using GIS supported GIUH approach. Water Res. Manag. 2000, 14, 369–376. [Google Scholar] [CrossRef]
- Kumar, R.; Chatterjee, C.; Singh, R.D.; Lohani, A.K.; Kumar, S. Runoff estimation for an ungauged catchment using geomorphological instantaneous unit hydrograph (GIUH) model. Hydrol. Process. 2007, 21, 1829–1840. [Google Scholar] [CrossRef]
- Kirkby, M.J. Network hydrology and geomorphology. In Channel Network Hydrology; Beven, K.J., Kirkby, M.J., Eds.; Wiley: Chichester, UK, 1993; pp. 1–11. [Google Scholar]


| Catchment | A (km2) | Average Slope Gradient (°) | Land Use Land Cover (LULC) (%) | |||
|---|---|---|---|---|---|---|
| Forest | Arable Lands | Grasslands | Settlement Areas | |||
| 1 | 6.4 | 13.31 | 100 | 0 | 0 | 0 |
| 2 | 21.8 | 9.48 | 46 | 47 | 2 | 5 |
| 3 | 33.2 | 8.96 | 39 | 49 | 5 | 7 |
| 4 | 39.7 | 8.51 | 34 | 53 | 5 | 8 |
| Model | Type of the Land Use and Land Cover (LULC) | The Head Channel Area (ha) |
|---|---|---|
| I | Arable land | 0.29 |
| II | Forest | 0.88 |
| III | Grasslands | 0.45 |
| IV | Build-up areas | 0.11 |
| V | Roads | 0.11 |
| Stream Order (Ωmax) | Number of Streams (n) | Total Stream Length (km) | Mean Stream Length (km) | Stream Density (km·km−2) * | Mean Catchment Area (km2) | |||||
|---|---|---|---|---|---|---|---|---|---|---|
| RDN | ADN | RDN | ADN | RDN | ADN | RDN | ADN | RDN | ADN | |
| C1 (6.4 km2)—100% forest | ||||||||||
| 1 | 27 | 155 | 8.9 | 30 | 0.33 | 0.19 | 3.7 | 7.5 | 0.09 | 0.026 |
| 2 | 9 | 27 | 5.8 | 10.2 | 0.65 | 0.38 | 3.3 | 9.4 | 0.464 | 0.187 |
| 3 | 2 | 4 | 5.7 | 5.6 | 2.87 | 1.40 | 2.1 | 4.8 | 3.456 | 1.556 |
| 4 | 2 | 3.8 | 1.92 | 18.1 | 3.218 | |||||
| Average | RB = 3.8 | RB = 4.8 | - | - | RL = 3.2 | RL = 2.4 | 3.0 ** | 7.7 ** | RA = 6.3 | RA = 5.9 |
| Sum | - | - | 20.4 | 49.6 | - | - | - | - | - | - |
| C2 (21.8 km2)—46% forest, 47% arable areas, grasslands 2%, sett. areas 5% | ||||||||||
| 1 | 90 | 777 | 30.5 | 133.5 | 0.34 | 0.17 | 3.2 | 10.4 | 0.107 | 0.016 |
| 2 | 23 | 176 | 16.9 | 40.8 | 0.73 | 0.23 | 3.2 | 11.3 | 0.644 | 0.093 |
| 3 | 6 | 44 | 9.8 | 22.8 | 1.64 | 0.52 | 2.4 | 7.1 | 3.145 | 0.446 |
| 4 | 2 | 11 | 7.5 | 9.3 | 3.74 | 0.85 | 2.5 | 15 | 10.955 | 1.841 |
| 5 | 2 | 8.5 | 4.23 | 6.1 | 10.824 | |||||
| 6 | 1 | 2.2 | 2.23 | 14.7 | 21.799 | |||||
| Average | RB = 3.6 | RB = 4.0 | - | - | RL = 2.2 | RL = 2.2 | 3.0 ** | 10.0 ** | RA = 4.8 | RA = 4.5 |
| Sum | - | - | 64.7 | 217.1 | - | - | - | - | - | - |
| C3 (33.2 km2)—39% forest, 49% arable areas, grasslands 5%, sett. areas 7% | ||||||||||
| 1 | 140 | 1301 | 45.2 | 211.9 | 0.32 | 0.16 | 3.1 | 10.8 | 0.103 | 0.015 |
| 2 | 38 | 297 | 26.2 | 63.1 | 0.69 | 0.21 | 3.3 | 11.6 | 0.592 | 0.085 |
| 3 | 9 | 75 | 12.4 | 37.2 | 1.37 | 0.50 | 2.7 | 8.3 | 3.007 | 0.394 |
| 4 | 3 | 17 | 8.4 | 13.6 | 2.8 | 0.80 | 2.5 | 9.3 | 10.144 | 1.825 |
| 5 | 1 | 5 | 6 | 9.4 | 6.03 | 1.89 | 2.1 | 6.1 | 33.328 | 6.512 |
| 6 | 2 | 2.2 | 1.11 | 14.6 | 16.357 | |||||
| 7 | 1 | 6.4 | 6.36 | 12.2 | 33.235 | |||||
| Average | RB = 3.5 | RB = 3.5 | - | - | RL = 2.1 | RL = 2.3 | 2.9 ** | 10.3 ** | RA = 4.4 | RA = 3.8 |
| Sum | - | - | 98.2 | 343.8 | - | - | - | - | - | - |
| C4 (39.7 km2)—34% forest, 53% arable areas, grasslands 5%, sett. areas 8% | ||||||||||
| 1 | 159 | 2425 | 54.1 | 260.9 | 0.34 | 0.11 | 3.1 | 10.9 | 0.112 | 0.010 |
| 2 | 43 | 536 | 28.8 | 92.9 | 1.01 | 0.17 | 3.4 | 13.9 | 0.612 | 0.057 |
| 3 | 9 | 131 | 14.4 | 50.5 | 2.6 | 0.39 | 2.7 | 10.3 | 3.527 | 0.271 |
| 4 | 3 | 36 | 8.4 | 21.4 | 5.4 | 0.59 | 2.5 | 12.5 | 11.705 | 1.033 |
| 5 | 1 | 7 | 9.7 | 16.5 | 15.1 | 2.36 | 2.1 | 10.4 | 39.765 | 5.541 |
| 6 | 2 | 2.2 | 1.11 | 14.6 | 19.470 | |||||
| 7 | 1 | 10.3 | 10.26 | 13.4 | 39.704 | |||||
| Average | RB = 3.6 | RB = 3.8 | - | - | RL = 2.6 | RL = 3.2 | 2.9 ** | 11.4 ** | RA = 4.5 | RA = 4.2 |
| Sum | - | - | 115.4 | 454.7 | - | - | - | - | - | - |
| Coefficients | OB vs. RDN | OB vs. ADN |
|---|---|---|
| R (-) | 0.97 | 0.98 |
| R2 (-) | 0.95 | 0.97 |
| RMSE (-) | 1.17 | 0.94 |
| Qmax diff (%) | 18.3 | 11.6 |
| Tp diff (h) | 1 | 0 |
| Coefficients | Catchment 1 | Catchment 2 | Catchment 3 | Catchment 4 |
|---|---|---|---|---|
| R (-) | 0.99 | 0.99 | 0.99 | 0.99 |
| R2 (-) | 0.99 | 0.99 | 0.99 | 0.99 |
| RMSE (-) | 0.13 | 0.09 | 0.47 | 0.47 |
| Qmax diff (%) | 2.0 | 5.0 | 7.0 | 7.0 |
| Tp diff (h) | 0 | 0 | 0 | 0 |
Disclaimer/Publisher’s Note: The statements, opinions and data contained in all publications are solely those of the individual author(s) and contributor(s) and not of MDPI and/or the editor(s). MDPI and/or the editor(s) disclaim responsibility for any injury to people or property resulting from any ideas, methods, instructions or products referred to in the content. |
© 2023 by the author. Licensee MDPI, Basel, Switzerland. This article is an open access article distributed under the terms and conditions of the Creative Commons Attribution (CC BY) license (https://creativecommons.org/licenses/by/4.0/).
Share and Cite
Bryndal, T. Changes in the Active Drainage Network and Their Impact on the Hydrological Response and Flood Risk Management Process: A Case Study for a Flysch Mountain Catchment. Resources 2023, 12, 146. https://doi.org/10.3390/resources12120146
Bryndal T. Changes in the Active Drainage Network and Their Impact on the Hydrological Response and Flood Risk Management Process: A Case Study for a Flysch Mountain Catchment. Resources. 2023; 12(12):146. https://doi.org/10.3390/resources12120146
Chicago/Turabian StyleBryndal, Tomasz. 2023. "Changes in the Active Drainage Network and Their Impact on the Hydrological Response and Flood Risk Management Process: A Case Study for a Flysch Mountain Catchment" Resources 12, no. 12: 146. https://doi.org/10.3390/resources12120146
APA StyleBryndal, T. (2023). Changes in the Active Drainage Network and Their Impact on the Hydrological Response and Flood Risk Management Process: A Case Study for a Flysch Mountain Catchment. Resources, 12(12), 146. https://doi.org/10.3390/resources12120146