Article

Preparation of Adsorbent Materials from Rice Husk via Hydrothermal Carbonization: Optimization of Operating Conditions and Alkali Activation

1
Department of Chemical Engineering, Universidad San Francisco de Quito USFQ, Diego de Robles s/n y Avenida Interoceánica, Quito 170901, Ecuador
2
School of Chemical Sciences and Engineering, Yachay Tech University, Hda. San José s/n y Proyecto Yachay, Urcuquí 100119, Ecuador
3
Instituto de Investigación Geológico y Energético, Av. de la República E7-263, Quito 170518, Ecuador
4
Centro de Nanociencia y Nanotecnología, Universidad de las Fuerzas Armadas ESPE, Av. General Rumiñahui s/n y Ambato, Sangolquí 171103, Ecuador
*
Authors to whom correspondence should be addressed.
Resources 2023, 12(12), 145; https://doi.org/10.3390/resources12120145
Submission received: 26 September 2023 / Revised: 22 November 2023 / Accepted: 28 November 2023 / Published: 12 December 2023
(This article belongs to the Special Issue Energy and Nutrient Recovery by Hydrothermal Treatments)

Abstract

:
Hydrothermal carbonization (HTC) of rice husk was optimized in terms of the adsorption capacity at equilibrium (qe) and hydrochar mass yield (MY). The studied variables were reaction temperature, residence time, and biomass-to-water ratio by means of response surface methodology. In both cases, reaction temperature resulted the most significant parameter promoting high qe values at higher temperatures when treating methylene blue (MB) as the target pollutant. Nevertheless, MY was low (~40%) when focusing on a possible industrial application. Hence, maximizing qe and MY simultaneously by optimization of multiple responses emerges as a promising solution to improve MY values (>60%) with no significant differences regarding the qe response. Furthermore, additional activation was conducted on optimal hydrochars to further investigate the enhancement of qe. As a result, no statistical differences between non-modified and activated hydrochars were observed for qe; however, the pseudo-second-order constant (k2) seemed to be increased after alkali activation, mainly due to a larger surface area. Non-modified and activated hydrochars were characterized via SEM, FTIR, XRD, and BET, resulting in two significant effects contributing to MB adsorption: increased surface area and functionalized hydrochar surface. Consequently, this work provides valuable insights on subsequent application of this HTC optimization scheme at an industrial scale.

1. Introduction

Valorization of agro-residues is a valuable strategy to obtain carbonaceous materials to be used in various applications. In particular, rice husk has gained interest as it is considered a renewable energy source. Rice husk is the outer layer of the rice grain, accounting for 20% of the whole grain weight, which is widely generated during the milling process [1]. This residual biomass is often used as fuel in boilers and gasifiers for energy production [2,3,4]. On the other hand, residual biomass like rice husks is also utilized as raw material for adsorbent materials involved in wastewater treatment [5,6].
Common activated carbons derived from pyrolysis entail high-energy-demand processes, increasing costs [7]. Moreover, pyrolysis normally results in low mass yields for biochar production. For instance, rice husk pyrolyzed at 550 °C loses around 70% of its initial mass [8]. Thus, in the search for another treatment demanding less energy consumption for biomass-based adsorbent production, hydrothermal carbonization (HTC) has emerged as a promising alternative due to the relatively low temperature range (under subcritical water at 180–250 °C) compared to other thermochemical processes [9]. At subcritical conditions, the main constituents of biomass, such as hemicellulose, cellulose, and lignin, are decomposed and then converted into a solid carbonaceous product called hydrochar. At the same time, process water and a little gas phase are also formed because of the reactions occurring when biomass is hydrothermally treated [10].
Most of the reported data in the literature refers to the maximization of hydrochar adsorption capacity [11,12,13]; however, it is also essential to evaluate hydrochar yields so this technology can be implemented at industrial scale [14]. In other words, keeping reasonable hydrochar yields rather than solely focusing on treating biomass at high temperatures when producing hydrochar-based adsorbent materials is critically needed.
Some studies have already addressed the use of hydrochar from rice husk towards sorption applications [15,16,17]. For instance, Ding et al. [15] used rice husk hydrochar for removing hexavalent chromium from aqueous solutions, providing insight into the mechanism of adsorption and reduction of (Cr (VI)). Hossain et al. on the other hand fully characterized rice husk biochar from HTC, showing its remarkable surface area, porous structure, and carbon content, proving its suitability as adsorbent material for transitional compounds [17]. Nevertheless, it is necessary to develop an optimization scheme that maximizes the adsorption capacity of hydrochar while reaching high hydrochar yields. This scheme involves exploring various process parameters, such as reaction temperature, residence time, and biomass-to-water ratio, to identify the optimal conditions that can simultaneously maximize the adsorption capacity of hydrochar and the hydrochar mass yield. This comprehensive approach will contribute to developing sustainable and economically viable hydrochar-based adsorbents with improved adsorption performance. It requires careful control over specific parameters, including high porosity and large surface area, that provide increased accessibility for contaminants and more active sites for adsorption [18]. Functional groups on the hydrochar surface also play a crucial role when interacting with target pollutants [19].
Based on this background, this work investigates the effect of the HTC process parameters over adsorption capacity and hydrochar yields simultaneously by applying the optimization of multiple responses approach, which is addressed using the response surface methodology (RSM). It allows studying the combined effect of the reaction temperature, residence time, and biomass-to-water ratio, performing only the necessary number of experiments. As a result, multivariate models are obtained to predict the mentioned output variables in the design space. The optimal hydrochars were then validated and further modified by alkali activation to deeply investigate the maximum adsorption capacity during batch-dye removal using methylene blue as the target pollutant.

2. Materials and Methods

2.1. Hydrochar Preparation

Rice husk was obtained from a local milling producer and then stored and treated in the laboratory as received. The ultimate analysis carried out on raw biomass is indicated in Table 1. The CHNS contents were determined based on the BS EN ISO 16948 standard [20] using a Perkin Elmer 2400 elemental analyzer, while the ash content was measured following the UNE-EN ISO 18122 method [21] in a Hysc MF-05 muffle furnace. Proximal analysis of biomass is also shown in Table 1, which was reported from our previous study using the same biomass type [22].
The HTC experimental runs were performed in a 500 mL high-pressure reactor (model TGYF-B-500ML), where raw rice husks and distilled water were preloaded following the desired biomass-to-water ratio. Once the reactor was hermetically closed, it was turned on so the temperature could be gradually increased up to the set point (±1 °C) and maintained during the adjusted residence time. After that, the reactor was cooled down at ambient conditions and opened to discharge hydrochar, separated from process water via vacuum filtration. Before opening the reactor, the gas phase must be purged. Finally, hydrochar samples were dried overnight at 105 °C before further characterization and adsorption tests. The reactor provides magnetic stirring, which was set at 1000 rpm. In addition, the pressure inside the reactor is autogenous [9] and it depends mainly on the reaction temperature, ranging from 1 to 5 MPa (e.g., 5 MPa was the pressure registered by the manometer at the highest HTC temperature level).

2.2. HTC Process Optimization

The study investigated three key parameters, reaction temperature, residence time, and biomass/water ratio, for reaching optimum conditions for rice-husk-based hydrochar. To this end, a central composite design (CCD) was proposed, including the following parameter ranges: (a) temperature: 183–267 °C; (b) time: 39.5–140.5 min; and (c) B/W ratio: 0.0165–0.0585. To obtain a circumscribed-rotatable design, 17 experimental runs were randomly carried out for the HTC essays, including the factorial design points and axial and center points [23], as indicated in Table 2. The reaction temperature was based on a temperature range where the HTC process is intended to occur, namely, where hydrothermal reactions occur to decompose the biomass constituents [24]. The residence time range was selected according to previous hydrothermal treatment performed in a reactor with similar characteristics to the reactor employed in this work [25]. In the case of the B/W ratio, it was proposed based on the reactor volume.
As aforementioned, the optimization study performed in this work lies in preparing adsorbent materials using hydrochar. Therefore, once hydrochar was obtained, it was employed for methylene blue (MB) adsorption, which was selected as the target pollutant. The hydrochar mass yield (MY) and the adsorption capacity at equilibrium (qe) are the response variables to be studied. In this sense, MY was calculated based on Equation (1):
M Y = m d r y   h y d r o c h a r m d r y   r a w   b i o m a s s × 100 %
The adsorption tests were carried out under the following conditions: 50 mL of an MB solution was prepared with an initial concentration of 0.05 mmol L−1 (~16 mg L−1) and then added to a 100 mL glass flask, keeping the hydrochar addition ratio of 2 g L−1. The experiments were conducted at room temperature (~25 °C) under magnetic stirring (1000 rpm). The MB adsorption was monitored by measuring the MB absorbance using a Hach DC/890 colorimeter at different times until stabilization. All samples were previously filtered with a syringe filter to remove the remaining hydrochar particles. After determining the MB concentration using a calibration curve, the qe values were calculated according to Equation (2), as also indicated by Jais et al. [13]:
q e = C 0 C e   V m ,
where C0 and Ce represent both the initial and equilibrium concentrations of MB in mg L−1, V is the solution volume in L, and m is the mass of adsorbent in g.
The subsequent optimization study was made using Design Expert (v.11) using RSM, where MY and qe were analyzed individually based on the results in Table 3. At this point, a statistical analysis was performed, including ANOVA with a 95% confidence level, to propose multivariate models for MY and qe. The models’ agreement was assessed by fit statistics, including R2 and adjusted R2 values, lack of fit tests, and diagnostics plots (i.e., normal plot of residuals and residuals versus predicted plot).
Once individual models for MY and qe were proposed, optimizing the multiple responses approach was addressed to optimize MY and qe simultaneously. In this approach, an individual desirability value (di) is associated with each response variable value (yi), describing the importance of the optimization. In this case, both MY and qe were maximized. To better understand the desirability strategy, Bezerra et al. [26] indicated that these desirabilities can be calculated from Equation (3), where L i and H i represent the minimum and maximum values that each response can take, respectively. It means modifying these values as required can refine the optimization process. As no specific values were considered, the minimum and maximum experimental responses were assigned to L i and H i by default. Finally, both individual desirability values are integrated into overall/global desirability (D) as indicated in Equation (4), which also lies within 0 and 1. The highest overall desirability reflects the optimal combination of operating conditions (i.e., the reaction temperature, residence time, and B/W ratio combination that allowed maximizing MY and qe simultaneously).
d i = 0 ;             y i < L i y i L i H i L i s ;       L i y i H i   1 ;             y i > H i ,
D = ( d 1 × d 2 × × d n ) 1 / n ,

2.3. Activation and Characterization of Optimal Hydrochars

Hydrochar was alkali-treated following the method of Rodriguez et al. [22]. Hydrochar and a 3M KOH solution (100 mL per 1 g hydrochar) were stirred at 400 rpm and 70 °C for 2 h. The alkali-treated hydrochar was then filtered and dried for 20 h in an oven at 105 °C.
The optimal hydrochars and their corresponding activated samples were characterized based on the following techniques: The hydrochar’s structure was examined using both a Scanning Electron Microscope (SEM) and a Tescan Mira 3 microscope equipped with a Schottky Field Emission Gun (Schottky FEG-SEM). The hydrochar samples were securely positioned on SEM stubs and coated with a 20 nm layer of 99.99% pure gold using a Quorum Q150R ES sputtering evaporator. Elemental analysis was performed on the SEM chamber at 30 kV utilizing a Bruker X-Flash 6|30 detector for Energy Dispersive Spectroscopy (EDS).
FTIR transmission spectra of prepared samples were recorded using a Perkin Elmer Spectrum II instrument with a lithium tantalite-MIR detector at room temperature, in the wavenumber range from 350 to 4000 cm−1 using the KBr disc technique. For analysis, the pulverized powder samples were mixed with KBr. The data was analyzed using the Spectrum 10 STD software from Perkin Elmer.
The prepared samples were then subjected to powder X-ray diffraction (XRD) analysis using a Rigaku Miniflex 600 diffractometer. This instrument features a 600 W X-ray tube, a Bragg–Brentano goniometer with an 8-position autosampler, and a D/teX Ultra detector. The data was analyzed using the SmartLab Studio II software. The measurements were carried out with an X-ray generator operating at 40 kV and 15 mA, utilizing a CuK (alpha) radiation source. The scanning range spanned from 0° to 100° (2θ), with a scanning rate of 10°/min.
A single-point surface analysis using the BET method was conducted with an Auto Chem II micrometrics instrument.

3. Results and Discussion

3.1. Adsorption Experiments and Optimization

The adsorption kinetics of different hydrochars were developed. A typical adsorption experiment is shown in Figure 1 for one of the center points of the design space (i.e., hydrochar obtained at 225 °C, 90 min, and B/W = 0.0375). Herein, qt represents the adsorption capacity in mg g−1 as a function of time. The fastest adsorption rate was observed within the first 5–6 min, almost reaching the equilibrium. Regarding adsorption kinetics, all experimental runs align with pseudo-second-order kinetics as indicated in Figure 1 (please refer to the inset plot: t/qt vs. t). This is in concordance with the literature [12,27,28], which relates widely to pseudo-second-order kinetics for MB adsorption (R2 > 0.99). It was confirmed by evaluating calculated and experimental qe values, which are very close. In this context, qe values were considered for the optimization process.

3.1.1. Statistical Analysis and Obtained Models

To evaluate the agreement of the proposed models, an ANOVA table is first provided in Table 4, where the p-value of the models (<0.0001) confirmed their significance, as indicated by the lack of fit p-values higher than 0.05. Both models’ predictors were selected using the corrected Akaike Information Criterion (AICc), which compares the robustness of different models according to the number of parameters employed, as shown in a previous study [29]. In this sense, MY was described by a linear model, whereas qe was expressed by a quadratic model. In terms of fit statistics, the adjusted R2 coefficient allows comparing models showing different numbers of predictors, which was 0.84 in both models; however, it is necessary to compare these values to the predicted R2 coefficients so that a difference between adjusted and predicted R2 coefficients lower than 0.2 can be achieved. This was the case for MY and qe, which means the obtained models were not overfitted. On the other hand, other criteria, such as the coefficient of variation (C.V.%) and adequate precision, were evaluated. For instance, the C.V.% should be lower than 10% to illustrate that experimental results are reproducible. At the same time, good precision values greater than 4 are required so the models can be appropriately used to navigate the design space. These requirements were effectively fulfilled for both models.
Regarding diagnostic plots (see Supplementary Materials), the residuals seemed to follow a normal distribution since linear trends were identified. In contrast, no defined trends were shown in the residuals versus predicted plots. All these statistical criteria were used for model evaluation. It aligned with the guidelines provided in Design Expert (v.11) and previous studies [30,31,32].
Based on this statistical analysis, it can be stated that the experimental results successfully agreed with the attained models, which are presented in Table 5. Notice that the qe model was only introduced in coded factors. This is attributed to the methodology applied for predictor selection. In other words, since the AICc approach suggested discarding two low-order terms, such as residence time and B/W ratio, the model can lack hierarchy if fundamental factors express it and may not be helpful for prediction [32].

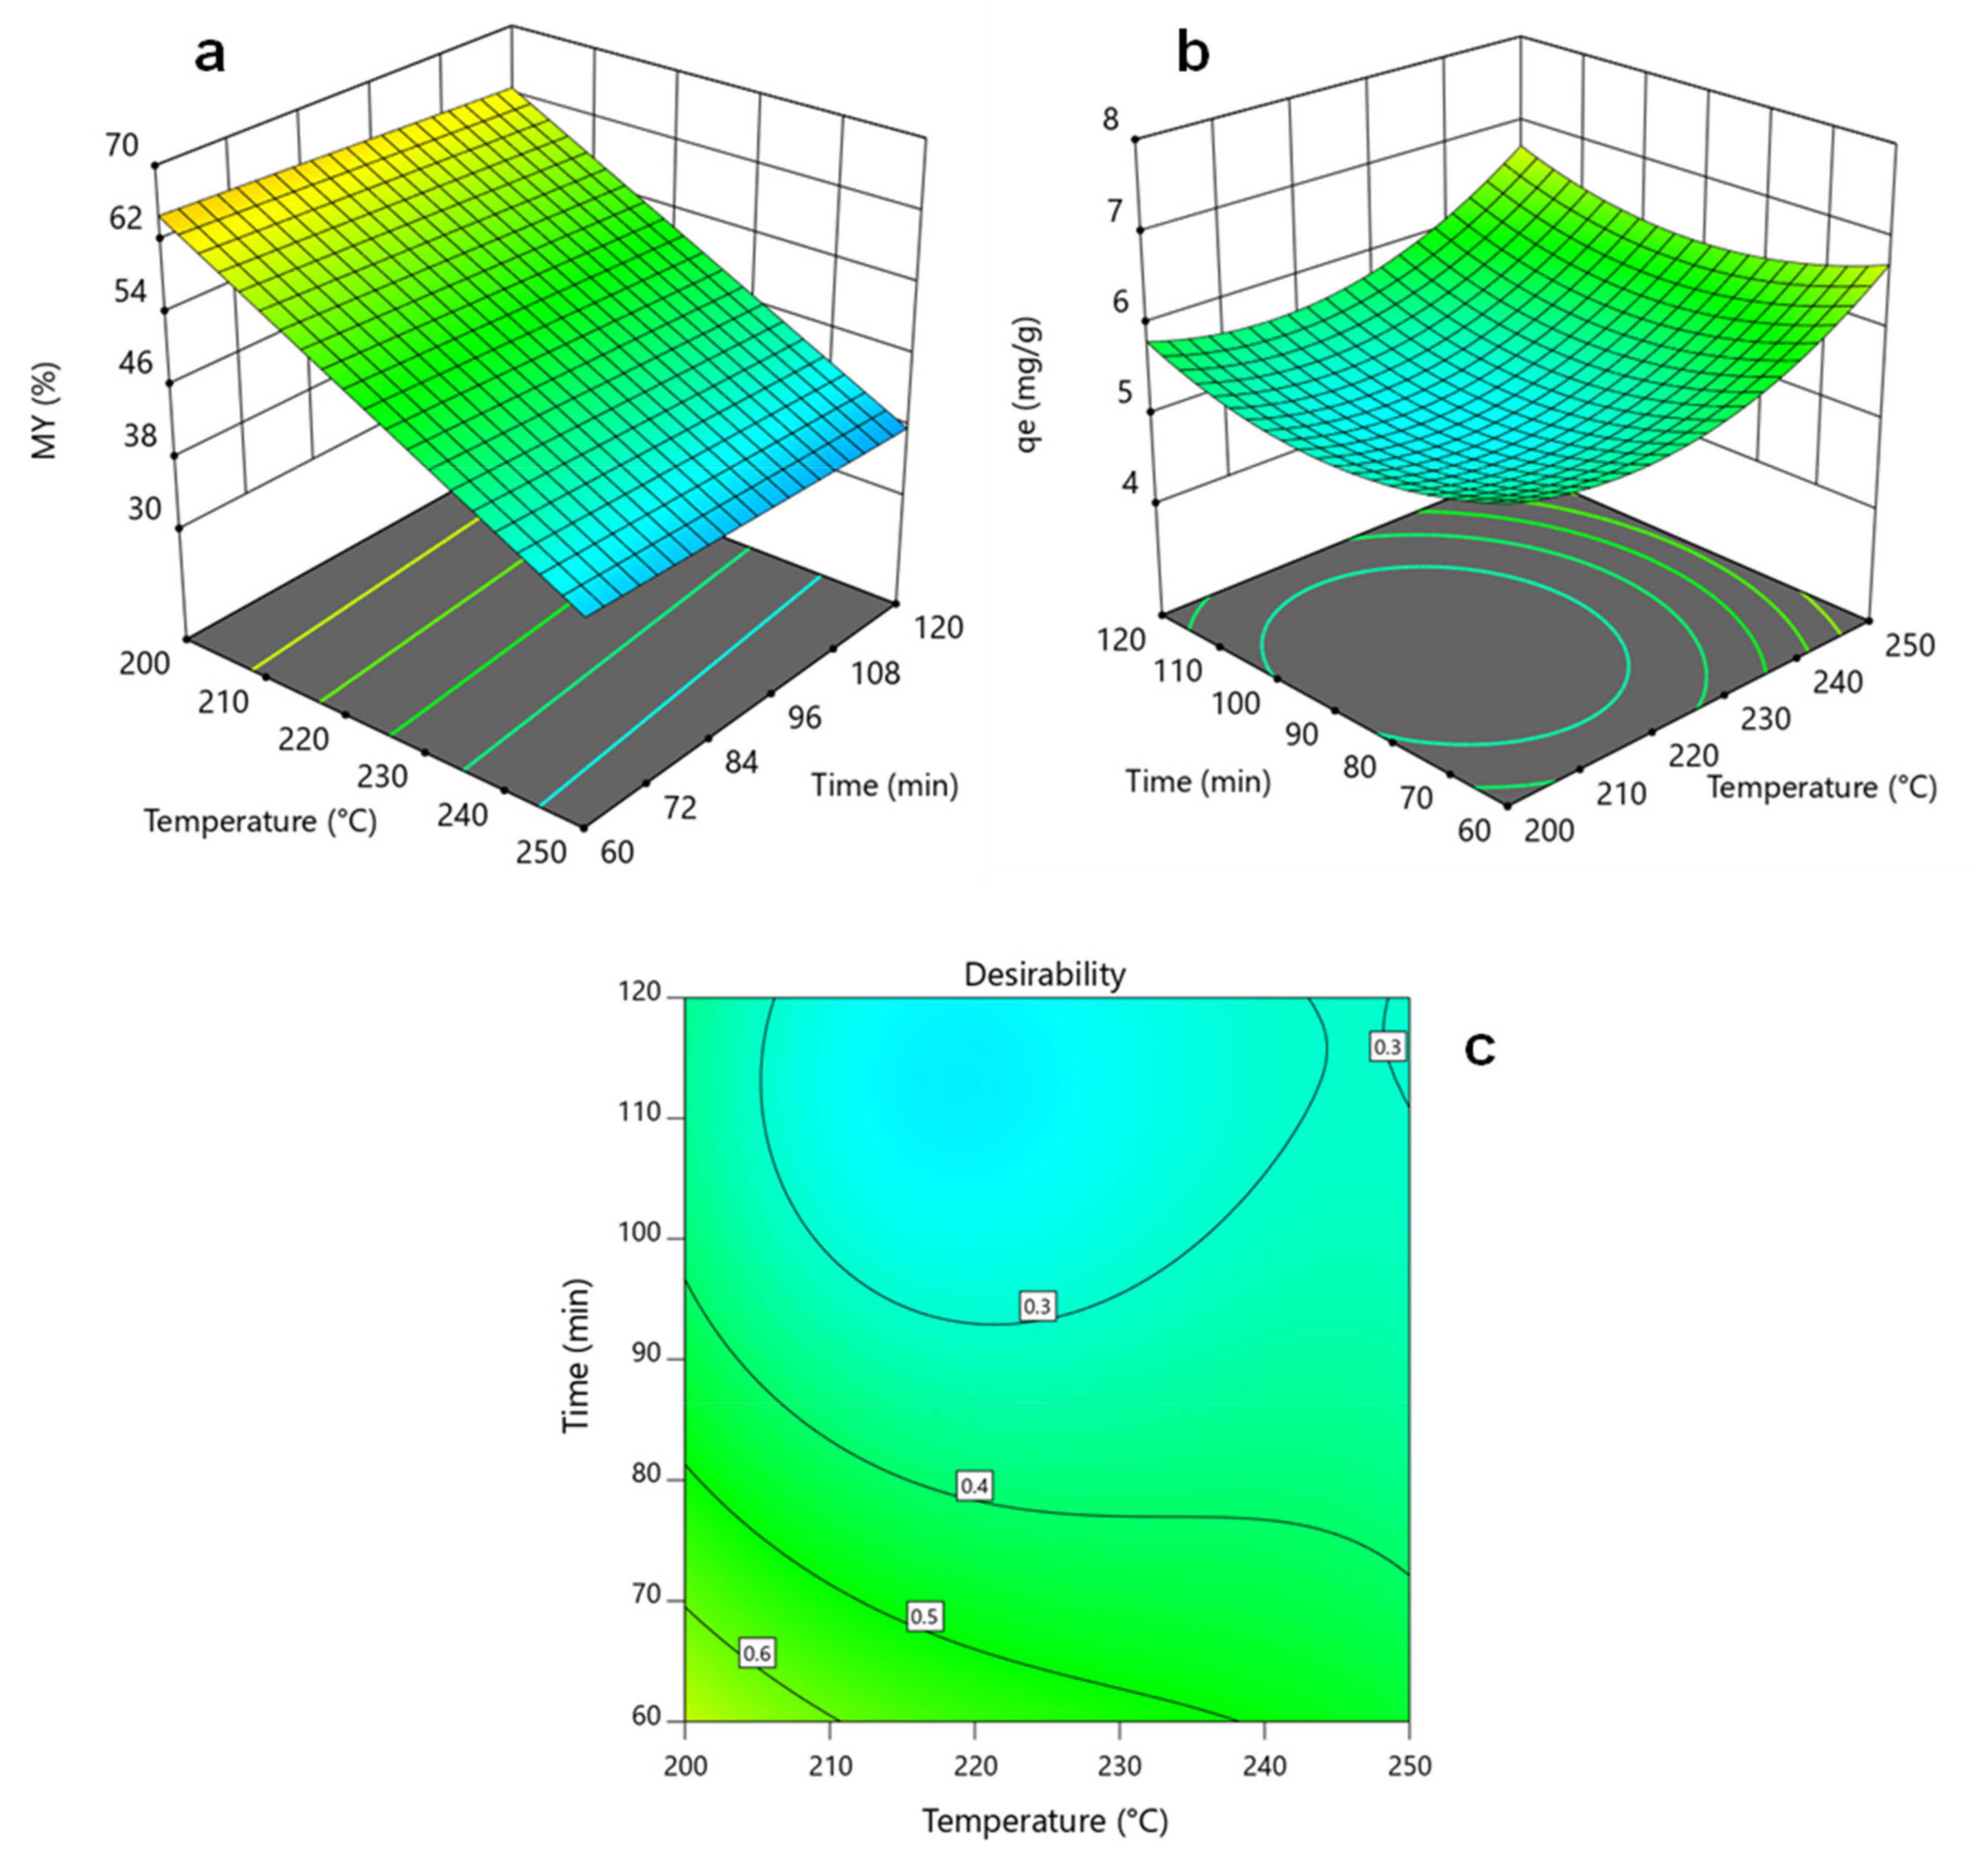
3.1.2. Effect of the HTC Operating Conditions on Response Variables and Optimization of Multiple Responses

In terms of MY, the analysis of variance revealed that reaction temperature was the only statistically significant parameter reflecting a linear dependency. The negative coefficient in the coded equation represents that MY decreases with HTC temperature, which aligns with a previous study concerning the hydrothermal treatment of rice husk [33]. As expected, when hydrothermally treating lignocellulosic biomass at higher temperatures, it is more likely to break down the intermolecular bonds of biomass components (i.e., hemicellulose, cellulose, and lignin starting at 180 °C, 200 °C, and 220 °C, respectively), decreasing solid yields [9]. This means that the other factors, residence time and B/W ratio, should be operated at those levels requiring less resource consumption. For example, if no significant effect is observed between 60 and 120 min, as shown in Figure 2a, the hydrothermal treatment might be carried out at 60 min so that less energy is required to operate the reactor. Likewise, higher B/W values may reduce water consumption during the HTC process.
On the other hand, the model selection for qe accounts for a quadratic behavior, as indicated in Figure 2b. Again, reaction temperature resulted in the most significant individual factor showing a minimum adsorption capacity at the middle of the design space (i.e., near 225 °C and 90 min). In contrast, higher qe values were observed at extreme design points, especially at 250 °C. Low HTC temperatures were reported to be beneficial towards dye removal since a more significant fraction of non-dissolved lignin is present due to partial biomass degradation at these temperatures (mainly hemicellulose and cellulose). This lignin portion forms a primary hydrochar via solid–solid reactions, abundant in oxygenated functional groups that promote dye adsorption [34]. On the other hand, for the highest temperature values (~250 °C), high qe values can be attributed to the surface area growth at these operating conditions. In other words, at higher HTC temperatures, more significant fractions of biomass components are decomposed, producing a porous structure and improving adsorption capacity [35]. In addition, there are still oxygenated functional groups in the hydrochar surface at high reaction temperatures. This means the hydrochar adsorption capacity is influenced by a high surface area and adequate surface functionalization [36].
Based on this background, there are two possibilities for optimizing the HTC process for preparing adsorbent materials. The first alternative is for the rice rusk to undergo hydrothermal treatment at the highest reaction temperature. For instance, at the highest axial temperature (i.e., 267 °C), an experimental qe of 7.42 mg g−1 was reached; however, a 31.05% hydrochar yield was attained at these operating conditions, which means the implementation of this process at an industrial scale will be hardly possible because of the low hydrochar yields. Therefore, the other alternative is to maximize the adsorption capacity while maximizing mass yields, and considering that suitable qe values were obtained at specific design points, including a 200 °C reaction temperature, reasonable MY values can also be reached. The optimization of the multiple responses scheme applied in this study allowed us to find a new optimal set of operating conditions (previously indicated in Table 3) at a maximum desirability of 0.689, as shown in Figure 2c.

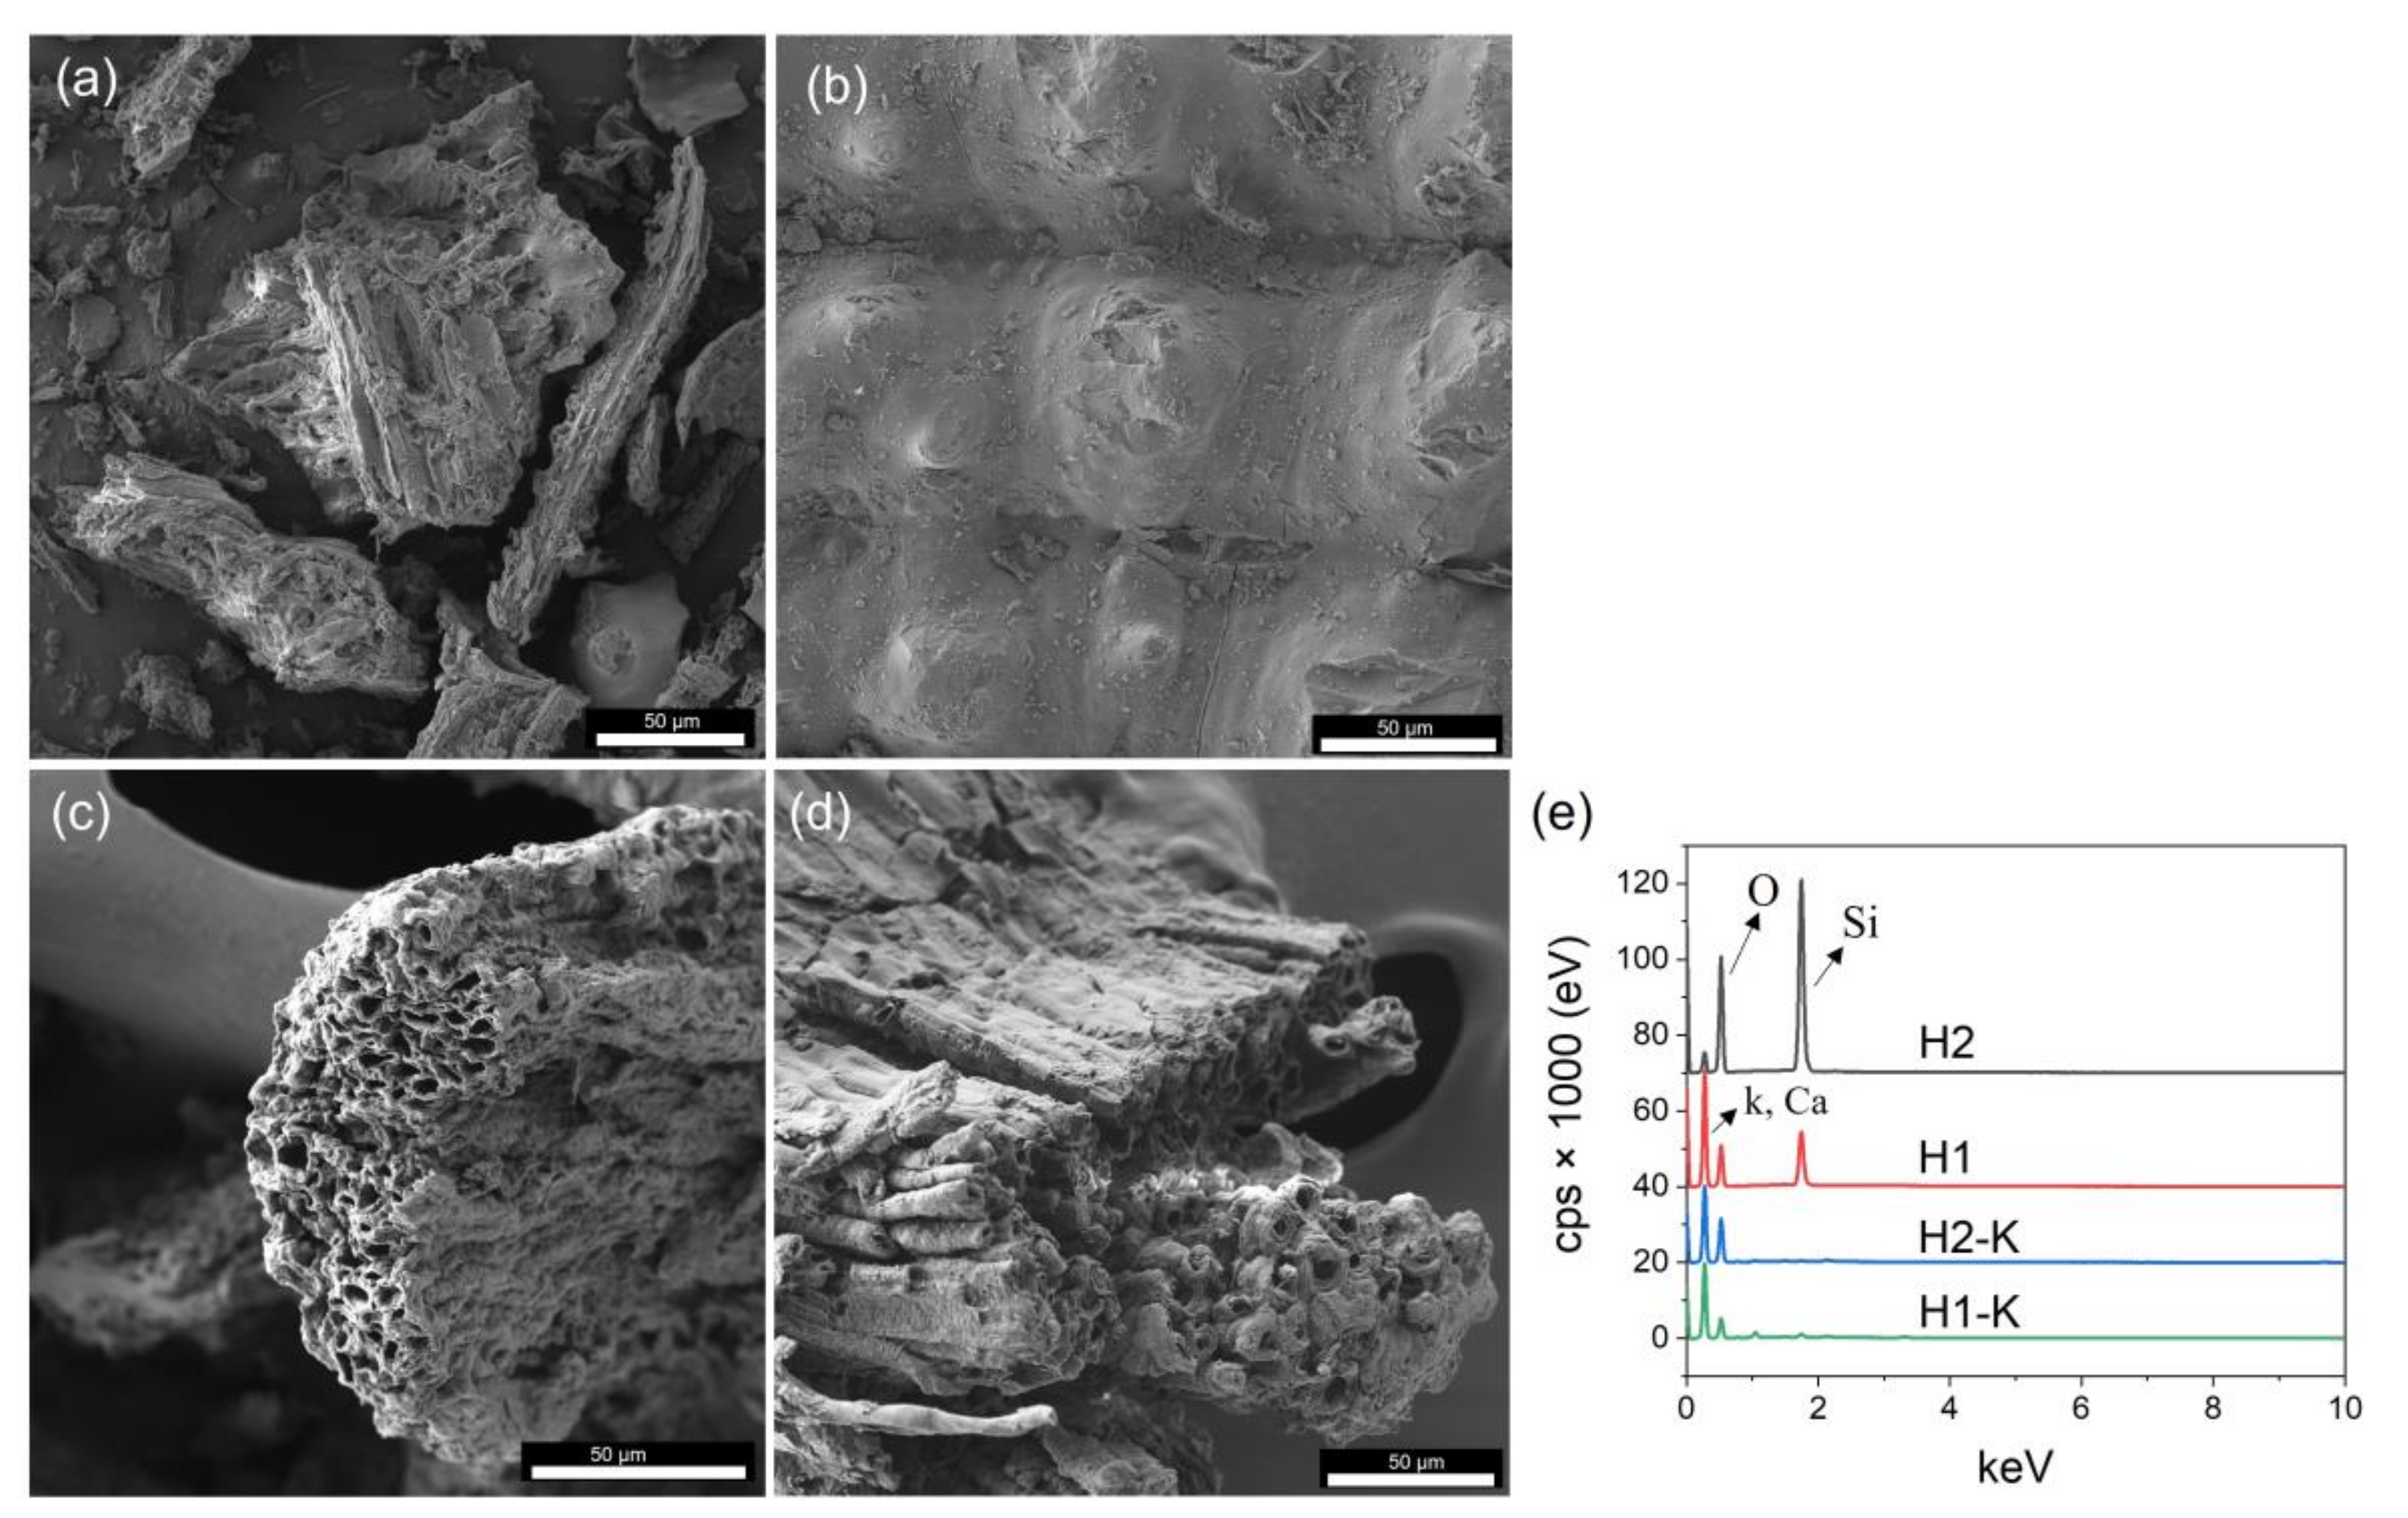
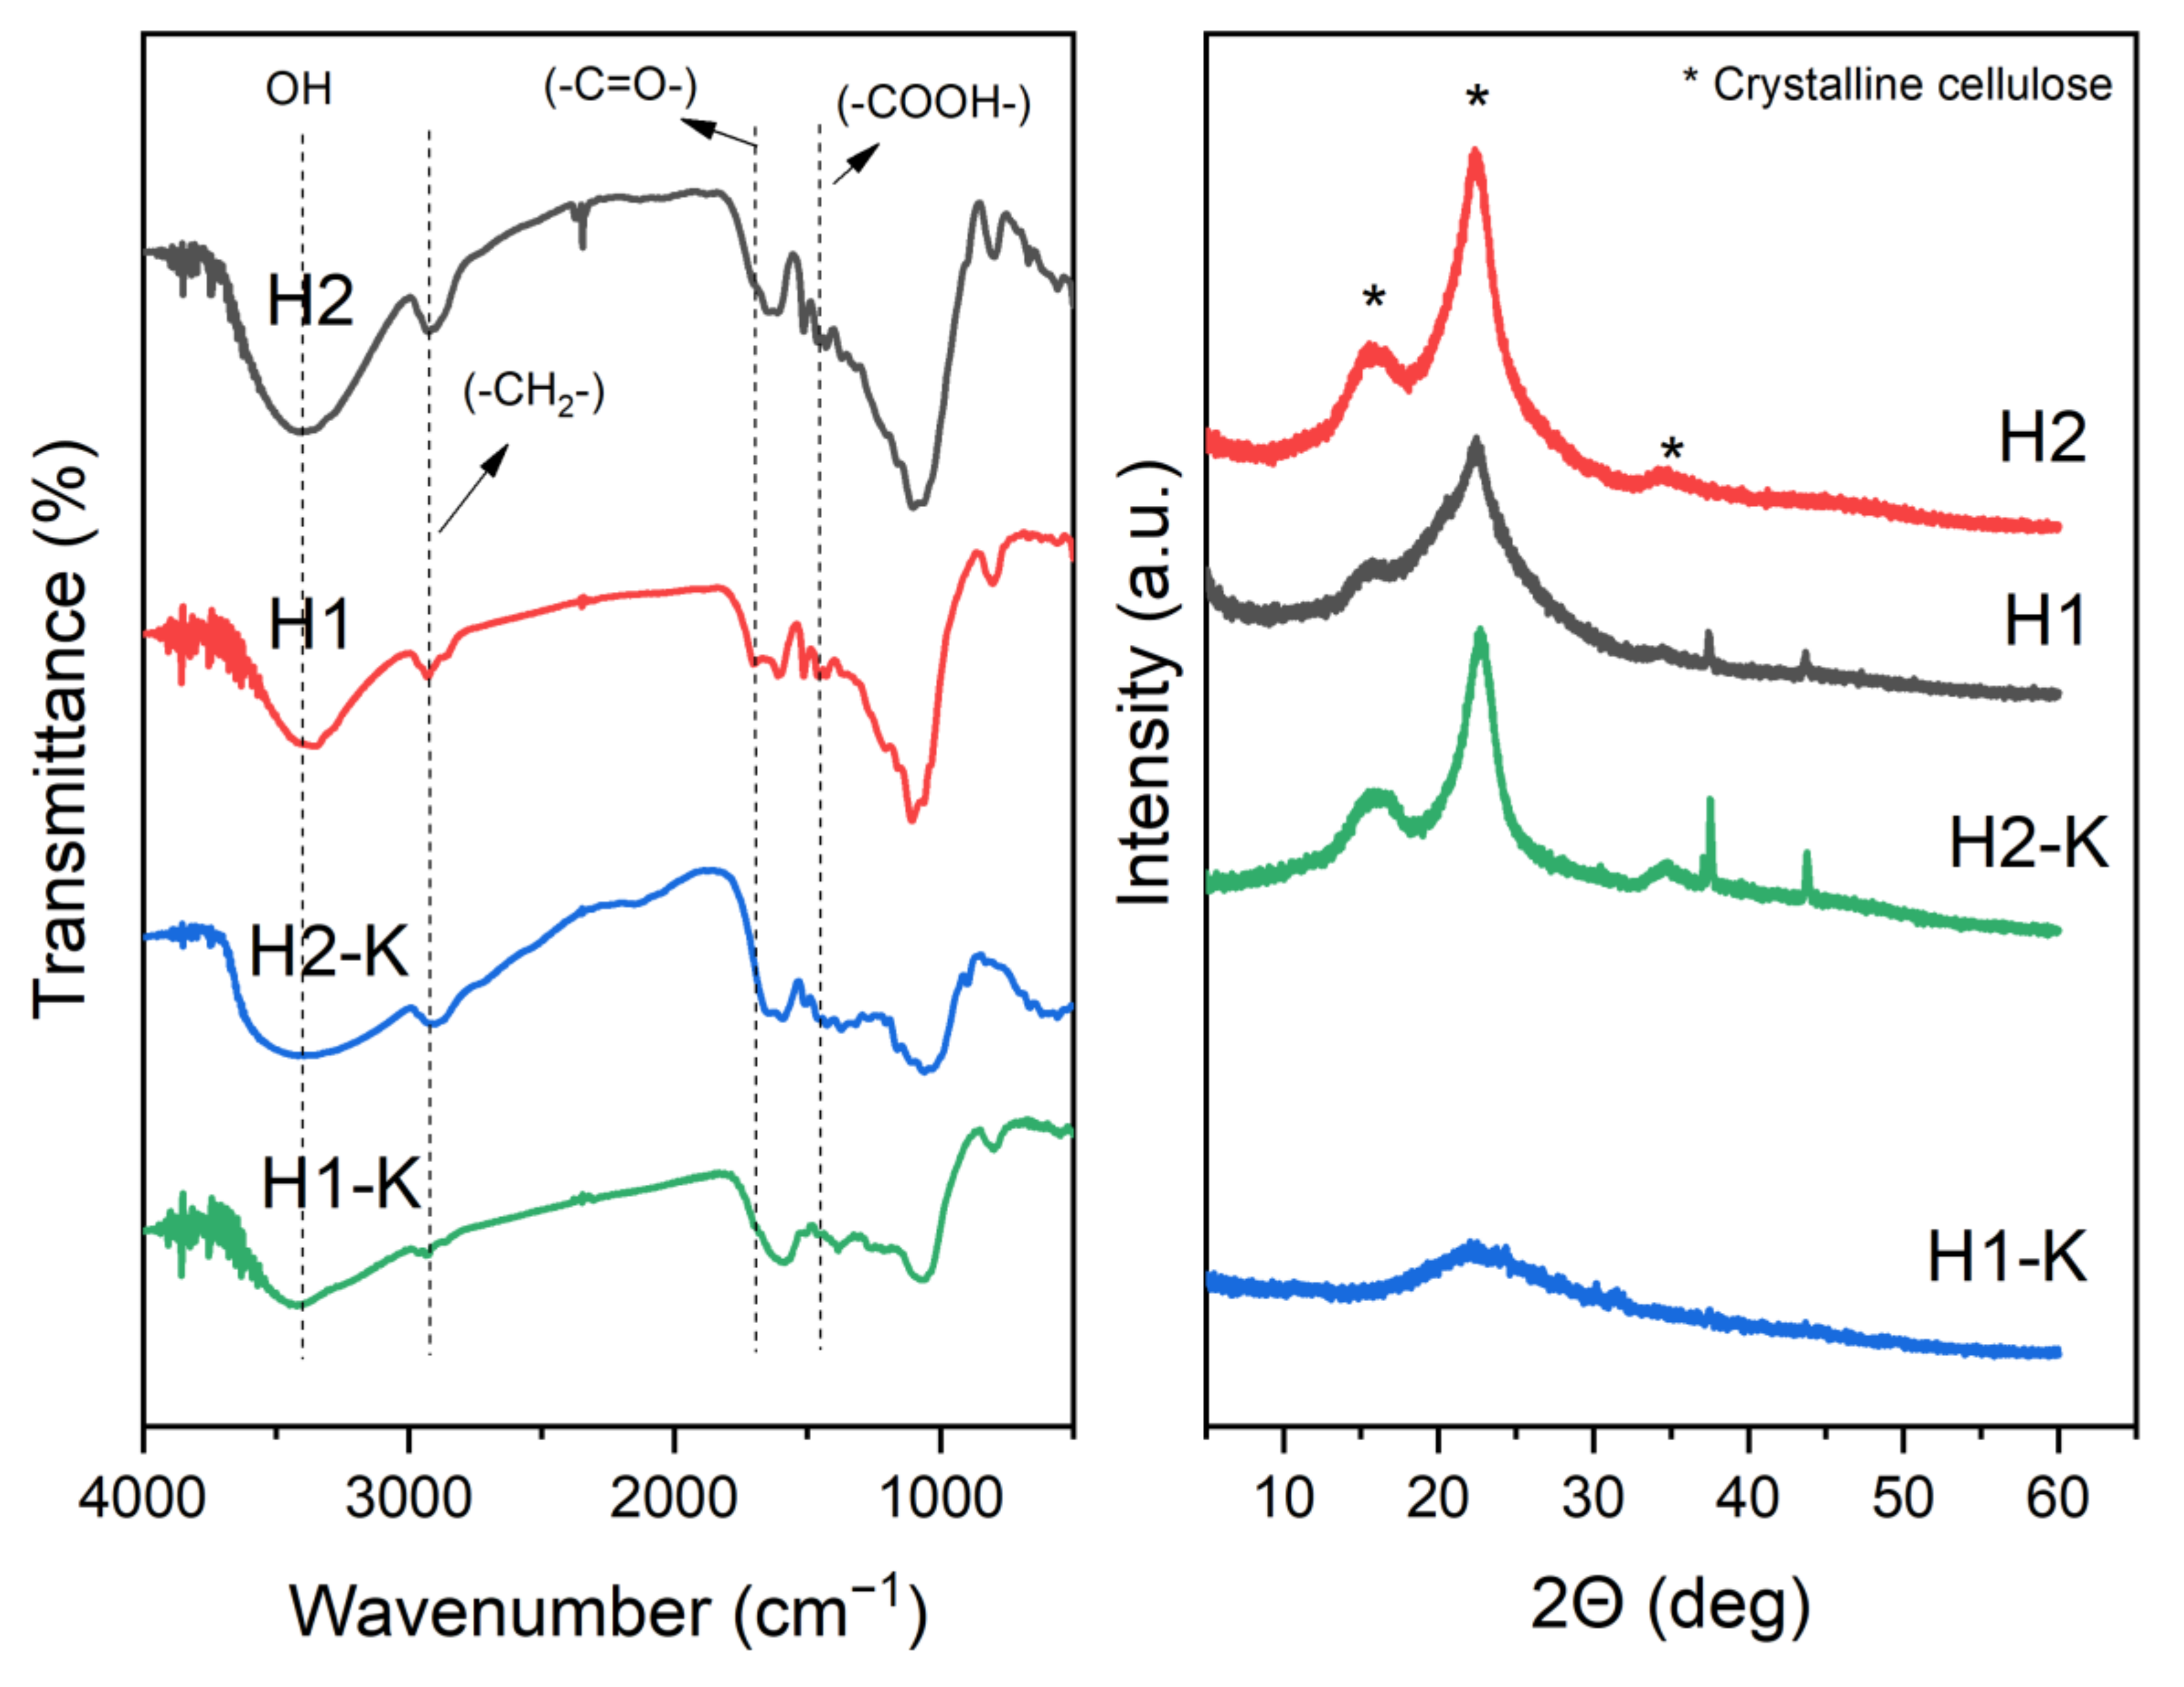
3.2. Characterization of Optimal and Activated Hydrochars

A surface modification methodology was applied to the optimal hydrochars to investigate if adsorption capacity could be further improved. In this sense, alkali activation using KOH was performed on H1 and H2 hydrochars, namely, H1-K and H2-K (see Table 6 for complete nomenclature details).
A complete characterization was developed under optimized and treated materials to obtain insights about their behavior. The morphological properties were developed via SEM. As expected, the HTC process decomposes the organic material, producing a typical porous surface (see Figure 3a). This pore formation can be enhanced at higher reaction temperatures [37], following lower MY values, as shown in Table 3. This is also confirmed with the ash contents after HTC. H1 and H2 showed an increment of ashes compared to the raw biomass, being around 39, 29, and 20%, respectively. This increment is related to the lower amount of organic compound in the materials after HTC.
Moreover, it is well-known that alkali treatment might increase pore formation due to removing silica and other remaining organic compounds in rice husks, as shown in Figure 3c,d. The alkali treatment effect was confirmed by EDS spectra (Figure 3e). As shown, silica content is considerably reduced from the hydrochar matrix after alkali treatment. This porous formation is also related to the increased surface area after the chemical treatment, as indicated in Table 7 where the BET surface area results are displayed. Notice that it was improved from 19.82 to 110.67 m2 g−1 for H1 and H1-K, respectively, and from 1.40 to 12.40 for H2 and H2-K, respectively.
For H2, the silica content decrease is related to the reduction in the ash content after alkali treatment, as shown in Table 7 (from 29 to 8%). Interestingly, as also shown in the BET surface area, it seems that alkali treatment under H1 is more effective for both silica and organic material extraction, obtaining higher values of ash content on H1-K.
FTIR spectra of the prepared materials are shown in Figure 4. All materials show the typical peaks for rice husk after carbonization [38,39]. The peaks around 3400 and 1625 cm−1 represent the different vibrations of the hydroxyl group. The band at 2930 cm−1 can be assigned to the asymmetrical vibration of methylene (-CH2-). The peak at 1710 cm−1 is generated by C=O vibration from the carboxyl group in cellulose, which seems to disappear after alkali treatment under materials carbonized at 250 °C. The peak at 1450 cm−1 can be assigned to the presence of carboxyl group.
As the previous characterization does not completely explain the higher surface area of H1-K, all materials’ XRD patterns were developed and shown in Figure 4. According to XRD analysis, the patterns for H2 are typical for rice husk hydrochars with a low degree of organic matter degradation. Characteristic peaks at 2Ɵ = 15, 22.5, and 35° are commonly related to the still presence of crystalline cellulose. Interestingly, sharper diffraction peaks are observed for the treated material (H2-K). As stated by several authors [39,40], hydrochar crystallinity can increase after carbonization and alkali treatment due to the removal of amorphous components such as hemicellulose, fats, waxes, silica, and lignin. Moreover, as expected, the peaks of cellulose are less intense after HTC at 250 °C (H1) due to a higher degree of carbonization. This is also related to the formation of micropores, as shown in in the N2 isotherm (see Figure S7 in Supplementary Materials). Subsequently, alkali treatment under H1 seems to be more effective for materials further degradation. H1-K XRD spectra shows almost not observable peaks, showing a higher degree of degradation of the organic material, resulting in a hydrochar that resembles a highly amorphous carbon, thus with a higher surface area.

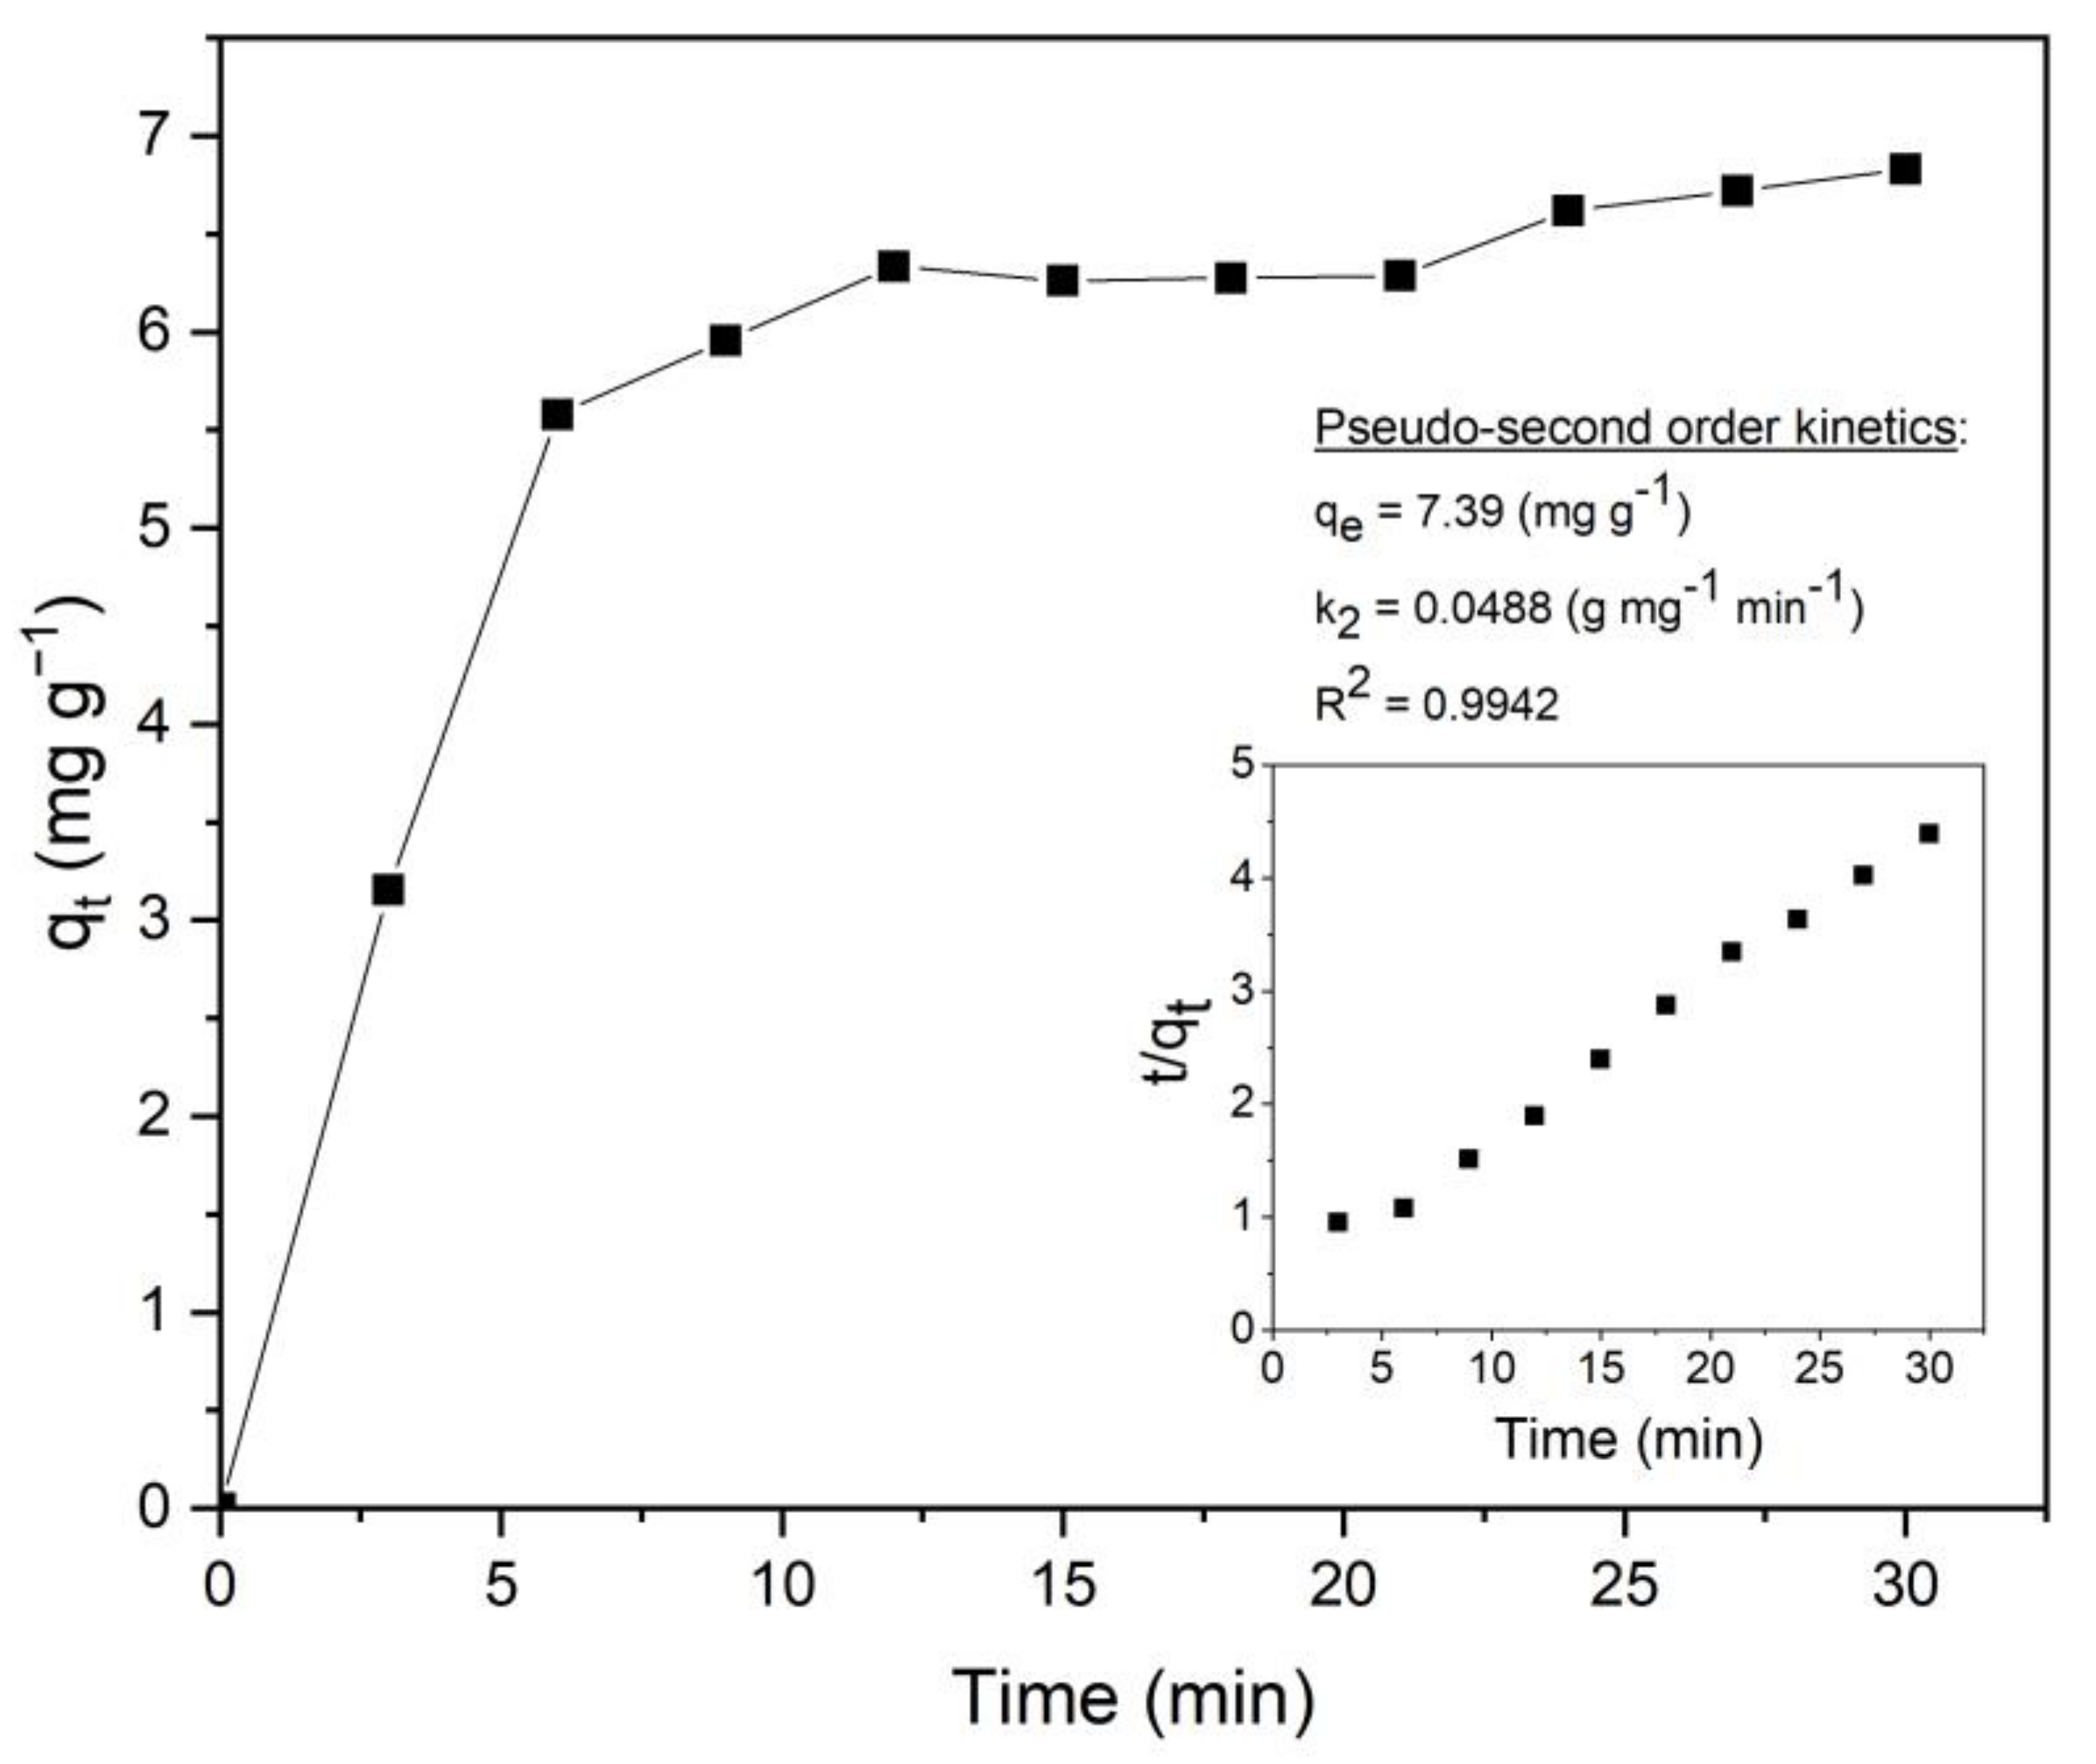
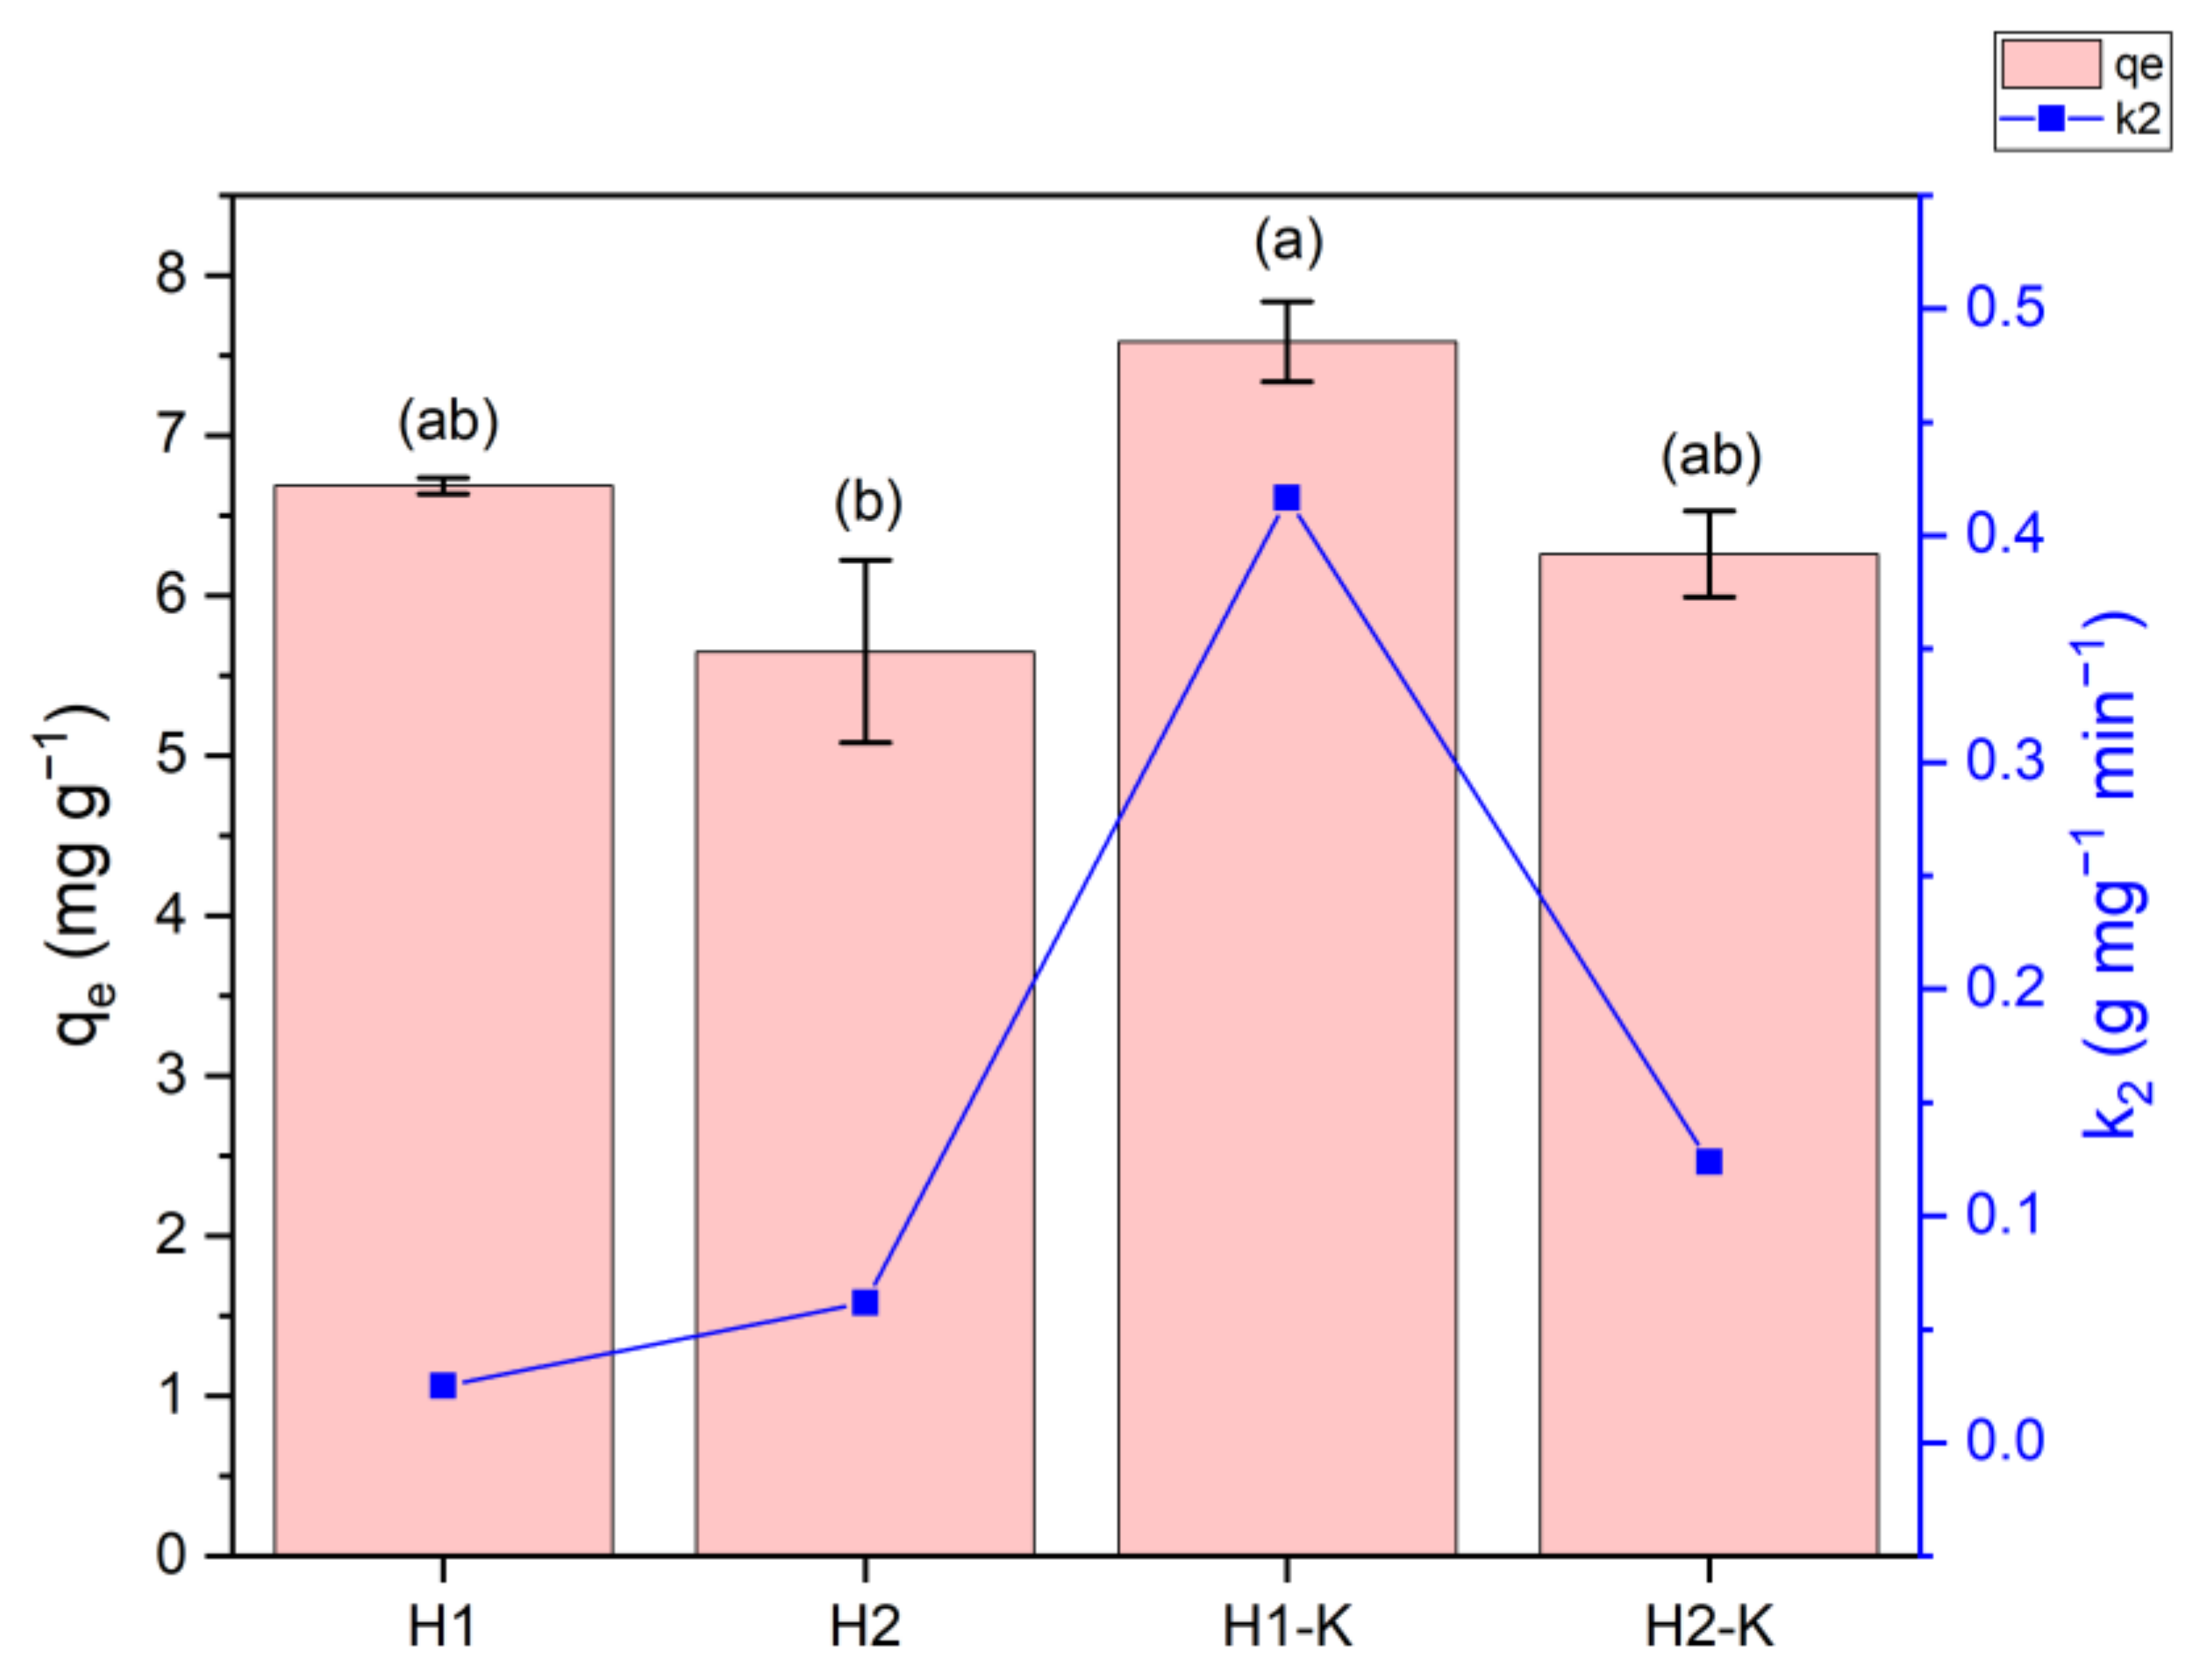
3.3. Adsorption Behavior of Optimal and Activated Hydrochars

Figure 5 indicates the qe values for the optimal and modified hydrochars used in MB adsorption. From Table 3, the hydrochar optimized based on qe values (H1) showed a predicted qe of 7.11 mg g−1, while on validation, the experimental qe was 6.82 mg g−1, which means a 4% error. On the other hand, the MY-qe-optimized hydrochar (H2) had prediction and validation qe values of 6.22 and 5.65 mg g−1, respectively, namely, an error of 9.2%. These error percentages demonstrate the proposed models are suitable for prediction within the design space, as literature reports models with acceptable prediction capability when error ranges of ±10% are usually reached [30].
Comparing the adsorption capacity of the modified materials, they indicate some statistical differences. As mentioned above, H1 shows a higher MB adsorption than H2, probably attributed to the carbonization temperature, which is higher for H1. Concerning alkali-activated hydrochars, a slight but still insignificant increment in the qe is observed compared to the pristine counterparts. However, in terms of kinetics, a significant difference is noticeable (please refer to the blue line in Figure 5), especially for the H1-K sample, which shows an eight-times higher pseudo-second-order constant (k2) than H1 (0.4166 to 0.0252 g mg−1 min−1, respectively). A minor but still considerable difference was observed for the H2 materials, showing that alkali treatment might be more efficient on hydrochars carbonized at higher temperatures. This behavior can also be associated with the measured surface areas, which are far higher in H1-K when compared to H2-K. Concerning k2, although there is no statistical difference in the amount of MB removed at the equilibrium, the alkali-treated hydrochars allow for reaching the equilibrium faster; thus, adsorption times can be considerably reduced. The largest surface area shown by the H1-K sample was also related to the highest k2 coefficient.

4. Conclusions

The individual optimization of qe and MY resulted in a dominant effect by the reaction temperature, increasing the hydrochar adsorption capacity at the equilibrium while lowering the hydrochar mass yields. At first, it was intended to produce hydrochars showing higher adsorption capacities; however, to keep reasonable hydrochar yields, it is essential to perform the HTC process at lower temperature levels. Therefore, the simultaneous MY-qe maximization scheme (HTC process at 200 °C) allowed for keeping high qe values with MY > 60%. Notice that no statistical difference was found in terms of qe values regarding H1 and H2 adsorbents, which validates the feasibility of applying this optimization scheme.
Moreover, alkali activation was also tested in H1 and H2 hydrochars to identify further improvements in the adsorption capacity. In this sense, even though no statistical differences were observed for qe values, a remarkable enhancement was found for the second-order kinetic constant, especially in the H1-K adsorbent, which means the adsorption time can be significantly reduced in this case, probably due to the larger surface area measured in this activated hydrochar.

Supplementary Materials

The following supporting information can be downloaded at: https://www.mdpi.com/article/10.3390/resources12120145/s1, Figure S1: Normal plot of residuals for MY; Figure S2: Residuals versus predicted plot for MY; Figure S3: Normal plot of residuals for qe; Figure S4: Residuals versus predicted plot for qe. Figure S5: Reactor for hydrothermal carbonization experiments. Figure S6: Rice husk used as raw material. Figure S7: Exemplary N2 adsorption and desorption isotherm for H1.

Author Contributions

Conceptualization, H.A.M., S.P. and A.D.; methodology, H.A.M., S.P., A.D., J.N., E.J., K.V., C.L. and M.R.; software, H.A.M. and S.P.; validation, H.A.M., S.P. and J.N.; formal analysis, H.A.M. and S.P.; investigation, H.A.M. and S.P.; resources, H.A.M. and S.P.; data curation, H.A.M., S.P. and C.L.; writing—original draft preparation, H.A.M., S.P., C.L., M.R., A.D. and K.V. All authors have read and agreed to the published version of the manuscript.

Funding

This research was funded by the Poligrant 2022–2023 and the Collaboration Grant 2022–2023 programs, respectively. These programs were promoted by Universidad San Francisco de Quito USFQ.

Data Availability Statement

The data presented in this study is within the document and Supplementary Materials.

Acknowledgments

The authors acknowledge the support of J.S. Proaño from USFQ for providing the rice husk treated in this work.

Conflicts of Interest

The authors declare no conflict of interest.

References

  1. Hossain, S.K.S.; Mathur, L.; Roy, P.K. Rice Husk/Rice Husk Ash as an Alternative Source of Silica in Ceramics: A Review. J. Asian Ceram. Soc. 2018, 6, 299–313. [Google Scholar] [CrossRef]
  2. Hoque, M.E.; Rashid, F.; Aziz, M. Gasification and Power Generation Characteristics of Rice Husk, Sawdust, and Coconut Shell Using a Fixed-Bed Downdraft Gasifier. Sustainability 2021, 13, 2027. [Google Scholar] [CrossRef]
  3. Pode, R.; Diouf, B.; Pode, G. Sustainable Rural Electrification Using Rice Husk Biomass Energy: A Case Study of Cambodia. Renew. Sustain. Energy Rev. 2015, 44, 530–542. [Google Scholar] [CrossRef]
  4. Palniandy, L.K.; Yoon, L.W.; Wong, W.Y.; Yong, S.T.; Pang, M.M. Application of Biochar Derived from Different Types of Biomass and Treatment Methods as a Fuel Source for Direct Carbon Fuel Cells. Energies 2019, 12, 2477. [Google Scholar] [CrossRef]
  5. Alam, M.M.; Hossain, M.A.; Hossain, M.D.; Johir, M.A.H.; Hossen, J.; Rahman, M.S.; Zhou, J.L.; Hasan, A.T.M.K.; Karmakar, A.K.; Ahmed, M.B. The Potentiality of Rice Husk-Derived Activated Carbon: From Synthesis to Application. Processes 2020, 8, 203. [Google Scholar] [CrossRef]
  6. Alvarez, J.; Lopez, G.; Amutio, M.; Bilbao, J.; Olazar, M. Upgrading the Rice Husk Char Obtained by Flash Pyrolysis for the Production of Amorphous Silica and High Quality Activated Carbon. Bioresour. Technol. 2014, 170, 132–137. [Google Scholar] [CrossRef] [PubMed]
  7. Shamsollahi, Z.; Partovinia, A. Recent Advances on Pollutants Removal by Rice Husk as a Bio-Based Adsorbent: A Critical Review. J. Environ. Manag. 2019, 246, 314–323. [Google Scholar] [CrossRef] [PubMed]
  8. Hidayat; Rahmat, A.; Nissa, R.C.; Sukamto; Nuraini, L.; Nurtanto, M.; Ramadhani, W.S. Analysis of Rice Husk Biochar Characteristics under Different Pyrolysis Temperature. IOP Conf. Ser. Earth Environ. Sci. 2023, 1201, 012095. [Google Scholar] [CrossRef]
  9. Heidari, M.; Dutta, A.; Acharya, B.; Mahmud, S. A Review of the Current Knowledge and Challenges of Hydrothermal Carbonization for Biomass Conversion. J. Energy Inst. 2019, 92, 1779–1799. [Google Scholar] [CrossRef]
  10. Reza, M.T.; Rottler, E.; Herklotz, L.; Wirth, B. Hydrothermal Carbonization (HTC) of Wheat Straw: Influence of Feedwater PH Prepared by Acetic Acid and Potassium Hydroxide. Bioresour. Technol. 2015, 182, 336–344. [Google Scholar] [CrossRef]
  11. Çatlıoğlu, F.N.; Akay, S.; Gözmen, B.; Turunc, E.; Anastopoulos, I.; Kayan, B.; Kalderis, D. Fe-Modified Hydrochar from Orange Peel as Adsorbent of Food Colorant Brilliant Black: Process Optimization and Kinetic Studies. Int. J. Environ. Sci. Technol. 2020, 17, 1975–1990. [Google Scholar] [CrossRef]
  12. Ronix, A.; Pezoti, O.; Souza, L.S.; Souza, I.P.A.F.; Bedin, K.C.; Souza, P.S.C.; Silva, T.L.; Melo, S.A.R.; Cazetta, A.L.; Almeida, V.C. Hydrothermal Carbonization of Coffee Husk: Optimization of Experimental Parameters and Adsorption of Methylene Blue Dye. J. Environ. Chem. Eng. 2017, 5, 4841–4849. [Google Scholar] [CrossRef]
  13. Jais, F.M.; Chee, C.Y.; Ismail, Z.; Ibrahim, S. Experimental Design via NaOH Activation Process and Statistical Analysis for Activated Sugarcane Bagasse Hydrochar for Removal of Dye and Antibiotic. J. Environ. Chem. Eng. 2021, 9, 104829. [Google Scholar] [CrossRef]
  14. Murillo, H.A.; Díaz-Robles, L.A.; Santander, R.E.; Cubillos, F.A. Conversion of Residual Oat Husk and Pine Sawdust by Co-Hydrothermal Carbonization towards Biofuel Production for Pellet Stoves. Ind. Crops Prod. 2021, 174, 114219. [Google Scholar] [CrossRef]
  15. Ding, D.; Ma, X.; Shi, W.; Lei, Z.; Zhang, Z. Insights into Mechanisms of Hexavalent Chromium Removal from Aqueous Solution by Using Rice Husk Pretreated Using Hydrothermal Carbonization Technology. RSC Adv. 2016, 6, 74675–74682. [Google Scholar] [CrossRef]
  16. Ding, Y.; Guo, C.; Qin, S.; Wang, B.; Zhao, P.; Cui, X. Effects of Process Water Recirculation on Yields and Quality of Hydrochar from Hydrothermal Carbonization Process of Rice Husk. J. Anal. Appl. Pyrolysis 2022, 166, 105618. [Google Scholar] [CrossRef]
  17. Hossain, N.; Nizamuddin, S.; Griffin, G.; Selvakannan, P.; Mubarak, N.M.; Mahlia, T.M.I. Synthesis and Characterization of Rice Husk Biochar via Hydrothermal Carbonization for Wastewater Treatment and Biofuel Production. Sci. Rep. 2020, 10, 18851. [Google Scholar] [CrossRef]
  18. Chen, H.; Liang, X.; Liu, Y.; Ai, X.; Asefa, T.; Zou, X. Active Site Engineering in Porous Electrocatalysts. Adv. Mater. 2020, 32, 2002435. [Google Scholar] [CrossRef]
  19. Li, H.Z.; Zhang, Y.N.; Guo, J.Z.; Lv, J.Q.; Huan, W.W.; Li, B. Preparation of Hydrochar with High Adsorption Performance for Methylene Blue by Co-Hydrothermal Carbonization of Polyvinyl Chloride and Bamboo. Bioresour. Technol. 2021, 337, 125442. [Google Scholar] [CrossRef]
  20. ISO 16948:2015; Solid Biofuels—Determination of Total Content of Carbon, Hydrogen and Nitrogen. International Organization for Standardization: Geneva, Switzerland, 2015.
  21. UNE-EN ISO 18122; Biocombustibles Sólidos: Determinación Del Contenido de Ceniza. Asociación Española de Normalización y Certificación: Barcelona, Spain, 2022.
  22. Rodriguez, Y.; Guerra, R.; Vizuete, K.; Debut, A.; Streitwieser, D.A.; Mora, J.R.; Ponce, S. Kinetic Study of the Catalytic Cracking of Waste Motor Oil Using Biomass-Derived Heterogeneous Catalysts. Waste Manag. 2023, 167, 46–54. [Google Scholar] [CrossRef]
  23. Sarwar, B.; Rahman, Z. Central Composite Designs and Their Applications in Pharmaceutical Product Development. In Design of Experiments for Pharmaceutical Product Development Volume I: Basics and Fundamental Principles; Springer: Berlin/Heidelberg, Germany, 2021; Volume 1, pp. 63–76. [Google Scholar]
  24. Reza, M.T.; Mumme, J.; Ebert, A. Characterization of Hydrochar Obtained from Hydrothermal Carbonization of Wheat Straw Digestate. Biomass Convers. Biorefinery 2015, 5, 425–435. [Google Scholar] [CrossRef]
  25. Murillo, H.A.; Pagés-Díaz, J.; Díaz-Robles, L.A.; Vallejo, F.; Huiliñir, C. Valorization of Oat Husk by Hydrothermal Carbonization: Optimization of Process Parameters and Anaerobic Digestion of Spent Liquors. Bioresour. Technol. 2022, 343, 126112. [Google Scholar] [CrossRef]
  26. Bezerra, M.A.; Ferreira, S.L.C.; Novaes, C.G.; dos Santos, A.M.P.; Valasques, G.S.; da Mata Cerqueira, U.M.F.; dos Santos Alves, J.P. Simultaneous Optimization of Multiple Responses and Its Application in Analytical Chemistry—A Review. Talanta 2019, 194, 941–959. [Google Scholar] [CrossRef] [PubMed]
  27. Fan, S.; Wang, Y.; Wang, Z.; Tang, J.; Tang, J.; Li, X. Removal of Methylene Blue from Aqueous Solution by Sewage Sludge-Derived Biochar: Adsorption Kinetics, Equilibrium, Thermodynamics and Mechanism. J. Environ. Chem. Eng. 2017, 5, 601–611. [Google Scholar] [CrossRef]
  28. Liu, C.; Wang, W.; Wu, R.; Liu, Y.; Lin, X.; Kan, H.; Zheng, Y. Preparation of Acid- And Alkali-Modified Biochar for Removal of Methylene Blue Pigment. ACS Omega 2020, 5, 30906–30922. [Google Scholar] [CrossRef] [PubMed]
  29. Capobianco, L.; Di Caprio, F.; Altimari, P.; Astolfi, M.L.; Pagnanelli, F. Production of an Iron-Coated Adsorbent for Arsenic Removal by Hydrothermal Carbonization of Olive Pomace: Effect of the Feedwater PH. J. Environ. Manag. 2020, 273, 111164. [Google Scholar] [CrossRef] [PubMed]
  30. Kang, K.; Nanda, S.; Sun, G.; Qiu, L.; Gu, Y.; Zhang, T.; Zhu, M.; Sun, R. Microwave-Assisted Hydrothermal Carbonization of Corn Stalk for Solid Biofuel Production: Optimization of Process Parameters and Characterization of Hydrochar. Energy 2019, 186, 115795. [Google Scholar] [CrossRef]
  31. Gan, M.J.; Lim, W.S.; Ng, H.X.; Ong, M.H.; Gan, S.; Lee, L.Y.; Thangalazhy-Gopakumar, S. Enhancement of Palm Kernel Shell Fuel Properties via Wet Torrefaction: Response Surface, Optimization, and Combustion Studies. Energy Fuels 2019, 33, 11009–11020. [Google Scholar] [CrossRef]
  32. Sharma, N.; Khanna, R.; Gupta, R.D.; Sharma, R. Modeling and Multiresponse Optimization on WEDM for HSLA by RSM. Int. J. Adv. Manuf. Technol. 2013, 67, 2269–2281. [Google Scholar] [CrossRef]
  33. Suteerawattananonda, N.; Kongkaew, N.; Patumsawad, S. Hydrothermal Carbonization of Rice Husk for Fuel Upgrading. IOP Conf. Ser. Mater. Sci. Eng. 2018, 297, 012007. [Google Scholar] [CrossRef]
  34. Jais, F.M.; Ibrahim, S.; Chee, C.Y.; Ismail, Z. High Removal of Crystal Violet Dye and Tetracycline by Hydrochloric Acid Assisted Hydrothermal Carbonization of Sugarcane Bagasse Prepared at High Yield. Sustain. Chem. Pharm. 2021, 24, 100541. [Google Scholar] [CrossRef]
  35. Khoshbouy, R.; Takahashi, F.; Yoshikawa, K. Preparation of High Surface Area Sludge-Based Activated Hydrochar via Hydrothermal Carbonization and Application in the Removal of Basic Dye. Environ. Res. 2019, 175, 457–467. [Google Scholar] [CrossRef] [PubMed]
  36. Jain, A.; Balasubramanian, R.; Srinivasan, M.P. Hydrothermal Conversion of Biomass Waste to Activated Carbon with High Porosity: A Review. Chem. Eng. J. 2016, 283, 789–805. [Google Scholar] [CrossRef]
  37. Ameen, M.; Zamri, N.M.; May, S.T.; Azizan, M.T.; Aqsha, A.; Sabzoi, N.; Sher, F. Effect of Acid Catalysts on Hydrothermal Carbonization of Malaysian Oil Palm Residues (Leaves, Fronds, and Shells) for Hydrochar Production. Biomass Convers. Biorefinery 2022, 12, 103–114. [Google Scholar] [CrossRef]
  38. Teng, F.; Zhang, Y.; Wang, D.; Shen, M.; Hu, D. Iron-Modified Rice Husk Hydrochar and Its Immobilization Effect for Pb and Sb in Contaminated Soil. J. Hazard Mater. 2020, 398, 122977. [Google Scholar] [CrossRef]
  39. Nizamuddin, S.; Siddiqui, M.T.H.; Baloch, H.A.; Mubarak, N.M.; Griffin, G.; Madapusi, S.; Tanksale, A. Upgradation of Chemical, Fuel, Thermal, and Structural Properties of Rice Husk through Microwave-Assisted Hydrothermal Carbonization. Environ. Sci. Pollut. Res. 2018, 25, 17529–17539. [Google Scholar] [CrossRef] [PubMed]
  40. Chakraborty, S.; Chowdhury, S.; Das Saha, P. Adsorption of Crystal Violet from Aqueous Solution onto NaOH-Modified Rice Husk. Carbohydr. Polym. 2011, 86, 1533–1541. [Google Scholar] [CrossRef]
Figure 1. MB adsorption with time (qt vs. t) and pseudo-second order plot (inset graph: t/qt vs. t).
Resources 12 00145 g001
Figure 2. RSM plots and desirability contours: (a) For MY: Temperature–Time, with B/W ratio = 0.0375; (b) For qe: Temperature–Time, with B/W ratio = 0.0375; (c) For desirability: Temperature–Time, with B/W ratio = 0.05.
Resources 12 00145 g002
Figure 3. SEM images of (a) H1, (b) H2, (c) H1-K, (d) H2-K; (e) EDS spectra of materials.
Resources 12 00145 g003
Figure 4. FTIR spectra (left) and XRD patterns (right) of the optimal and modified samples.
Resources 12 00145 g004
Figure 5. Adsorption capacity at equilibrium (qe) and pseudo-second-order constant (k2) values of the optimal and modified samples. Those values showing different letters are significantly different, p ≤ 0.05 (by a Tukey test).
Resources 12 00145 g005
Table 1. Ultimate and proximate analysis of raw rice husk.
Ultimate AnalysisProximate Analysis
C35.01Cellulose28.63
H6.41Hemicellulose *28.33
O *38.07Lignin23.59
N0.98
S0.08
Ash content19.45
* Values determined by difference. Units: wt.%, d.b.
Table 2. Range and levels for the central composite design proposed.
Factor Levels
Factor−α−10+1
Temperature (°C)183200225250267
Time (min)39.56090120140.5
B/W ratio0.01650.0250.03750.050.0585
Table 3. Design matrix including the corresponding responses.
Std.
Order
Run
Order
T: Temperature
(°C)
t: Time
(min)
W: B/W
Ratio
MY
(%)
qe
(mg g−1)
17200600.02554.664.55
215250600.02533.335.54
3142001200.02568.005.82
452501200.02534.667.67
51200600.0573.006.05
612250600.0542.676.83
742001200.0558.604.98
8112501200.0536.666.06
917183900.037569.026.59
1010267900.037531.057.42
111322539.50.037555.756.96
1216225140.50.037551.326.23
132225900.016550.004.90
143225900.058552.404.36
159225900.037547.785.06
168225900.037553.985.41
176225900.037558.395.27
Predicted optimal factors and responses and validation results
Optimal conditions for qe maximization (sample name: H1)
Prediction250600.0541.497.11
Validation 43.33 (±2.30)6.82 (±0.23)
Optimal conditions for MY and qe maximization (sample name: H2)
Prediction200600.0566.506.22
Validation 63.66 (±2.14)5.65 (±0.57)
Table 4. ANOVA table and fit statistics summary.
SourceSum of SquaresdfMean SquareF-Valuep-Value
MYqeMYqeMYqeMYqeMYqe
Model2192.1013.9435730.702.7929.0118.94<0.0001<0.0001
T: Temperature2136.062.72112136.062.7284.6018.84<0.0001 *0.0013 *
t: Time12.75-1-12.75-0.5060-0.4894-
W: B/W ratio43.30-1-43.30-1.72-0.2125-
Tt----------
TW----------
tW-3.43-1-3.43-23.31-0.0005 *
T2-3.79-1-3.79-25.72-0.0004 *
t2-2.13-1-2.13-14.46-0.0029 *
W2-0.7627-1-0.7627-5.18-0.0439 *
Residual327.461.62131125.190.1472----
Lack of Fit270.641.5611924.600.17310.86605.580.64940.1612
Pure Error56.820.06212228.410.0310----
Cor Total2519.5615.561616------
Std. dev.5.020.3837R20.87000.8959Pred. R20.77320.7021
Mean51.255.86Adj. R20.84000.8486Adeq. Precision17.279113.7114
C.V.%9.796.54
* significant model terms.
Table 5. MY and qe models in actual and coded factors.
Response VariableObtained Models
MYActual factors M Y = 161.3654 ( 0.5002 × T ) ( 0.0322 × t ) + ( 142.4416 × W )
Coded factors M Y = 51.25 ( 12.52 × T ) ( 0.9661 × t ) + ( 1.78 × W )
qeCoded factors q e = 5.26 + 0.4464 × T 0.6550 × t W + 0.5796 × T 2 + 0.4346 × t 2 ( 0.2601 × W 2 )
Table 6. The terminology used for optimal and activated hydrochars.
SampleNomenclature
qe optimal hydrochar (HTC at 250 °C, 60 min, and B/W: 0.05)H1
H1 + KOH activationH1-K
MY and qe optimal hydrochar (HTC at 200 °C, 60 min, and B/W: 0.05)H2
H2 + KOH activationH2-K
Table 7. BET surface area and ash contents of the optimal and alkali-modified hydrochars.
SampleBET Surface Area (m2 g−1)Ash Content (wt.%, d.b.)
H119.8239.52
H1-K110.6744.72
H21.4029.32
H2-K12.408.11
Disclaimer/Publisher’s Note: The statements, opinions and data contained in all publications are solely those of the individual author(s) and contributor(s) and not of MDPI and/or the editor(s). MDPI and/or the editor(s) disclaim responsibility for any injury to people or property resulting from any ideas, methods, instructions or products referred to in the content.

