Abstract
Textile industries are in the spotlight due to the heavy environmental impacts along their products’ life cycle and, at the same time, they are a priority sector in the new circular economy action plan of the European Commission. In this framework, the Italian company Manteco SpA has developed a value chain based on the recycling of pre- and post-consumer discarded textiles, wh0se output is a secondary wool fiber named MWool®. This study develops an environmental analysis of recycled wool fibers through the Life Cycle Assessment (LCA) methodology, mainly using primary data. A parallel LCA is developed of virgin wool fiber, mostly based on literature data. Sensitivity analyses have been carried out: (i) to capture the uncertainty associated with virgin fibers’ impacts and (ii) to evaluate how MWool® impacts vary according to the origin and treatment of recycled textiles. Finally, the Circular Footprint Formula (CFF) has been applied to consider also a possible decay in quality typically affecting recycled fibers. Results show that recycled wool fibers have significantly lower environmental impacts than virgin fibers, even when the most unfavorable scenarios are considered. As climate change is concerned, 1 kg of MWool® has a carbon footprint of 0.1–0.9 kg CO2 eq., while producing virgin fibers releases 10–103 kg CO2 eq. Using the CFF, it emerges that recycled wool fibers can save about 60% of the impacts of virgin fibers. This study contributes to filling data gaps regarding LCAs applied to the textile sector, which is more and more in the spotlight and needs to address these environmental issues.
1. Introduction
Textile production, use and disposal are known to be responsible for significant environmental impacts. According to a study developed by the Joint Research Centre (JRC) of the European Commission (EC) [1], the textile sector strongly contributes to the depletion of material resources and water and has a major impact on land use and climate change. Animal-based fibers and fabrics (such as wool, cashmere and silk) have been identified as responsible for particularly significant carbon and land footprints during production [2]. As a consequence, the textile sector has become a priority area in the European Green Deal [3], in the Circular Economy Action Plan [4] and in the Industrial Strategy [5].
In this framework, this work analyses the production of virgin and recycled wool fibres from an environmental perspective, using Life Cycle Assessment (LCA) methodology. LCA is standardised by the ISO 14040-44 [6,7] and further detailed guidelines have been developed by the European Commission [8,9].
Previous studies have focused on environmental aspects in the textile sector, in many cases using the LCA methodology. Life cycle inventories and results are available for products made with virgin wool [10,11,12,13] and recycled wool [14,15,16]. In particular, a very recent study by Wiedemann et al. [16] performs an analysis throughout the entire life cycle of a recycled wool blend sweater. This paper provides the inventory for each life cycle stage, even though the inventory for the recycled fibers’ production is not particularly detailed.
Besides the LCA, other tools to evaluate the environmental performances of textile products have been developed, such as the Higg Materials Sustainability Index (MSI) developed by the Sustainable Apparel Coalition (SAC), even though it presents important issues that have still to be addressed [17].
Previous literature highlighted that the environmental impact assessment of textiles, especially in the case of natural fibres, can be controversial from the point of view of the methodology. In the context of virgin wool production, a first issue is the attribution of impacts in multi-output systems, such as sheep livestock for wool and meat. As discussed in Wiedemann et al. [12] and in Sandin et al. [18], the methods for managing co-products have to be carefully decided according to the goal of the study, since the impact results can significantly change. System expansion and/or allocation procedures (based on mass, biophysical or economic criteria) have been widely employed. Wiedemann et al. [12] suggest the use of allocation based on protein requirements that are connected to both wool and meat. The impact results of wool available in the literature have a low level of accuracy. This is due not only to the methodological aspects but also to wide differences in farming practices and production efficiencies. Most studies identify the production of greasy wool as the critical phase of wool fiber production, mainly due to enteric methane emitted during sheep digestion [11,19]. However, the impact results vary widely: for Wiedemann et al. [13] 1 kg of greasy wool corresponds to 19.5–25.1 kg CO2 eq., for Eady et al. [20] it corresponds to 26.6–36.2 kg CO2 eq., for Dougherty [21] to 10.4–17.8 kg CO2 eq., for Brock et al. [22] to 24.9 kg CO2 eq., for Bech et al. [11] to 69.8 kg CO2 eq. and for Biswas [23] to 15.3–16.7 kg CO2 eq.
Recycled wool is another area in which methodological issues are under discussion. In most studies, recycled fibers or fabrics are considered as substitutes for virgin materials. However, some authors underline that it is not known if recycled textilee actually replace virgin production at a ratio of 1:1, or if they simply increase the overall demand for and consumption of textiles [14]. An additional problem is that recycled wool fibers are generally of lower quality than virgin wool fibers, mainly due to the shortening of fiber lengths [18]. It can be necessary to mix short fibers with virgin fibers to enable respinning into yarns and achieve the required quality [24,25,26]. The Circular Footprint Formula’s (CFF, [27]) attempts to capture this aspect in environmental analyses of textiles could be applied as has been discussed in detail in Wiedemann et al. [16]. However, other literature [28,29] underlines that the CFF should be used with caution, because currently it presents some important weaknesses, such as the fact that the number of cycles a material is reused for is not considered. Pre- or post-consumer waste is the raw material for recycled textiles and there is consensus in considering this waste as free of environmental burdens.
To harmonize the environmental studies and allow comparison between analogous products, category rules for the development of LCAs in the textile sector have been developed, both at the European level (for instance in the context of Product Environment Footprint—PEF and Environmental Product Declaration—EPD) and at country level (for instance the label “Made Green in Italy” or “Cardato Recycled”, developed in Italy in accordance with PEF guidelines [30,31]).
This work aims to contribute to expanding the knowledge in this field through a detailed LCA of MWool®, the recycled wool fibre produced by Manteco SpA, an Italian textile company. This paper provides raw data, impact results and sensitivity analyses to include the variability previously mentioned. The scientific literature is in fact relatively weak concerning detailed assessments of collection and recycling of pre- and post-consumer textiles.
2. Materials and Methods
This study provides a detailed environmental analysis of a secondary wool fiber, named MWool®. The study has been developed in strong collaboration with the Manteco SpA company, Montemurlo, Italy, a producer of woolen fabrics. A comparison of impacts with virgin wool fibres is also carried out.
The LCA has been modelled with the software SimaPro, version 9.2. The potential impacts of 1 kg of MWool® fibers and virgin wool fibers have been assessed with the EF 3.0 method [32], in line with the PEF and Made Green in Italy guidelines, developed by the Italian Ministry of Ecological Transition [9,30]. These latter follow the PEF guidelines and, with the product category rules on “Fabrics in carded wool or fine carded hair”, provide further indications specifically related to the Italian textile sector, such as the allocation factor and the quality ratio to be used in the CFF and the default values for data gaps (e.g., the dyeing process). The impact categories have been chosen according to the most relevant issues for the analyzed products. Specifically, the following impact categories have been selected: Climate change, Ozone depletion, Photochemical ozone formation, Particulate matter, Acidification, freshwater Eutrophication, terrestrial Eutrophication, freshwater Eco-toxicity, Land use, Water use, Resource use—fossils, Resource use—minerals and metals.
This paragraph describes the supply chain of recycled and virgin wool fibers and explains the scenarios and assumptions considered. The detailed inventory of the MWool® supply chain is available in Appendix A.
2.1. MWool® Supply Chain
MWool® fibers are produced from both pre- and post-consumer waste, respectively at a percentage of roughly 15% and 85% (data for year 2019). Pre-consumer textiles originate, for about 32% from tailoring processes (located in Eastern Europe, Turkey, Italy and North Africa) and, for about 68%, from spinning processes (located in Eastern Europe or Italy). As far as post-consumer waste is concerned, garments are collected in the USA and North Europe, where people can leave discarded clothes in special containers, packed in plastic bags. Then, they are transported to a collection center, where non-textile products are removed [15] and the rest of the textiles are gathered, packed into big bales and sent to India (85%) or Pakistan (15%). There, textiles are manually sorted according to the type of material, and accessories (such as zips, buttons, labels) are removed. Then textiles are packed into big plastic bales and sent to Prato industrial zone (Italy). Here, pre-consumer textiles from tailoring processes and post-consumer garments are sorted according to the type of treatment they will be subjected to and according to color. This passage is manual and requires time and expertise but allows avoidance of the treatment of dyeing (and the related environmental impacts). Later, the textile can be shredded or frayed to be reduced into fibers of recycled wool. The shredding is a mechanical process carried out with a machine that “opens” the fabric with teeth and blades. To reduce the resistance of the fabric while maintaining the natural elasticity of the fibers, the textiles are wetted. Finally, fibers are dried. Alternatively, to the shredding process, the pre- and post-consumer textiles can undergo the process of fraying. This is a mechanical dry process, where the textile goes through an apparatus composed of several cylinders with sharp points. In 2019, MWool® fibers were produced, for 26% through the shredding process, for 70.5% through the fraying process and 3.5% did not require any type of treatment (fibers coming from spinning waste). The GIDA (Gestione Impianti Depurazione Acque spa) company, located in Prato, Italy, manages the treatment of wastewaters originating both from civil and industrial usage. Inventory data for the wastewater treatment are taken from the EMAS certification of GIDA, updated on the 31 March 2021. Due to the COVID pandemic period and its effects on the market, data for the years 2020–2021 are not representative of an average year. For this reason, the chosen year of reference is again 2019, when the total volume of treated wastewater was 45,839,958 m3.
The flowchart in Figure 1 summarizes the value chain of MWool®, where the thickness of arrows shows the size in terms of mass flow of each pathway. Appendix A quantifies the inventory for each stage of MWool® production, also showing the proxy dataset in the Ecoinvent 3.7 database.
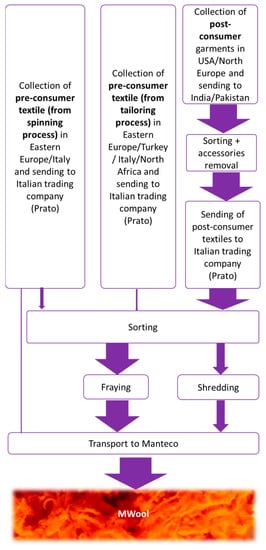
Figure 1.
Flow chart of recycled wool fibers (MWool®) production. The thickness of the arrows is proportional to the mass flow of each pathway in average operational conditions.
In addition, a sensitivity analysis has been carried out on the MWool® fibers to evaluate how stable the results are when the operational conditions (source of waste wool and treatment) are pushed towards the upper or lower range. These reflect real situations in which Manteco can, or must, sometimes operate, for instance, due to the low availability of one source. Specifically, the assessment has been developed for the following scenarios:
- MWool® produced from 100% pre-consumer waste by spinning (which is not further treated)
- MWool® produced from pre-consumer waste, 100% frayed
- MWool® produced from pre-consumer waste, 100% shredded
- MWool® produced from post-consumer waste, 100% frayed
- MWool® produced from post-consumer waste, 100% shredded
For the quantification of input/output flows, some assumptions were necessary. To calculate the distance for transport, locations of reference have been identified in each country interested in the MWool® production chain. The choice is based on considering the most active cities/areas in the textile sector or in the recycling processes. In particular, the location of reference for the clothes collection in the USA is Dalton (GA), while in North Europe it is Amsterdam. Clothes sorting in India is assumed to be located in Ahmedabad, and in Pakistan in the city of Faisalabad. The pre-consumer textile waste is assumed to be collected in Bucharest (Romania) (for the Eastern Europe share, [33]), in Istanbul (for the Turkey share), and in Alexandria (Egypt) (for the North African share, [34]). The process of clothes sorting and accessories removal is currently carried out manually in India and Pakistan. Therefore, only electricity for the conveyor belt moving the textiles (1.27 kWh/t of textile, [14]) and for lighting the working environments is considered. The lighting consumption is estimated at 11 kWh/t of sorted textiles, considering a throughput per person of 100 tons/year [35], assuming 25 people working in a 60 × 30 m2 environment, for a consumption of electricity for lighting of 15 kWh/m2y.
Pre- and post-consumer garments have been assumed to be packed into big bales of HDPE containing 400 kg of textiles.
The LCA of this study includes the processes from the cradle (in this case, the textile waste) to the MWool® fiber. However, to draw appropriate conclusions, the use of these fibers and the differences in the manufacturing processes with virgin fibers should also be clear. The recycled MWool® fibers are spun to re-obtain a wool fabric. Different kinds of spinning are generally employed for e.g., staple fibers. Specifically, combed spinning is possible only with virgin fibers (which are longer than recycled fibers), while carding and open-end spinning are also viable with recycled fibers. In turn, carded recycled textiles can be recycled into textiles several times depending on the quality of the fibers.
Therefore, MWool® is 100% composed of recycled material which can be used to produce 100% recycled textile and it is, in some measure, recyclable. Even though MWool® is an intermediate product, the part played by CFF [27] in materials has been applied to capture these aspects and the results are discussed. The application of CFF to recycled/recyclable textiles is also in line with the “Made Green in Italy” guidelines for Italian fabrics labelling [30]. Since the CFF can be arranged in a modular way, the following part of the formula is employed to capture the production burdens and the burdens and benefits related to the secondary materials input:
where:
- R1 is the proportion of material in the input to the production that has been recycled (equal to 1 in this case study);
- EV are the specific emissions and resources consumed arising from the acquisition and pre-processing of virgin material (virgin wool in this case study);
- A is the allocation factor of burdens and credits between supplier and user of recycled materials (equal to 0.5 in this case study, as indicated in [30]);
- Erecycled are the specific emissions and resources consumed arising from the recycling process of the recycled material (in this case study, impacts from collection of pre- and post-consumer textiles until the final the MWool® fiber);
- Qsin/Qp is the quality of the input secondary material divided by the quality of the primary material (equal to 0.8 in this case study, as indicated in [30]).
2.2. Virgin Wool Fibres’ Supply Chain
To understand where MWool® is positioned in terms of environmental performance, the average value chain of virgin wool fibers has been investigated through literature studies. A high variability characterizes the production of the greasy wool and, in addition, impact results can be affected by methodological assumptions (type of allocation/system expansion). The dataset chosen for comparison is taken from Ecoinvent 3.7 (Sheep fleece in the grease {RoW}|sheep production, for wool|Cut-off), showing a climate change impact of 50 kg CO2/kg. According to the literature review, the range of GHG emissions for greasy wool is 10.4–69.8 kg CO2 eq./kg, so the selected dataset falls in the upper part of that range. Recent literature [36] suggests avoiding, whenever possible, generic data from life cycle databases and using IPPC or GLEAM models when adequate data is available. However, since the goal of this study is to better understand the relative position of MWool® with respect to virgin wool fibres (i.e., generally speaking, and not with respect to a specific production of virgin wool fibres), the use of the dataset from the Ecoinvent database is certainly representative. In any case, to better understand the meaningfulness of the results, a sensitivity analysis has been developed, also calculating impacts with the lowest and highest values of the above-mentioned range.
The LCA of virgin wool fibers considers the processes of greasy wool production, cleaning of the greasy wool, and dyeing, as summarized in Figure 2. For each phase, the inventory is based on the detailed information available in the appendix of [30].
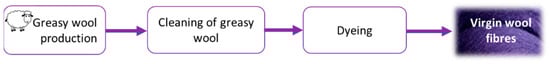
Figure 2.
Flow chart of virgin wool fibers production.
3. Results
3.1. Potential Impacts of MWool®
The potential impacts of MWool® fibers have been calculated with the EF method and are listed in Table 1. These results refer to the system boundaries associated with the production of 1 kg of recycled fibers and, at this stage, the quality of secondary fibers is not yet discussed.

Table 1.
Potential impacts of 1 kg of MWool®.
As far as climate change is concerned, the carbon footprint for 1 kg of recycled fibers is 0.63 kg CO2 eq. This result is in line with Wiedemann et al. [16], who obtained an impact of about 0.7 kg CO2 eq per kg of recycled wool fiber. In the flow chart of Figure 3, for each process of the MWool® supply chain, the cumulative impact is indicated in the box, with thicker arrows meaning higher impacts. It emerges that a high share of the impact on climate change is due to the collection of post-consumer garments with small lorries and to the transport from USA/Eastern Europe to India/Pakistan with container ships. Figure 4 shows the contribution of transport, energy and other factors (materials and waste treatments) for all the analyzed impact categories. For all categories, except water use, transport is responsible for the highest contribution (from 58% for freshwater eutrophication to 92% for photochemical ozone formation, acidification and terrestrial eutrophication). For water use, a not negligible contribution (16%) is due to the water used in the shredding process.
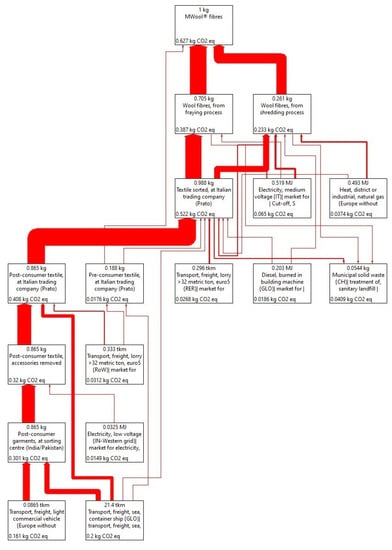
Figure 3.
Carbon footprint of 1 kg of MWool®, with emphasis on the main contributors (>2% of total impact) along the recycling chain.
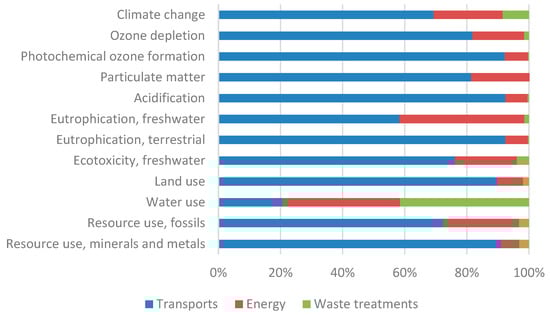
Figure 4.
Contribution of transport, energy and materials and waste treatments to selected impacts of MWool®.
A sensitivity analysis has been developed to evaluate how the impacts change in the upper or lower range of operational conditions that Manteco can control, with MWool® produced from a single source (pre- or post-consumer waste), or in the case of different treatments (no treatment, fraying and spinning). Even though collection and transportation routes are clearly an environmental bottleneck, unfortunately, the limited data availability does not allow a proper sensitivity analysis of that aspect.
As can be noticed from the graph in Figure 5, for all impact categories (except freshwater eutrophication and water use), MWool® from pre-consumer textile waste always shows lower impacts than MWool® from post-consumer garments. This result is mainly due to the longer distance that post-consumer garments must cover. As expected, MWool® from spinning waste (which does not require further treatments) has the best environmental performance (0.098 kg CO2 eq./kg). For both pre- and post-consumer textile, the fraying treatment has lower impacts than the shredding, since the latter requires a significantly higher amount of energy. With an emphasis on climate change, the impact of MWool® from pre-consumer spinning waste has results about 10 times lower than those of MWool® from shredded post-consumer garments, while the difference between the impact of shredded pre-consumer waste (0.551 kg CO2 eq./kg) and frayed post-consumer waste (0.592 kg CO2 eq./kg) is limited. It is relevant to notice that, even in the worst scenario (fibers from shredded post-consumer waste), the impact of MWool® on climate change (0.936 kg CO2 eq./kg) is limited.
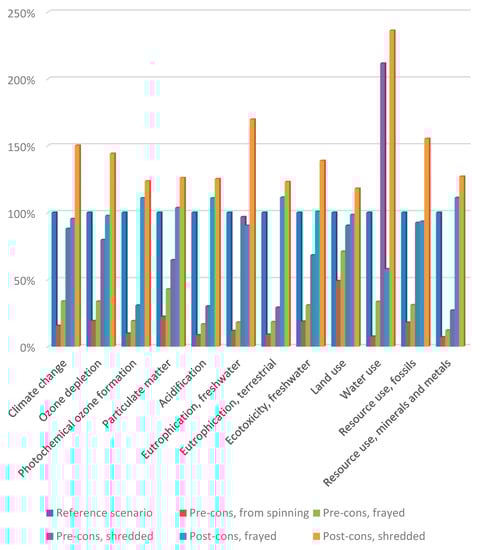
Figure 5.
Relative comparison of impacts for the selected scenarios (reference scenario is set as 100%).
3.2. Potential Impacts of Virgin Wool Fibers
The impact of virgin wool fibers has been calculated with secondary data to allow a comparison with recycled wool fibers. Literature underlines that a high share of impacts is due to the sheep fleece, whose impact can range from 10.4 to 69.8 kg CO2 eq./kg. Table 2 provides impacts of 1 kg of virgin wool fibers calculated with the EF method, where the Ecoinvent dataset is used for the production of sheep fleece.
Table 2.
Potential impacts of 1 kg of virgin wool fibers.
As far as climate change is concerned, the impact for 1 kg of virgin fibers is 75.8 kg CO2 eq. The graph in Figure 6 shows the contribution of sheep fleece, energy, transport and others (materials, waste treatment) for all the selected impact categories. As can be noticed, in line with literature results, the sheep fleece is the main contributor to all the impact categories (from 48% for ozone depletion and resource use—fossils to 99.9% for land use). This is mainly due to enteric fermentation and feed production. For the climate change impact category, a sensitivity analysis has been carried out considering the lowest and highest values for the impact of greasy wool found in the literature. Results show that the impact of 1 kg of virgin wool fibers decreases to 19.8 kg CO2 eq./kg with the lowest value and increases to 103 kg CO2 eq./kg with the highest value.
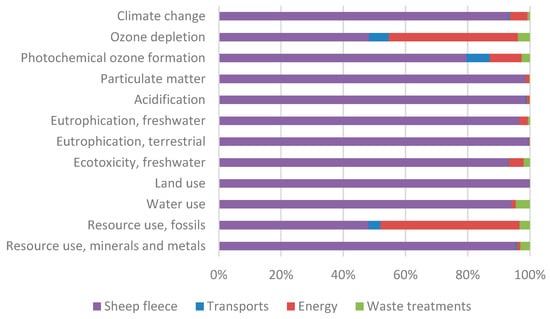
Figure 6.
Contribution of sheep fleece, transport, energy and materials and waste treatments (“other”) to the total impact of virgin wool fibres, for the selected impact categories.
3.3. Comparison of MWool® and Virgin Wool Fibers
As can be observed from the values of impacts listed in Table 1 and Table 2, the production of MWool® has significantly lower impacts than the production of virgin wool fibers. However, the direct comparison between recycled and virgin fibers could be questionable because of the different quality (mainly the length) of the fiber. Even though literature highlights that the CFF should still be enhanced, this formula has been applied to evaluate how the quality can affect the impact results and, consequently, the comparison between primary and secondary fibers. Figure 7 graphically shows the comparison of impacts between virgin fibers and recycled fibers (calculated with and without CFF as expressed in Equation (1)).
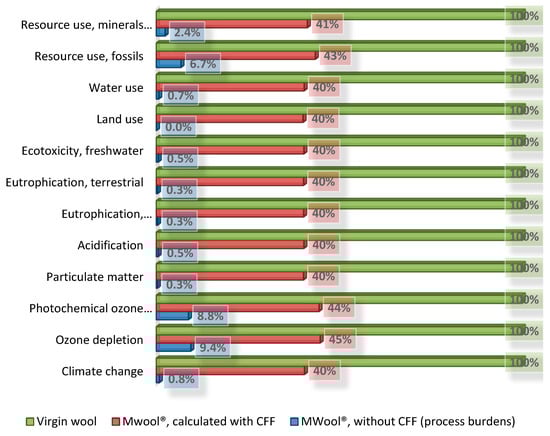
Figure 7.
Comparison of potential impacts of virgin wool, MWool® calculated with CFF, and MWool® calculated without CFF (just process burdens).
As can be noticed, impacts of MWool® results are higher when calculated with CFF. However, also using the CFF, MWool® shows significantly better environmental performances than virgin wool fibers: for all the analyzed indicators, impacts of recycled fibers are about 60% less than impacts of virgin wool fibers.
Using the CFF, the impact of secondary fibers is partially related to the impact of virgin fibers (Ev in the formula of Equation (1)). For the climate change impact category, impacts of MWool® were calculated with the CFF considering both the minimum and the maximum values of impacts of virgin fibers discussed in Section 3.2. As can be observed from the results (Table 3), also in these cases the MWool® performs around 60% better than virgin fibers.
Table 3.
Potential impacts of 1 kg of MWool® (calculated with CFF), in relation to the minimum and maximum values of impacts on climate change for virgin wool fibers.
4. Discussion and Conclusions
The recycling of pre- and post-consumer textiles to produce secondary wool fibers has been analyzed from the environmental point of view, with specific reference to the supply chain of MWool®, produced by the Italian company Manteco SpA. This study provides a specific inventory on the collection and recycling of wool waste, which, in the previous literature [16], was not very detailed. In addition, a goal of the study is to quantify how much the impacts of recycled wool fibers are lower than virgin wool.
As underlined in the literature and confirmed in this study, methodological choices and variables of the involved processes can significantly affect the results of both virgin and recycled wool fibers. For this reason, two sensitivity analyses have been developed, to consider the uncertainty on: (i) impact of virgin fibers (that, for climate change, ranges from 10.4 to 69.8 kg CO2 eq./kg) and (ii) for MWool®, the origin (pre- or post-consumer textile waste) and treatment (not treated/fraying/shredding) of recycled textiles.
Results show that the value chain of MWool® creates much lower impacts than the value chain of virgin wool fibers, even in the worst scenarios.
In conclusion, MWool® 100% obtained from shredded post-consumer garments (worst scenario for recycled wool fibers) has a carbon footprint of 0.9 kg CO2 eq./kg, while virgin fibers have an impact of 10.4 kg CO2 eq./kg in the best scenario, 75.8 kg CO2 eq./kg in the reference scenario, 103 kg CO2 eq./kg in the worst scenario.
However, some authors argue that the lower quality of recycled fibers, mostly in terms of shorter fibers in comparison to virgin ones, should be considered. To address this aspect, the CFF developed by the European Commission in the context of PEF, has been tested. Potential impacts of MWool® fibers increase sensibly when the CFF is used, but, also, in this case, the recycled fiber presents important environmental benefits (impacts are about 40% of those generated by virgin wool fibers).
This study required several assumptions to fill data gaps, mainly on the specific locations of collection and sorting centres in the USA, Europe, India, Pakistan, Turkey, and Eastern Europe. Other assumptions concern the means of transportation, the waste textile packaging and the energy used in India and Pakistan to remove accessories. Nevertheless, all the above assumptions can be considered fairly representative of the collection network and recycling chain, and so the result of the impacts of MWool®.
Similarly to most LCAs, the study could be further fine-tuned with more detailed primary data. In the near future, the LCI of MWool® will be extended to Manteco’s high-standard textile products.
Author Contributions
Conceptualization, I.B. and G.A.B.; Funding acquisition, I.B., R.G. and G.A.B.; Investigation, I.B. and R.G.; Methodology, I.B. and G.A.B.; Project administration, G.A.B. Resources, G.P. and G.A.B.; Software, I.B.; Supervision, G.A.B.; Validation, I.B., R.G. and G.A.B.; Visualization, I.B.; Writing—original draft, I.B.; Writing—review & editing, R.G., G.P. and G.A.B. All authors have read and agreed to the published version of the manuscript.
Funding
This research received no external funding.
Conflicts of Interest
The authors declare no conflict of interest. The funder collaborated for the provision of primary inventory data.
Appendix A
Table A1, Table A2, Table A3, Table A4, Table A5, Table A6 and Table A7 detail the inventory of the MWool® production process, starting from the collection of pre- and post-consumer textile wastes. The proxy with the Ecoinvent dataset used for the LCA development is also specified. Sometimes notes are added to give further indications.
Table A1.
Inventory for the phase of collection of post-consumer garments in the USA/North Europe and sending to India/Pakistan.
Table A1.
Inventory for the phase of collection of post-consumer garments in the USA/North Europe and sending to India/Pakistan.
| Flow [Unit of Measure] | Quantity | Proxy in Ecoinvent |
|---|---|---|
| Output | ||
| Post-consumer garments, at sorting centre (India/Pakistan) [t] | 1 | - |
| Inputs | ||
| Plastic bags [kg] | 1.6 | Packaging film, low-density polyethylene {GLO}| market for|Cut-off, S |
| Transport with small lorry [tkm] 1 | 100 | Transport, freight, light commercial vehicle {Europe without Switzerland}|market for transport, freight, light commercial vehicle|Cut-off, S |
| Electricity in USA [kWh] | 2.6 | Electricity, medium voltage {US}|market group for|Cut-off, S |
| Electricity in North Europe [kWh] | 2.6 | Electricity, medium voltage {NL}|market for|Cut-off, S |
| Big bales [kg] | 1.1 | Polyethylene, high density, granulate {GLO}|market for|Cut-off, S + Extrusion, plastic film {GLO}|market for|Cut-off, S |
| Transport with 16–32 t lorry [tkm] 2 | 92 | Transport, freight, lorry 16–32 metric ton, euro5 {RoW}|market for transport, freight, lorry 16–32 metric ton, EURO5|Cut-off, S |
| Transport with transoceanic ship [tkm] 2 | 14,798 | Transport, freight, sea, container ship {GLO}|transport, freight, sea, container ship|Cut-off, S |
| Waste: plastic [kg] | 2.7 | Waste plastic, mixture {RoW}|treatment of waste plastic, mixture, municipal incineration|Cut-off, S |
1 Transport from containers to collection centre. 2 Average transport from USA/north Europe to India/Pakistan.
Table A2.
Inventory for the phase of sorting and accessories removal of post-consumer garments and sending to Italy.
Table A2.
Inventory for the phase of sorting and accessories removal of post-consumer garments and sending to Italy.
| Flow [Unit of Measure] | Quantity | Proxy in Ecoinvent |
|---|---|---|
| Output | ||
| Post-consumer textile, accessories removed, transported to Italy [t] | 1 | - |
| Inputs | ||
| Post-consumer garments, at sorting centre [t] | 1 | |
| Electricity in Pakistan [kWh] | 1.84 | Electricity, low voltage {PK}|market for electricity, low voltage|Cut-off, S |
| Electricity in India [kWh] | 10.4 | Electricity, low voltage {IN-Western grid}|market for electricity, low voltage|Cut-off, S |
| Big bales [kg] | 1.1 | Polyethylene, high density, granulate {GLO}|market for|Cut-off, S + Extrusion, plastic film {GLO}|market for|Cut-off, S |
| Transport with >32 t lorry [tkm] 1 | 201 | Transport, freight, lorry > 32 metric ton, euro5 {RoW}|market for transport, freight, lorry > 32 metric ton, EURO5|Cut-off, S |
| Transport with transoceanic ship [tkm] 1 | 8837 | Transport, freight, sea, container ship {GLO}|transport, freight, sea, container ship|Cut-off, S |
1 Average transport from India/Pakistan to Manteco SpA.
Table A3.
Inventory for the sending of pre-consumer textile in Italy.
Table A3.
Inventory for the sending of pre-consumer textile in Italy.
| Flow [Unit of Measure] | Quantity | Proxy in Ecoinvent |
|---|---|---|
| Output | ||
| Pre-consumer textile, at Italian trading company (Prato) [t] | 1 | - |
| Inputs | ||
| Pre-consumer textile [t] | 1 | |
| Big bales [kg] | 1.1 | Polyethylene, high density, granulate {GLO}|market for|Cut-off, S + Extrusion, plastic film {GLO}|market for|Cut-off, S |
| Transport with >32 t lorry [tkm] 1 | 848 | Transport, freight, lorry > 32 metric ton, euro5 {RoW}|market for transport, freight, lorry > 32 metric ton, EURO5|Cut-off, S |
| Transport with transoceanic ship [tkm] 1 | 1144 | Transport, freight, sea, container ship {GLO}|transport, freight, sea, container ship|Cut-off, S |
1 Average transport from Eastern Europe/Turkey/Italy/North Africa to Manteco SpA.
Table A4.
Inventory for the phase of pre- and post-consumer sorting.
Table A4.
Inventory for the phase of pre- and post-consumer sorting.
| Flow [Unit of Measure] | Quantity | Proxy in Ecoinvent |
|---|---|---|
| Output | ||
| Textile sorted, at Italian trading company (Prato) [t] | 1 | - |
| Inputs | ||
| Post-consumer textile, at Italian trading company (Prato) [t] | 1.03 × 0.85 = 0.876 | |
| Pre-consumer textile, at Italian trading company (Prato) [t] | 1.03 × 0.15 = 0.155 | |
| Electricity [kWh] | 42.11 | Electricity, medium voltage {IT}|market for|Cut-off, S |
| Natural gas [MJ] | 42 | Heat, district or industrial, natural gas {Europe without Switzerland}|heat production, natural gas, at industrial furnace low-NOx > 100 kW|Cut-off, S |
| Diesel [MJ] | 168 | Diesel, burned in building machine {GLO}|market for|Cut-off, S |
| Water [m3] | 0,27 | Tap water {RER}|market group for|Cut-off, S |
| Transport with >32 t lorry [tkm] | 300 | Transport, freight, lorry > 32 metric ton, euro5 {RER}|market for transport, freight, lorry > 32 metric ton, EURO5|Cut-off, S |
| Transport with transoceanic ship [tkm] | 10,000 | Transport, freight, sea, container ship {GLO}|transport, freight, sea, container ship|Cut-off, S |
| Waste: plastic [kg] | 1.1 | Waste plastic, mixture {CH}|treatment of, municipal incineration|Cut-off, S |
| Waste: textile [kg] | 32 | Municipal solid waste {CH}|treatment of, sanitary landfill|Cut-off, S |
Table A5.
Inventory for the shredding process.
Table A5.
Inventory for the shredding process.
| Flow [Unit of Measure] | Quantity | Proxy in Ecoinvent |
|---|---|---|
| Output | ||
| Wool fibres, from shredding process [t] | 1 | - |
| Inputs | ||
| Textile sorted, at Italian trading company [t] | 1.03 | |
| Electricity [kWh] | 391 | Electricity, medium voltage {IT}|market for|Cut-off, S |
| Natural gas [MJ] | 1729 | Heat, district or industrial, natural gas {Europe without Switzerland}| heat production, natural gas, at industrial furnace low-NOx > 100 kW|Cut-off, S |
| Diesel [MJ] | 141 | Diesel, burned in building machine {GLO}|market for|Cut-off, S |
| Water [m3] | 1.33 | Tap water {RER}| market group for|Cut-off, S |
| No foam agent | 3.83 | Silicone product {RER}| market for silicone product|Cut-off, S |
| Transport with >32 t lorry [tkm] | 300 | Transport, freight, lorry > 32 metric ton, euro5 {RER}|market for transport, freight, lorry > 32 metric ton, EURO5|Cut-off, S |
| Transport with transoceanic ship [tkm] | 10,000 | Transport, freight, sea, container ship {GLO}|transport, freight, sea, container ship|Cut-off, S |
| Waste: plastic [kg] | 1.1 | Waste plastic, mixture {CH}|treatment of, municipal incineration|Cut-off, S |
| Waste: textile [kg] | 32 | Municipal solid waste {CH}|treatment of, sanitary landfill|Cut-off, S |
Table A6.
Inventory for the fraying process.
Table A6.
Inventory for the fraying process.
| Flow [Unit of Measure] | Quantity | Proxy in Ecoinvent |
|---|---|---|
| Output | ||
| Wool fibres, from faying process [t] | 1 | - |
| Inputs | ||
| Textile sorted, at Italian trading company [t] | 1.02 | |
| Electricity [kWh] | 0.19 | Electricity, medium voltage {IT}|market for|Cut-off, S |
| Transport with lorry [tkm] | 20 | Transport, freight, lorry 7.5–16 metric ton, euro5 {RER}|market for transport, freight, lorry 7.5–16 metric ton, EURO5|Cut-off, S |
| Waste: iron [kg] | 7.09 | Iron scrap, sorted, pressed {RER}|sorting and pressing of iron scrap|Cut-off, S + Avoided product: Pig iron {RoW}|pig iron production|Cut-off, S |
| Waste: textile [kg] | 22.83 | Municipal solid waste {CH}|treatment of, sanitary landfill|Cut-off, S |
Table A7.
Inventory for the wastewater treatment.
Table A7.
Inventory for the wastewater treatment.
| Flow [Unit of Measure] | Quantity | Proxy in Ecoinvent |
|---|---|---|
| Output | ||
| Wastewater treated [m3] | 1 | - |
| Inputs | ||
| Wastewater [m3] | 1 | |
| Electricity [kWh] | 0.699 | Electricity, medium voltage {IT}|market for|Cut-off, S |
| Natural gas [Sm3] | 0.041 | Heat, district or industrial, natural gas {Europe without Switzerland}| heat production, natural gas, at industrial furnace low-NOx > 100 kW|Cut-off, S |
| Diesel [MJ] | 0.098 | Diesel, burned in building machine {GLO}|market for|Cut-off, S |
| Gasoline [MJ] | 0.0017 | Petrol, unleaded, burned in machinery {GLO}|market for petrol, unleaded, burned in machinery|Cut-off, S |
| LPG [MJ] | 0.00032 | Heat, central or small-scale, natural gas {GLO}|propane extraction, from liquefied petroleum gas|Cut-off, S |
| Aluminium trichloride [g] | 25.60 | Aluminium chloride {GLO}|market for aluminium chloride|Cut-off, S |
| Citric acid [g] | 0.33 | Citric acid {RER}|production|Cut-off, S |
| Sulfuric acid 50% [g] | 0.43 | Sulfuric acid {RER}| market for sulfuric acid|Cut-off, S + Tap water {RER}|market group for|Cut-off, S |
| Sulfuric acid 96% [g] | 0.07 | Sulfuric acid {RER}|market for sulfuric acid|Cut-off, S + Tap water {RER}|market group for|Cut-off, S |
| Hydrogen peroxide [g] | 0.25 | Hydrogen peroxide, without water, in 50% solution state {RER}| hydrogen peroxide production, product in 50% solution state|Cut-off, S + Tap water {RER}|market group for|Cut-off, S |
| No foam agent [g] | 1.13 | Silicone product {RER}|market for silicone product|Cut-off, S |
| Ferric chloride [g] | 24.60 | Iron (III) chloride, without water, in 40% solution state {GLO}|market for|Cut-off, S |
| Bleaching agent [g] | 5.71 | Sodium dithionite, anhydrous {RER}|market for sodium dithionite, anhydrous|Cut-off, S |
| Sodium hydroxide 50% [g] | 1.57 | Sodium hydroxide, without water, in 50% solution state {GLO}|market for|Cut-off, S + Tap water {RER}|market group for|Cut-off, S |
| Sodium hypochlorite 15% [g] | 2.37 | Sodium hypochlorite, without water, in 15% solution state {RER}|market for sodium hypochlorite, without water, in 15% solution state|Cut-off, S + Tap water {RER}|market group for|Cut-off, S |
| Oxygen [g] | 0.12 | Oxygen, liquid {RER}|market for|Cut-off, S |
| Anionic polyelectrolyte [g] | 1.34 | Polyacrylamide {GLO}|market for|Cut-off, S |
| Cationic polyelectrolyte [g] | 5.03 | Polyacrylamide {GLO}|market for|Cut-off, S |
| Urea [g] | 0.05 | Urea {RER}|market for urea|Cut-off, S |
References
- Beton, A.; Dias, D.; Farrant, L.; Gibon, T.; Le Guern, Y.; Desaxce, M.; Perwueltz, A.; Boufateh, I.; Wolf, O.; Kougoulis, I.; et al. Environmental Improvement Potential of Textiles (IMPRO Textiles); Publications Office of the European Union: Luxembourg, 2014. [Google Scholar]
- Manshoven, S.; Christis, M.; Vercalsteren, A.; Arnold, M.; Nicolau, M.; Lafond, E.; Mortensen, L.; Coscieme, L. Textiles and the Environment in a Circular Economy; European Environmental Agency: Mol, Belgium, 2019. [Google Scholar]
- European Commission. Delivering the European Green Deal; European Commission: Brussels, Belgium, 2021. [Google Scholar]
- European Commission. A New Circular Economy Action Plan for a Cleaner and More Competitive Europe; European Commission: Brussels, Belgium, 2020. [Google Scholar]
- European Commission. A New Industrial Strategy for Europe; COM 102 Final; European Commission: Brussels, Belgium, 2020. [Google Scholar]
- EN ISO 14040:2006; Valutazione del Ciclo di vita Principi e Quadro di Riferimento. International Standards Organization: Geneva, Switzerland, 2006.
- ISO 14044: 2006; The International Standards Organisation Environmental Management—Life Cycle Assessment—Requirements and Guidelines. International Standards Organization: Geneva, Switzerland, 2006; Volume 2006, pp. 652–668. [CrossRef]
- Wolf, M.-A.; Chomkhamsri, K.; Brandao, M.; Pant, R.; Ardente, F.; Pennington, D.W.; Manfredi, S.; de Camillis, C.; Goralczyk, M. ILCD Handbook—General Guide for Life Cycle Assessment—Detailed Guidance, 1st ed.; Via E. Fermi: Ispra, Italy, 2010. [Google Scholar]
- Manfredi, S.; Allacker, K.; Pelletier, N.; Chomkhamsri, K.; de Souza, D.M. Product Environmental Footprint (PEF) Guide; European Commission Joint Research Centre: Ispra, Italy, 2012. [Google Scholar]
- Barber, A.; Pellow, G. LCA: New Zealand merino wool total energy use. In Proceedings of the 5th Australian Life Cycle Assessment Society (ALCAS) Conference, Melbourne, Australia, 22–24 November 2006; pp. 22–24. [Google Scholar]
- Bech, N.M.; Birkved, M.; Charnley, F.; Laumann Kjaer, L.; Pigosso, D.C.A.; Hauschild, M.Z.; McAloone, T.C.; Moreno, M. Evaluating the Environmental Performance of a Product/Service-System Business Model for Merino Wool Next-to-Skin Garments: The Case of Armadillo Merino®. Sustainability 2019, 11, 5854. [Google Scholar] [CrossRef] [Green Version]
- Wiedemann, S.; Ledgard, S.; Henry, B.K.; Yan, M.-J.; Mao, N.; Russell, S. Application of life cycle assessment to sheep production systems: Investigating co-production of wool and meat using case studies from major global producers. Int. J. Life Cycle Assess. 2015, 20, 463–476. [Google Scholar] [CrossRef] [Green Version]
- Wiedemann, S.G.; Yan, M.-J.; Henry, B.K.; Murphy, C.M. Resource use and greenhouse gas emissions from three wool production regions in Australia. J. Clean. Prod. 2016, 122, 121–132. [Google Scholar] [CrossRef] [Green Version]
- Dahlbo, H.; Aalto, K.; Eskelinen, H.; Salmenperä, H. Increasing textile circulation—Consequences and requirements. Sustain. Prod. Consum. 2017, 9, 44–57. [Google Scholar] [CrossRef]
- Spathas, T. The Environmental Performance of High Value Recycling for the Fashion Industry. Master’s Thesis, Chalmers University of Technology, Gothenburg, Sweden, 2017. [Google Scholar]
- Wiedemann, S.G.; Biggs, L.; Clarke, S.J.; Russell, S.J. Reducing the Environmental Impacts of Garments through Industrially Scalable Closed-Loop Recycling: Life Cycle Assessment of a Recycled Wool Blend Sweater. Sustainability 2022, 14, 1081. [Google Scholar] [CrossRef]
- Watson, K.J.; Wiedemann, S.G. Review of Methodological Choices in LCA-Based Textile and Apparel Rating Tools: Key Issues and Recommendations Relating to Assessment of Fabrics Made From Natural Fibre Types. Sustainability 2019, 11, 3846. [Google Scholar] [CrossRef] [Green Version]
- Sandin, G.; Peters, G.M. Environmental impact of textile reuse and recycling—A review. J. Clean. Prod. 2018, 184, 353–365. [Google Scholar] [CrossRef]
- Wiedemann, S.G.; Biggs, L.; Nebel, B.; Bauch, K.; Laitala, K.; Klepp, I.G.; Swan, P.G.; Watson, K. Environmental impacts associated with the production, use, and end-of-life of a woollen garment. Int. J. Life Cycle Assess 2020, 25, 1486–1499. [Google Scholar] [CrossRef]
- Eady, S.; Carre, A.; Grant, T. Life cycle assessment modelling of complex agricultural systems with multiple food and fibre co-products. J. Clean. Prod. 2012, 28, 143–149. [Google Scholar] [CrossRef]
- Dougherty, H.C. Mechanistic Modeling & Life Cycle Assessment of Environmental Impacts of Beef Cattle & Sheep Production; University of California: Davis, CA, USA, 2018; ISBN 0355967944. [Google Scholar]
- Brock, P.M.; Graham, P.; Madden, P.; Alcock, D.J. Greenhouse gas emissions profile for 1 kg of wool produced in the Yass Region, New South Wales: A Life Cycle Assessment approach. Anim. Prod. Sci. 2013, 53, 495–508. [Google Scholar] [CrossRef]
- Biswas, W.K.; Graham, J.; Kelly, K.; John, M.B. Global warming contributions from wheat, sheep meat and wool production in Victoria, Australia—A life cycle assessment. J. Clean. Prod. 2010, 18, 1386–1392. [Google Scholar] [CrossRef]
- Köhler, A.; Watson, D.; Trzepacz, S.; Löw, C.; Liu, R.; Danneck, J.; Konstantas, A.; Donatello, S.; Faraca, G. Circular Economy Perspectives in the EU Textile Sector; Publications Office of the European Union: Luxembourg, 2021; ISBN 9276386467. [Google Scholar]
- Lindström, K.; Sjöblom, T.; Persson, A.; Kadi, N. Improving Mechanical Textile Recycling by Lubricant Pre-Treatment to Mitigate Length Loss of Fibers. Sustainability 2020, 12, 8706. [Google Scholar] [CrossRef]
- Roos, S.; Sandin, G.; Peters, G.; Spak, B.; Schwarz Bour, L.; Perzon, E.; Jönsson, C. White Paper on Textile Recycling. Mistra Future Fashion Mölndal (Mistra Future Fashion report number: 2019:09). 2020, Volume 2. Available online: http//mistrafuturefashion.com/wpcontent/uploads/2019/10/S.-Roos.-White-paper-on-textile-recycling.-Mistra-Future-Fashion.pdf (accessed on 25 February 2022).
- European Commission. Commission Recommendation on the Use of the Environmental Footprint Methods to Measure and Communicate the Life Cycle Environmental Performance of Products and Organisations; European Commission: Brussels, Belgium, 2021. [Google Scholar]
- Schrijvers, D.L.; Loubet, P.; Weidema, B.P. To what extent is the Circular Footprint Formula of the Product Environmental Footprint Guide consequential? J. Clean. Prod. 2021, 320, 128800. [Google Scholar] [CrossRef]
- Pedersen, E.; Remmen, A. Challenges with product environmental footprint: A systematic review. Int. J. Life Cycle Assess 2022, 27, 342–352. [Google Scholar] [CrossRef]
- Confindustria Toscana Nord. Schema Nazionale Volontario “Made Green in Italy”. In Regole di Categoria di Prodotto (RCP): Tessuti in lana Cardata o Peli Fini Cardati; Confindustria Toscana Nord: Pistoia, Italy, 2021; p. 40. [Google Scholar]
- Testa, F.; Nucci, B.; Iraldo, F.; Appolloni, A.; Daddi, T. Removing obstacles to the implementation of LCA among SMEs: A collective strategy for exploiting recycled wool. J. Clean. Prod. 2017, 156, 923–931. [Google Scholar] [CrossRef]
- Fazio, S.; Biganzoli, F.; De Laurentiis, V.; Zampori, L.; Sala, S.; Diaconu, E. Supporting Information to the Characterisation Factors of Recommended EF Life Cycle Impact Assessment Methods; Publications Office of the European Union: Luxembourg, 2018. [Google Scholar] [CrossRef]
- Şerbănel, C. Romanian textile industry and its competitive advantage. SEA–Pract. Appl. Sci. 2014, 2, 395–404. [Google Scholar]
- Kashiwagi, K.; Iwasaki, E. Effect of agglomeration on technical efficiency of small and medium-sized garment firms in Egypt. Afr. Dev. Rev. 2020, 32, 14–26. [Google Scholar] [CrossRef]
- Humpston, G.; Willis, P.; Tyler, D.; Han, S. Technologies for Sorting End of Life Textiles; Waste and Resources Action Programme: Oxon, UK, 2014. [Google Scholar]
- Bhatt, A.; Abbassi, B. Review of environmental performance of sheep farming using life cycle assessment. J. Clean. Prod. 2021, 293, 126192. [Google Scholar] [CrossRef]
Publisher’s Note: MDPI stays neutral with regard to jurisdictional claims in published maps and institutional affiliations. |
© 2022 by the authors. Licensee MDPI, Basel, Switzerland. This article is an open access article distributed under the terms and conditions of the Creative Commons Attribution (CC BY) license (https://creativecommons.org/licenses/by/4.0/).