1. Introduction
Saudi Arabia, being in the arid region, faces serious water issues and needs the latest techniques and methods to cope with the water demand in terms of the availability of water during its hot and dry climate. The shortage of water adversely hits all the agricultural, industrial, and domestic activities simultaneously. In the past few decades, there has been an increase in the awareness of water shortage, courtesy of the sharp incremental trend of research in this field [
1,
2]. This all started with the initiative of the Kingdom in establishing an exclusive authority, the Ministry of Agriculture and Water, in 1953, whose sole purpose was to study and research the water resources and agriculture of the Kingdom and work on its improvement. After various evaluations, today, the ministry is known as the Ministry of Environment, Water, and Agriculture [
3]. The ministry is performing well for the preservation of water and the environment and improvement in agriculture, including presenting the latest methods and techniques, collecting and analyzing data, preparing administrative frameworks, etc. [
3].
There are three major sources of water in Saudi Arabia, namely groundwater, seawater, and rainwater. Groundwater as the major source is found in good quantity in Saudi Arabia near the coastal regions, but it has been in use for a very long time now, and it is feared that the groundwater reserve might be nearing depletion, as it has been reported in various regions that the water table depth has gone down as compared to the previous year’s observations [
4]. Regarding the use of seawater, Saudi Arabia is one of the very few countries that started seawater desalination on an industrial scale to fulfill the domestic water demand of its population. It was reported by the General Authority of Statistics that the production of desalinated water in the Kingdom reached 2137 million cubic meters (MCM), with an all-time increasing trend [
5]; however, it cannot be relied upon for long, as it is consuming a huge amount of energy resources of the Kingdom [
6].
The third source of water for the Kingdom is rainwater. As the country lies in a hot arid climate, the amount of rainfall it receives is very scarce during the year [
3]. However, there are many feasible locations around the country where rainwater can be stored by creating reservoirs with the help of dams. Later, the stored water is used mainly for irrigation and domestic purposes. The total number of dams built in Saudi Arabia in various regions up through 2019 was 508 as shown in
Table 1, along with their storage capacity [
3]. The number of dams constructed in a region is purely based on the amount of rainfall received, requirement of water storage, and the population of that particular region.
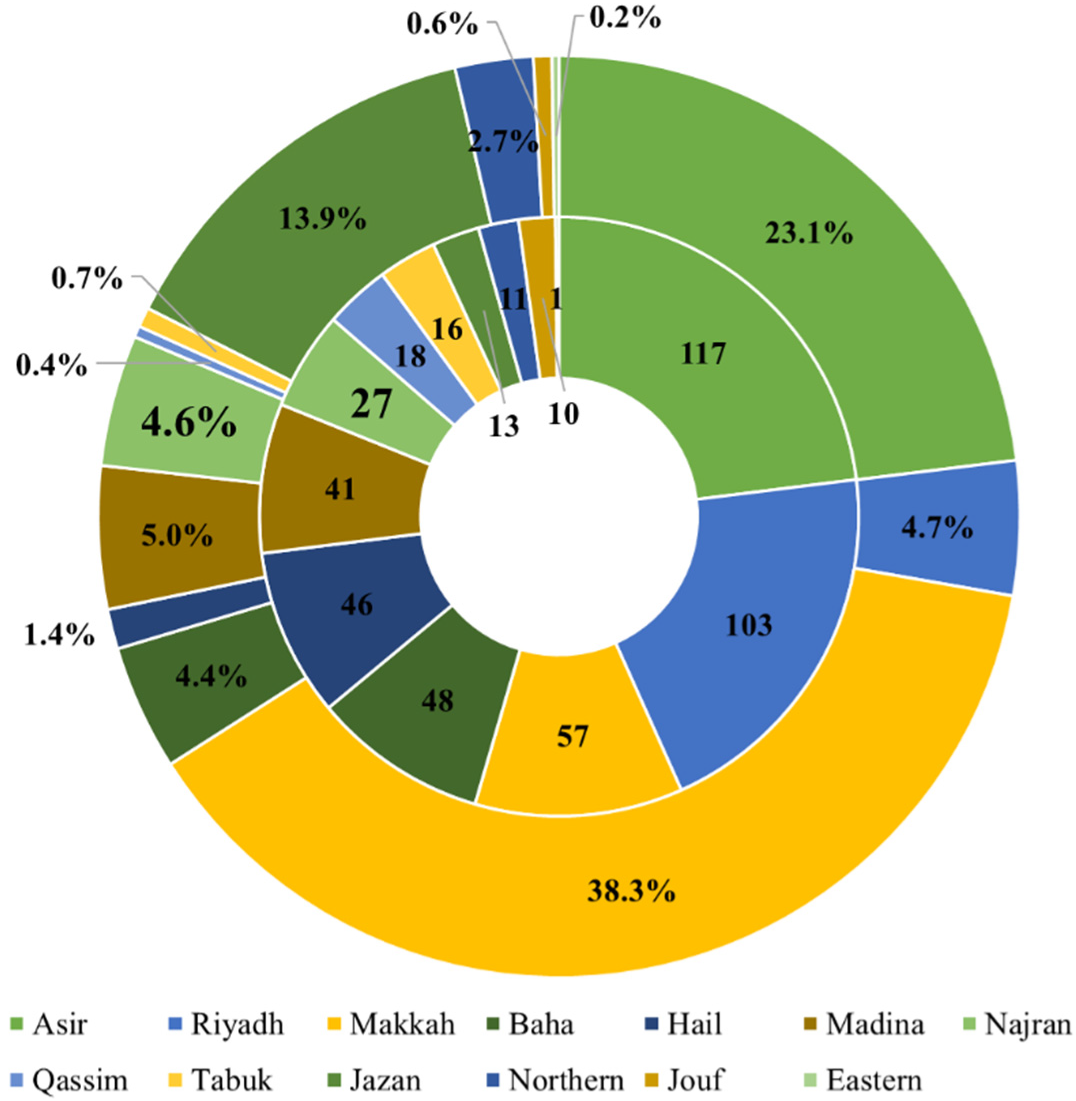
Najran is one of the provinces of Saudi Arabia that has a great number of dams, constructed mainly for irrigation and flood control purposes. Najran Province has a total of 27 dams with a storage capacity of 103.86 MCM, contributing 4.6% of the total water storage capacity provided by dams in Saudi Arabia, as shown in
Figure 1. Najran is characterized by having an arid climate, where the amount of rainfall varies from year to year and from month to month.
Table 2 shows the long-term mean monthly climatic variables in the study area. The highest average monthly temperature is recorded in July and August, whereas relative humidity shows an increasing pattern during winter in December–January and a decreasing pattern during summer from June to August. Rainfall in the study area is observed during two seasons: the first is during the spring season of March–May, followed by the summer season from June to August.
Table 2 also presents the average monthly values of potential evapotranspiration (PET) in mm/day as calculated by JICA [
7]. The falling trend of potential evapotranspiration during the winter months is observed due to decrease in average temperature and daylight time.
Table 3 below shows the fluctuation of annual runoff amounts in Najran Valley between 1967 and 1976 in million cubic meters (MCM). These data were recorded before the construction of the Najran Dam and show a marked variation in the annual runoff. In some years, the annual runoff reached three times the annual average, which caused frequent floods in the Najran Valley during this time. Hence, it seemed necessary to construct a dam to reduce the risk of flooding and protect people and their property.
Najran Dam was built in 1980 to protect residents of the valley from frequent floods and reduce the recurring risks in the region.
Table 4 below shows the salient features of the Najran Dam.
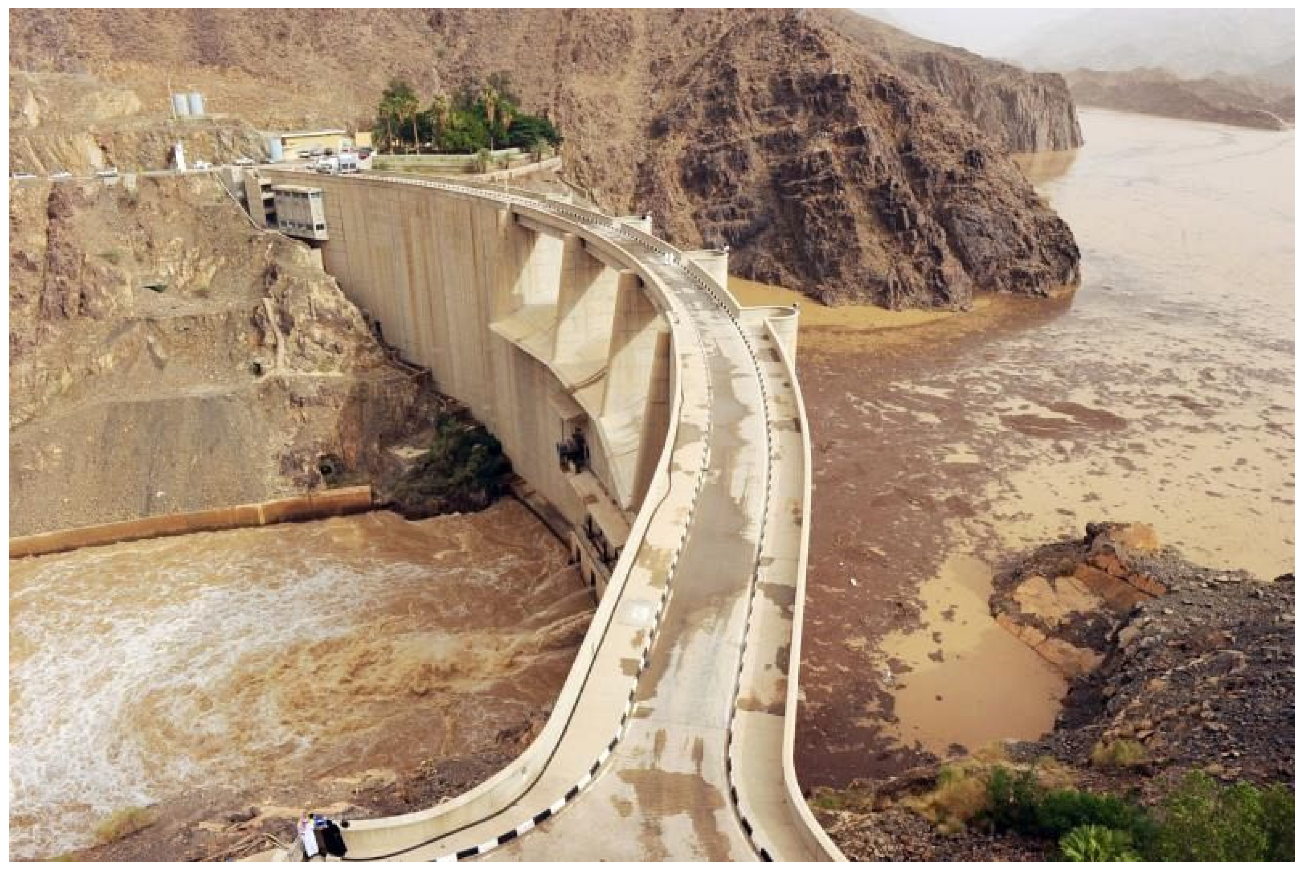
Figure 2 shows a general view of the upstream and downstream of the dam. Since the construction of the Najran Dam, there have been many positive impacts, as the dam has helped to a large extent in reducing the risk of flooding in the region [
8]. The dam also contributes to the recharge of groundwater, especially in the areas upstream of Najran Valley.
Since the 2010s, various issues regarding the groundwater table in the Najran Region are being reported. Al-Ghobari [
8] reported that the groundwater in the Al Wajid aquifer of Najran is depleting quickly due to the high rate of extraction of water as compared to the rate of recharge. About 79% of the irrigated area in Najran depends entirely on nonrenewable water extracted from deep artesian wells, as documented by Ghanim [
10]. The Al Wajid aquifer is a big reservoir of groundwater that is shared by Saudi Arabia and Yemen. Youssef et al. [
11] performed a study related to land-use change, and extensive hydrological investigations were conducted over the past years. They concluded that the groundwater table level has decreased significantly over time.
This decrease in the level has caused the formation of earth fissures as long as 600 m with a width and depth of 30–200 cm and 50–400 cm, respectively [
6]. These earth fissures are generally observed to have occurred in agricultural land, affecting the productivity of the area. UN-Habitat prepared a comprehensive report on Najran Province, highlighting various issues the area is experiencing recently related to water [
6]. These issues are listed below:
Appearance of earth fissures caused by excessive water extraction;
Lack of water management for self-sustainability;
Depleted water table resulting in water shortage and loss of agriculture;
Reduction of agricultural land resulting in ecological imbalance.
The excessive groundwater extraction due to the increase in water demand has caused huge damage to the agricultural activities and the water resources of the region. The latest study shows that the depth of the groundwater table is now found to be 120–130 m below the ground level [
12]. In a GIS-based study performed by Abd El Aal et al. [
13], for the past 45 years, it was concluded that the agricultural land has contracted over the years, and the Najran Valley has become smaller than before.
An extensive literature review was performed to find published studies of public perception related to water resources. Such studies are quite common all around the world, and this strategy was adopted to obtain a direct opinion related to the issues being experienced by the people living in the study area. A study recently performed in Nevada, United States, assessed the possibility of the reuse of potable water and its management [
14]. The results showed that the residents of the area showed concern about the depleting water resources and the future of water use. Various suggestions were put forward by the authors to overcome the foreseen crisis of water. Another similar study on water reuse was conducted by Po et al. [
15] in Australia. Hua [
16] undertook a public perception study on water resource development for the reason of increased water pollution in the suburbs of Malacca River in Malaysia. In another similar study, Zhu et al. [
17] reported the results of public perception of the acceptability of reclaimed water in Shandong, China. They concluded that due to water scarcity, the people of the province are willing to accept reclaimed water for domestic use. An earlier study of public perception related to water quality and water conservation in Canada was published by McDaniels et al. [
18]. They did research on Lower Fraser Basin in the province of British Columbia and concluded the willingness of the residents for participating in water conservation activities. Regarding Najran, Gasmi and Belloumi [
19] conducted a public perception survey to assess the progress of the plan to achieve the sustainability goals. They found a positive effect of the implementation of the plan. Elkhrachy [
20,
21] highlighted another risk expected for Najran Valley related to flash floods. The authors performed a GIS study to predict the amount and effects of a flash flood in the area. Similar conclusions were put forward by Abd El Aal et al. [
22]. Alqahtani et al. [
23] performed a study on water quality for the groundwater of the Najran area and stressed that there is a need for a proper monitoring and management system of water supply in the area. Another water quality-related study was performed by Ahmed et al. [
24], where they analyzed the groundwater quality of Najran and found that the water was fit for human use except in a few areas where the groundwater contained higher TDS values.
Many researchers have published work highlighting the causes of water depletion and strategies to minimize its effects. For Saudi Arabia, the availability of water has already been declared the most prioritized issue to be included in sustainability measures [
25]. Al-Omran et al. [
26] studied the irrigation system under practice in Saudi Arabia in detail and recommended a proper water management system for the conservation of irrigation water. Different techniques have also been published in an attempt to create awareness among the general public to reduce water consumption, as water resources are depleting quickly [
27,
28,
29]. Al-Ansari and Knutsson [
30] performed research on the reduction in the water flow of the Tigris and Euphrates Rivers in Iraq, which has caused a decrease in agricultural land during the past 20 years. Srinivasan et al. [
31] identified four major factors playing a role in the water crisis, which are changes in the water demand, water supply techniques, governance systems, and infrastructure facilities. Dijk et al. [
32] studied the natural and human causes of the Millennium Drought that occurred from 2001 to 2009 in southeast Australia. They concluded that the environmental effect was the major factor for water scarcity in the study area. Wada [
33] conducted a related study by modeling groundwater depletion on a global scale and suggested the development of better monitoring and management plans for water use and extraction. Ahmed and Abdelmohsen [
34] studied the rates of groundwater depletion and the rate of freshwater recharge to quantify the available amount of water for the Nubian aquifer in Egypt. Mazzoni et al. [
35] forecasted the groundwater depletion and water budget deficit for North Africa and the Arabian Peninsula. They concluded that if the current trend of water use and groundwater extraction continues, the countries with the lowest GDP per capita might hit a severe water deficit in the future. In a similar study, Turner et al. [
36] predicted the cost analysis of groundwater extraction for the future and concluded that the influence of the cost of groundwater extraction would be huge during the twenty-first century, and their approach shall help in better management of groundwater globally. GIS-based techniques are also in development for the detection of groundwater levels remotely [
37]. Few others [
38,
39,
40,
41] utilized GIS techniques for evaluating the groundwater depletion rates and the water table level for the USA, the Middle East, on a global scale, and in Saudi Arabia, respectively. Scanlon et al. [
38] in another study assessed the effects of groundwater depletion on irrigation in High Plains and Central Valley, USA.
Water scarcity and groundwater quality deterioration are common problems in several regions in Saudi Arabia, and these issues need to be assessed for their influence on public perceptions of water resource conservation and reclamation. The existence of water scarcity conditions effects the domestic and agricultural sectors, resulting in an obstruction to the development effort in the communities where it prevails. Given all the problems related to water resources being faced by the residents of Najran Valley, who are the real stakeholders of Najran Dam, it was found that there is a need for a study to determine the major causes affecting the agricultural activities in the Najran Valley based on the opinion and experience of the actual residents. The following questions were found important to be answered:
What are the possible causes of groundwater depletion at Najran Valley?
What factors have been involved in affecting agricultural activities?
What effects and changes have been observed on the environment and water availability after the construction of the Najran Dam?
How do the key stakeholders of Najran Valley perceive the issue of water depletion affecting their daily life and activities?
As there is no such study available, this task was taken up to fill the gap, maintain a record, and keep the data ready whenever needed by the authorities and policymakers. The response to the survey questionnaire was compiled, and all the factors are presented in order of their priority by using statistical analysis techniques. The results of the study presented in this study shall prove to be highly beneficial for the related authorities in making better and timelier decisions to develop better policies regarding the availability of water in the area for domestic or agricultural activities.
2. Methodology of Research and Analysis Options
One of the major dams based on storage capacity in Saudi Arabia is located in Najran Province, and it is named Najran Dam, which is the study area for this research. Najran City is situated in the southwest of the Kingdom near the territorial boundary of Saudi Arabia and Yemen at 17°30′ N and 44°10′ E, having a population of 316,000 with a growth rate of 2.7% [
6]. It has varying weather ranging from moderate in summer to cold during winter, with average minimum and maximum temperatures of 6–30 °C. Najran receives a good amount of rainfall during the summer and is considered rich in agriculture [
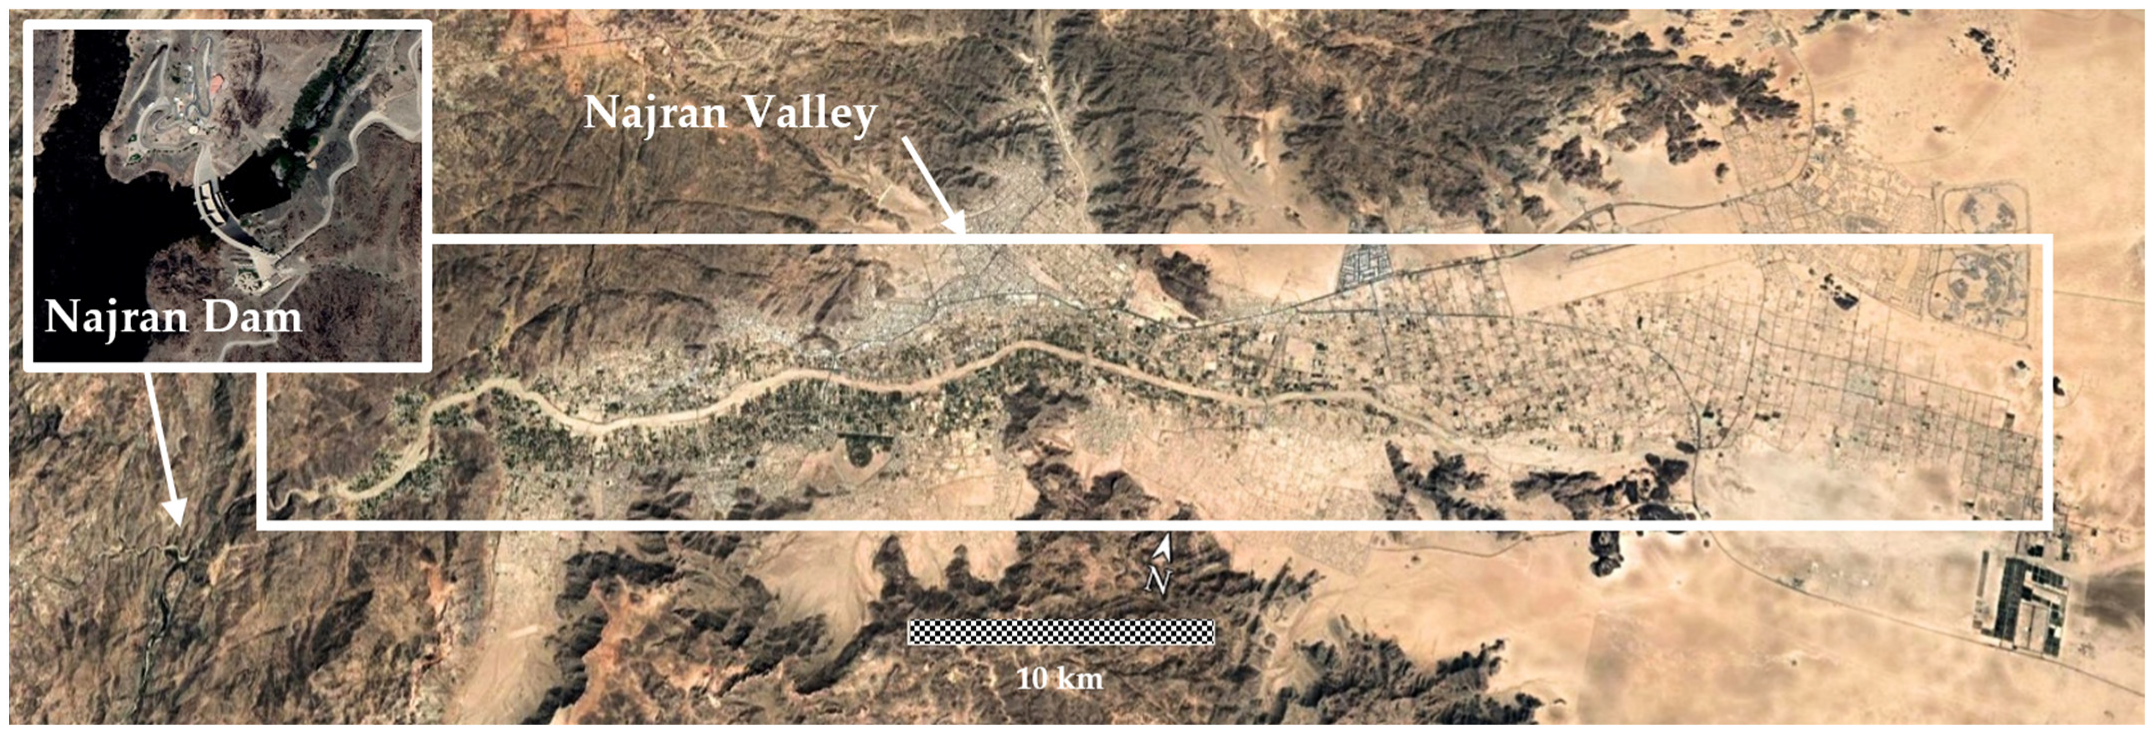
42]. The area has three types of topographical areas. In the west, there are rugged hills, whereas large fields and valleys with slopes lie in the middle of the city, which are useful for farming, and the eastern region consists of deserts, as shown in
Figure 3.
Najran Dam, as mentioned in
Table 4, is a gravity dam built in 1980 for flood control, domestic and agricultural water supply, and groundwater recharge. The dam has a height of 73 m, and it spans 140 m across the valley, providing a water storage volume of 86 MCM. During the rainy season, it collects the runoff and the sediments to protect the Najran Valley downstream. The water is released, when required, through three spillways [
43].
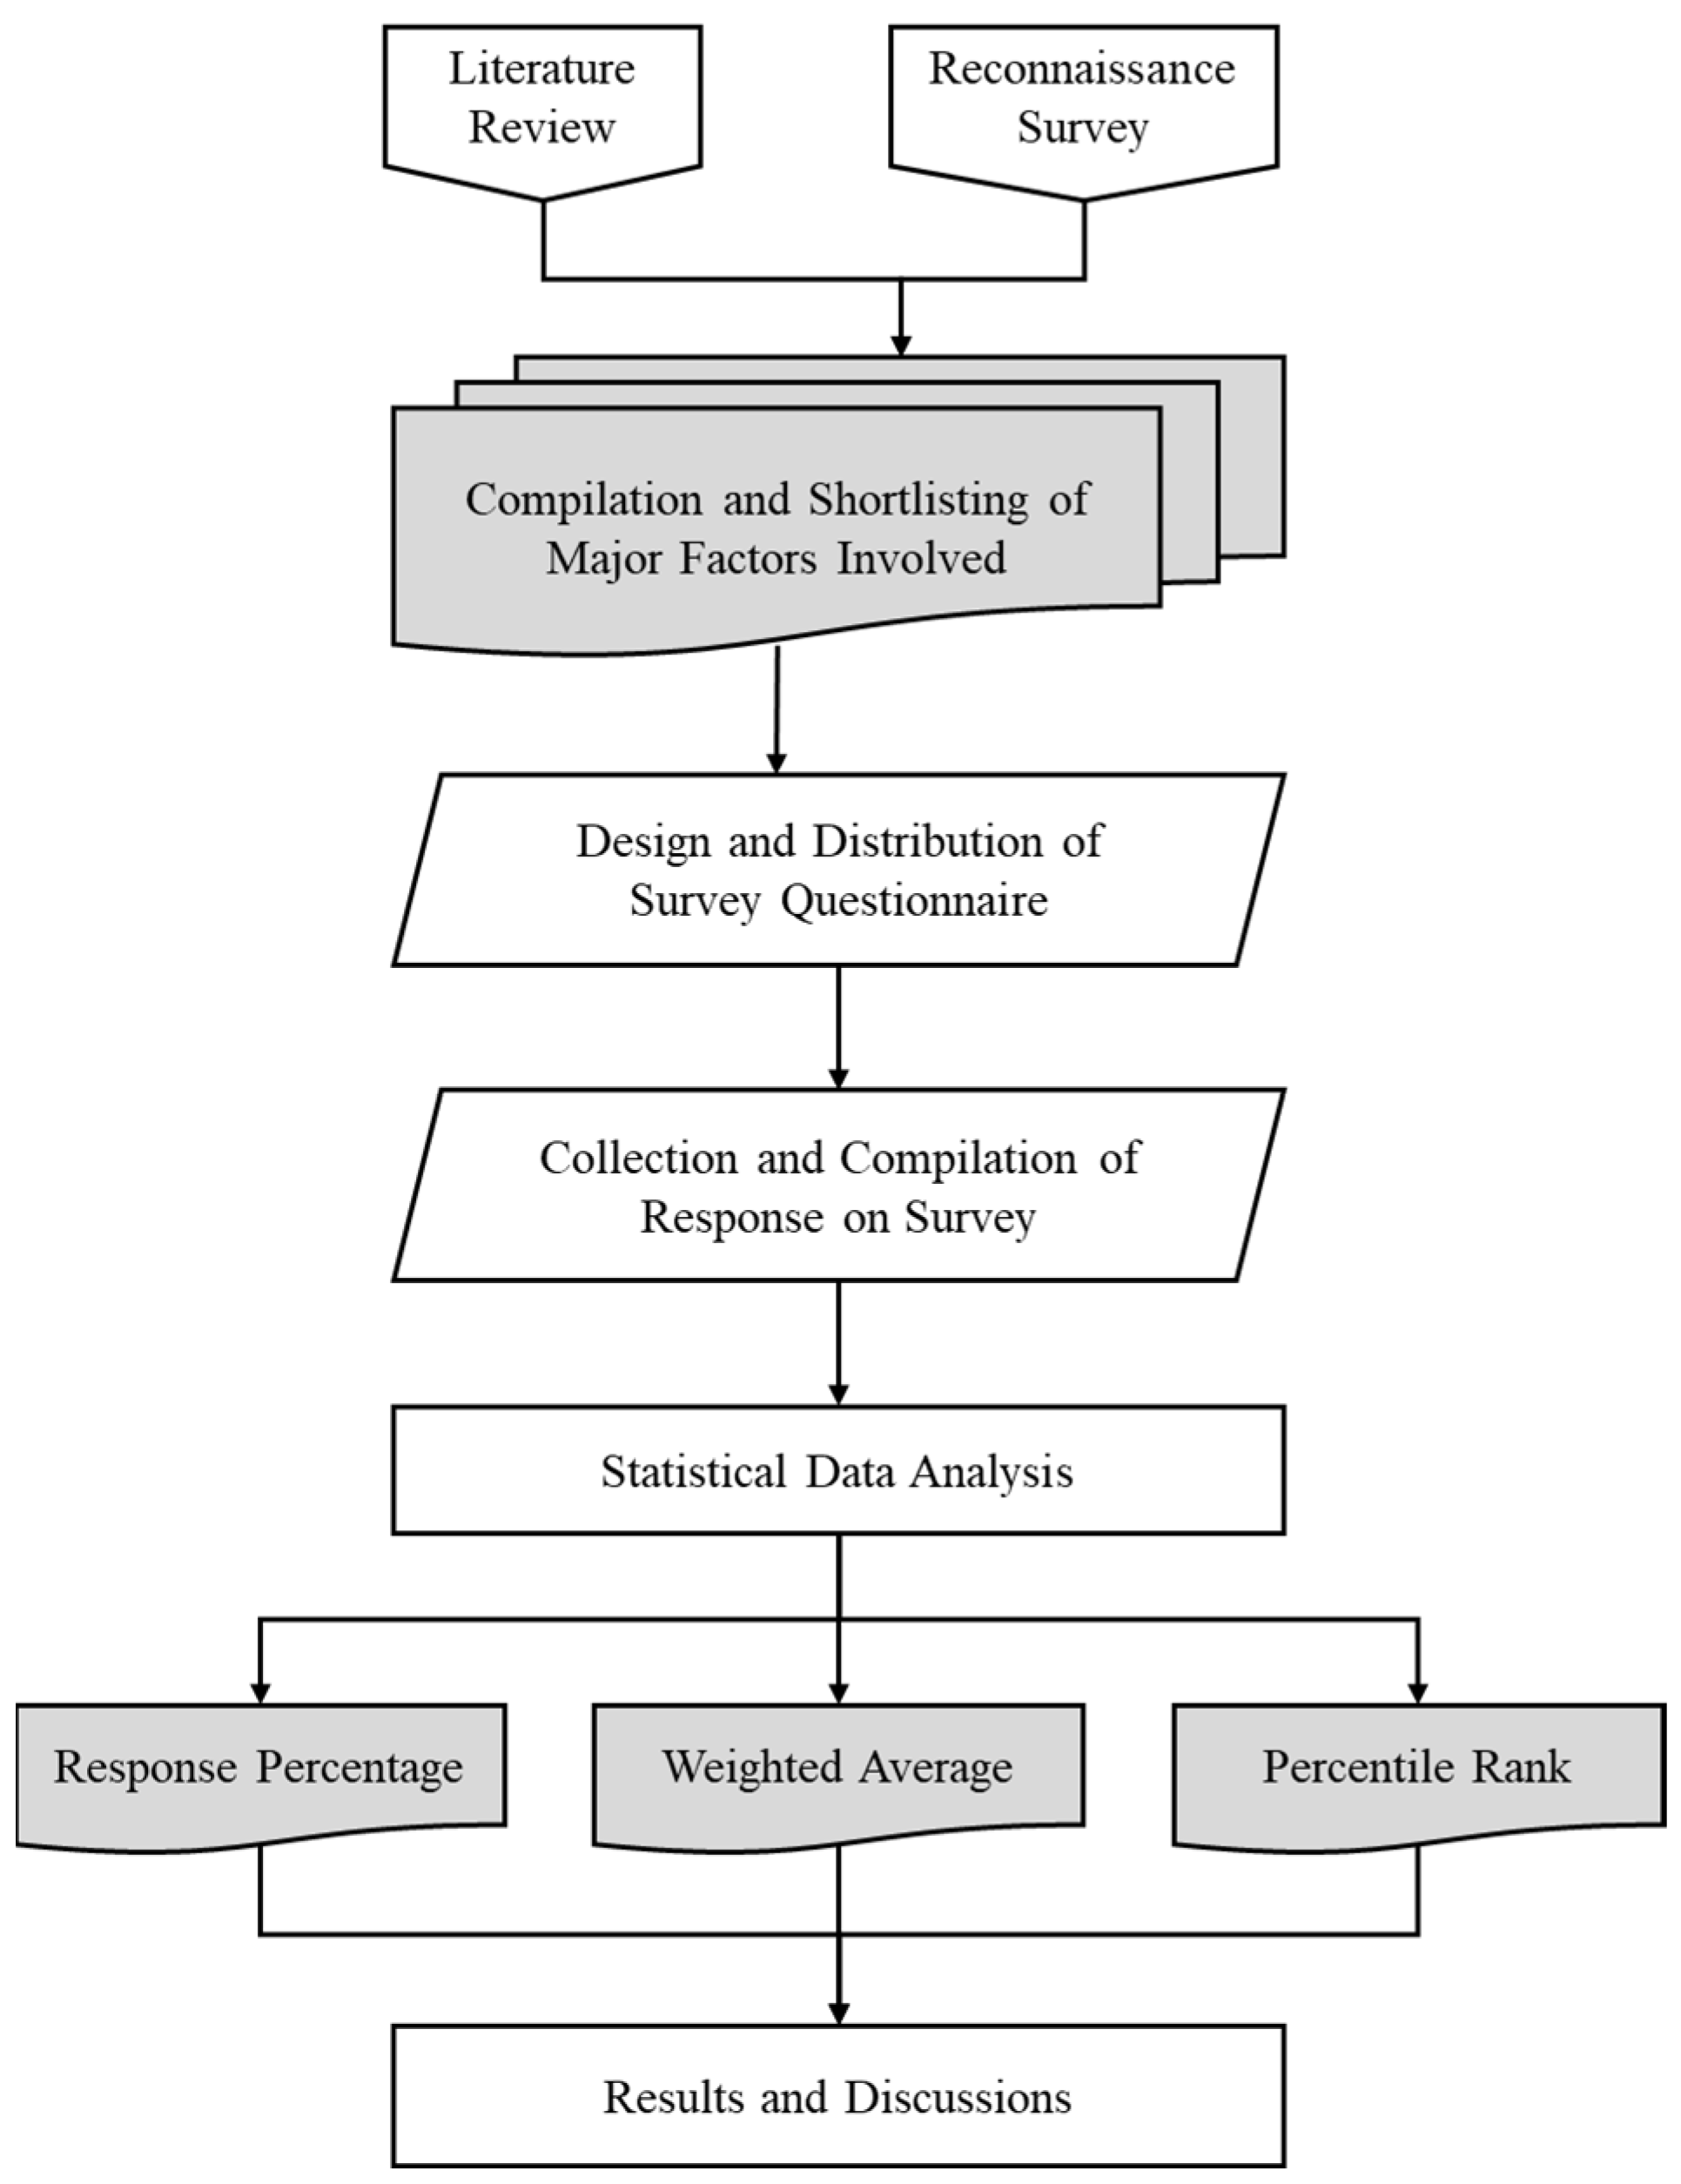
The methodology of the research follows a series of procedures. In the first step, notes were taken after an extensive review of the literature available on the web related to the water resources of Najran Valley. In the second step, a reconnaissance survey was conducted, and basic data were collected from the study site regarding the problems and challenges being faced by the residents related to water resources and agricultural practices being followed after the construction of the Najran Dam. A few professionals in the industry related to water treatment, water supply design, and execution who have hydrological study experience were also consulted to determine the factors affecting the water resources in the region. After compiling the basic information, a few common factors were shortlisted and put down in the form of a questionnaire in the third step. This online questionnaire was designed specifically to obtain the perceptions of the residents of Najran Valley regarding the available water resources and the impact of Najran Dam on agricultural practices. All the required protocols were taken care of while performing the survey. The survey was required to be submitted as “anonymous”, and no identity of any respondent was recorded. The respondents were also given the option of leaving the survey at any time during the response process. Those particular surveys were listed as incomplete and was not included in the statistical analysis. The whole process of data collection and analysis is shown in
Figure 4.
The survey questionnaire consisted of two types of questions. The questions of the first type were based on a Likert scale, and the respondents were required to answer on a scale of 1 to 5, representing strongly disagree, disagree, do not know, agree, and strongly agree, respectively. The questions of the second type were given with the options where the respondents were required to select the best suitable option. The format of the online survey questionnaire is shown in
Table 5 below.
The responses of all the respondents were compiled on data sheets and categorized based on various factors. The data analysis performed in this research was executed on SPSS Statistics software. The SPSS Statistics software platform offers advanced statistical analysis, a vast library of machine learning algorithms, text analysis, open source extensibility, integration with big data, and seamless deployment into applications [
44].
For the first part of the data analysis, the response percentage obtained for all questions was assessed separately, and the factor that received the highest number of selections was considered the highest priority. Along with this, the responses to all questions were compared together as well by using the method of weighted averages (WA). The following Equation (1) was used to calculate the WA of each factor [
45]:
where
Aw is the weighted average,
Ri is the number of respondents for a specific level
n of the Likert scale, and
n ranges from 1 to 5.
For further validation and to ensure the reliability of the results, percentile rank (PR) was also obtained for ranking the factors based on their priority or seriousness of the matter. Percentile ranks are found useful when there is a requirement of understanding the value of a score as compared to other scores in the list of frequency distributions. It is a statistical technique that gives the relative standing of a numerical data point when compared to all other data points in a distribution.
The percentile rank was calculated by using the following Equation (2) [
45]:
where
R is the percentile rank,
fc is the sum of all the scores in the distribution that are less than or equal to the score of interest,
f is the frequency of the score of interest, and
n is the total number of scores in the distribution.
3. Results and Discussion
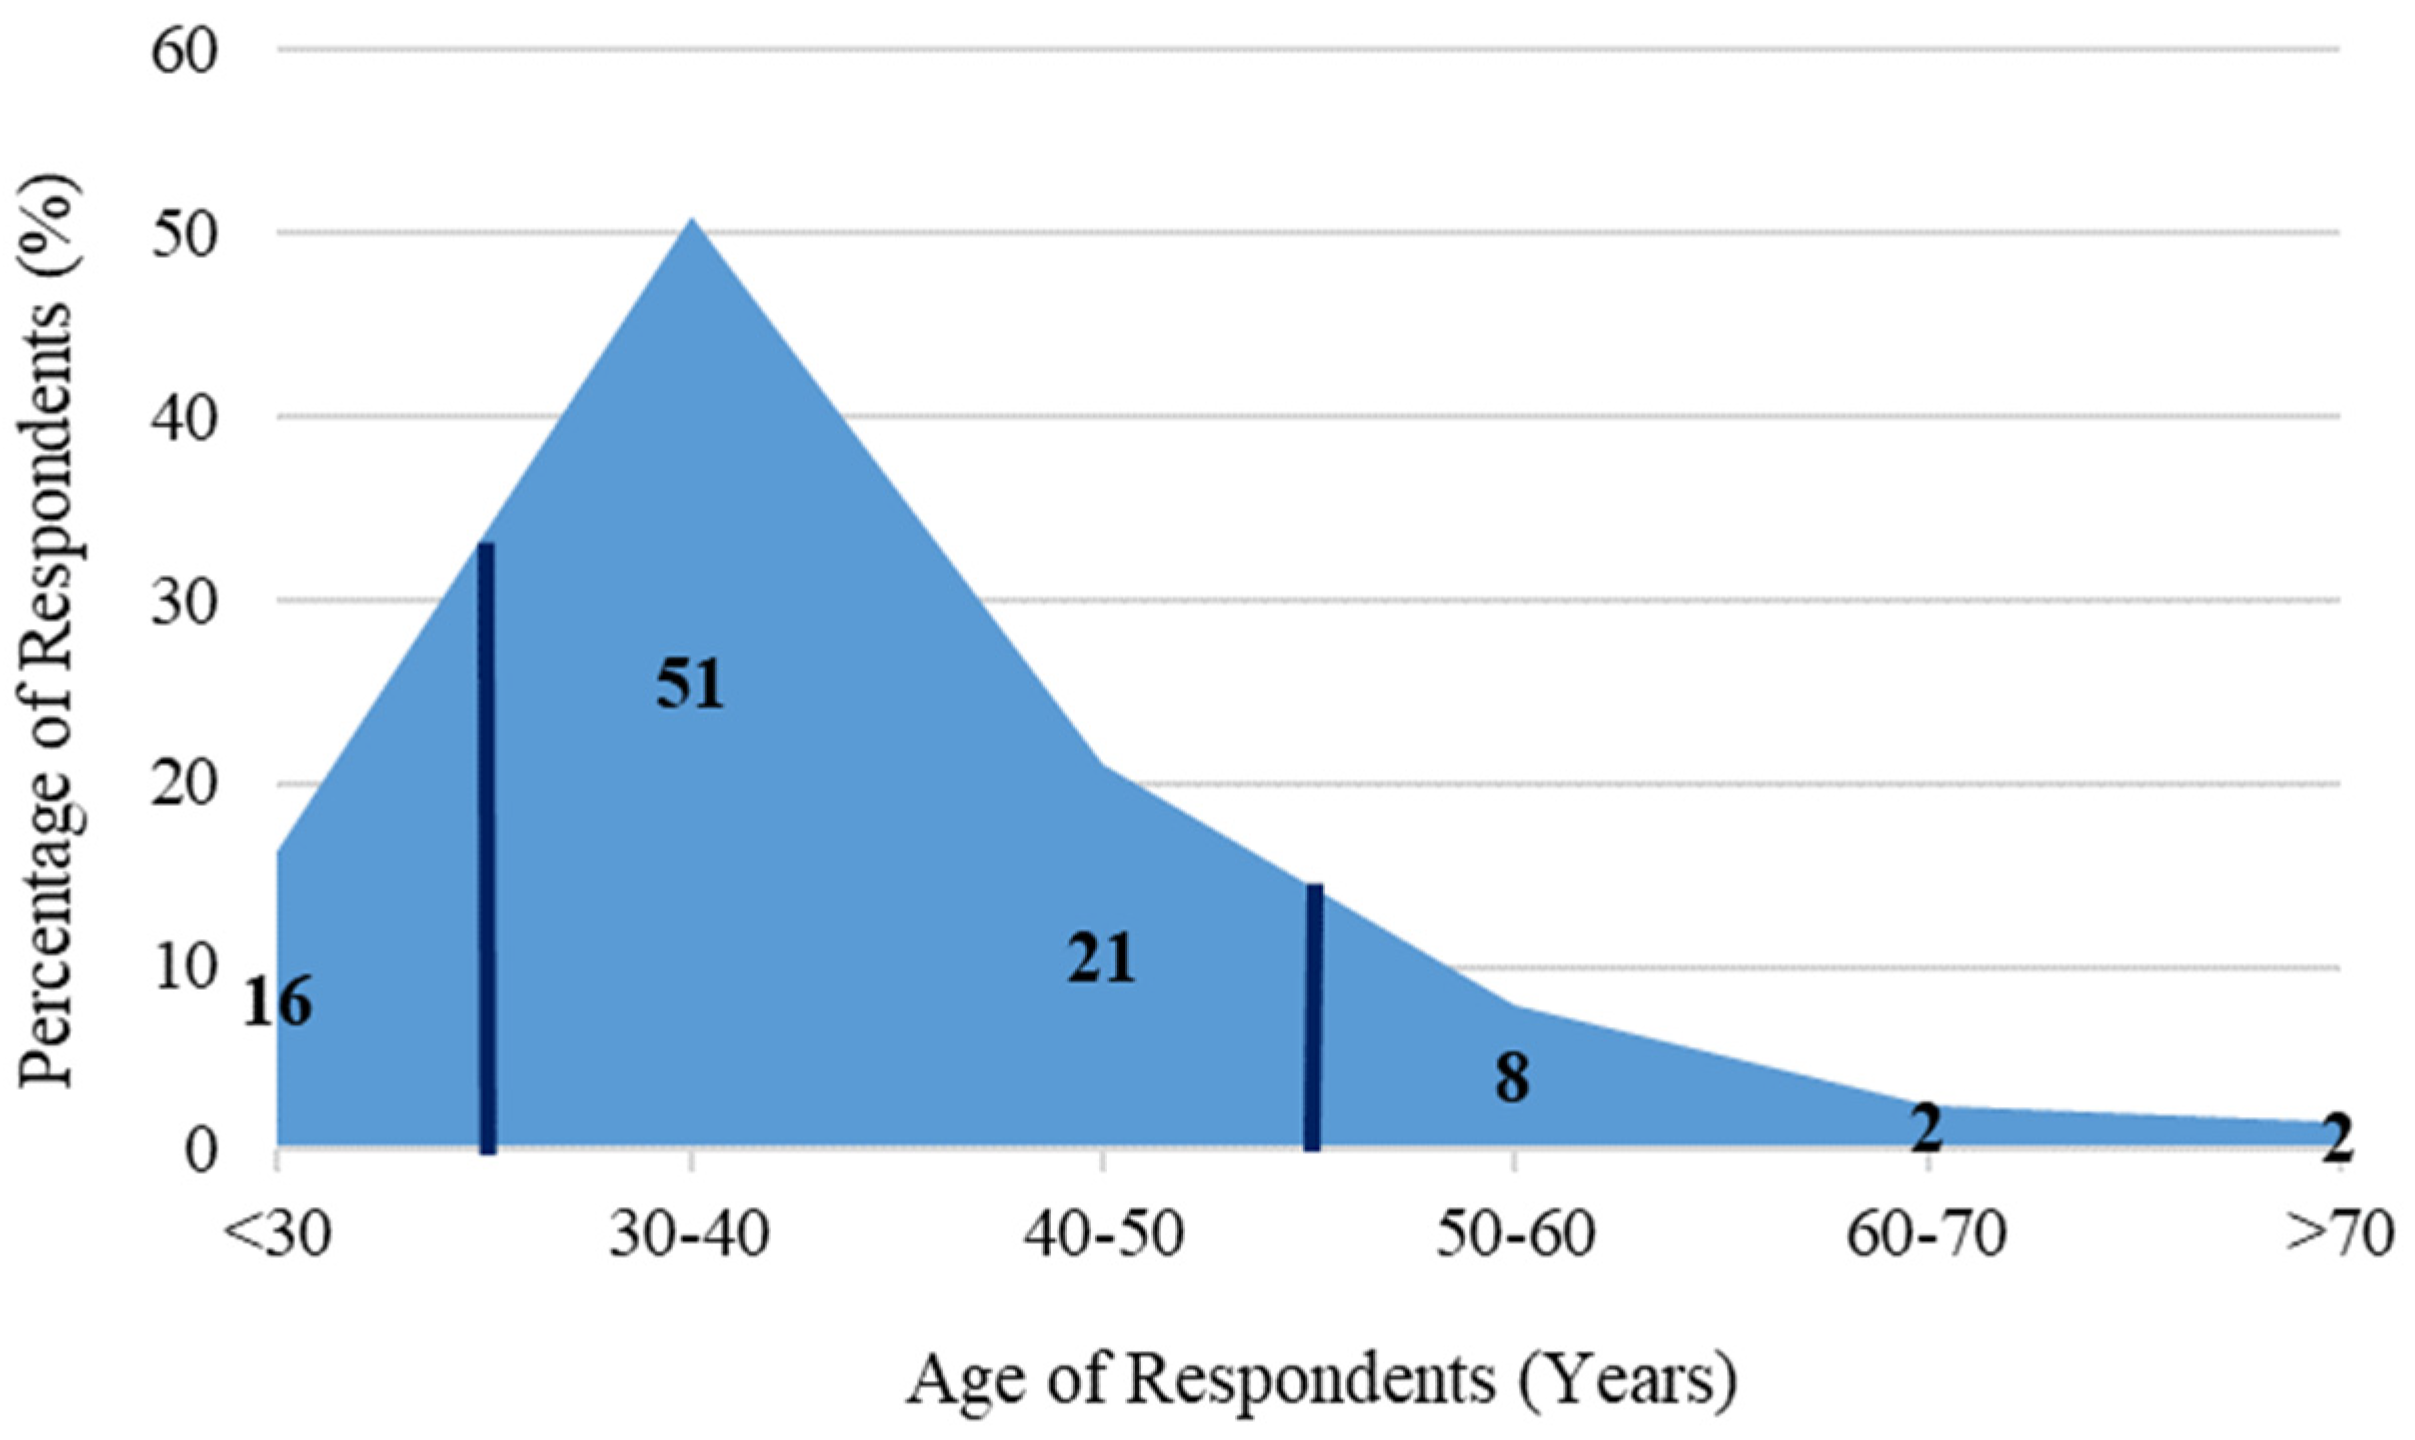
A total of 376 people submitted their responses, which included working professionals, researchers, and students living in the Najran Valley. The data regarding the age of the respondents show that almost 72% of the respondents belong to the age group of 30–50 years, as shown in
Figure 5.
The respondents between 30–50 years of age comprise a young and experienced class of people who have good insight into the challenges being faced by the Najran Valley regarding the water resources and agriculture. Moreover, the results of statistical analysis are considered to be reliable if the size of the population is at least 30 or more [
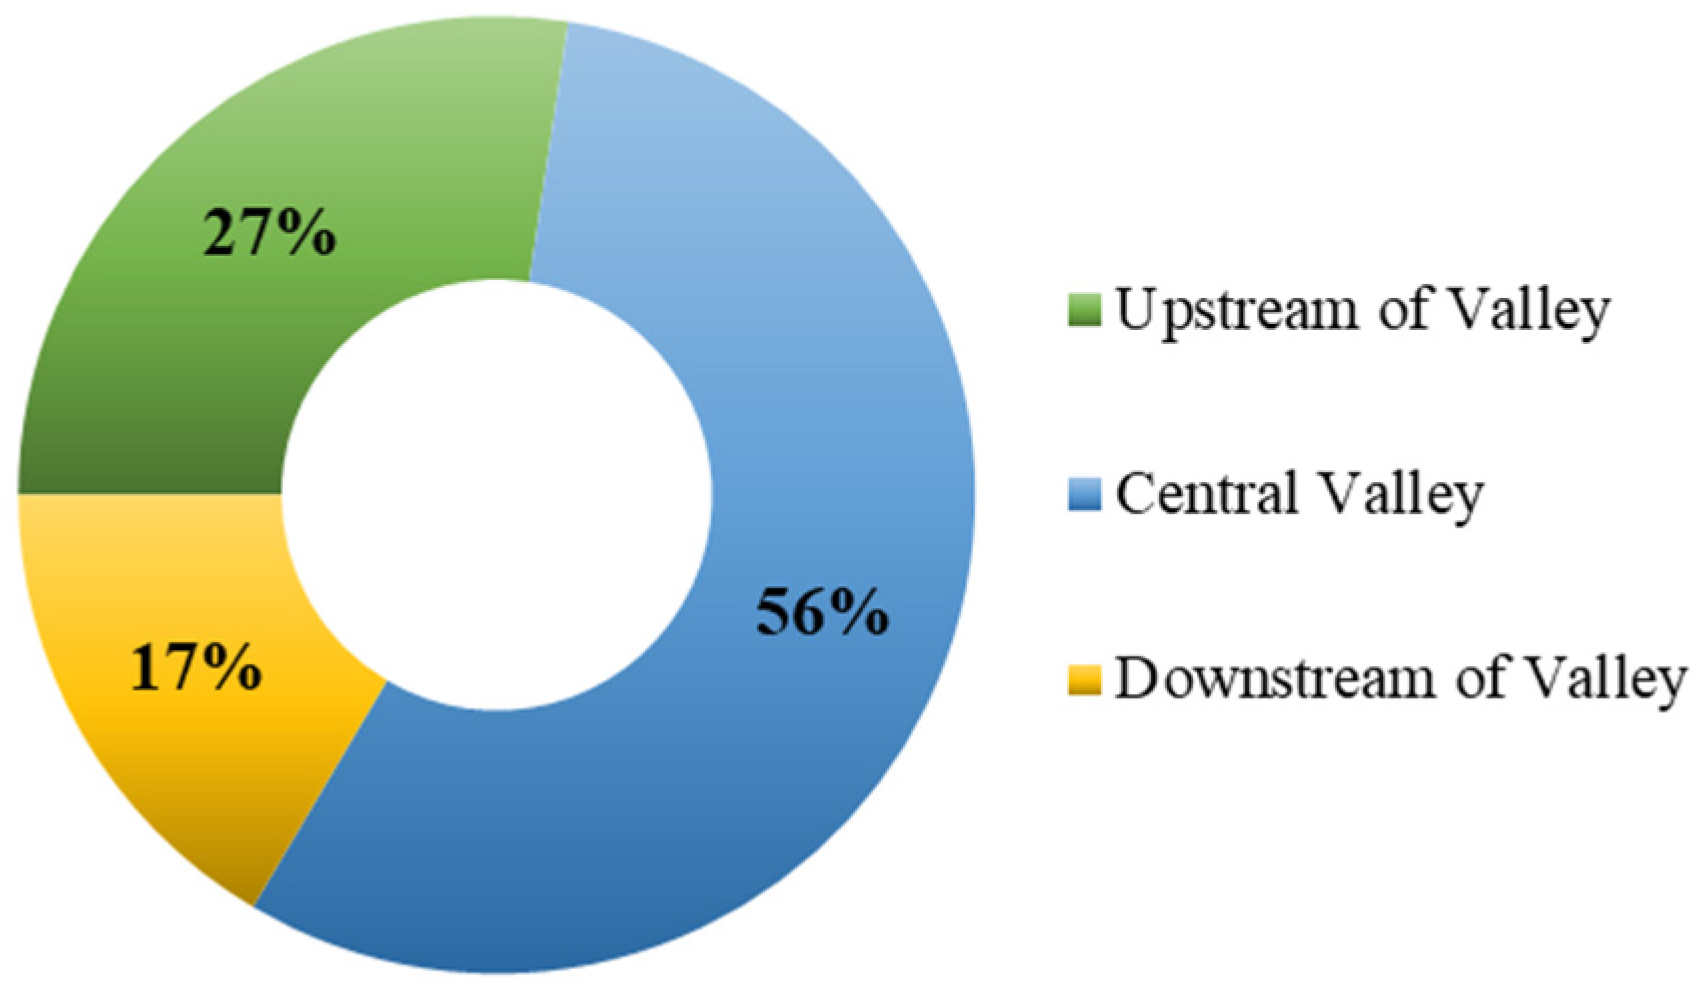
45]. The greater the size, the higher the reliability. Hence, the acquired responses are considered highly reliable and well-justified, as they exceed 30 by far, and additionally, the proportion of the young group of people is considerably higher among the population. The distribution of the respondents was also analyzed based on their area of residency, as shown in
Figure 6, illustrating that 56% of the respondents are residents of the central region of Najran Valley. A few other characteristics of the respondents are shown in
Table 6 as well.
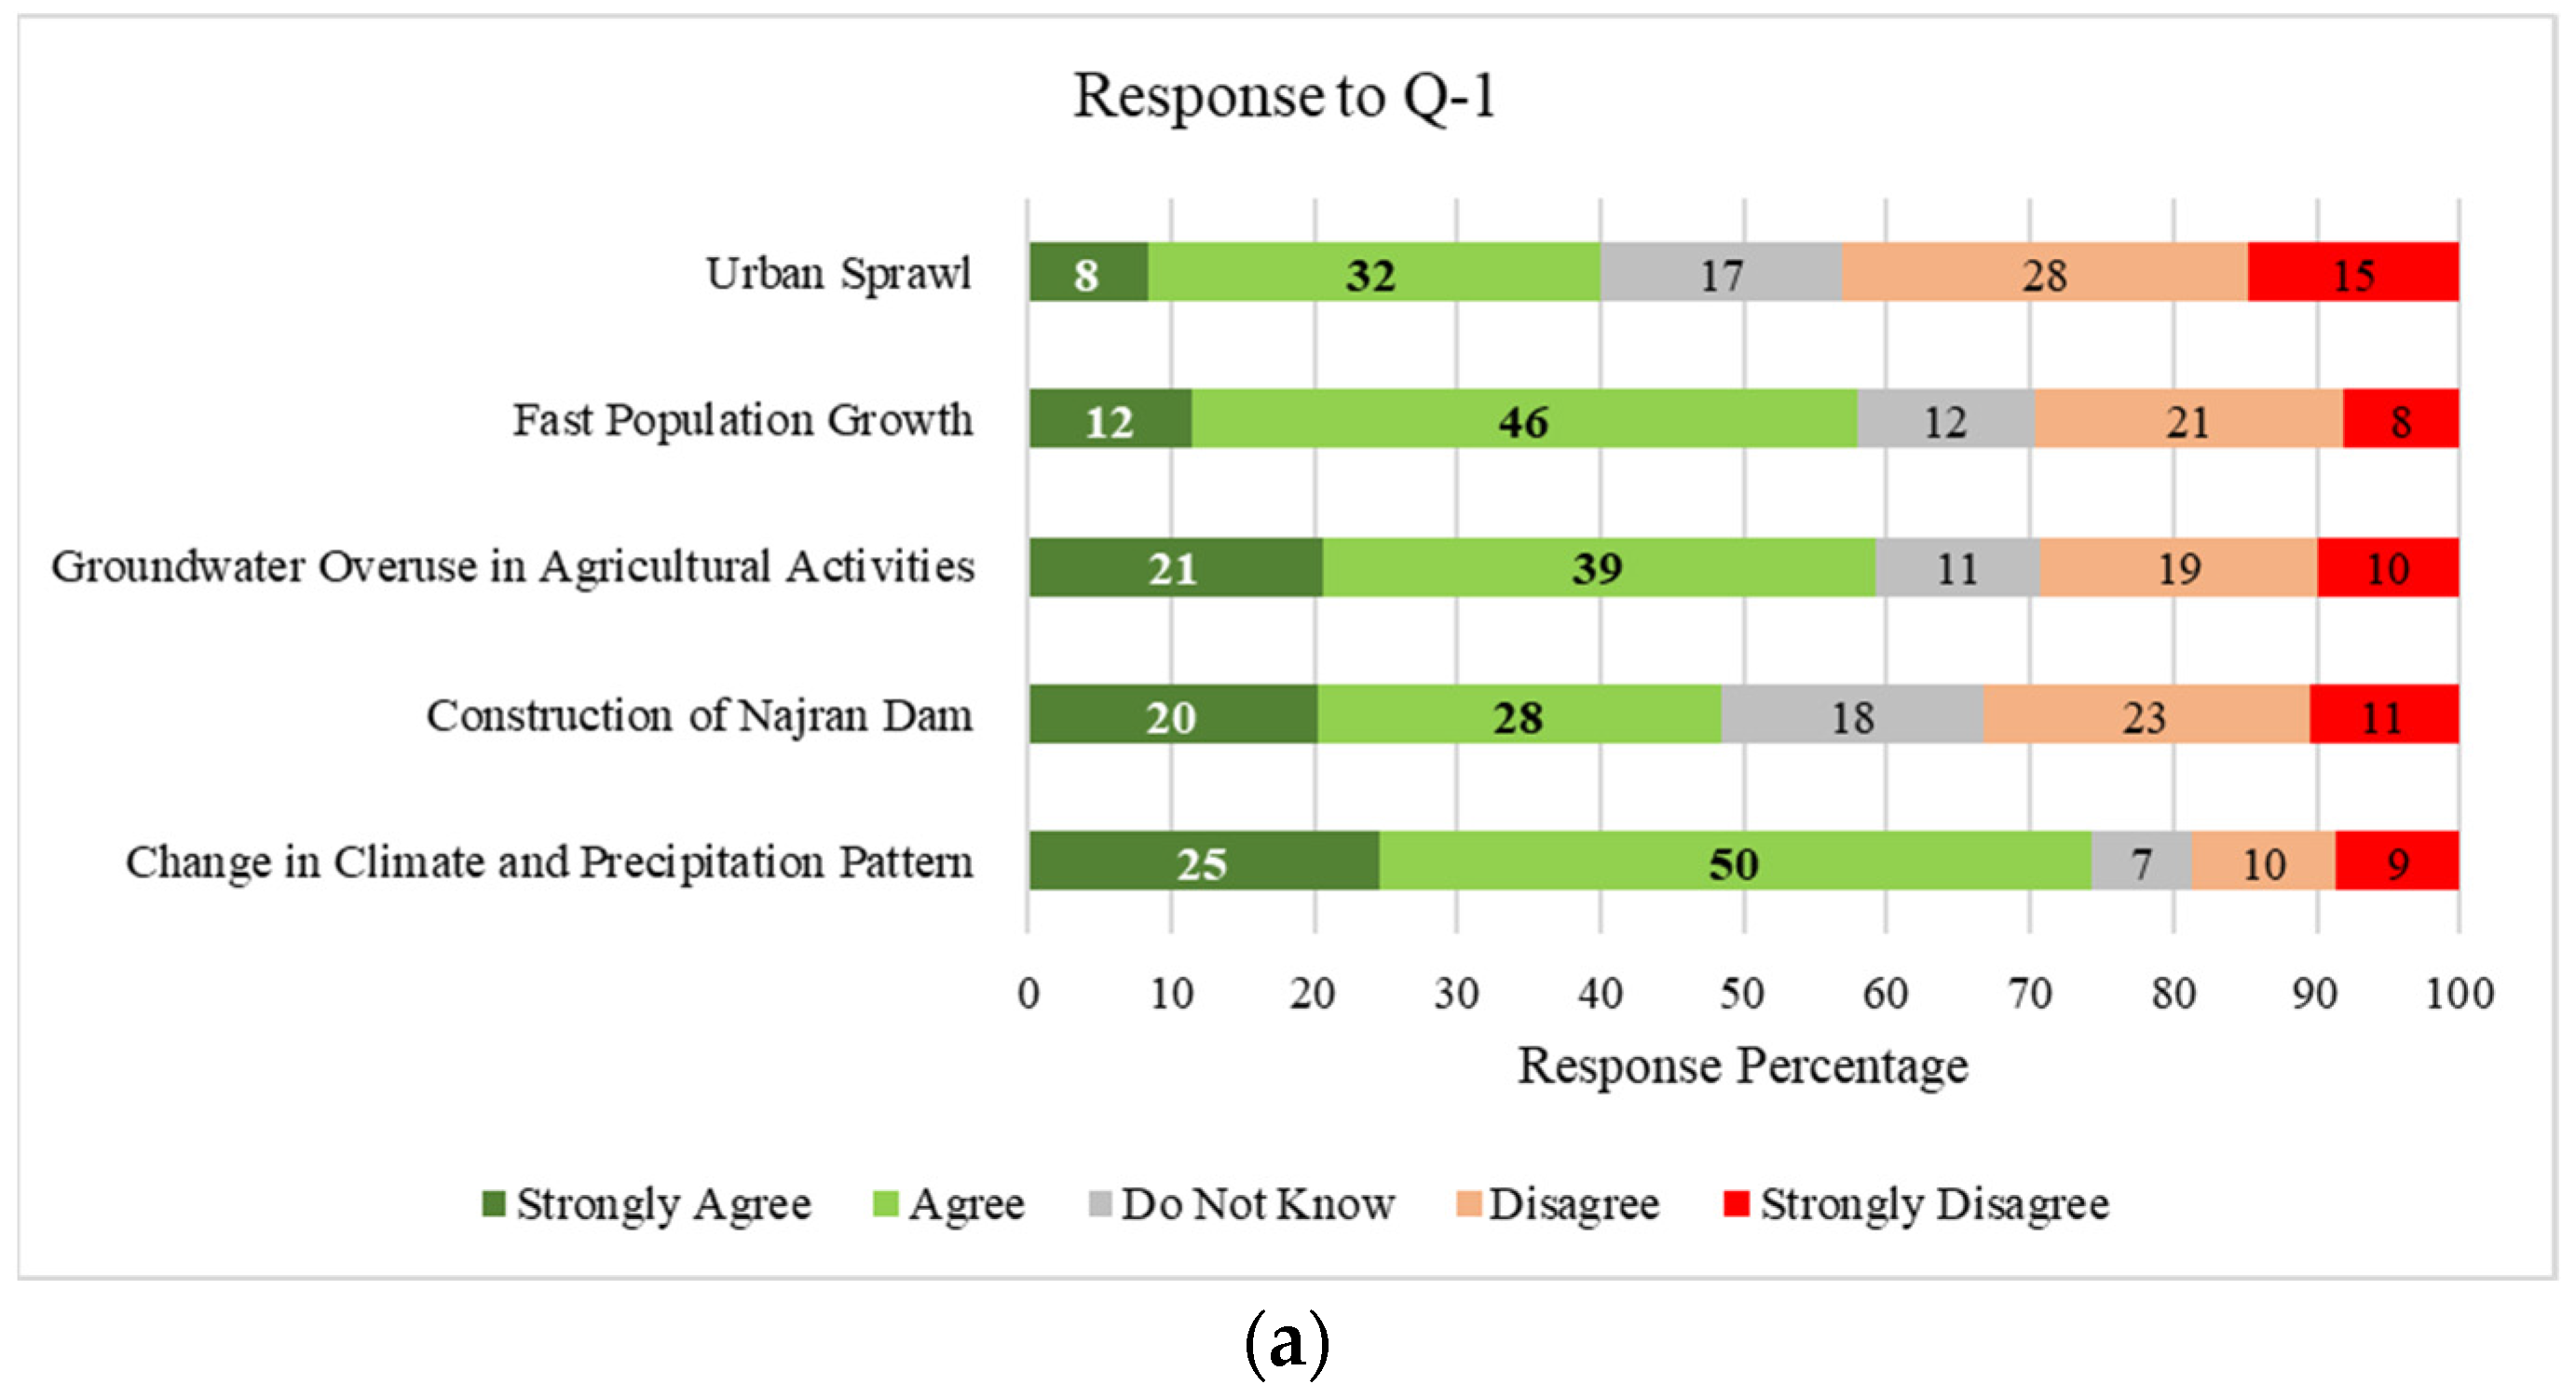
A brief discussion is presented in response to all questions one by one. It was noted during the reconnaissance survey that the residents have experienced a reduction in the groundwater valley of the Najran Valley. Question 1 was designed to assess the causes of this groundwater depletion. As shown by the results in
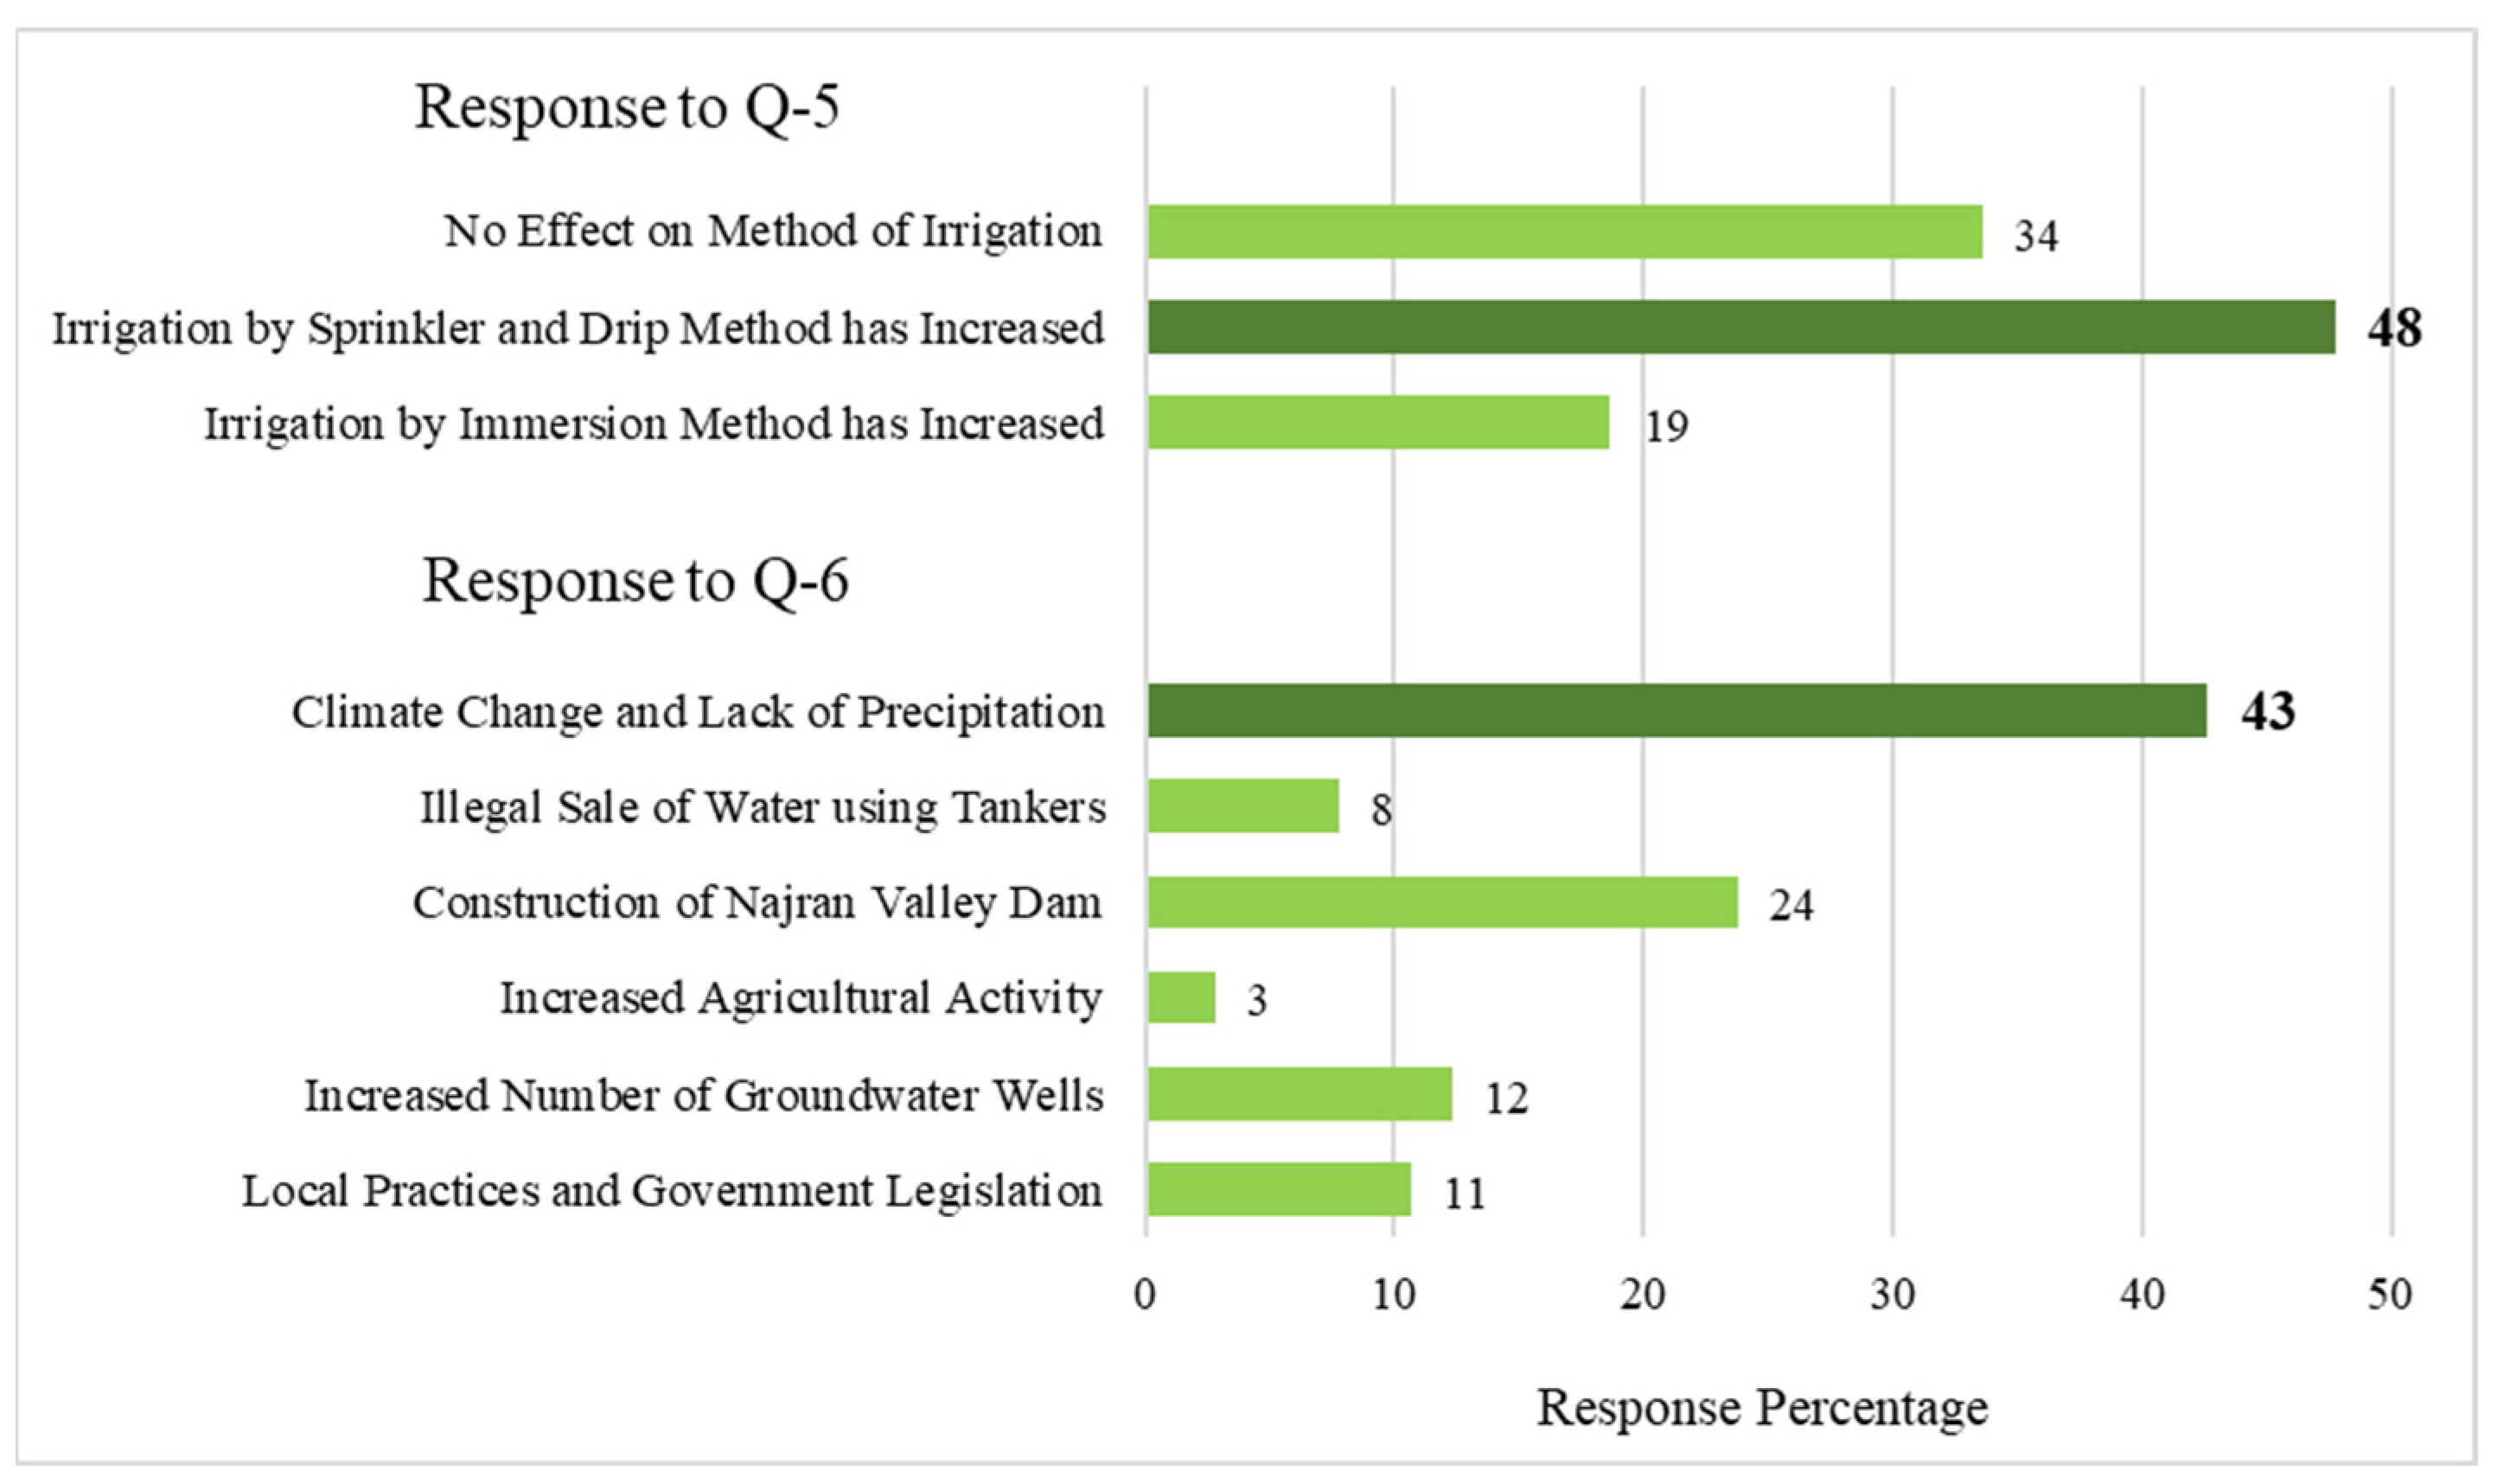
Figure 7a, 75% of the residents said that the groundwater depletion has occurred due to the change in climate and precipitation pattern of the area, whereas almost 60% of responses were received in favor of fast population growth and groundwater overuse for agriculture individually; despite the slightly lesser value, these two factors cannot be ruled out. A similar result was obtained for Question 6 as well, as shown in
Figure 8, where 43% of the residents again selected the option of lack of precipitation over all other options in response to the greatest threat to the water resources in Najran Valley. The average precipitation reported in Najran is very scarce, with a value of 10–15 mm in March and April only, while the values are even smaller at 5 mm for other months of the year. In addition, UN-Habitat reported in 2019 that the population of Najran City was 319,000, and it is expected to be 500,000 in 2030, with a high growth rate of 2.7% [
6], which validates the responses received to these questions.
Question 2 was related to the assessment of factors that have affected the agricultural sector in Najran Valley. The maximum response of 60% was obtained in favor of the option of the preoccupation of commerce and business sectors, as shown in
Figure 7b. Furthermore, 54% of the respondents selected the shortage of agricultural land as the major factor. With the advancement of technology and other means of business, many people have diverted their profession from agriculture to other sectors, which has caused the occupation of agricultural land by the business sectors, resulting in a decrease in cultivatable land. This reason is justified by the results received for Question 5 as well, where 48% of the residents said that farmers are now using the latest technology, and most of the irrigation has been shifted to sprinkler and drip systems. The same was reported by Elfeky et al. [
46]. Abd El Aal et al. [
13], after performing a GIS-based study, noted a decreasing trend in the availability of agricultural land since 2005, which also validates the results obtained for Questions 2 and 5. Another interesting thing to be noted is that the majority of the respondents who indicated the Najran Dam being the main cause for the deterioration of groundwater levels and agricultural activities were from the same segment of the respondents residing downstream of the Najran Valley. The downstream valley is struck badly due to the reduction in runoff, which results in the interruption of groundwater recharge. Moreover, the existence of groundwater wells at a long distance from the dam site makes their recharge from the dam reservoir ineffective and less likely to happen. This is reflected in the results as presented in
Figure 7, where about 48% of the respondents for Q1(d) and Q2(e) identified the Najran Dam as responsible for groundwater depletion and the decline of agricultural activities in the region. This situation shows how the conflict of peoples’ interests results in different and conflicting views, which should be taken into account by planners and decisionmakers when developing plans and policies for integrated and sustainable water management for the region.
Question 3 was designed to obtain the opinion of the residents regarding the environmental impacts of the Najran Dam, and 63% of respondents said that due to the sedimentation upstream of the dam, a decrease in the fertility of the soil in the agricultural land downstream has been observed, as shown in
Figure 7c. The alteration of a river’s flow and sediment transport downstream of a dam often causes the greatest sustained environmental impacts. The continuous transport of sediments through valley streams is disrupted by the Najran Dam, resulting in sediment deposition upstream of the dam, further resulting in the stoppage of sediments from traveling downstream, which is necessary to maintain channel form and support the riparian ecosystem.
The dam has also stopped the flow of healthy minerals, which are required for the better growth of crops, resulting in a decrease in agricultural production. These results are also validated by the findings of Shahin [
47], who performed regression analysis in estimating the flow of sediments through the Najran Dam. Similar results can be obtained by using the methodology of estimating the sediment deposition, which was put forward by Jamil [
48].
Positive impacts of the Najran Dam are observed on groundwater wells located upstream of Najran Valley, which is evident with a marked increase in their water levels. However, these positive impacts are limited to the upstream of the valley. In the downstream region, groundwater quality has deteriorated because of limited recharge and continuous deepening of wells to reach deep water layers, which are usually characterized by a high percentage of salt. The results show that the respondents residing downstream of Najran Valley agreed that water salinity and turbidity were one of the major negative impacts of the Najran Dam on their area. This perception is supported by the finding of some studies conducted in the Najran region by JICA [
7], which reported that groundwater salinity was found to be increasing particularly with an increase in depth, and the measured dissolved solids in the study area were found in the range of 3000–8000 mL/L.
Similarly, a large number of respondents residing in the upstream part of Najran Valley agreed that the Najran Dam was responsible for the increase in the breeding of harmful insects although the water level in the Najran Reservoir is continuously fluctuating, and water is not kept stagnant for a prolonged period. This result is validated by the common water quality problems currently encountered in the upstream region. The construction of the Najran Dam led to an increase in the levels of groundwater wells, and due to the limited provision of the municipal sewage network in the area, the majority of residents still depend on sewage ditches for disposing of wastewater.
Abdul Salam et al. reported that only about 5% of the residents in the Najran region have access to the municipal sewage network, and the majority of the residents still depends on ditch sewage for their waste disposal [
49]. This overlapping and merging of sewage ditches with the groundwater wells have caused water pollution, resulting in the breeding and reproduction of insects and mosquitoes.
Question 4 was related to the effect of the Najran Dam on the floods in the valley, and 77% of the residents agreed that the risk of floods has considerably been reduced in the valley due to the construction of the dam, as shown in
Figure 7d. The Najran Dam has a reservoir capacity of almost 8500 hectare-meters, which can store a sufficient amount of water during rainfall season and can keep Najran Valley safe from floods.
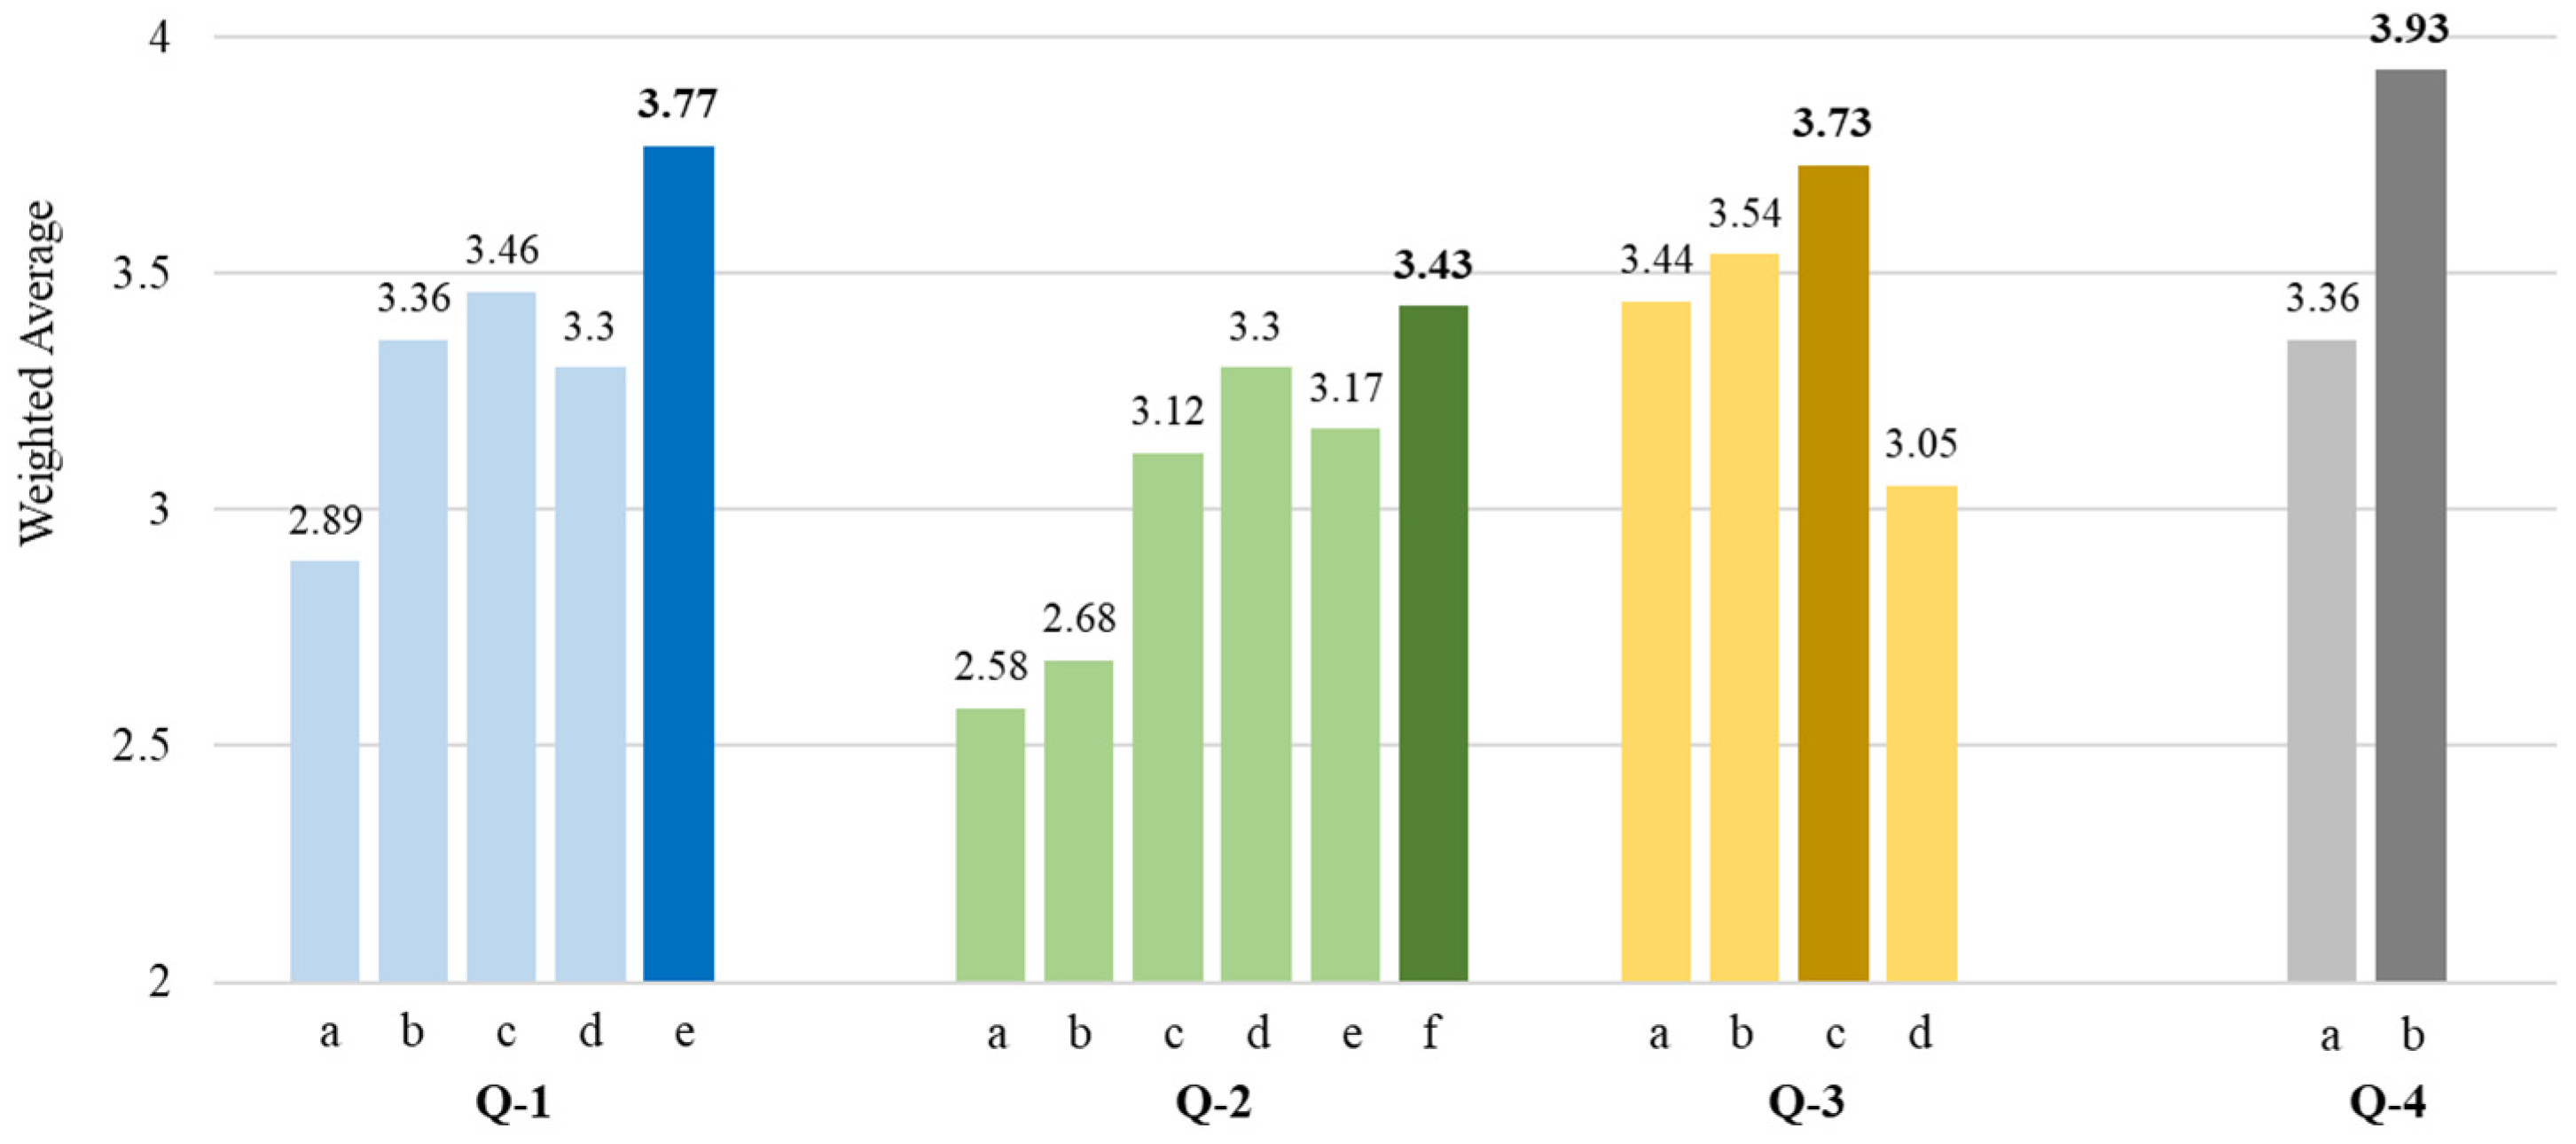
For comparison, the responses obtained for Questions 1 to 4 were converted to a weighted average (WA) by using Equation (1) to obtain o the listed factors having the maximum influence, as shown in
Figure 9. It can be seen that the WA for a few of the options is peaking as compared to others. These options having the highest WA were rated as the highest priority by the respondents. The highest strength of response was found for Q-4, where people agreed to the fact that the construction of the Najran Dam has reduced the risk of floods that used to happen before the existence of the dam.
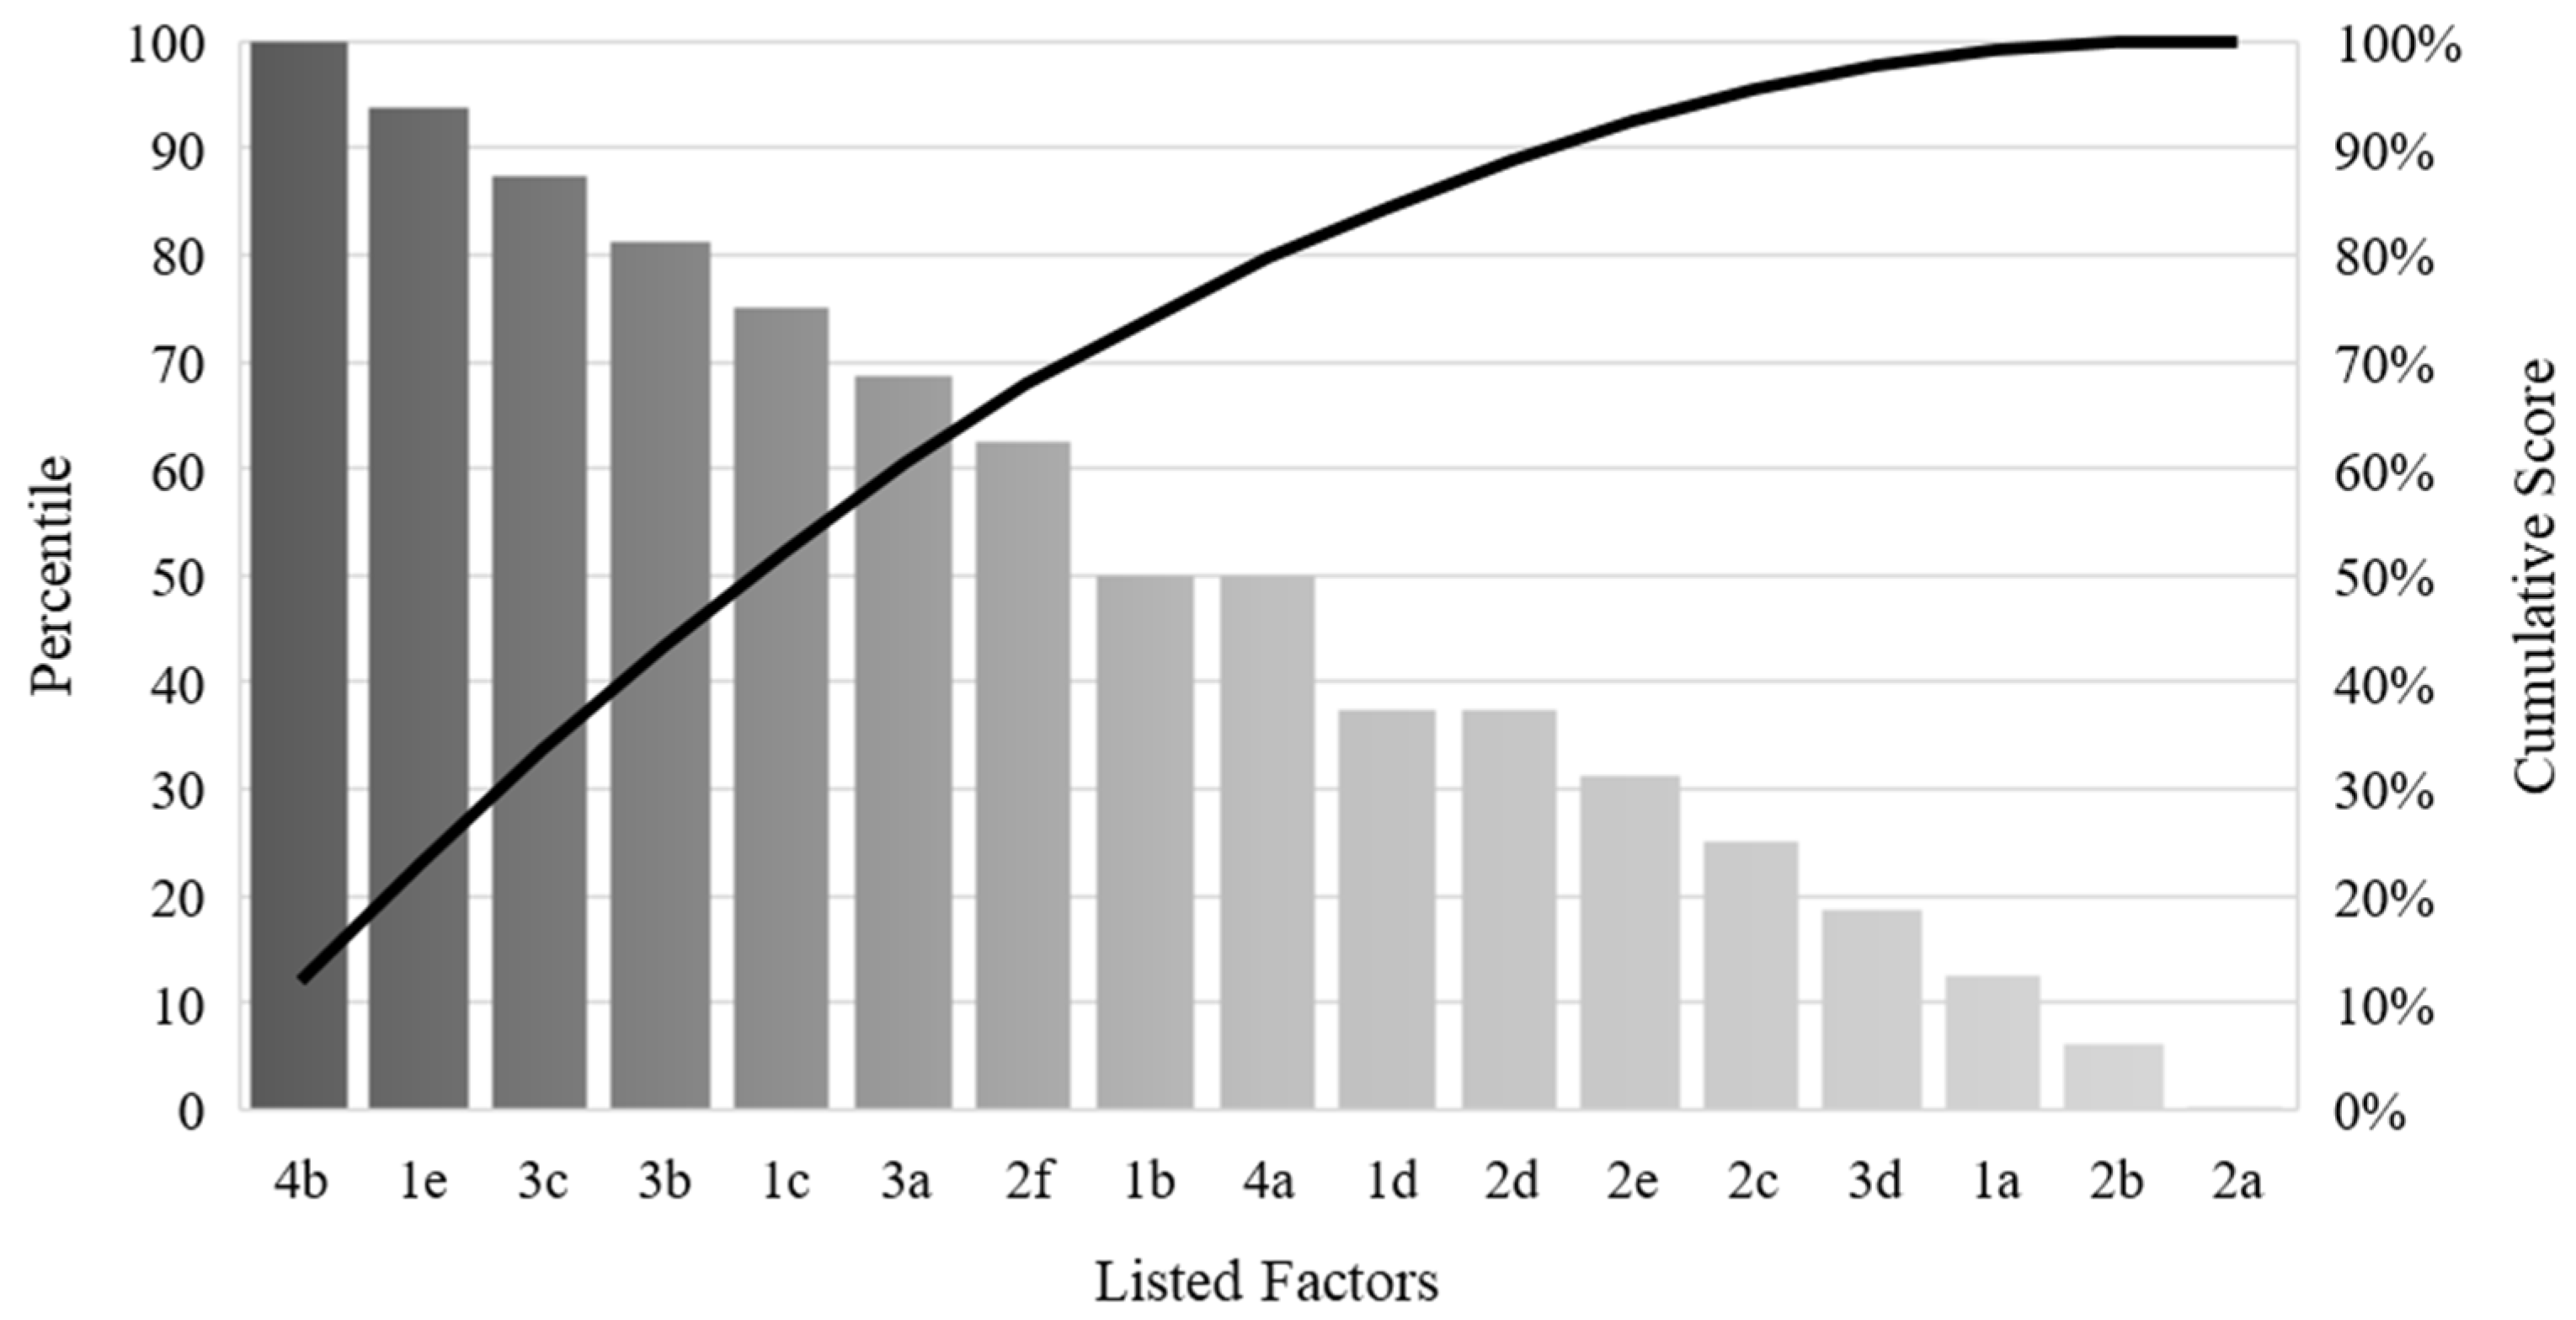
For validation of the results obtained through the survey, the percentile rank was calculated for all the factors listed in the questionnaire by using Equation (2). The results of the PR analysis are shown in
Table 7 and
Figure 10, where factors are now listed as per their ranks.
The data regarding the groundwater level in Al Wajid aquifer in Najran were also compiled to observe the actual situation of water availability [
12,
50,
51,
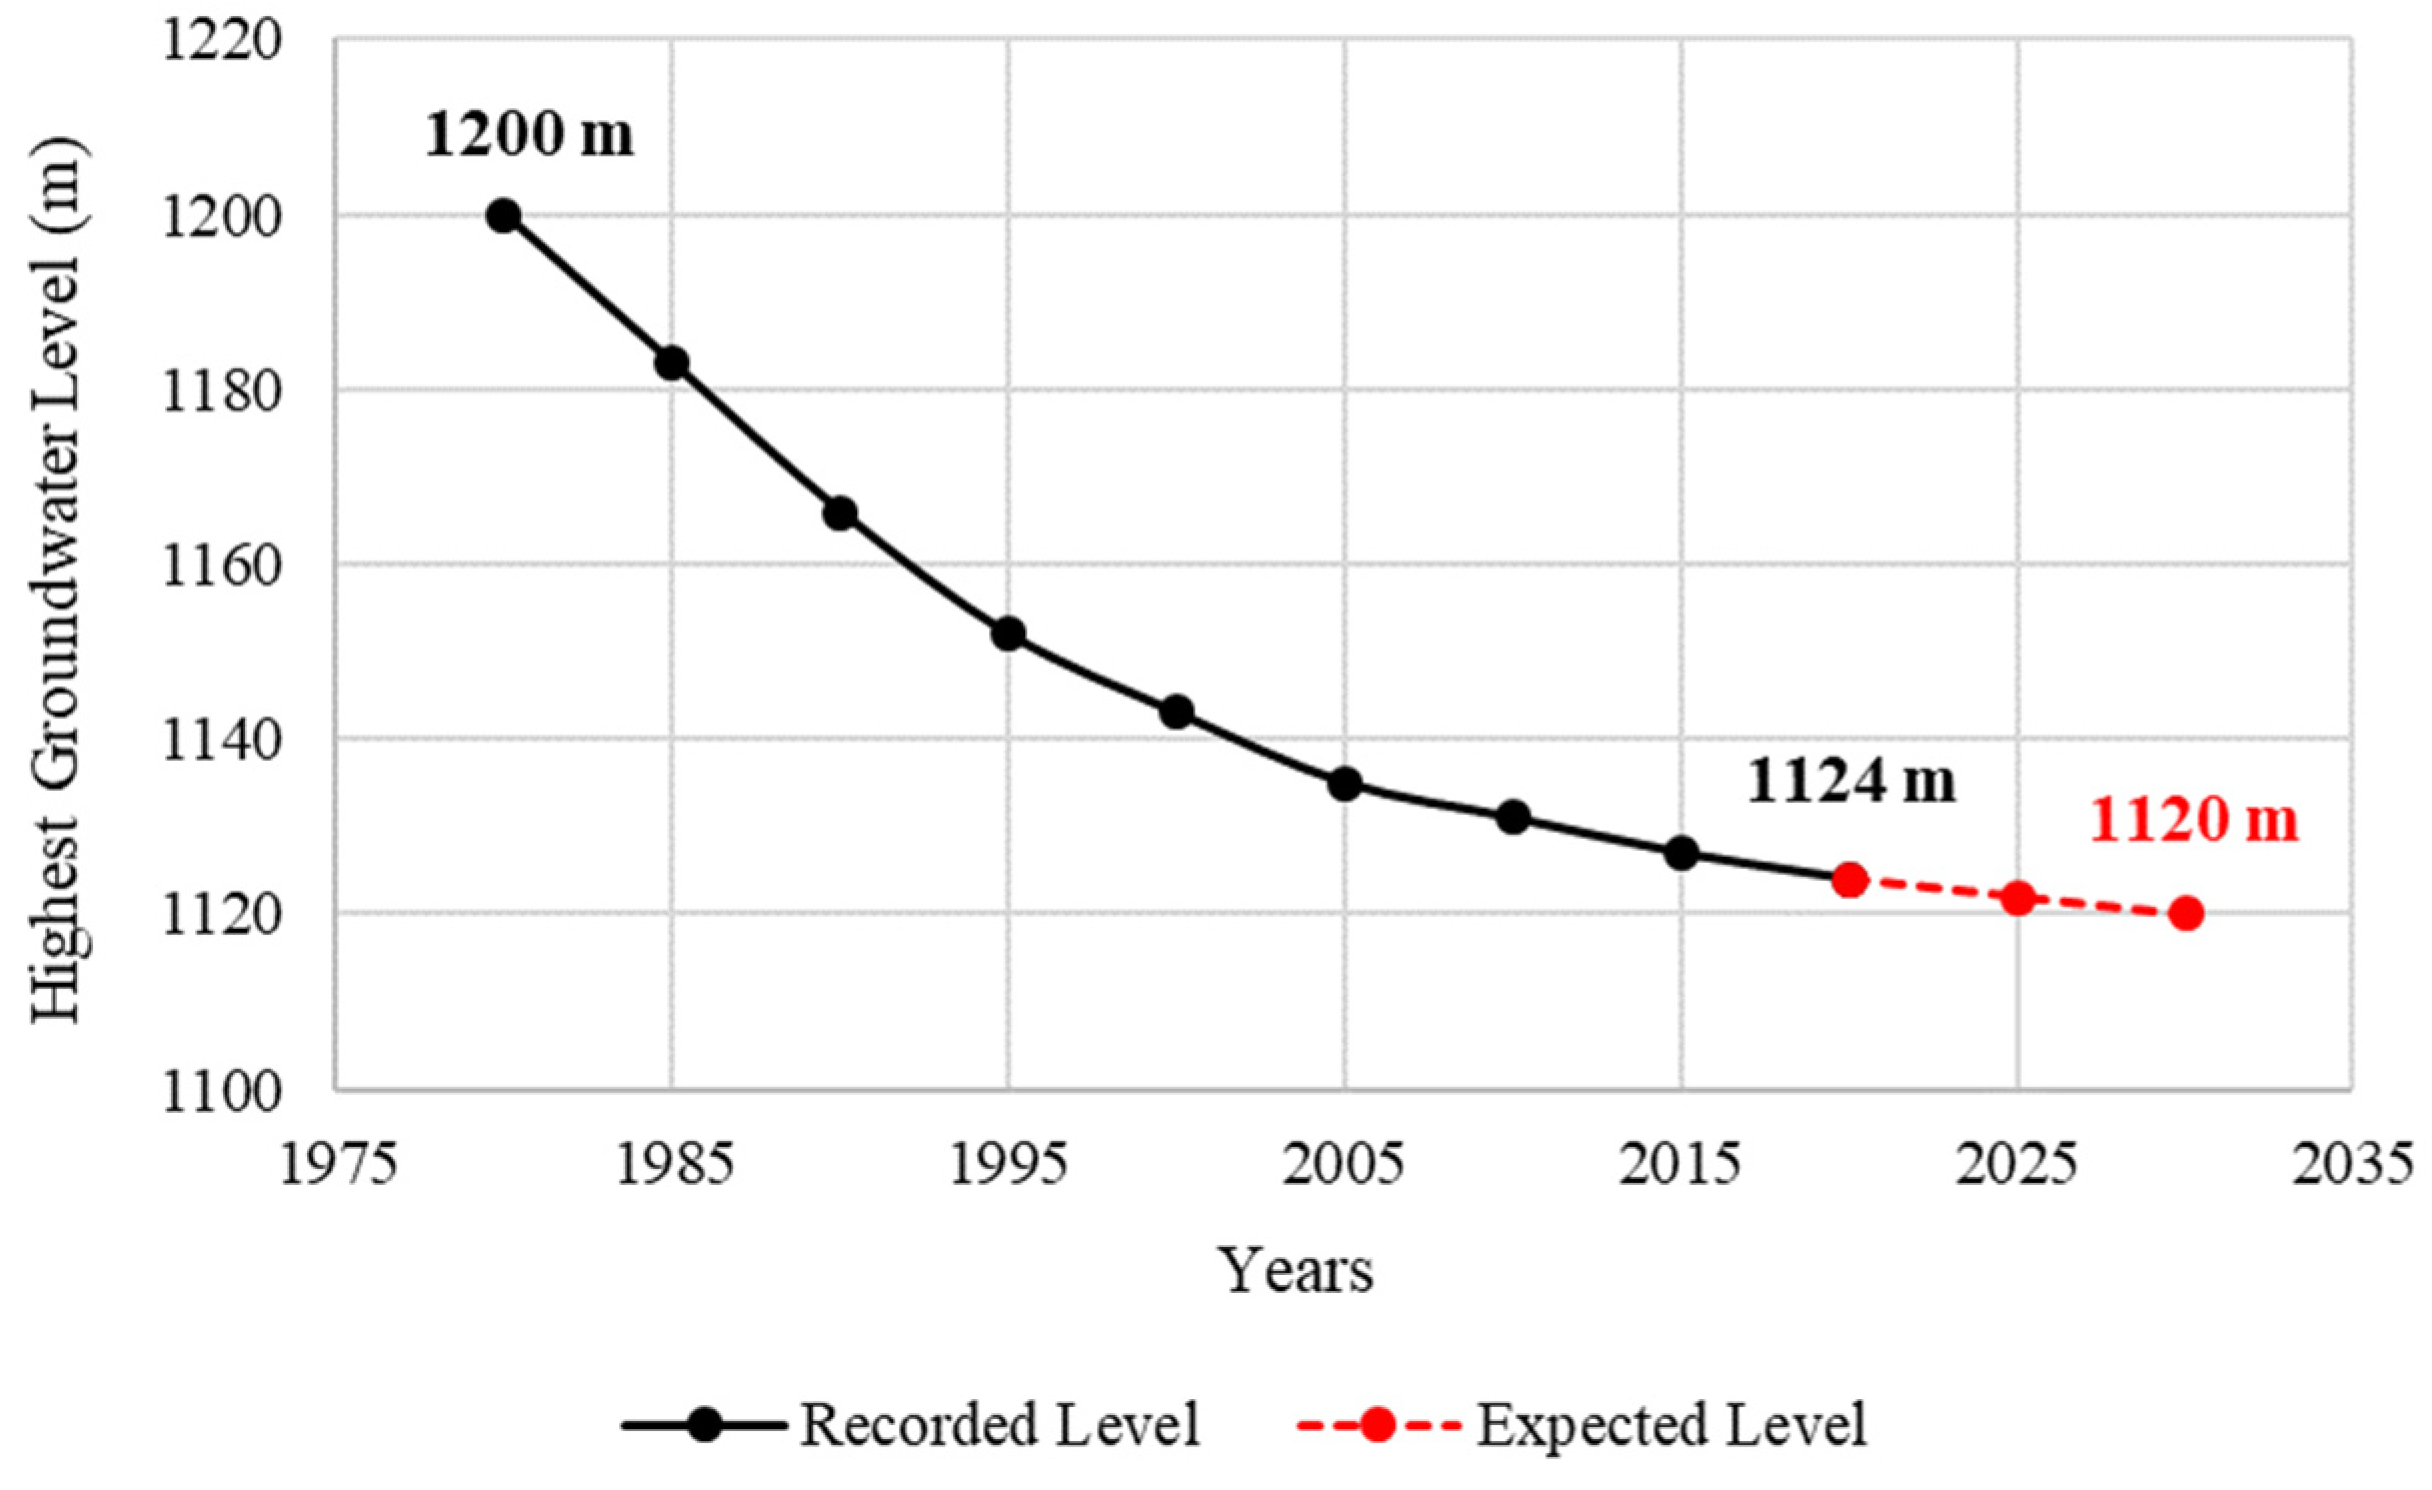
52]. The maximum groundwater level recorded during the years 1980–2020 is shown in
Figure 11. Following the trend of the groundwater level over the years, the latter was forecasted for the year 2030, and it was found that if no proper measures are taken in the future, the groundwater level may further reduce to 1120 m above mean sea level, which was recorded as 1124 m above mean sea level during the year 2020. The expected decrease in the groundwater level at Najran is shown as a dotted line in
Figure 11.


 ,
, 


