
Urban Population Flood Impact Applied to a Warsaw Scenario


Abstract
:1. Introduction
2. Materials and Methods
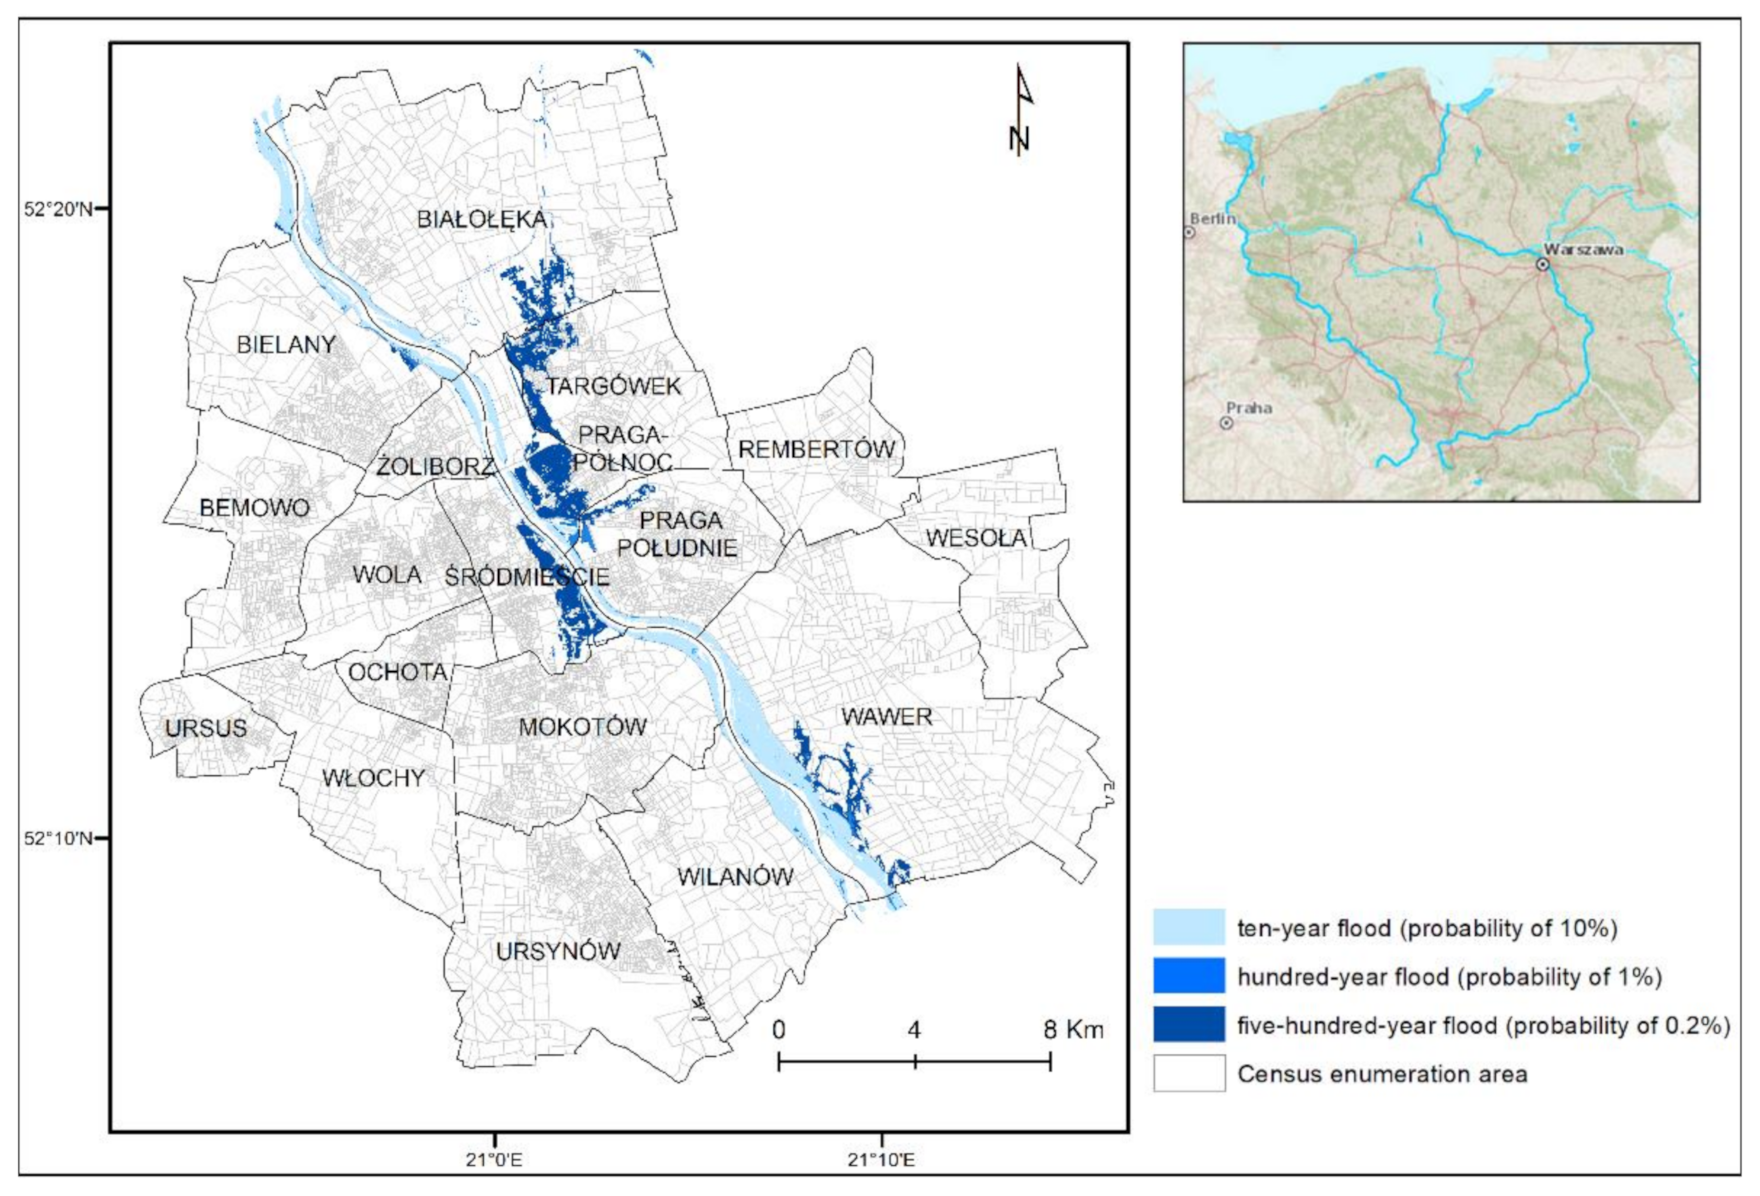
2.1. Study Area and Data Used Description
2.2. Method Applied
- A flood-occurrence probability () amounts to 10%, 1%, 0.2% for high, moderate and low probability floods, correspondingly.
- A flood scenario is characterised by the floodwater level. This factor also implicates the flood horizontal extent, i.e., area prone to flooding.
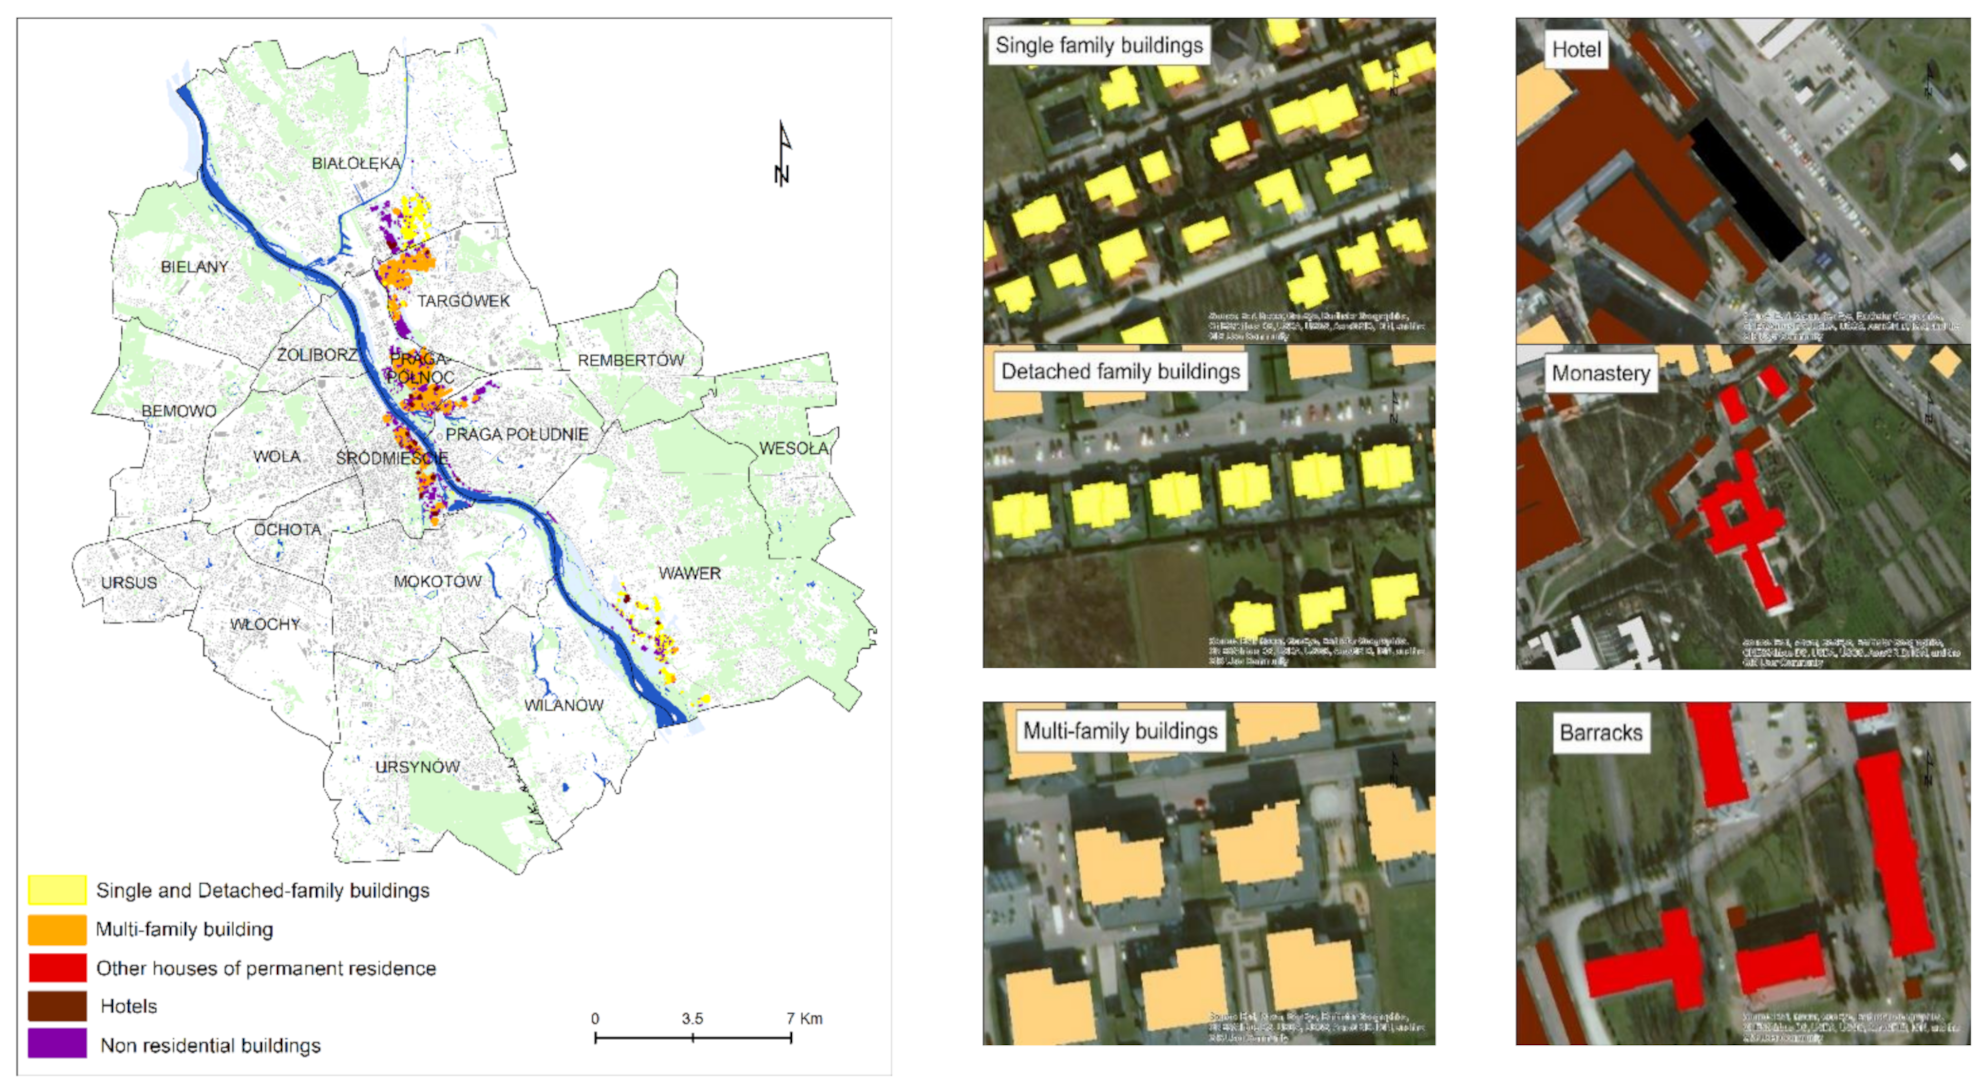
- One building is the smallest spatial reference unit.
- A building’s occupant capacity (hereinafter referred to as building capacity and denoted as ) was introduced and defined as the number of permanent residents of any type of residential building or hotel.
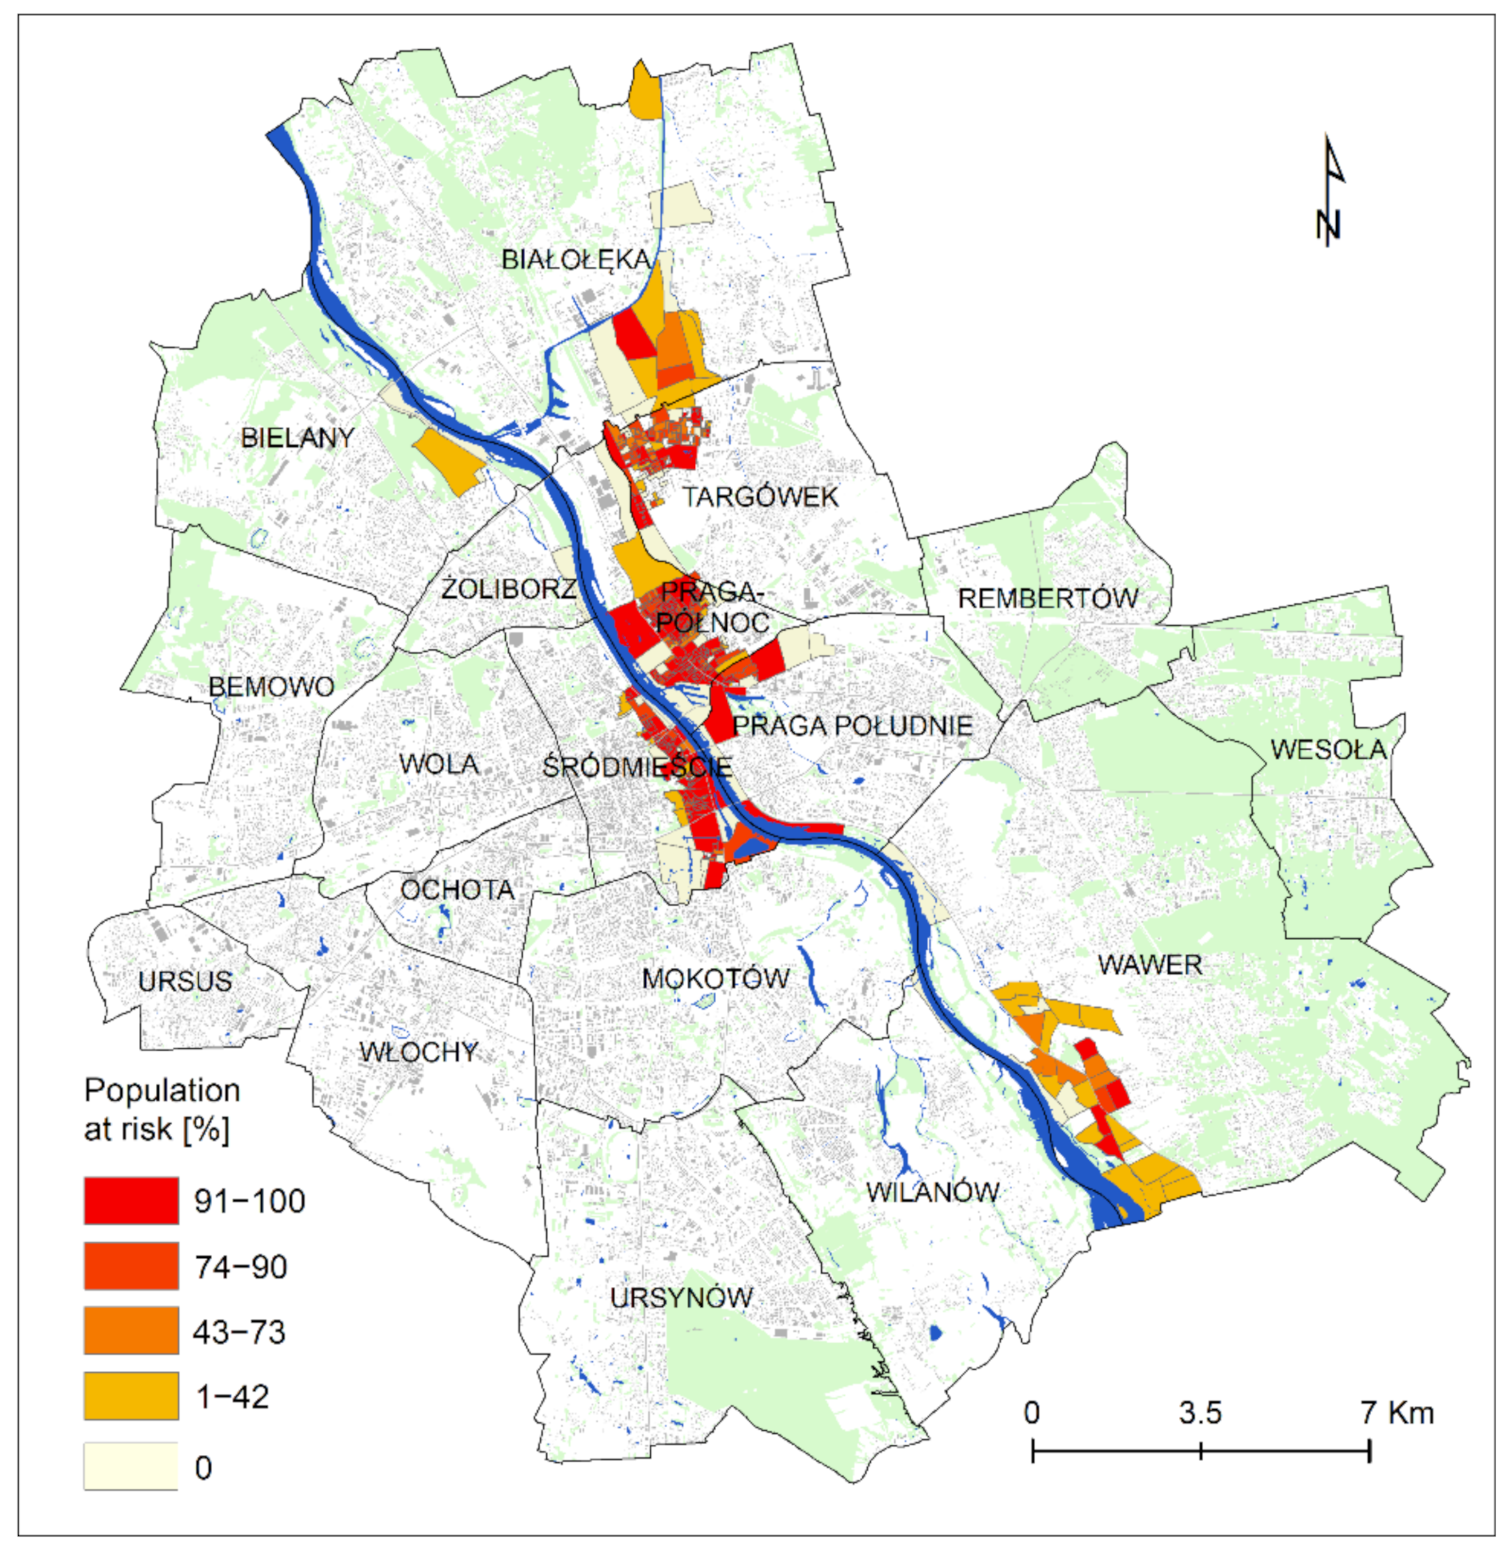
3. Results
4. Discussion
4.1. Building Capacity
4.2. Impact of Flooding on Building’s Residents
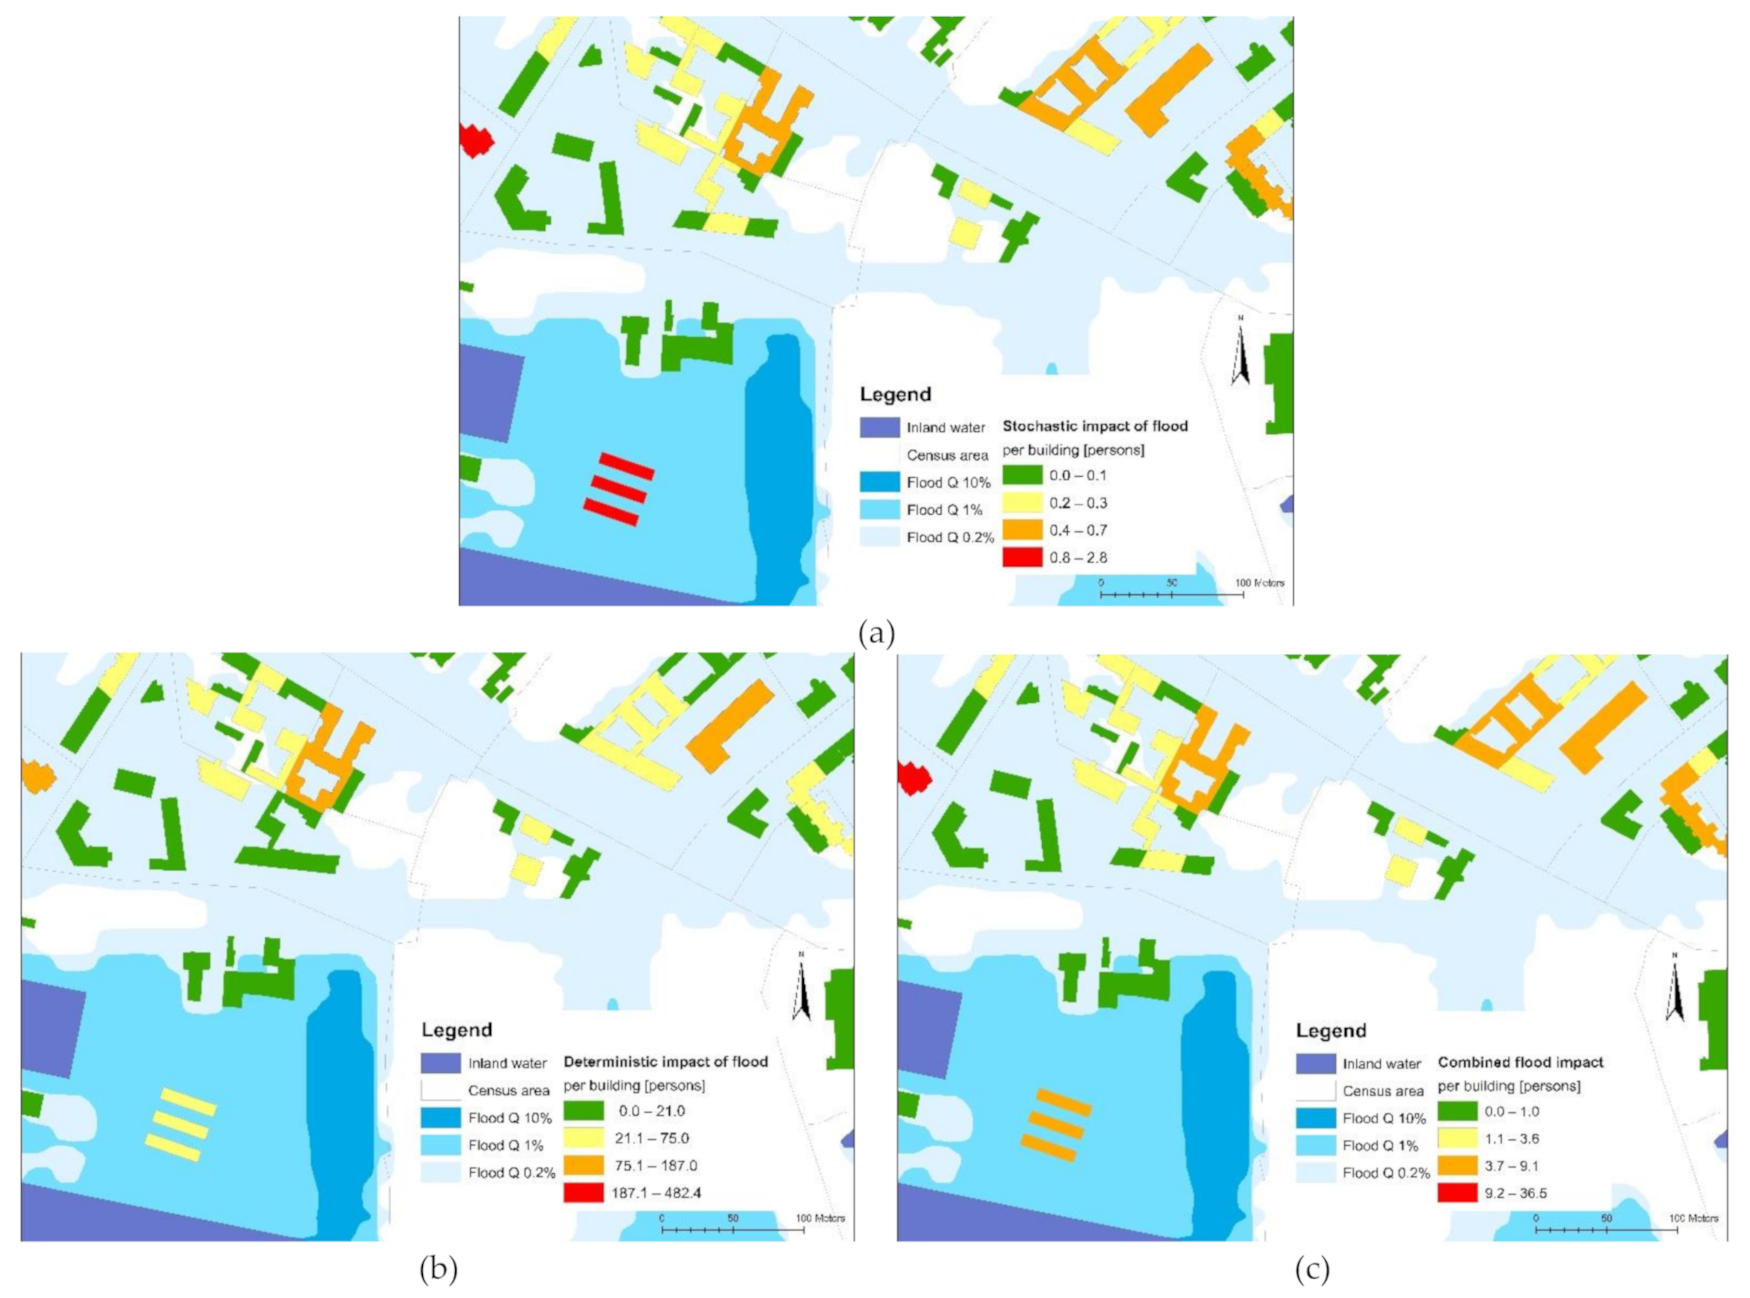
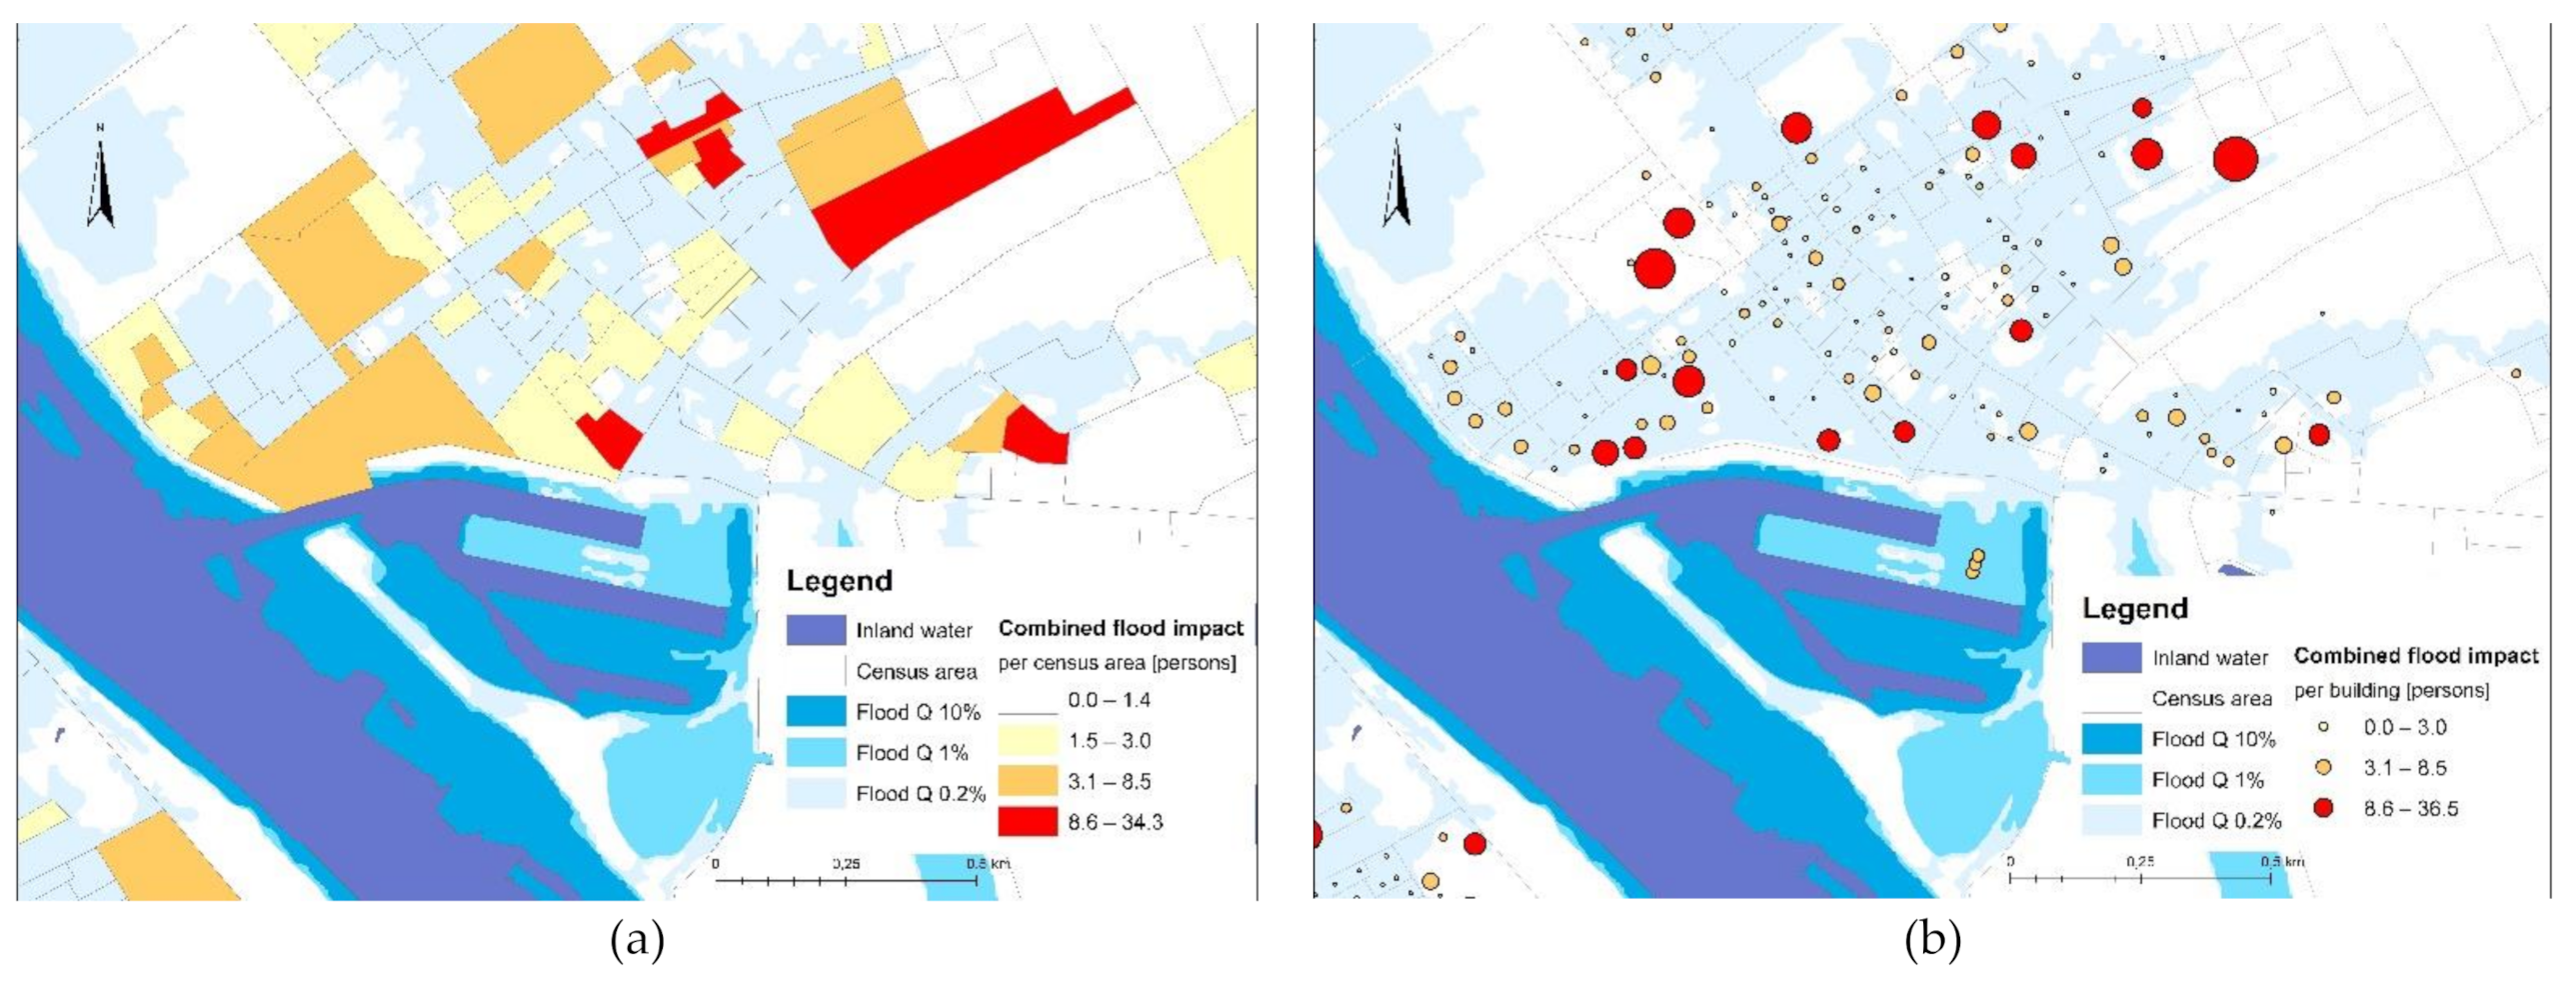
4.3. Flood Impact Cartographic Visualisation
5. Conclusions
Author Contributions
Funding
Institutional Review Board Statement
Informed Consent Statement
Data Availability Statement
Acknowledgments
Conflicts of Interest
References
- Kundzewicz, Z. Adapting flood preparedness tools to changing flood risk conditions: The situation in Poland. Oceanology 2014, 56, 385–407. [Google Scholar] [CrossRef] [Green Version]
- Kron, W.; Eichner, J.; Kundzewicz, Z.W. Reduction of flood risk in Europe—Reflections from a reinsurance perspective. J. Hydrol. 2019, 576, 197–209. [Google Scholar] [CrossRef]
- EEA European Environment Agency. Economic Losses from Climate-Related Extremes; European Environment Agency (EEA): Copenhagen, Denmark, 2017; p. 17. [Google Scholar]
- Wallemacq, P.; House, R. Economic Losses, Poverty & Disasters (1998–2017). United Nations Office for Disaster Risk Reduction (UNISDR) and Centre for Research on the Epidemiology of Disasters (CRED). Available online: https://www.unisdr.org/files/61119_credeconomiclosses.pdf (accessed on 10 December 2020).
- Ritchie, H.; Roser, M. Natural Disasters. 2014. Available online: https://ourworldindata.org/natural-disasters (accessed on 10 April 2021).
- Roudier, P.; Andersson, J.C.M.; Donnelly, C.; Feyen, L.; Greuell, W.; Ludwig, F. Projections of future floods and hydrological droughts in Europe under a +2 °C global warming. Clim. Chang. 2016, 135, 341–355. [Google Scholar] [CrossRef] [Green Version]
- Rojas, R.; Feyen, L.; Bianchi, A.M.; Dosio, A. Assessment of future flood hazard in Europe using a large ensemble of bias-corrected regional climate simulations. J. Geophys. Res. Space Phys. 2012, 117. [Google Scholar] [CrossRef]
- Blöschl, G.; Hall, J.; Parajka, J.; Perdigão, R.A.P.; Merz, B.; Arheimer, B.; Aronica, G.T.; Bilibashi, A.; Bonacci, O.; Borga, M.; et al. Changing climate shifts timing of European floods. Science 2017, 357, 588–590. [Google Scholar] [CrossRef] [PubMed] [Green Version]
- Blöschl, G.; Hall, J.; Viglione, A.; Perdigão, R.A.P.; Parajka, J.; Merz, B.; Lun, D.; Arheimer, B.; Aronica, G.T.; Bilibashi, A.; et al. Changing climate both increases and decreases European river floods. Nature 2019, 573, 108–111. [Google Scholar] [CrossRef]
- Tanoue, M.; Hirabayashi, Y.; Ikeuchi, H. Global-scale river flood vulnerability in the last 50 years. Sci. Rep. 2016, 6, 36021. [Google Scholar] [CrossRef]
- Alfieri, L.; Dottori, F.; Betts, R.; Salamon, P.; Feyen, L. Multi-Model Projections of River Flood Risk in Europe under Global Warming. Climate 2018, 6, 6. [Google Scholar] [CrossRef] [Green Version]
- Schultz, B. Flood management under rapid urbanisation and industrialisation in flood-prone areas: A need for serious consid-eration. Irrig. Drain. 2006, 55, S3–S8. [Google Scholar] [CrossRef]
- Kron, W.; Löw, P.; Kundzewicz, Z.W. Changes in risk of extreme weather events in Europe. Environ. Sci. Policy 2019, 100, 74–83. [Google Scholar] [CrossRef]
- Bouwer, L.M.; Bubeck, P.; Aerts, J.C.J.H. Changes in future flood risk due to climate and development in a Dutch polder area. Glob. Environ. Chang. 2010, 20, 463–471. [Google Scholar] [CrossRef]
- Papilloud, T.; Röthlisberger, V.; Loreti, S.; Keiler, M. Flood exposure analysis of road infrastructure—Comparison of different methods at national level. Int. J. Disaster Risk Reduct. 2020, 47, 101548. [Google Scholar] [CrossRef]
- Jongman, B.; Ward, P.J.; Aerts, J.C.J.H. Global exposure to river and coastal flooding: Long term trends and changes. Glob. Environ. Chang. 2012, 22, 823–835. [Google Scholar] [CrossRef]
- Jenelius, E.; Mattsson, L.-G. Road network vulnerability analysis: Conceptualization, implementation and application. Comput. Environ. Urban. Syst. 2015, 49, 136–147. [Google Scholar] [CrossRef]
- Hossain, M.K.; Meng, Q. A fine-scale spatial analytics of the assessment and mapping of buildings and population at different risk levels of urban flood. Land Use Policy 2020, 99, 104829. [Google Scholar] [CrossRef]
- Bhola, P.K.; Leandro, J.; Disse, M. Building hazard maps with differentiated risk perception for flood impact assessment. Nat. Hazards Earth Syst. Sci. 2020, 20, 2647–2663. [Google Scholar] [CrossRef]
- Röthlisberger, V.; Zischg, A.P.; Keiler, M. Identifying spatial clusters of flood exposure to support decision making in risk management. Sci. Total. Environ. 2017, 598, 593–603. [Google Scholar] [CrossRef] [Green Version]
- Kappes, M.; Gruber, K.; Frigerio, S.; Bell, R.; Keiler, M.; Glade, T. The MultiRISK platform: The technical concept and application of a regional-scale multihazard exposure analysis tool. Geomorphol. 2012, 151–152, 139–155. [Google Scholar] [CrossRef]
- Calka, B.; Da Costa, J.N.; Bielecka, E. Fine scale population density data and its application in risk assessment. Geomatics. Nat. Hazards Risk 2017, 8, 1440–1455. [Google Scholar] [CrossRef]
- Hirabayashi, Y.; Mahendran, R.; Koirala, S.; Konoshima, L.; Yamazaki, D.; Watanabe, S.; Kim, H.; Kanae, S. Global flood risk under climate change. Nat. Clim. Chang. 2013, 3, 816–821. [Google Scholar] [CrossRef]
- Kolen, B.; Kutschera, G.; Helsloot, I. A Comparison Between the Netherlands and Germany of Evacuation in Case of Extreme Flooding. In Proceedings of the Urban Flood Conference, Paris, France, 26–27 September 2010; Available online: https://www.hkv.nl/wp-content/uploads/2020/07/A_Comparison_between_The_Netherlands_and_Germany_BK_verkortwebsite.pdf (accessed on 1 February 2021).
- Zhu, S.; Dai, Q.; Zhao, B.; Shao, J. Assessment of Population Exposure to Urban Flood at the Building Scale. Water 2020, 12, 3253. [Google Scholar] [CrossRef]
- Darabi, H.; Haghighi, A.T.; Mohamadi, M.A.; Rashidpour, M.; Ziegler, A.D.; Hekmatzadeh, A.A.; Kløve, B. Urban flood risk mapping using data-driven geospatial techniques for a flood-prone case area in Iran. Hydrol. Res. 2020, 51, 127–142. [Google Scholar] [CrossRef] [Green Version]
- Messner, F.; Meyer, V. Guidelines for Direct, Tangible Flood Damage Evaluation. Evaluating Flood Damages: Guidance and Recommendations on Principles and Methods. Report No. T09-06-01. 2007. Available online: http://www.floodsite.net/html/grenoble_workshop/documents/Floodsite_Task9Review_Feb2008_short.pdf (accessed on 24 February 2021).
- Oliveri, E.; Santoro, M. Estimation of urban structural flood damages: The case study of Palermo. Urban. Water 2000, 2, 223–234. [Google Scholar] [CrossRef]
- Gutry-Korycka, M.; Magnuszewski, A.; Suchożebrski, J.; Jaworski, W.; Marcinkowski, M.; Szydłowski, M. Numerical estimation of flood zones in the Vistula River valley, Warsaw, Poland. In Proceedings of the 5th FRIEND World Conference (Climate Variability and Change—Hydrological Impacts), Havana, Cuba, 10–16 November 2006; IAHS Publ. 308: Wallington, UK, 2006. [Google Scholar]
- De Moel, H.; Aerts, J.C.J.H. Effect of uncertainty in land use, damage models and inundation depth on flood damage estimates. Nat. Hazards 2011, 58, 407–425. [Google Scholar] [CrossRef] [Green Version]
- Park, K.; Won, J.-H. Analysis on distribution characteristics of building use with risk zone classification based on urban flood risk assessment. Int. J. Disaster Risk Reduct. 2019, 38, 101192. [Google Scholar] [CrossRef]
- Nriagu, J. Encyclopedia of Environmental Health, 2nd ed.Elsevier: Amsterdam, The Netherlands, 2019; ISBN 978-0-444-63952-3. [Google Scholar]
- Zabini, F.; Grasso, V.; Crisci, A.; Gozzini, B. How do people perceive flood risk? Findings from a public survey in Tuscany, Italy. J. Flood Risk Manag. 2021, 14. [Google Scholar] [CrossRef]
- Mol, J.M.; Botzen, W.J.W.; Blasch, J.E.; De Moel, H. Insights into Flood Risk Misperceptions of Homeowners in the Dutch River Delta. Risk Anal. 2020, 40, 1450–1468. [Google Scholar] [CrossRef] [Green Version]
- Kellens, W.; Terpstra, T.; De Maeyer, P. Perception and Communication of Flood Risks: A Systematic Review of Empirical Research. Risk Anal. 2013, 33, 24–49. [Google Scholar] [CrossRef] [Green Version]
- Hagemeier-Klose, M.; Wagner, K. Evaluation of flood hazard maps in print and web mapping services as information tools in flood risk communication. Nat. Hazards Earth Syst. Sci. 2009, 9, 563–574. [Google Scholar] [CrossRef]
- ISOK. Country’s Protection Against Extreme Hazards. Available online: https://imgw.isok.gov.pl/index.html (accessed on 4 November 2020).
- Directive 2007/60/EC of the European Parliament and of the Council of 23 October 2007 on the Assessment and Management of Flood Risks. Official Journal of the European Union, L 288/27, 06 November 2007. Available online: https://eur-lex.europa.eu/legal-content/EN/TXT/PDF/?uri=OJ:L:2007:288:FULL&from=EN (accessed on 4 January 2021).
- Water Act, the Act of July 20, 2017. J. Law 2017, 1566. Available online: https://isap.sejm.gov.pl/isap.nsf/download.xsp/WDU20170001566/U/D20171566Lj.pdf (accessed on 4 January 2021).
- Regulation of Ministry of 21 November 2012 on the Development of Flood hazard Maps and Flood Risk Maps. J. Laws 2013, 104. Available online: http://isap.sejm.gov.pl/isap.nsf/download.xsp/WDU20130000104/O/D20130104.pdf (accessed on 19 November 2020).
- Birkmann, J.; Welle, T. Assessing the risk of loss and damage: Exposure, vulnerability and risk to climate-related hazards for different country classifications. Int. J. Glob. Warm. 2015, 8, 191–212. [Google Scholar] [CrossRef]
- Kreimer, A. Social and Economic Impacts of Natural Disasters. Int. Geol. Rev. 2001, 43, 401–405. [Google Scholar] [CrossRef]
- Magnuszewski, A.; Moran, S. Vistula river bad erosion processes and their influence on Warsaw’s flood safety. In Proceedings of the Sediment Dynamics from the Summit to the Sea Symposium, New Orleans, LA, USA, 11–14 December 2014; p. 367. [Google Scholar] [CrossRef]
- Cyberski, J.; Grześ, M.; Gutry-Korycka, M.; Nachlik, E.; Kundzewicz, Z. History of floods on the River Vistula. Hydrol. Sci. J. 2006, 51, 799–817. [Google Scholar] [CrossRef]
- Bielecka, E.; Calka, B.; Bitner, A. Spatial distribution of urban greenery in Warsaw. A quantitative approach. In Proceedings of 7th International Conference on Cartography and GIS.; Sozopol, Bulgaria, 18–23 June 2018; Bandrova, T., Konečný, M., Eds.; Bulgarian Cartographic Association: Sofia, Bulgaria, 2018; pp. 408–416. Available online: https://iccgis2018.cartography-gis.com/proceedings (accessed on 24 February 2021).
- Zmudzka, E.; Kulesza, K.; Lenartowicz, M.; Leziak, K.; Magnuszewski, A. Assessment of modern hydro-meteorological hazards in a big city—Identification for Warsaw. Meteorol. Appl. 2019, 26, 500–510. [Google Scholar] [CrossRef] [Green Version]
- Bielecka, E.; Dukaczewski, D.; Janczar, E. Spatial Data Infrastructure in Poland—Lessons learnt from so far achievements. Geod. Cartogr. 2018, 67, 3–23. [Google Scholar] [CrossRef]
- The Polish Spatial Infrastructure Geoportal. Available online: https://mapy.geoportal.gov.pl/imap/Imgp_2.html?gpmap=gp0 (accessed on 5 November 2020).
- Matczak, P.; Lewandowski, J.; Choryński, A.; Szwed, M.; Kundzewicz, Z.W. Doing more while remaining the same? Flood risk governance in Poland. J. Flood Risk Manag. 2018, 11, 239–249. [Google Scholar] [CrossRef]
- Council of Ministers. Regulation of the Council of Ministers of December 15, 1998 on the detailed rules for maintaining, ap-plying and making available the national official register of territorial division of the country and the related obligations of government administration bodies and local government units. J. Law 1998, 1031. [Google Scholar]
- Local Data Bank, Central Statistical Office, Warsaw, Poland. Available online: https://bdl.stat.gov.pl/BDL/dane/podgrup/temat (accessed on 4 January 2021).
- Voss, P.R.; Long, D.D.; Hammer, R.B. When Census Geography Doesn’t Work: Using Ancillary Information to Improve the Spatial Interpolation of Demographic Data; CDE Working Paper No. 99–26; Center for Demography and Ecology, University of Wisconsin: Madison, WI, USA, 1999. [Google Scholar]
- Thompson, C.M.; Frazier, T.G. Deterministic and probabilistic flood modeling for contemporary and future coastal and inland precipitation inundation. Appl. Geogr. 2014, 50, 1–14. [Google Scholar] [CrossRef]
- Calka, B.; Bielecka, E.; Zdunkiewicz, K. Redistribution population data across a regular spatial grid according to buildings characteristics. Geod. Cartogr. 2016, 65, 149–162. [Google Scholar] [CrossRef]
- Jenks, G.F. The Data Model Concept in Statistical Mapping. Int. Yearb. Cartogr. 1967, 7, 186–190. [Google Scholar]
- Messner, F.; Meyer, V. Flood damage, vulnerability and risk perception—challenges for flood damage research. In Flood Risk Management: Hazards, Vulnerability and Mitigation Measures; Schanze, J., Zeman, E., Marsalek, J., Eds.; Springer: Dordrecht, The Netherlands, 2005; Volume 67, pp. 149–167. [Google Scholar]
- De Almeida, L.Q.; Welle, T.; Birkmann, J. Disaster risk indicators in Brazil: A proposal based on the world risk index. Int. J. Disaster Risk Reduct. 2016, 17, 251–272. [Google Scholar] [CrossRef]
- Da Costa, J.N.; Bielecka, E.; Calka, B. Uncertainty Quantification of the Global Rural-Urban Mapping Project over Polish Census Data. In Proceedings of the 10th International Conference Environmental Engineering; Vilnius Gediminas Technical University, Vilnius, Lithuania, 27–28 April 2017. [Google Scholar]
- Calka, B.; Bielecka, E. Reliability Analysis of LandScan Gridded Population Data. The Case Study of Poland. ISPRS Int. J. Geo-Inf. 2019, 8, 222. [Google Scholar] [CrossRef] [Green Version]
- Calka, B.; Bielecka, E. GHS-POP Accuracy Assessment: Poland and Portugal Case Study. Remote Sens. 2020, 12, 1105. [Google Scholar] [CrossRef] [Green Version]
- Chen, K. An approach to linking remotely sensed data and areal census data. Int. J. Remote Sens. 2002, 23, 37–48. [Google Scholar] [CrossRef]
- Wu, C.; Murray, A.T. Population Estimation Using Landsat Enhanced Thematic Mapper Imagery. Geogr. Anal. 2007, 39, 26–43. [Google Scholar] [CrossRef]
- Tomás, L.; Fonseca, L.M.G.; Almeida, C.; Leonardi, F.; Pereira, M.N. Urban population estimation based on residential buildings volume using IKONOS-2 images and lidar data. Int. J. Remote Sens. 2016, 37, 1–28. [Google Scholar] [CrossRef] [Green Version]
- Lwin, K.; Murayama, Y. A GIS Approach to Estimation of Building Population for Micro-spatial Analysis. Trans. GIS 2009, 13, 401–414. [Google Scholar] [CrossRef]
- ElFouly, M.; Labetski, A. Flood damage cost estimation in 3D based on an indicator modelling framework. Geomat. Nat. Hazards Risk 2020, 11, 1129–1153. [Google Scholar] [CrossRef]
- Merz, B.; Kreibich, H.; Thieken, A.; Schmidtke, R. Estimation uncertainty of direct monetary flood damage to buildings. Nat. Hazards Earth Syst. Sci. 2004, 4, 153–163. [Google Scholar] [CrossRef] [Green Version]
- Merz, B.; Kreibich, H.; Schwarze, R.; Thieken, A. Review article Assessment of economic flood damage. Nat. Hazards Earth Syst. Sci. 2010, 10, 1697–1724. [Google Scholar] [CrossRef]
- Bell, H.M.; Tobin, G.A. Efficient and effective? The 100-year flood in the communication and perception of flood risk. Environ. Hazards 2007, 7, 302–311. [Google Scholar] [CrossRef]
- WHO. Floods: Climate Change and Adaptation Strategies for Human Health. Report on a WHO Meeting, London, United Kingdom, 30 June–2 July 2002; EUR/02/5036813; WHO Regional Office for Europe: Copenhagen, Denmark, 2002. [Google Scholar]


| Data Source Name | Object Type | Data Stakeholder | Spatial Resolution | Temporal |
|---|---|---|---|---|
| Flood risk zones | Flood risk zones | State Water Holding ‘Polish Water’ | 1:10,000 [m] 1 | 2016–2021 |
| Topographic data (BDOT10k) | Buildings | Surveyor General | 1:10,000 [m] 2 | 2012; 2018–2019 |
| Territorial Division | Census enumeration area | Surveyor General | 1:10,000 [m] 1 | 2019 |
| Population | Population counts | Central Statistical Office | Census enumeration areas | 2011 |
| Housing economy and municipal | Average usable area of dwellings | Central Statistical Office | Warsaw districts | 2000–2019 |
| Infrastructure, Housing stocks | Average number of persons dwelling | Central Statistical Office | Warsaw districts | 2000–2019 |
| Water Level h [m] | Damage Function f(h, bf) [%] |
|---|---|
| h ≤ 0.5 | 20 |
| 0.5 < h ≤ 2 | 35 |
| 2 < h ≤ 4 | 60 |
| h > 4 | 95 |
| Building Function (bf) Name | bf Value | Dai [m2] | Pdi | Ari | Oh |
|---|---|---|---|---|---|
| Single-family building | 1 | 2.3 | |||
| Two-family building | 2 | 2.3 | |||
| Multi-family building | 3 | 59 | 2.3 | 0.75 | |
| Hotel | 4 | 18.5 | 1.5 | 0.70 | 0.75 |
| Monastery and parish house | 5 | 15 | 1.0 | 0.50 | |
| Other houses of permanent residence (i.e., children’s home, student dorm, workers’ hostel, boarding-school house, social care home, homeless shelter) | 6 | 10 | 2 | 0.65 |
| Building’s Type | Number of Buildings | Total Building’s Occupant Capacity | ||||
|---|---|---|---|---|---|---|
| 500-Year Flood | 100-Year Flood | 10-Year Flood | 500-Year Flood | 100-Year Flood | 10-Year flood | |
| Single-family building | 642 | 6 | 0 | 1478 | 14 | 0 |
| Two-family building | 2 | 0 | 0 | 9 | 0 | 0 |
| Multi-family building | 1184 | 0 | 0 | 111,292 | 0 | 0 |
| Hotel | 20 | 1 | 0 | 4233 | 57 | 0 |
| Monastery and parish house | 18 | 0 | 0 | 1096 | 0 | 0 |
| Other houses of permanent residence | 21 | 3 | 0 | 4761 | 262 | 0 |
| Other non-residential buildings | 1807 | 98 | 50 | 0 | 0 | 0 |
| All buildings | 3693 | 108 | 50 | -- | --- | --- |
| Total number of people | --- | --- | --- | 122,869 | 333 | 0 |
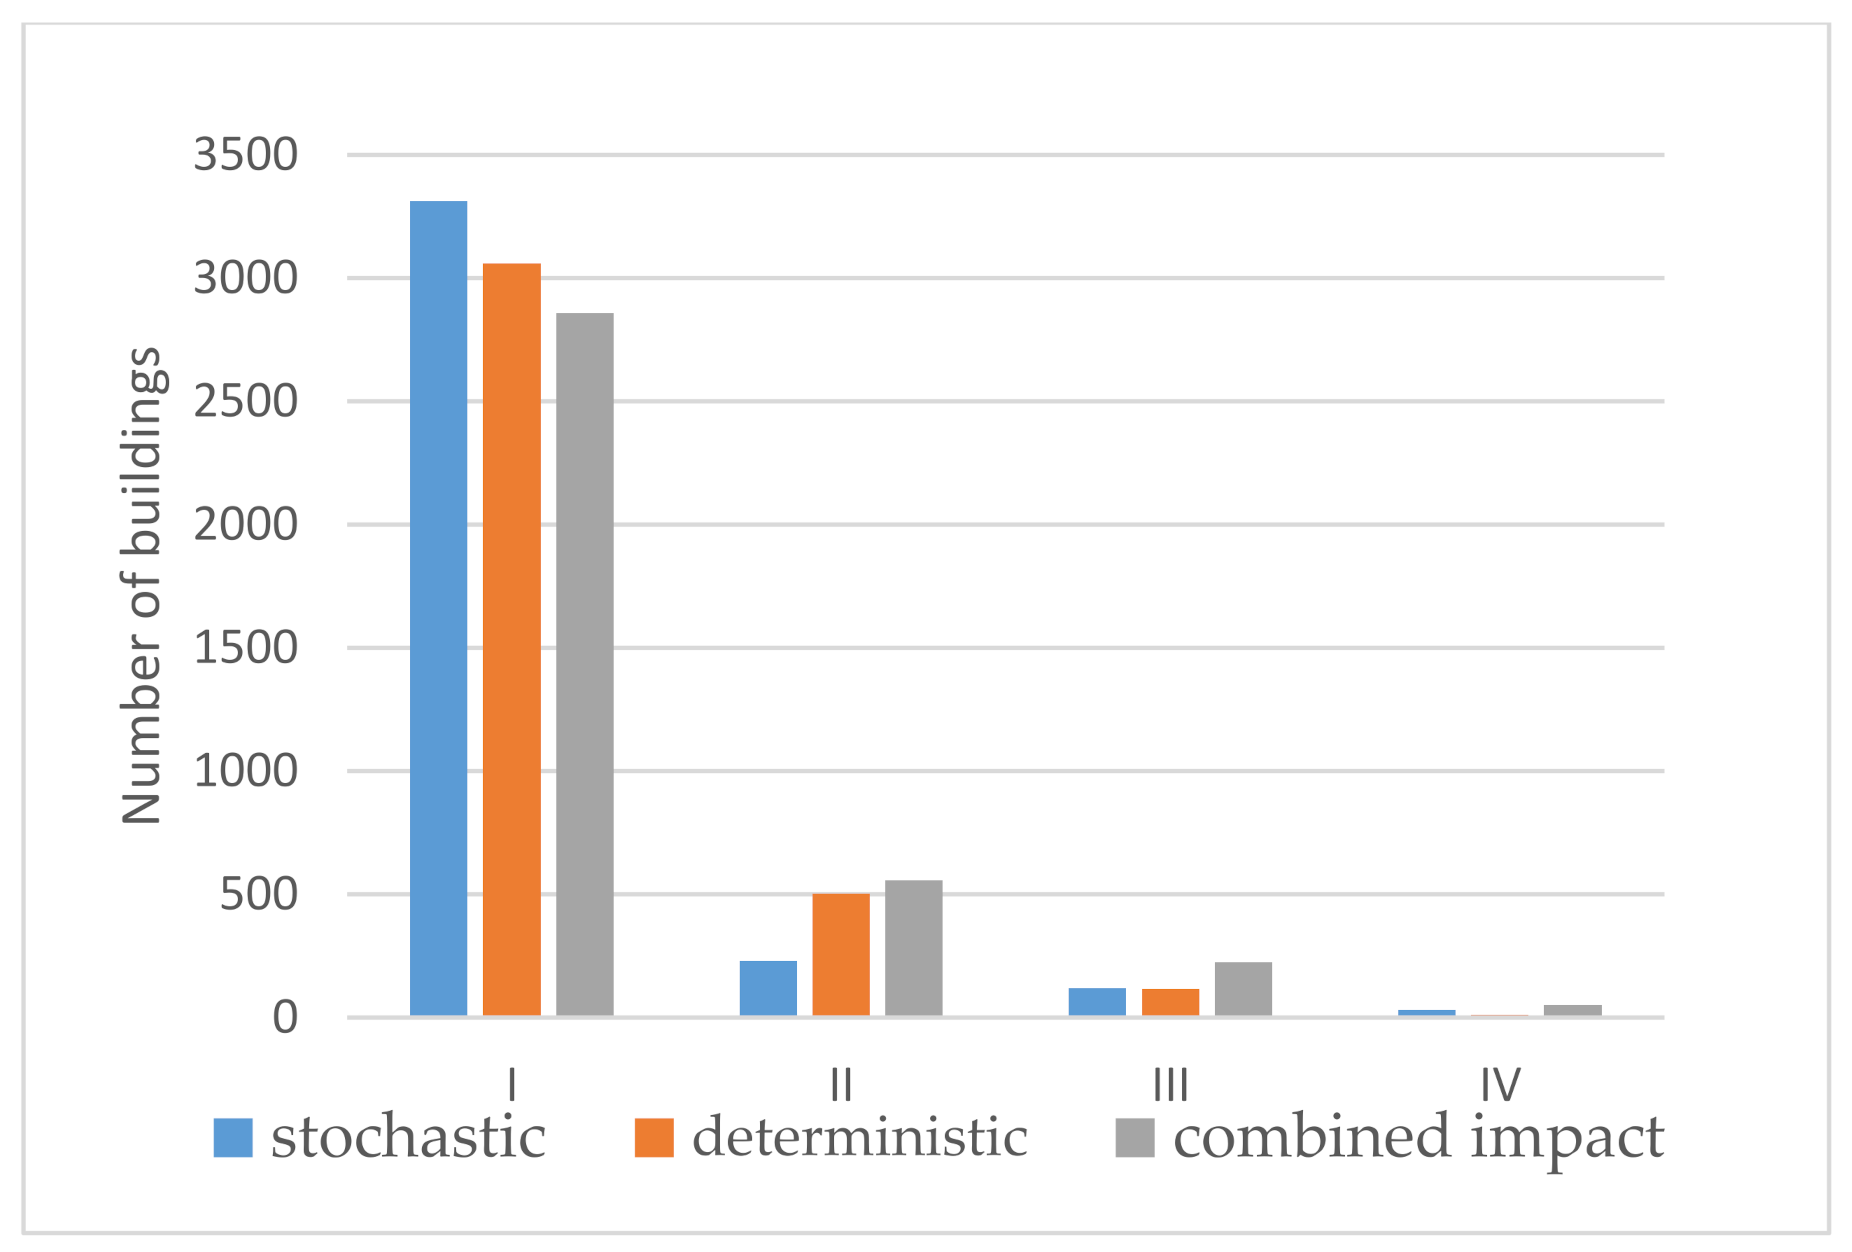
| Stochastic | Deterministic | Combined | ||||
|---|---|---|---|---|---|---|
| Flood Impact Class | Class Range | % of Buildings | Class Range | % of Buildings | Class Range | % of Buildings |
| I (low) | 0.0–0.1 | 89.7 | 0.0–21.0 | 82.9 | 0.0–1.0 | 77.4 |
| II (medium) | 0.2–0.3 | 6.2 | 21.1–75.0 | 13.6 | 1.1–3.6 | 15.1 |
| III (high) | 0.4–0.7 | 3.2 | 75.1–187.0 | 3.2 | 3.7–9.1 | 6.1 |
| IV (very high) | 0.8–2.8 | 0.8 | 187.1–482.4 | 0.3 | 9.2–36.5 | 1.4 |
| mean | 0.07 | n/a | 11.9 | n/a | 0.89 | n/a |
Publisher’s Note: MDPI stays neutral with regard to jurisdictional claims in published maps and institutional affiliations. |
© 2021 by the authors. Licensee MDPI, Basel, Switzerland. This article is an open access article distributed under the terms and conditions of the Creative Commons Attribution (CC BY) license (https://creativecommons.org/licenses/by/4.0/).
Share and Cite
Nowak Da Costa, J.; Calka, B.; Bielecka, E. Urban Population Flood Impact Applied to a Warsaw Scenario. Resources 2021, 10, 62. https://doi.org/10.3390/resources10060062
Nowak Da Costa J, Calka B, Bielecka E. Urban Population Flood Impact Applied to a Warsaw Scenario. Resources. 2021; 10(6):62. https://doi.org/10.3390/resources10060062
Chicago/Turabian StyleNowak Da Costa, Joanna, Beata Calka, and Elzbieta Bielecka. 2021. "Urban Population Flood Impact Applied to a Warsaw Scenario" Resources 10, no. 6: 62. https://doi.org/10.3390/resources10060062
APA StyleNowak Da Costa, J., Calka, B., & Bielecka, E. (2021). Urban Population Flood Impact Applied to a Warsaw Scenario. Resources, 10(6), 62. https://doi.org/10.3390/resources10060062