Abstract
The study presents findings from comparative analyses of high-resolution differential digital elevation models (DEM of Difference—DoD) based on terrestrial laser scanning (TLS) surveys. The research was conducted on the 0.2 km2 Scottbreen valley glacier foreland located in the north-western part of Wedel-Jarlsberg Land (Svalbard) in August of 2013. The comparison between DTMs at 3-week intervals made it possible to identify erosion and depositional areas, as well as the volume of the melting glacier’s terminus. It showed a considerable recession rate of the Scottbreen (20 m year−1) while its forefield was being reshaped by the proglacial Scott River. A study area of 205,389 m2, 31% of which is occupied by the glacier (clear ice zone), was included in the repeated TLS survey, which was performed from five permanent scan station points (registered on the basis of five target points—TP). The resultant point clouds with a density ranging from 91 to 336 pt m−2 were converted into DEMs (at a spacing of 0.1 m). They were then put together to identify erosion and depositional areas using Geomorphic Change Detection Software (GCD). During the 3-week interval, the retreat of the glacier’s snout ranged from 3 to 9 m (mean of 5 m), which was accompanied by an average lowering of the surface by up to 0.86 m (±0.03 m) and a decrease of ice volume by 53,475 m3 (±1761 m3). The deglaciated area increased by 4549 m2 (~5%) as a result of the recession, which resulted in an extensive reshaping of the recently deglaciated area. The DEM of Difference (DoD) analyses showed the following: (i) lowering of the glacial surface by melting and ii) predominance of deposition in the glacier’s marginal zone. In fact, 17,570 m3 (±1172 m3) of sediments were deposited in the glacier forefield (41,451 m2). Also, the erosion of sediment layers having a volume of 11,974 m3 (±1313 m3) covered an area equal to 46,429 m2 (53%). This occurrence was primarily based on the washing away of banks and the deepening of proglacial stream beds, as well as the washing away of the lower parts of moraine hillocks and outwash fans.
1. Introduction
Over the past few decades, it has been observed that changes to the environment of High-Arctic regions result in a negative glacier mass balance, which leads to an increased recession [1,2,3,4,5,6,7,8]. Glacier surface changes that have been recorded since the end of the Little Ice Age (LIA), which affect the development of the glacier’s forelands in this part of the Arctic, have been mostly measured by glaciological methods [4,5,9,10,11]. However, geodetic methods and non-invasive remote sensing methods have been used more and more often in recent decades [12,13,14,15,16].
Seasonal measurements along the set of longitudinal or/and cross profiles have been employed to measure glacier surface elevation changes and its retreat rates. This simple and popular method makes use of ablation stakes, which are anchored to the glacier, and allows for monitoring the rising or lowering of the ice surface along the set transects. Additionally, the precise establishment of the stakes’ transect position by means of the real time kinematic Global Navigation Satellite Systems (rtk-GNSS) facilitates specifying the horizontal component of the glacier’s movement. It also makes it easier to monitor changes to the reach of the glacier terminus at the point where visible contact is made between ice and initial sediment-landform assemblages e.g., [4,17,18,19]. However, using this method to assess changes to Scottbreen’s volume only generates very approximate numerical values, a relatively small amount of data (number of point measurements), and results that are exclusively limited to selected measurement cross-sections [19]. Moreover, the said method fails to provide information about the possibility of surface changes in the entire glacier area. Typically, findings obtained by this method present only the horizontal component of changes in the terminus position, and that simply gives a very general idea about the movement of the glacier surface, the velocity of which is estimated to be approx. 1 m year−1. This is the case because of the method’s relatively low accuracy (0.05–0.1 m) as well as a considerable bias error that is connected with the measuring stake’s deviation in the measurement process [20].
Employing remote sensing tools leads to considerably greater possibilities. Tele-detection methods, which include satellite radar and photogrammetry measurement [12,21,22], are most often used in assessing recent transformations of the glacier land system. These methods provide the means to assess changes in the geometry (width, length, surface, and height) of the surface [23], as well as the volume [12]. However, such methods are mostly used for measuring ice caps and large valley glaciers [15] due to the low resolution of available data.
Furthermore, methods based on data obtained from low- and medium-altitude flights are equally popular. A photogrammetric analysis of stereo-pairs of an air photo was used to assess frontal position changes e.g., [5,23,24,25]. Also, ground-based photogrammetry was used to measure the ice cliff’s position [26,27,28]. Moreover, on the basis of terrestrial photogrammetry in the 1980s, a hypsometric map of the Scottbreen tongue and foreland was made and used as a background for thematic maps [29]. At present, particularly in research on small valley glaciers or their parts, small autonomous Unmanned Aerial Vehicle Systems (UAS/UAVS) equipped with digital cameras [30] are utilised more and more often, along with Structure from Motion (SfM)—a terrestrial photogrammetric range imaging technique—which is employed in estimating three-dimensional structures from two-dimensional image sequences at a small-scale [31,32,33].
Light detection and ranging LiDAR have become the more frequently used methods among the group of remote sensing techniques. Airborne laser scanning (ALS), which is based on the data obtained from medium-altitude flights, provides data of considerably higher resolution than satellite data (up to several pt m−2) [34,35,36,37]. ALS-based DEMs feature spacing that ranges from a few decimetres to a metre and it facilitates comparative analyses of medium- and small-size glaciers. Nonetheless, due to infrequent flights, this method fails to provide the possibility of assessing changes occurring at short temporal intervals, which might be caused by phenomena such as extreme weather. Intensive precipitation or a considerable increase in temperature (or both of these phenomena coinciding) may trigger a thaw of the snow cover in the central and upper part of the glacier, which could in turn cause an intensive surface runoff. Should such flows have large energies, both the glacier’s tongue and the whole marginal zone may be remodelled. In such cases, Terrestrial Laser Scanning (TLS) guarantees a good measurement efficacy [38,39]. This ground-based, active imaging method yields rapidly acquired, accurate, dense 3D point clouds of surfaces by high-precision laser rangefinder. Employing repeated stationary multi-station surveys facilitates both measurements of geometric parameters and an advanced interpretation of the development of landforms [40,41,42,43,44,45].
The aim of this paper is the estimation of short time changes within the scope of the terminus and the forefield of the Scottbreen using TLS-based high-resolution surveys. This technique provides data on the topographic surface with an average density reaching over 1000 pt m−2, while the DEM of difference analysis allows assessing of surface changes and sediment budgeting of the valley glacier as well as the inner marginal zone, which has been newly unveiled as a result of the glacier’s intensive recession e.g., [46,47,48,49].
2. Study Area
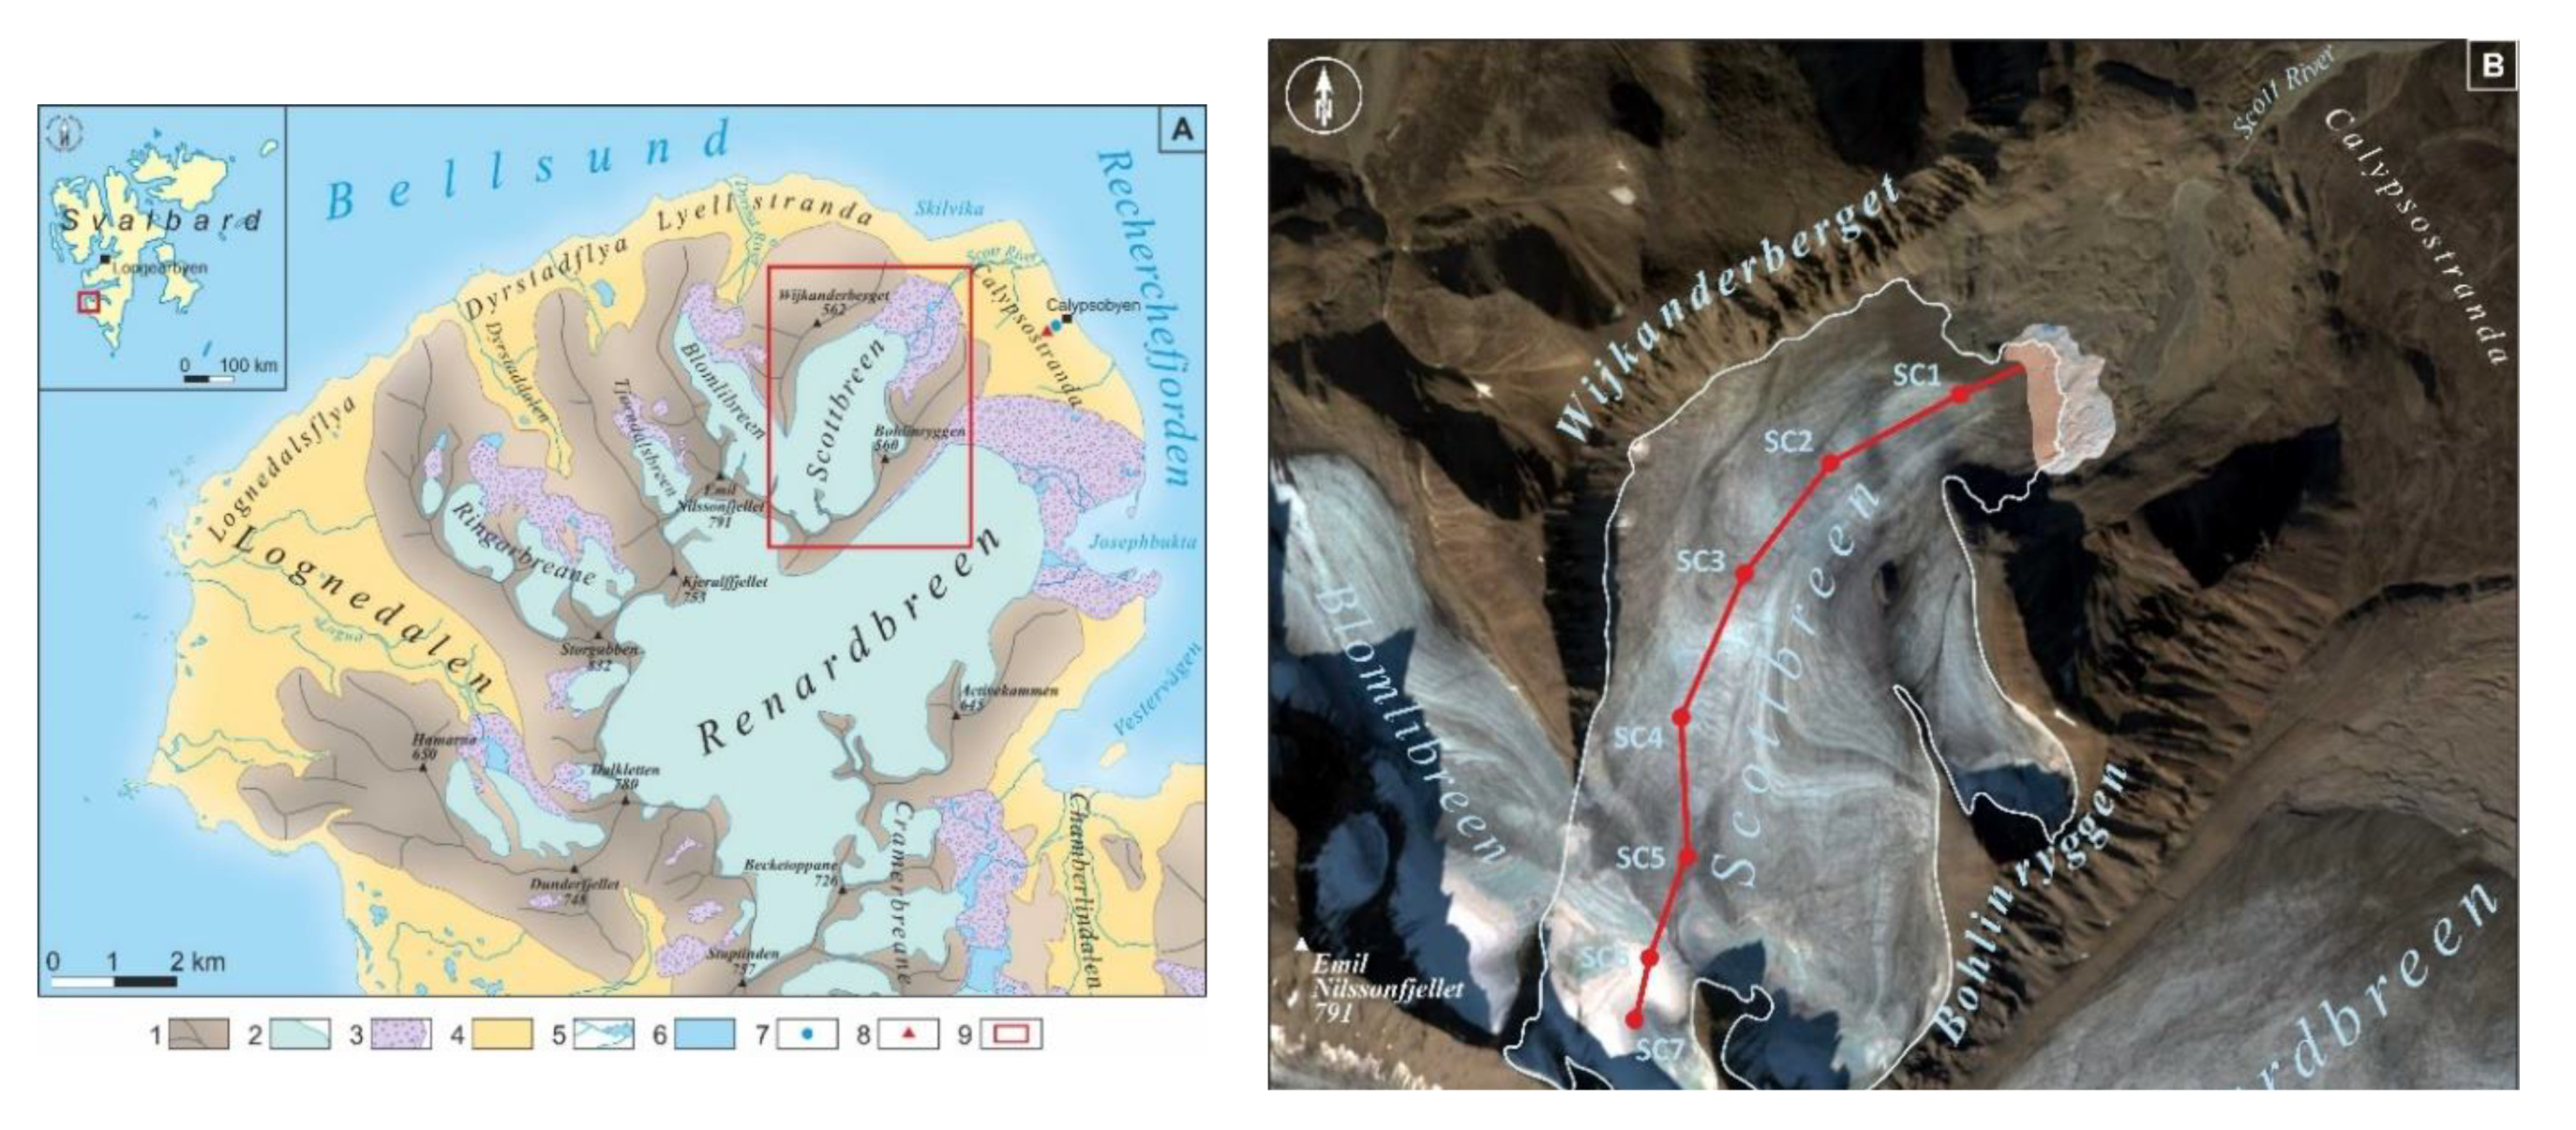
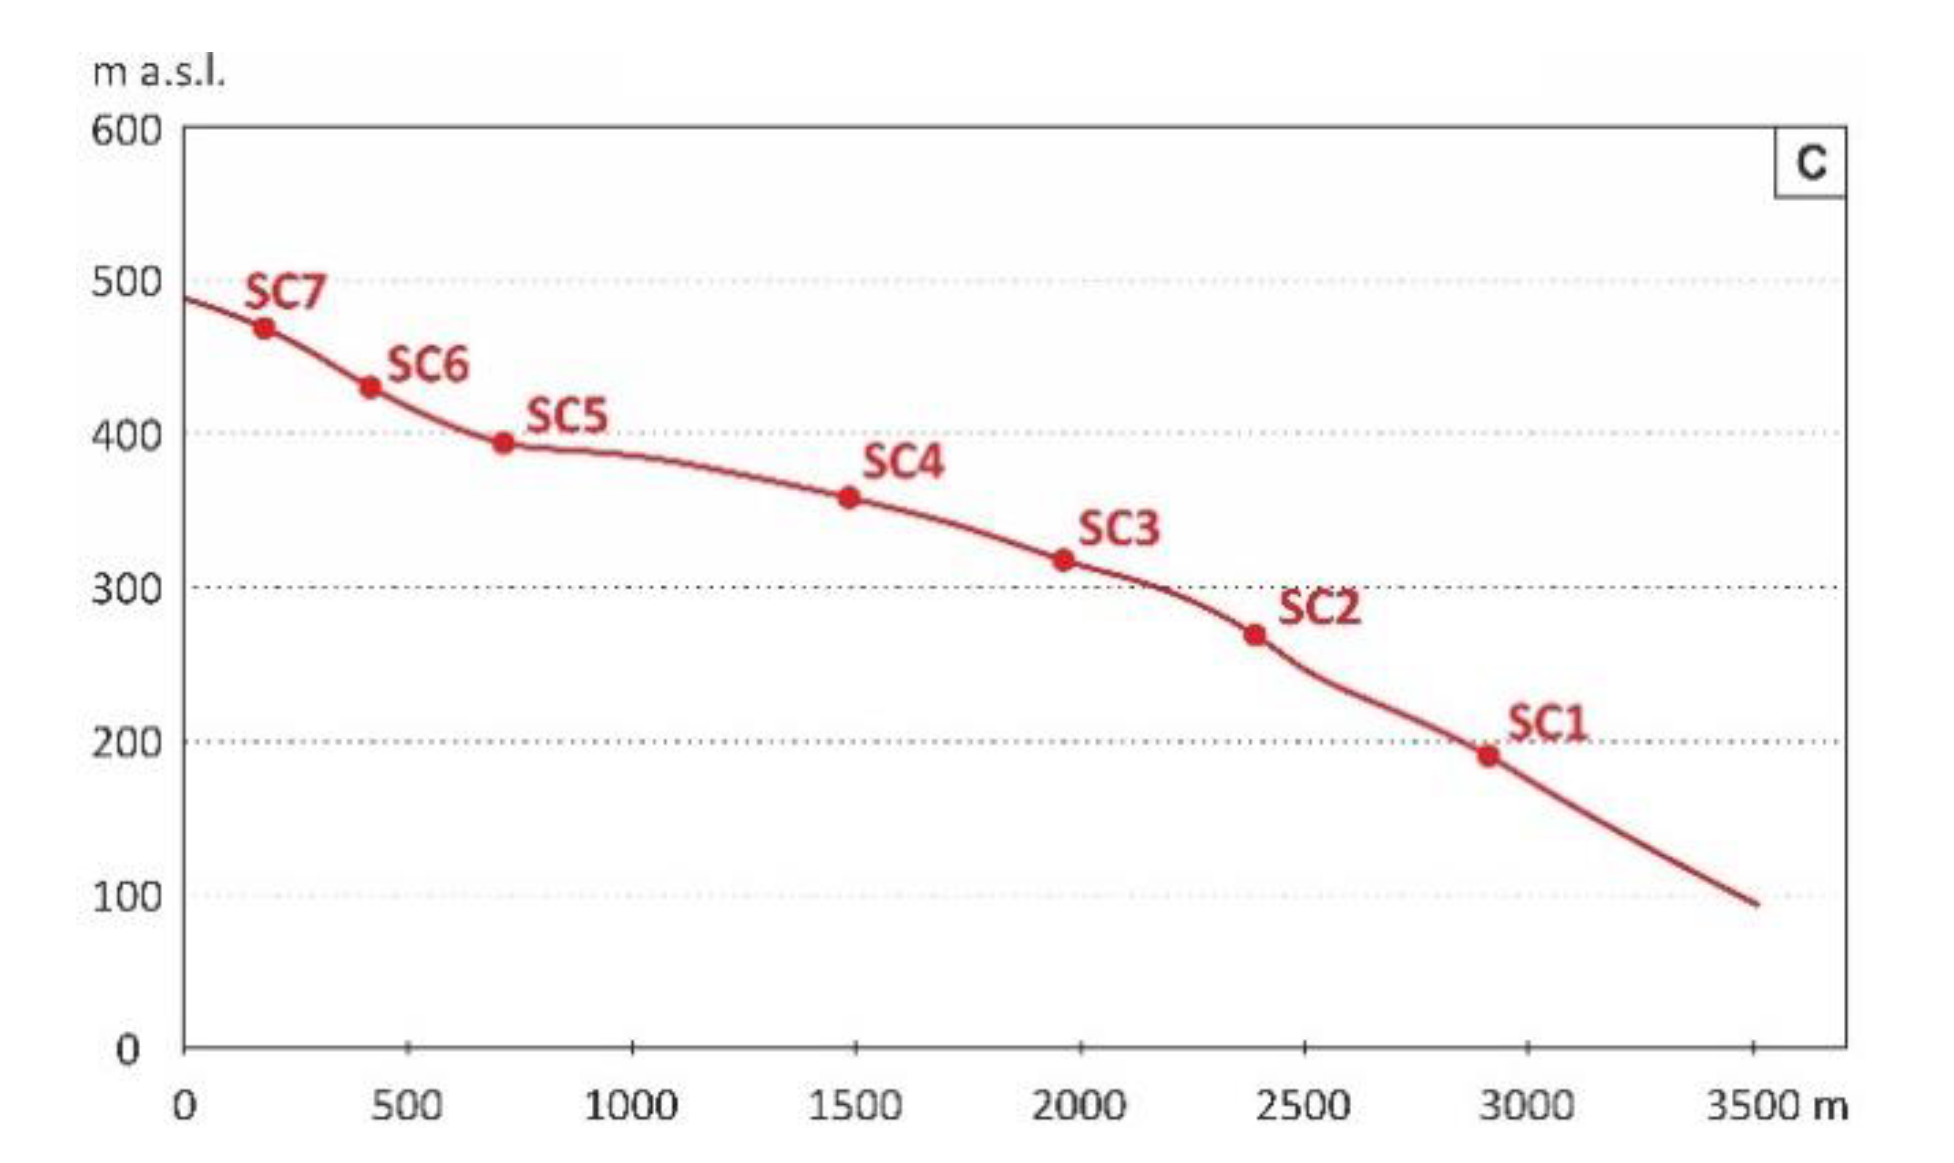
The research into changes to the glacier terminus zone was performed in the catchment area of the valley glacier located in the NW of Wedel-Jarlsberg Land in the Bellsund region of Spitsbergen (Figure 1A). The glacial catchment of the Scottbreen covers an area of 10.1 km2 (Figure 1B). The catchment is 40% covered by the valley glacier. At present, the Scottbreen is in the phase of intensive recession, it is 3.1 km in length, and its width ranges from 1.1 to 1.8 km (Figure 1C, Table 1). The Scottbreen shares its firn field with Blomlibreen (Figure 1B). In 2013, the glacier’s highest areas peaked at 502 m a.s.l., whereas its concave terminus fell between 85–89 m a.s.l. This is reflected in the longitudinal profile (Figure 1C). The equilibrium-line altitude (ELA) for the glaciers of Spitsbergen’s west coast was estimated by Hagen et al. [50] at approximately 400 m a.s.l. The equilibrium line, according to field observations made in the ablation season of 2013, was situated at a height of approximately 530 m a.s.l. In light of georadar profiling done in the spring of 2009, the Scottbreen was confirmed to be a typical polythermal, subpolar glacier of high geographic latitude [51] with its terminus frozen to the bed. The layer of cold ice at a thickness of approximately 75 metres stretches along the longitudinal profile of the radar scan (up to 470 m a.s.l.) (unpublished). The relief of the upper section of the valley shows two different parts, which are clearly recognizable and can be distinguished as: (1) the upper part covering the mountain valley glacier and (2) the recently-deglaciated inner marginal part (an area limited by the terminal moraine rampart) with a system of distribution channels within the outwash plain, which is separated from the east by the terminal moraine ridge [52,53] (Figure 1B). An englacial and subglacial drainage was concentrated in the main outflow located in the southern part of the glacier terminus. It is here that the Scott River begins with a glacial regime as follows: glacial feed (90%), snow melting (4%), precipitation (4%), and permafrost feed (2%), which drains the non-frozen part of the basin [54].
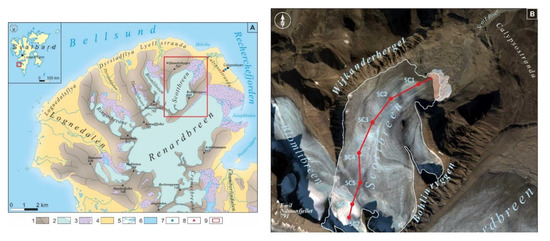
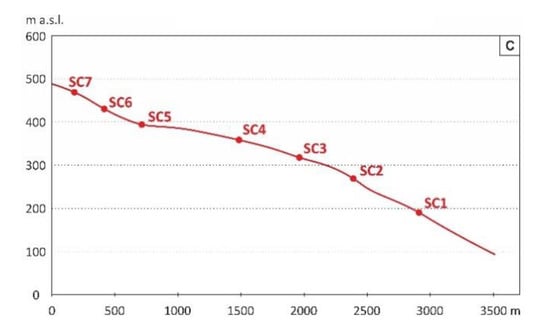
Figure 1.
(A) Location of the research area in Spitsbergen: (1) ridges and slopes; (2) glaciers; (3) glacier forefield; (4) marine terraces; (5) rivers and lakes; (6) sea; (7) Calypsobyen Meteorological Station; (8) rtkGNSS base station; (9) study area. (B) Aerial photo with study area of the Scottbreen forefield: (1) Scottbreen outline on 7 August 2013; (2) study area; (3) longitudinal profile line with a set of the ablation stakes. Source of the aerial photo: Google Earth Pro; the stage on 17 August 2013. (C) Scottbreen’s longitudinal profile with a set of the ablation stakes.

Table 1.
Main features of Scottbreen.
The study was performed in an area spanning 205,389 m2, within the actively transforming glacier terminus’s deglaciation zone (31% of the analysed area) and its forefield (69%) (Figure 1B).
Geomorphology
Glacier zone (clear ice zone). The analysed area covers the front of the glacier (100 m to 200 m in width) with an area of 62,558 m2 (1.6% of the whole glacier area). The constantly tilted glacier zone has an average slope of 10° (Figure 1C) and is deeply cut through by subglacial outflow channels (winding, meandering development patterns, 100 to 160 m in length). Depositional landforms are represented by numerous polygenetic ridges of glacial sediments, which originate from complicated glacitectonic processes within the area of the cold-based glacier terminus. The inventory of the forms within the terminus area includes concentrations of cryoconite holes, which remain on the ice surface as small cones after the snow cover has melted.
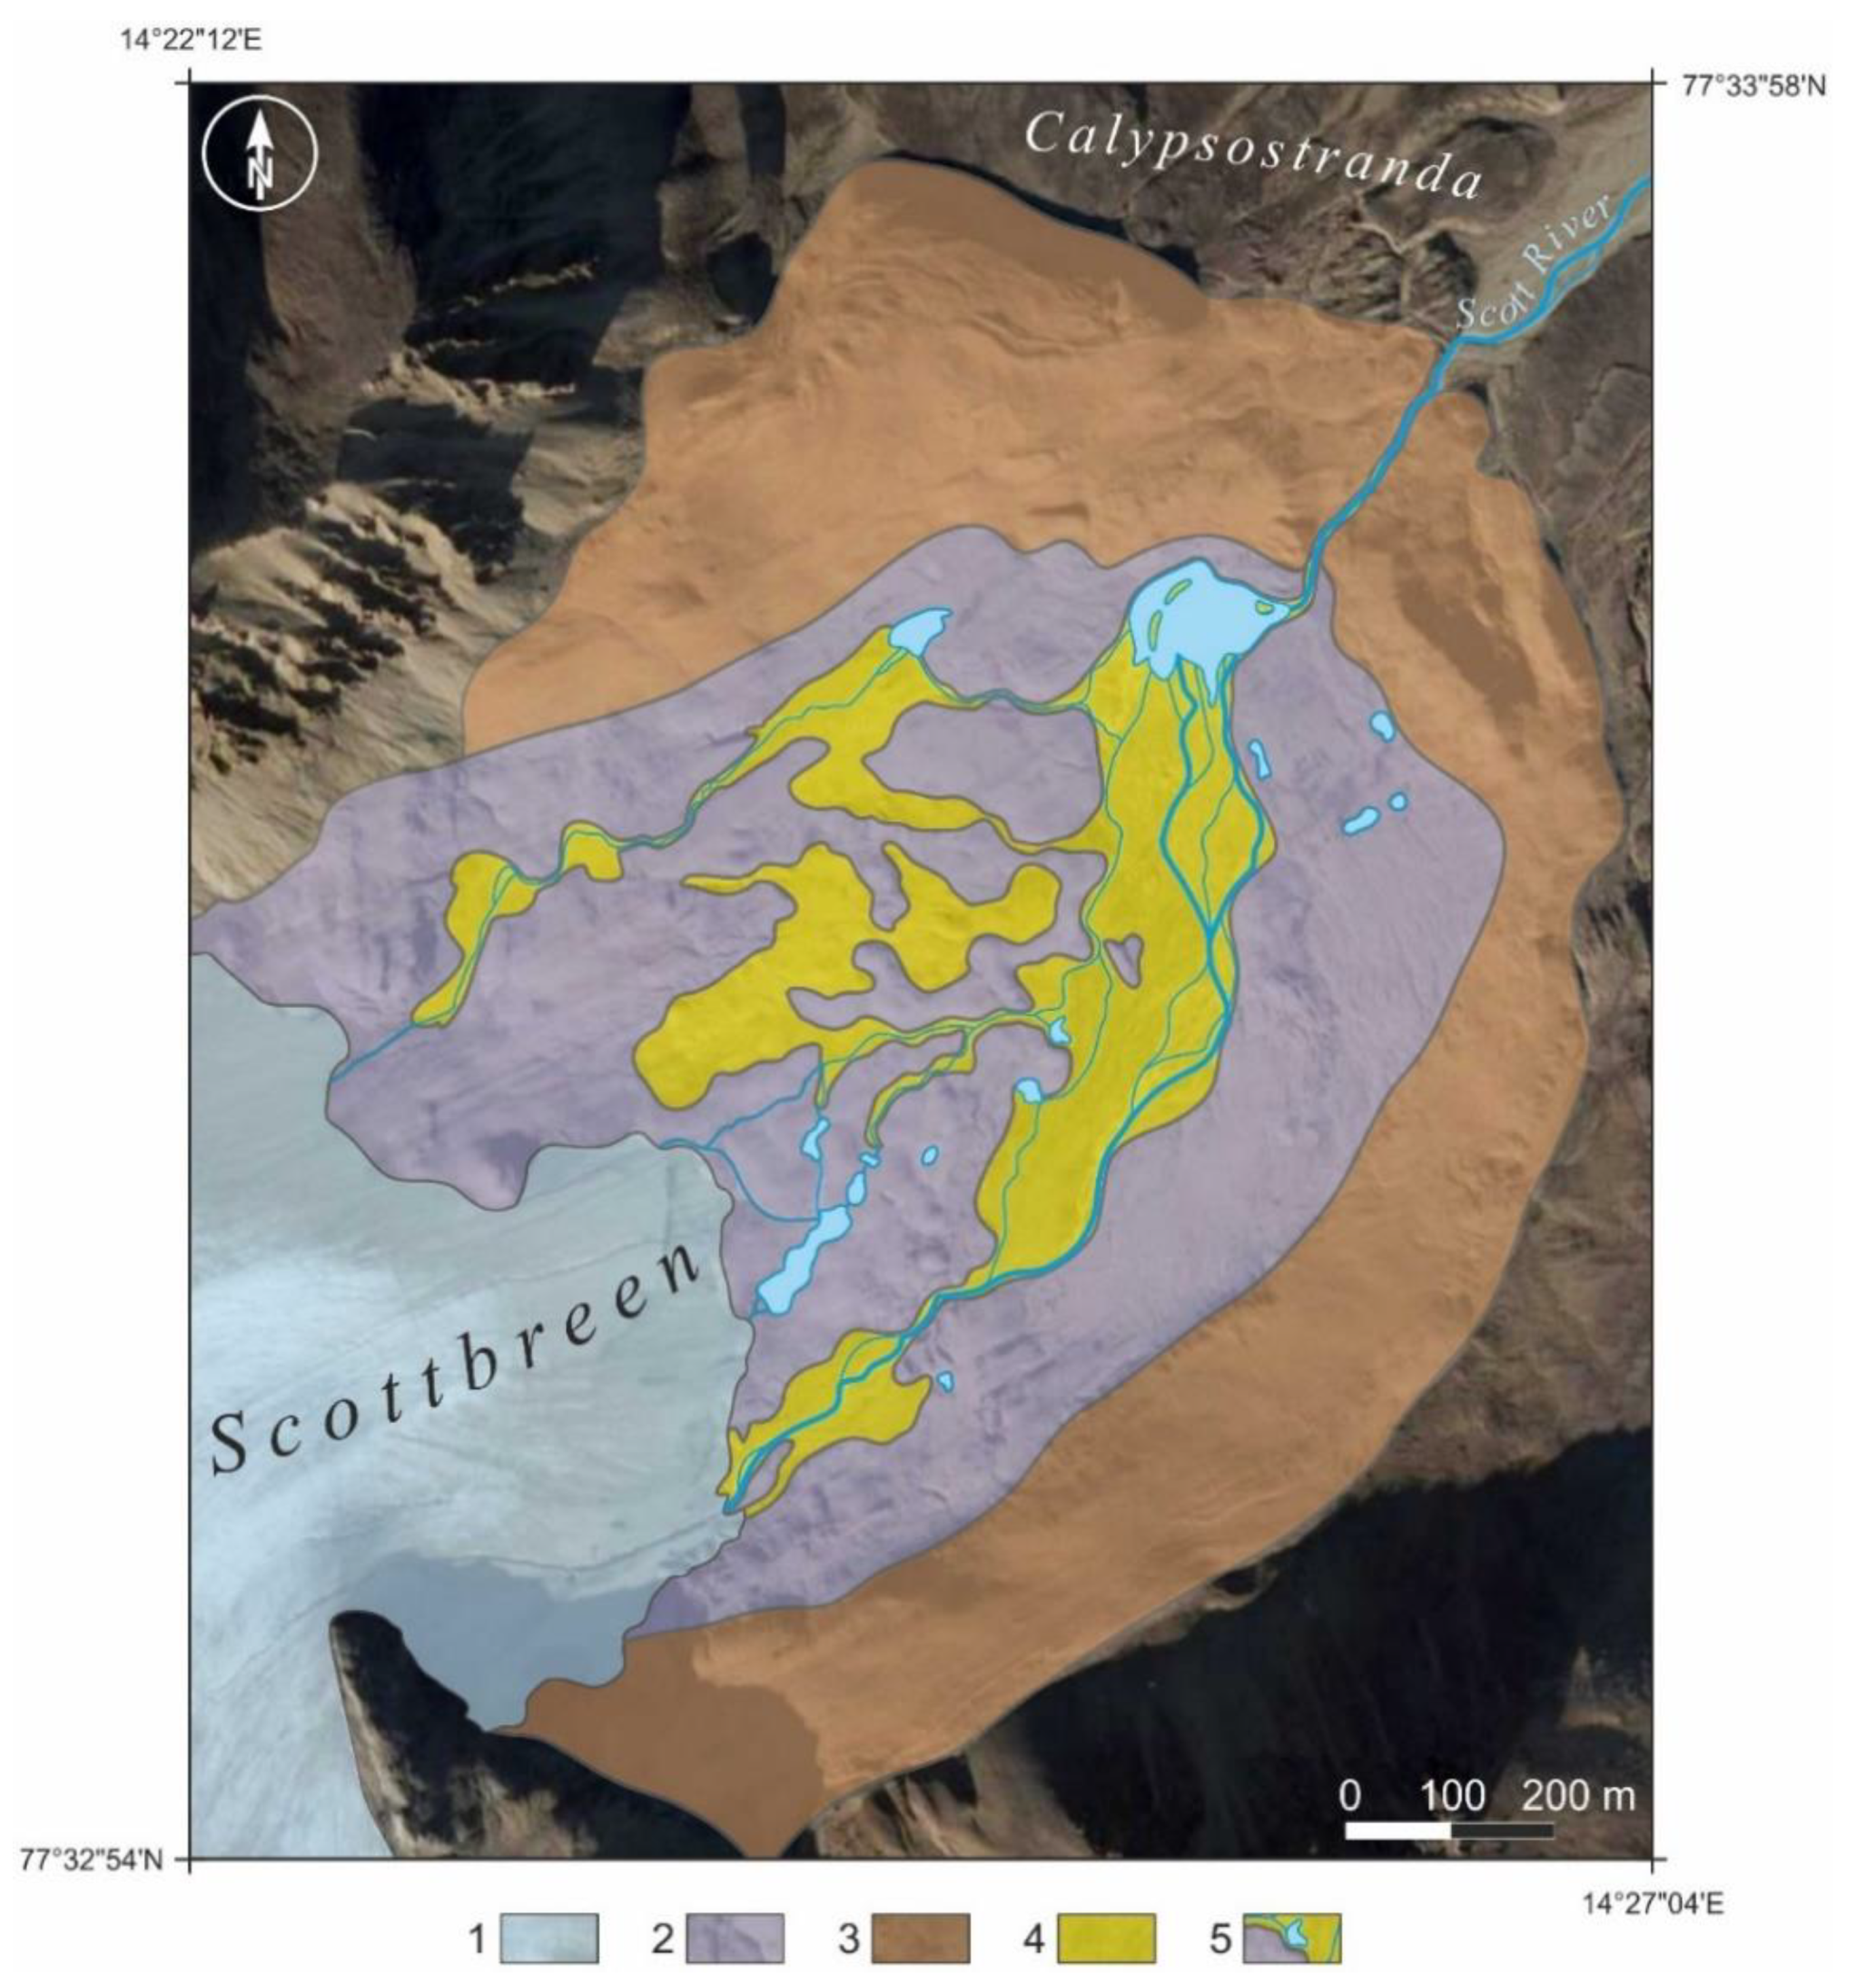
Glacier forefield. The marginal zone of the Scottbreen features a number of polygenetic landforms (terminal and lateral moraines, ground and fluted moraine, rôche moutonnée covered with a thin layer of the ground moraine), fluvioglacial (inner marginal outwash plain, eskers, kame terraces) and periglacial (as solifluction covers). This part of the glacier base is characterised by the greatest dynamics in morphogenetic processes due to the rate of the glacier’s recession [52]. Between 2012 and 2013, this resulted in the annual merging of the uncovered, 10 to 20 metres wide area [53], which was being intensively reshaped by fluvioglacial processes, with the non-glaciated part of the catchment (Figure 2).
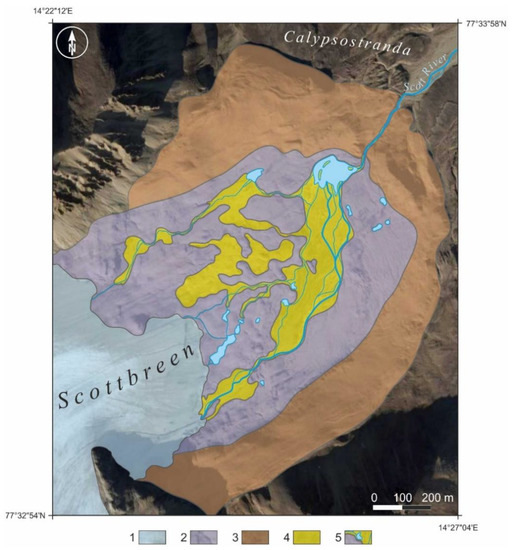
Figure 2.
A geomorphic sketch of the actively transforming glacier’s forefield zone: (1) clear ice zone (photo date: 17 August 2013); (2) ground moraine; (3) terminal- and lateral-moraine; (4) outwash plain; (5) rivers and lakes. Source of the aerial photo: Google Earth Pro.
A constant build-up of the inner marginal outwash plain, which has been observed since the 1930s to have a 20-m annual recession, has caused the present glacier terminus to be separated from the terminal moraine ridge by approximately 700 m (Figure 2). This area is characterised by modern geomorphic processes transforming glacigenic landforms left after the glacier had receded (a particularly well-developed ground moraine with the forms of subglacial transportation: e.g., fluted moraine, supraglacial debris stripes emerging from longitudinal foliation and the ablation moraine) as well as fluvioglacial (outwash plains, kame terraces, eskers, subglacial glaciofluvial channel filling, kettle holes etc. (Figure 2)).
The area is being intensively reshaped as a result of the action of proglacial waters that are distributed by a system of channels into the area of the inner marginal outwash plain [56]. The effect of the annual changes in the range of the main source of sediment is a multilayer occurrence of cones of various age levels. The youngest, which stretches at the gate outlet in the ice-moraine ridge, is shaped by the braided system, whereas older levels (located lower) are flat and diversified with paleochannels. Beds that cover the channel of the Scott River distribute large amounts of mineral material deposited in the form of oblong intra-bed screes [57,58].
3. Methods
3.1. Data Acquisition. TLS and rtkGPS Surveys
The analyses of short-term changes of physical/geometric parameters within the glacier terminus and its marginal zone, including the assessment of the changes to the ice budget and sediments, were performed using Terrestrial Laser Scanning (TLS) technology. Comparative field research was done by means of the Leica ScanStation C10 mid-range laser scanner at 3-week intervals between July and August of 2013 (i.e., in the period of the Scottbreen’s greatest ablation activity). This device facilitates stationary laser measurement of 3D positioning with a maximum speed of 50,000 points per second [pt s−1] and within a maximum range of 300 m [59]; it also uses a green impulse laser (with the wave length of 532 mm), which can penetrate small depths of water [60]. Furthermore, measurement data obtained in the form of a single ‘point cloud’ makes up a ‘model space’ that is characterised by 3D position accuracy of up to 6 mm at distances up to 100 m [59]. In the course of the research, the measurement was made using pre-set spacings of ‘middle resolution’ (0.1/0.1m at 100 m), which mapped the measured area with approximately 5 million points [M pt] (from each of the measurement sites). The average density of the points for the ‘model space’ reached 360 points per square metre [pt m−2]. Both measurement campaigns employed the known coordinates (KC) method described by Kociuba [53,58], where each measurement is taken from a known coordinate point and the scanner’s rangefinder is oriented towards one of the target points (belonging to a network of fixed coordinates). The analysed area was scanned from five measurement stands positioned on stable roche moutonnée culminations so as to obtain full information concerning the topographic area. The network of measurement points was marked permanently by means of seven ablation stakes (Figure 1C) whose position was established with rtkGPS measurements (TopCon Hiper II was used in the Base/Rover system). Lastly, the points were used alternately as measurement stands and reference points for connecting individual ‘model spaces’ into the integrated Digital Surface Model (DSM).
3.2. DEM Parameters and Data Analysis
Using the KC method allowed passing over both the time-consuming process of transforming the system from the local to the geographic, and also the ‘manual’ registration process for individual ‘model spaces’ [61]. Predefining the scanner’s position before commencing the measurements makes it possible for the obtained ‘point clouds’ to be georeferenced and thus automatically merged into a single 3D model during the import process of the Leica Cyclone 8.1 software (Leica Geosystems AG, Heerbrugg, Switzerland). The accuracy of the model integration was determined by the precision of rtkGPS measurements. The position was established on the basis of a signal from at least nine satellites of the Global Positioning System (GPS) and the Global Navigation Satellite System (GPS+GLONASS; both a Global Positioning System (GPS) and its Russian equivalent named Globalnaya Navigacionaya Sputnikovaya Sistema (GLONASS)) by averaging out five measurement epochs (the number of samples used for averaging out the coordinates). Also, the range of the measurement ambiguity of the predefined receiver was set so as to make sure that vertical and horizontal deviation did not exceed 0.02 m [62]. DMSs that contained from 19,308,739 M pt to 71,535,423 M pt were obtained, which corresponds to a density of 336 to 90 pt m−2.
The first measurement was made on 28 July, and the next one on 18 August 2013 following a 3-day heavy rainfall, which was caused by an inflow of south-west air masses. Both DSMs were further transformed into high-resolution digital elevation models (DEMs) that made up the basis for further quantitative analyses of: (i) transformations of the topographic surface and (ii) balancing the erosion-deposition budget. The TLS points (DSMs) were imported and processed to the DEM by means of the LP360 4.4 software (GeoCue Group Inc., Huntsville, AL, USA) with a mean spacing of 0.1 m. Research into the physical parameters (differences of height and volume) and the analysis of the differences of the topographic surface were made by means of the Geomorphic Change Detection (GCD 7.4.4) plug-in version for ArcGIS 10.8 software (ESRI, Redlands, CA, USA). In order to calibrate the DoD calculation, an approach based on the spatially variable assessment of the error was applied. The DEM quality was strictly related to the quality of the survey data [63]. Since the maximum TLS survey error for each measurement (0.006 m on 50 m) was lower than the rtkGPS reference points network location error (0.02 m) (both scanner and target points), the highest value was taken as the minimum level of detection (minLoD) for both DEMs, and it was used as a uniform error to calculate the surface error of each DEM. Thus, any predicted elevation changes below 0.02 m were not included in the results of the DoD analysis. Finally, the ‘propagated error’ function was used to detect changes between DEMs [63,64]. Comparative studies involving the application of the DEM of Difference (DoD) method [63] were applied in calculating erosion and deposition (volume and area) e.g., [65,66,67].
3.3. Meteorological Measurements
Meteorological observations were made between 10 July and 18 August in the 2013 melt season. Main meteorological parameters (temperature, humidity, pressure, wind) were recorded with a 10-min sampling frequency using the Campbell measurement station located 2 m above ground level. The Calypso Meteorological Station was located on a raised sea terrace within the Calyspostranda plain (in the close neighbourhood of the abandoned Calypsobyen settlement) (Figure 1A).
3.4. Direct Glaciological Measurements
Measurements of surface ablation were made every 5 days between 13 July and 17 September of 2013. Said measurements were taken at seven points on the glacier surface (Figure 1B,C). The ablation stake’s position by rtk-GNSS along with the pole’s height above the glacier surface were both sampled.
4. Results
4.1. Meteorological Conditions
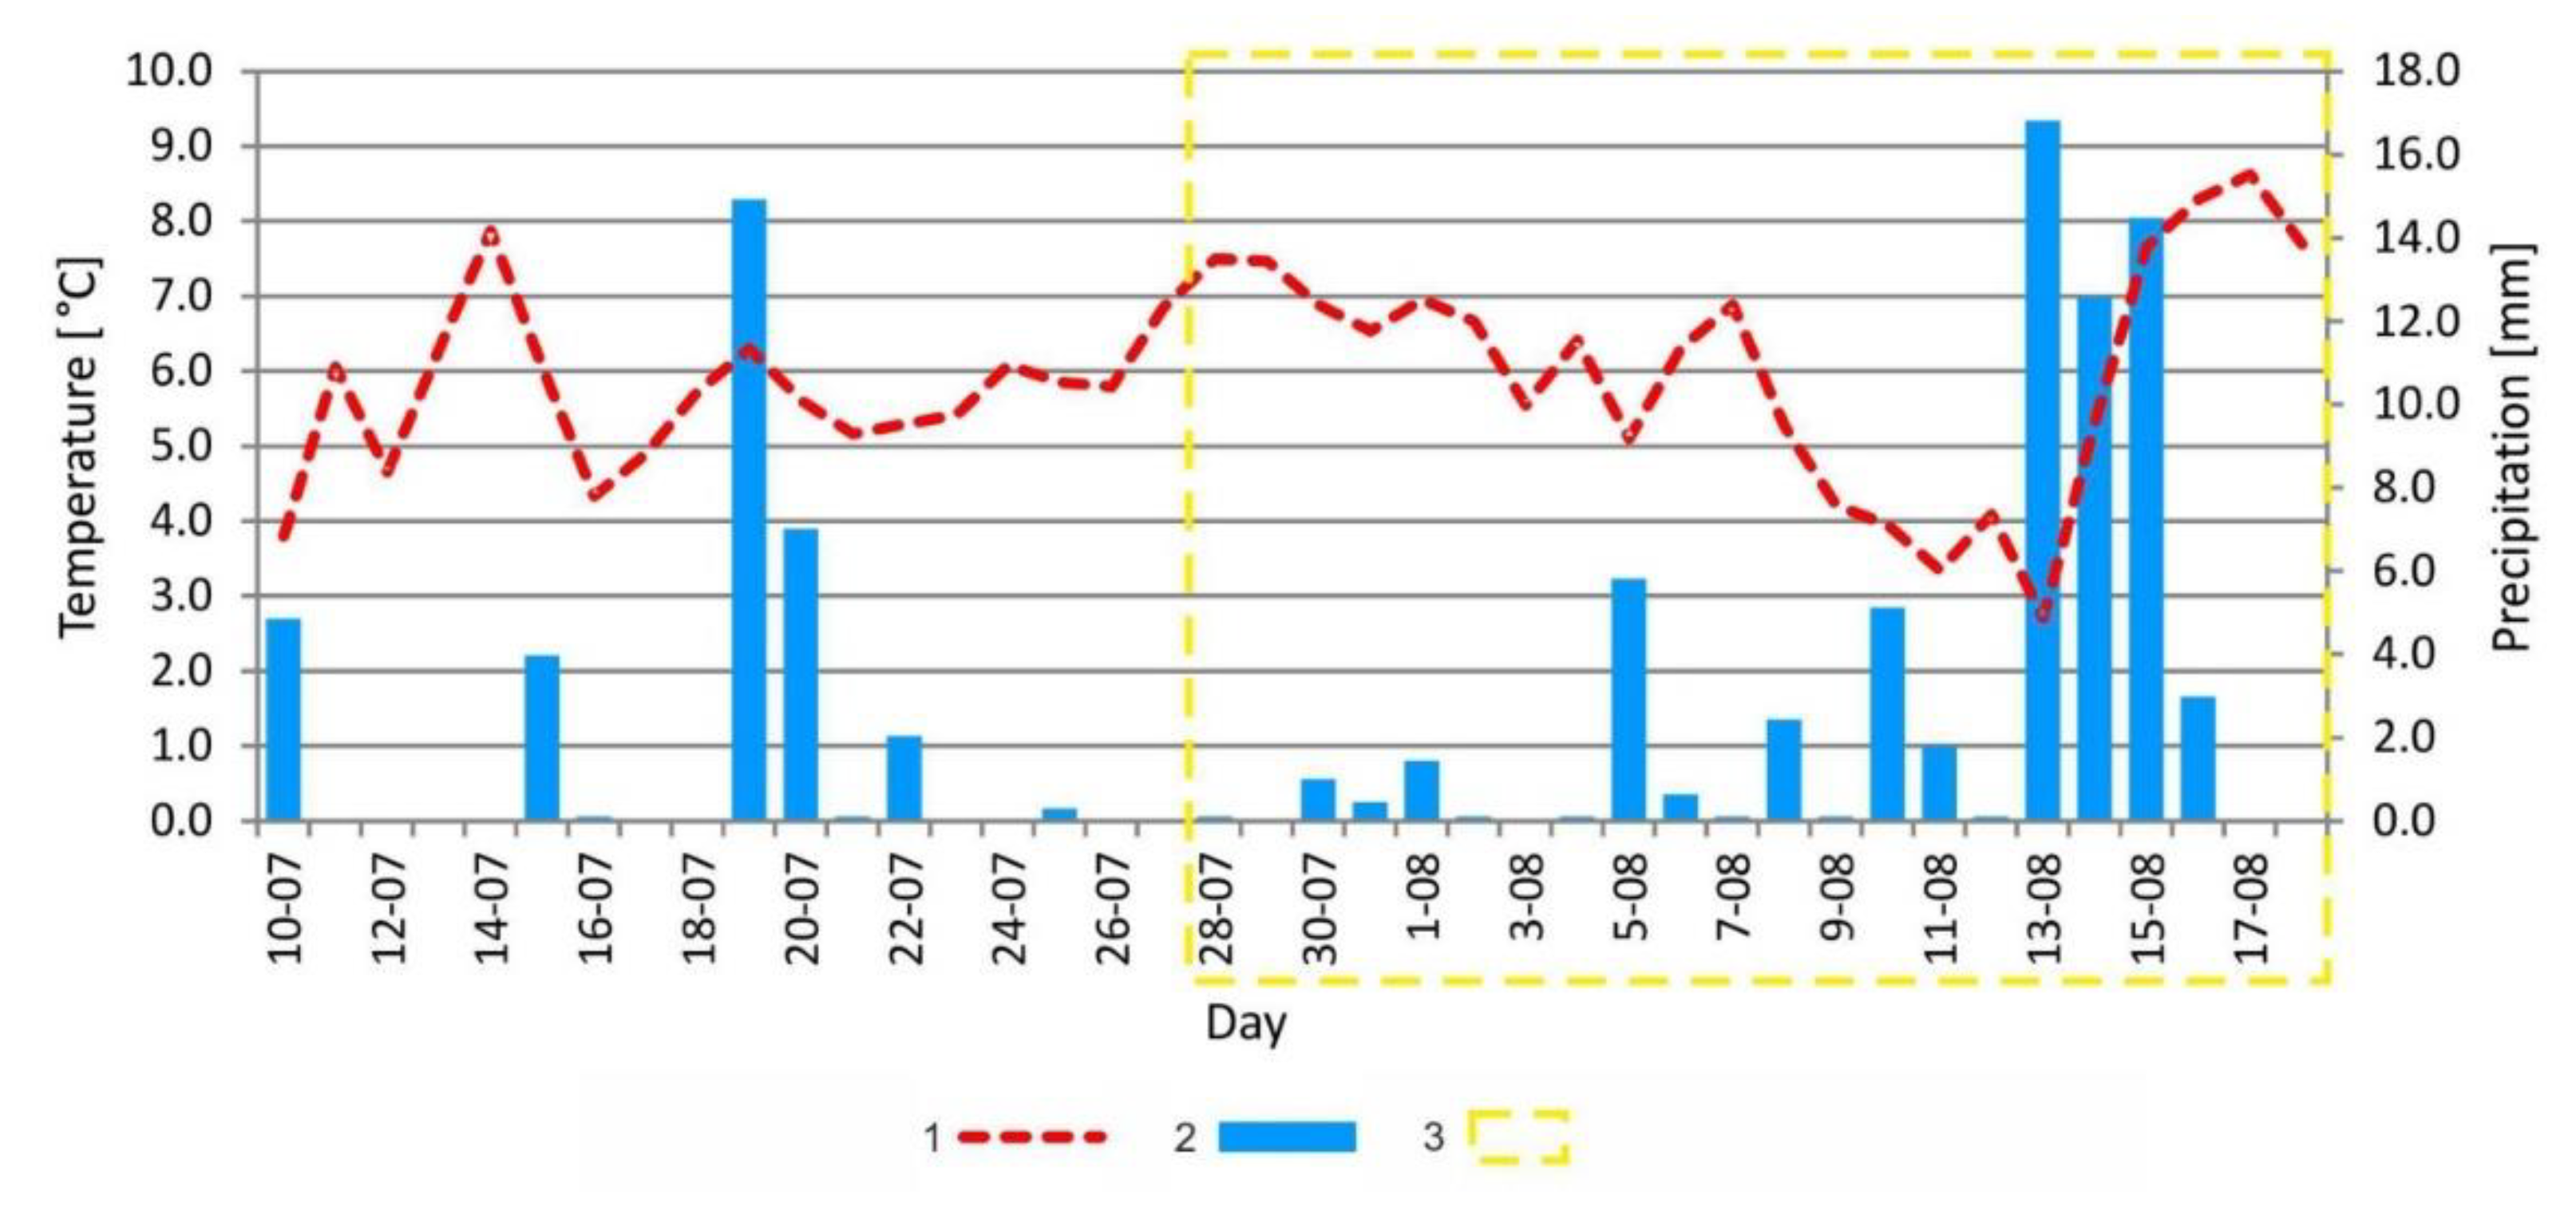
Temporal variations of the meteorological conditions are illustrated in Figure 3. Minimum and maximum temperature values were recorded over a period spanning the glacier’s morphological changes (from 28 July to 18 August 2013) and were respectively noted as 2.7 °C (on 13 August) and 8.6 °C (on 17 August). In the same time span, a considerable increase in temperature was accompanied by above-average precipitation. The highest daily precipitation of 16.8 mm was recorded on 14 August. Total rainfall on four consecutive days between 13 and 16 August amounted to 46.9 mm, i.e., 43% of the total precipitation in the analysed summer season and 66% in the period covering measurements of the glacier’s morphological changes (28 July–18 August).
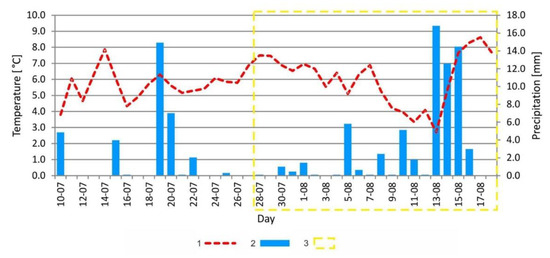
Figure 3.
Comparison of changes in mean daily air temperature and mean daily precipitation during 2013 melt season: (1) average temperature, (2) daily precipitation sum, (3) analysed period.
4.2. Geomorphic Change Detection Analysis by TLS-Based DEMs
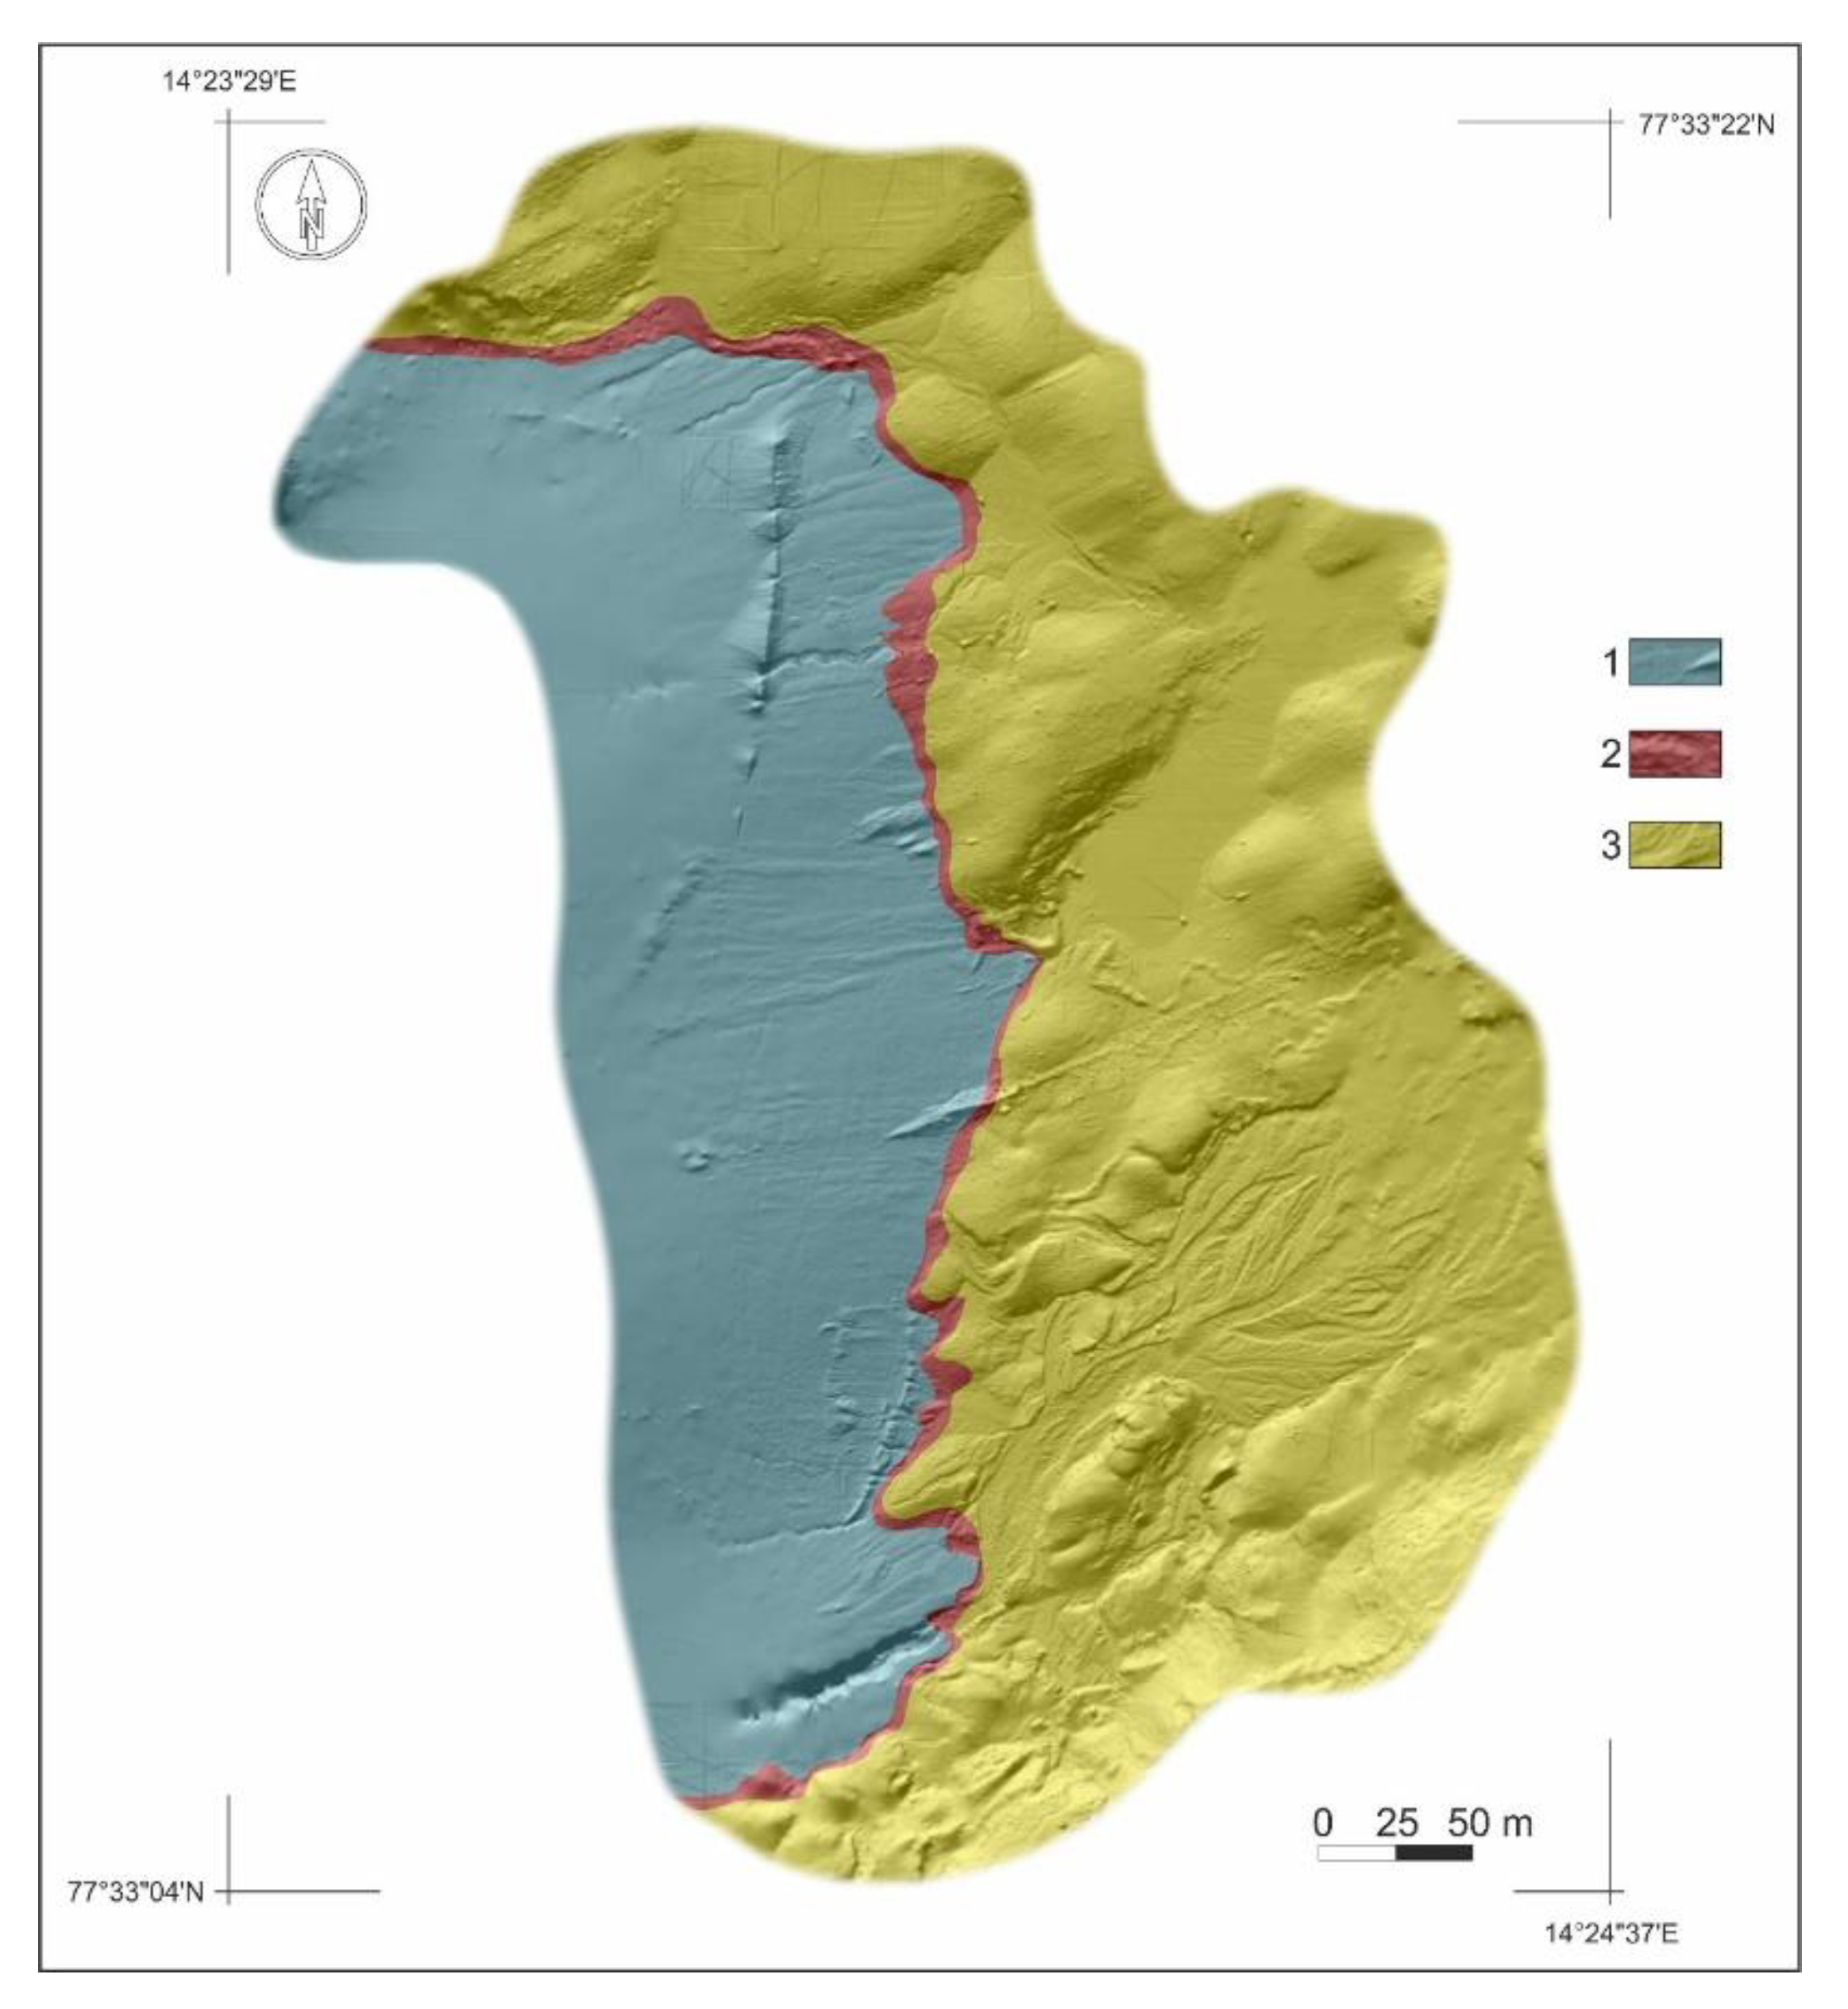
Differential analyses of DEMs show significant changes to the topographic surface both of the glacier and its forefield, which suggests there to be extensive dynamics of geomorphic processes during the measurement period. The analysed area may be considered to be comprised of three cascade-positioned zones, which differ in the type of dominating geomorphic processes, and which refer to the morphological and genetic division of the basin: (1) glacier’s front zone, which undergoes intensive surface ablation; (2) recently deglaciated area, a dynamic, unstable narrow zone with intensive morphological transformations that was created in the analysed period as a result of glacier retreat; and (3) inner marginal zone, a stable zone with an equilibrium of erosional and depositional processes (Appendix A; Figure 4).
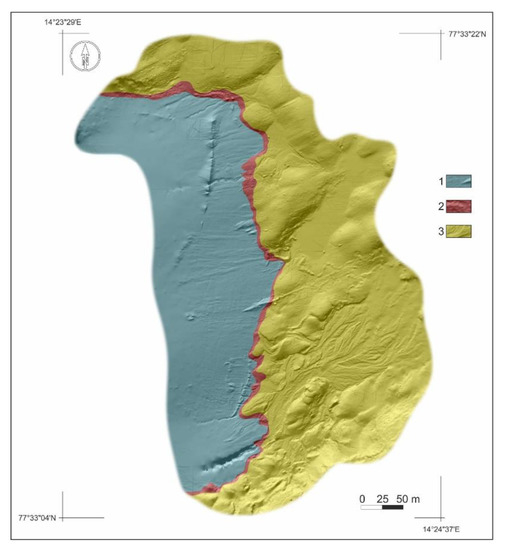
Figure 4.
High-resolution hillshades model of study area from 28 July 2013. (1) clear ice zone, (2) recently-deglaciated zone, (3) glacier forefield—inner marginal area.
4.3. Morphological Changes
4.3.1. Glacier Zone (Clear Ice Zone)
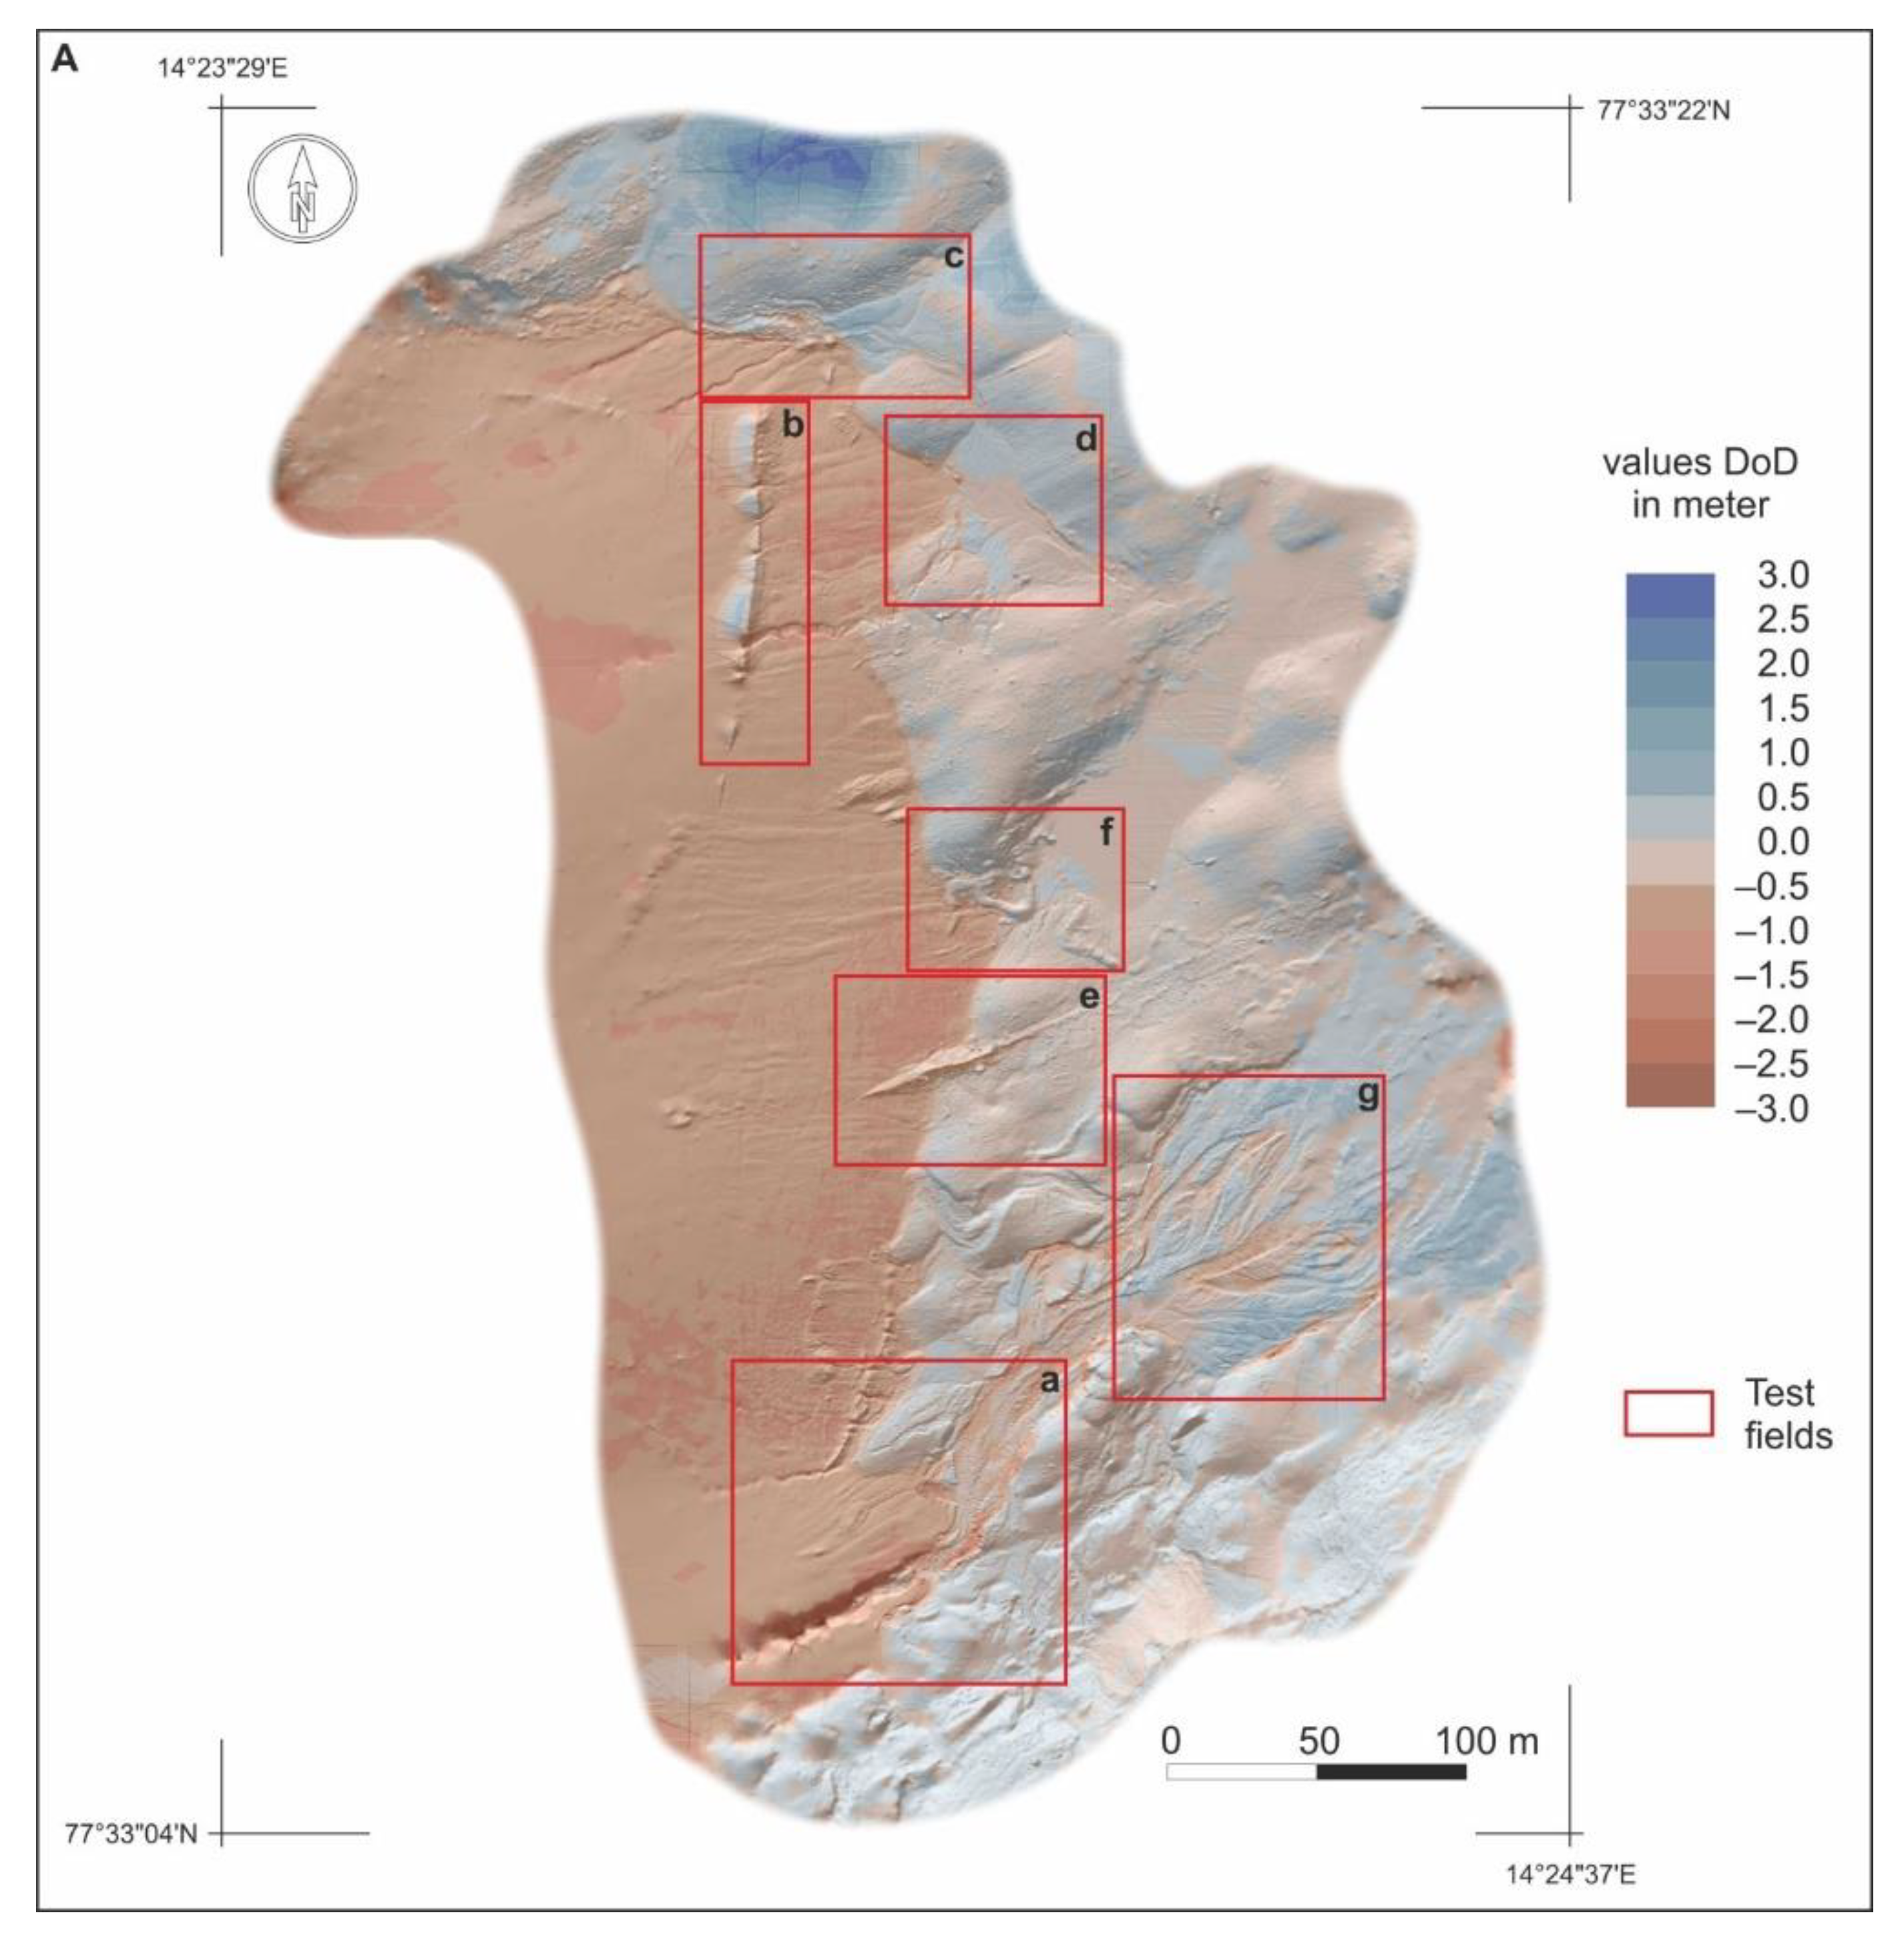
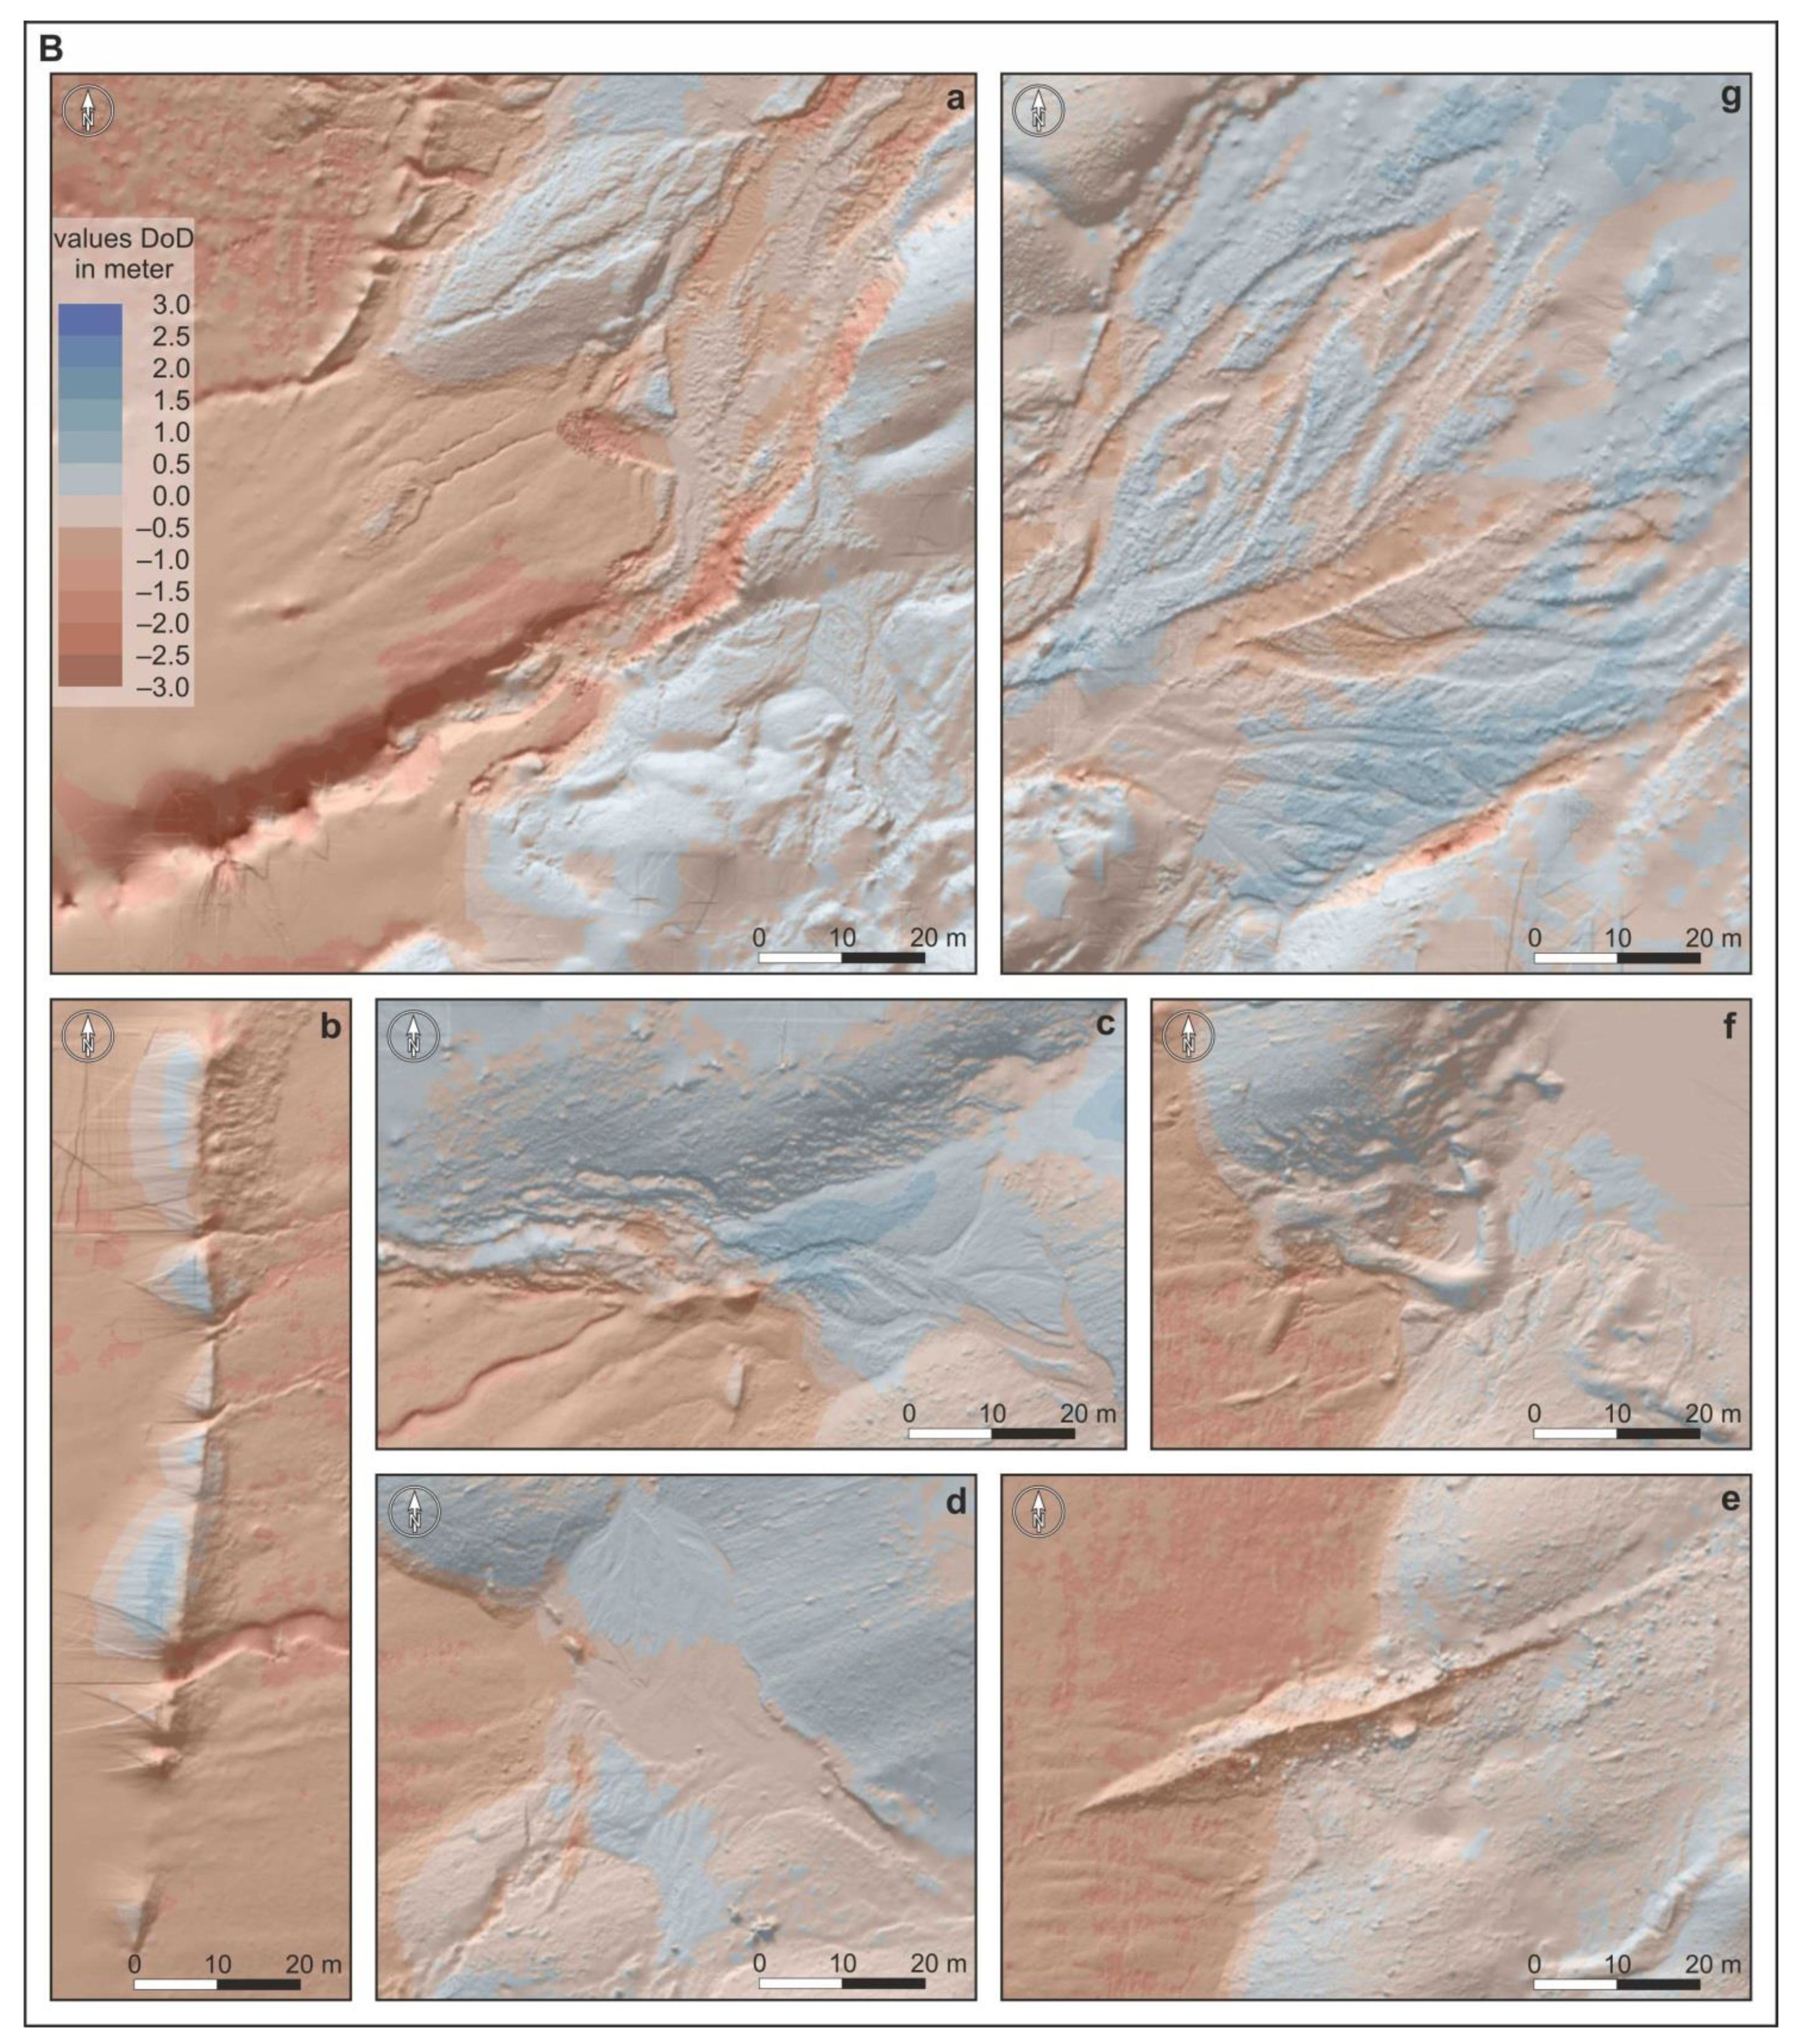
Nearly all of the Scottbreen tongue’s area underwent a dynamic lowering in the analysed period. Over the area ~63,000 m2 of the glacier ice, the decrease of its surface dominated (99%). The volume of melted ice was 53,475 m3 (±1761 m3) in the 3-week timespan (Appendix A. The surroundings of the main meltwater channel situated in the southern section of the glacier tongue, which drains into the Scott River, were affected by the greatest changes in thickness (Table A2; Figure 5(Ba)). What is more, these changes were connected to an intensification of vertical erosion within the superglacial channel in the time of the precipitation-ablation flood. The maximum channel depth reached 4.0 m. The DoD of Scottbreen’s glacial zone also shows an intensive surface ablation with a lowering in the related area of the surface. However, the observed lowering of the glacier’s tongue does not show any major differentiations within the study area. Ultimately, the depth of the lowering in Scottbreen’s tongue surface was on average 0.86 m (±0.03 m) and its average net thickness difference was 0.84 m (±0.02 m) (Table A2).
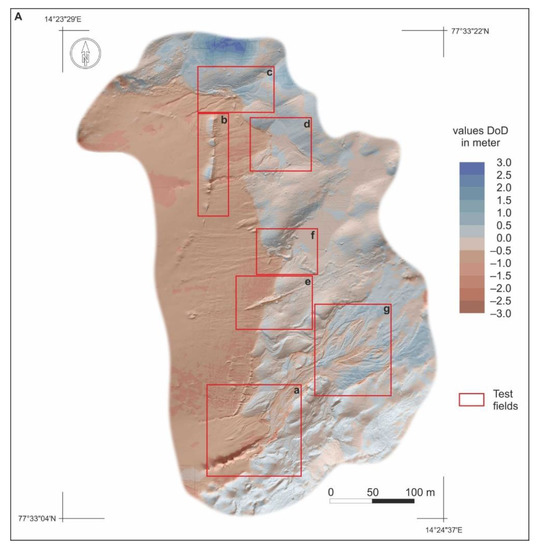
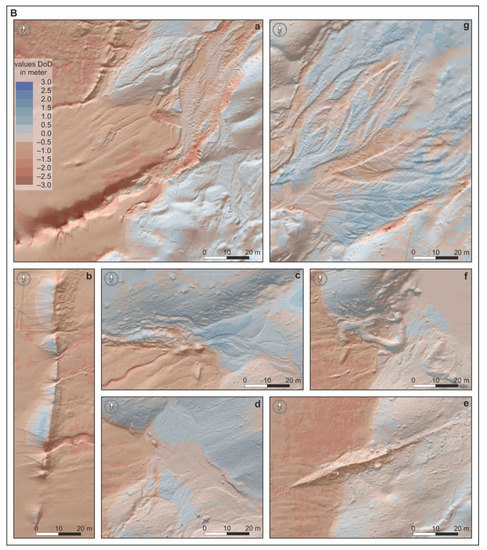
Figure 5.
(A) DEM of Difference (DoD) for test area. Hillshades from the more recent survey in the DoD are shown behind the DoD for context. Landforms in the actively reshaped glacier terminus zone; described landforms marked by rectangles (from a to g). (B) Glacigenic and fluvioglacial landforms (from a to g).
Only 1% of area (731 m2) containing a positive vertical component (surface rise) was registered within the designated ablation zone (Table A2). The greatest accretion in the area was observed in the northern part of the tongue, within the debris outcrop, which stretched crosswise for approximately 120 m in relation to the movement of the glacier (Figure 5(Bb)). The greatest increase there was registered at ~1 m. Additionally, a small feature was noted in the central part of the ablation area, approximately 130 m to the west of the Scottbreen’s tongue, which rose to 0.5 m in the analysed period. It may be supposed that the feature is probably an initial outcrop of the surface moraine, whose continuation could be observed in the zone at the tongue’s edge. This represents an interesting effect of the transport of supraglacial morainic material along the area’s longitudinal foliation.
4.3.2. Recently-Deglaciated Area (Zone)
In the relief of the narrow, newly uncovered area, a number of new landforms created by the glacier were mapped. Around 94% of the surface in this zone lowered by 0.58 m (±0.03 m) (as a result of melting ice, retreat of the terminus or thawing of buried ice), while the total volume of melted ice was 2494 m3 (±122 m3) (Table A3). The width of the zone varies with the intensity of morphogenetic processes within the glacier’s tongue (Figure 4). Due to the registered changes, the zone’s width may be assessed to be approximately 10–12 m in the northern part of the research area, around 5–7 (max 12.0 m) in its middle part, and roughly 8–10 m in the southern part. The rate of the glacier’s retreat, which was recorded in the TLS measurements, seems to confirm earlier information about the average annual recession rate of Scottbreen’s terminus. Based on juxtaposing of the available photogrammetric material and field studies, the recession rate was noted to be 23 m per year in the 1990–2012 period. Correspondingly, Zagórski and Bartoszewski [19], Reder and Zagórski [57] and Reder [68] obtained similar research results for Scottbreen’s recession rate.
The detection of changes in such a narrow zone is very difficult due to the area’s intensive morphodynamics taking place over a very short time span, and the instability of the landforms in the deglaciation area caused by successively melting buried ice. In the northern part of the area, the deglaciation resulted in overbuilding the eastern zone of the one recently deglaciated, and also the simultaneous lowering of the area that directly converged with the terminus. The development of a small alluvial cone (at approximate maxima: height—1.0 m, width—20.0 m, length—10.0 m) as well as a visible increase in material fraction (clearly seen in the DSM) were the effect of an increase in both the energy and the flow of the glacier’s small marginal outflow (Figure 5(Bc)). To the south of this area, intensive ablation and retreating of the glacier terminus led to an almost complete blurring of about 1.0 m of the high ridge on the surface moraine (Figure 5(Bd)). This area is characterised by the development of small fluvial channels (approximately 2.0 m in width), the washing away of the bed’s surface, and, in its central zone, the simultaneous overbuilding of the alluvial fans found in the adjacent marginal zone. The next test area (Figure 5(Be)) suggests a domination of glacigenic processes, which developed the inner marginal zone. The degradation of buried ice resulted in the lowering of the surface. Forms that were consolidated by the morainic material show a variety of surface changes—a small rising or lowering (the ridge of the surface moraine along the longitudinal foliation). Subglacial accumulation esker forms (built of loose sediments, mostly sand and gravels) of several metres in length were uncovered in the middle area as a result of the glacier’s front retreat (Figure 5(Bf)). These forms ranged from 4 to 5 m in width and their height did not exceed 0.5 m. The esker ridge was cut by small supraglacial currents where it came in direct contact with the glacier’s terminus. Within this area, erosion processes driven by fluvioglacial processes dominate, despite noting distinct accumulation forms there. However, the greatest changes were registered in the southern part of the research area (Figure 5(Ba)). There the proglacial river bed developed laterally in a northern direction as a result of the fluvioglacial processes intensifying. Moreover, there was degradation of the surface moraine ridge, which was found to be transversing the direction of the glacier’s movement. As a result, debris cones of several meters in width developed. Further, an area that exhibited features of dead ice was recorded in the southern part of the test area—it underwent a morphogenesis that differed from that of the active glacier’s terminus. A recession rate similar to the one in the specified test areas was not registered within the dead ice, however, intensive lowering of the surface (1.5–2.0 m) was observed, which was accompanied by modelling of the sheet’s edge by ablation waters.
4.3.3. Glacier Forefield—Inner Marginal Zone
In the analysed period, the recorded marginal zone was reshaped both by erosion and by deposition processes. The detected surface changes indicate a slight dominance of areas with surface lowering at 46,429 m2 (62%) in relation to areas of surface rising at 41,451 m2. This trend is reversed for volume, with deposition at 17,570 m3 (±1172 m3) and erosion of 11,974 m3 (±1313 m3). The above-mentioned were accompanied by average elevation changes ranging from +0.42 m (±0.03 m) to −0.21 m (±0.02 m), respectively (Table A4). The erosion mostly covered the concentration zone of the glacier waters’ main draining system in the research area’s southern part, which contains a system of beds distributing proglacial outflow to the NE. The northward shift of the main outflow zone was accompanied by the development of small alluvial fans, a mid-channel, and lateral bars in the abandoned channels as well as in the central and southern part of the valley floor. (Figure 5(Ba,Bg)). Moreover, intensified side erosion was created as a result of the Scott River’s multi-current proglacial braided patterns towards the north. These processes resulted in an intensive undercutting of the southern edges of the ground moraine’s middle sheet. The deposition of sediment with its thickness of 0.3 m caused the overbuilding of the glacigenic landform complex—an ice-moraine ridge and a lateral moraine separated by fluvioglacial landforms i.e., a sandur cone with two outwash hollows. The eastern part of the main zone, which drained the glacier, and the NW part of the cone, which contained the outwash hollows, were both overbuilt. Small changes took place within the culmination of moraine hillocks in the N and SE parts of the cone (Figure 5(Ba,Bg)). Nearly the whole area, which was predominated by forms both of the bed and the lateral moraine, was reshaped by mass processes characteristic of the periglacial environment.
5. Discussion
The inner marginal outwash fan, which is separated by terminal moraine ridges, makes up an interesting research object for studies on contemporary morphogenesis as well as activities of glacial and fluvioglacial processes. However, research work in this zone typically concerns the recession/advance rates of the glacier terminus e.g., [11,52,57], but it seldom refers to the quantitative assessment of the effects of glacial retreat e.g., [35,47,48,69,70]. Research findings to date have suggested that the present direction of geomorphic changes in the glacial forefield zone of the High Arctic results from the following factors: (i) global (climate-driving factors), (ii) regional (geographic latitude, location with respect to land areas and seas, exposure to predominant winds), and foremost, (iii) local (structural conditions, lithology of sediments, genesis, the glacier’s type and thickness, exposition and tilting of the firn zone, and the glacier’s trough). These factors are decisive in the development and the functioning of temporal or periodical sediment deposition zones, which occur in front of the quickly retreating glacier terminus. The growth rate of glacier-uncovered surfaces significantly affects the contemporary dynamics of the geomorphic processes in the entire inner marginal zone [44].
This study shows short-term erosion and deposition distributions for each analysed area. In the clean ice zone, surface lowering is dominant (99%) due to rapid ice melting. In the 3-week period, the average lowering of the glacier terminus surface was recorded to be 0.84 m (0.04 m per day). By contrast, this is much higher than the average (2.2 m per year; 0.13 m per 3-week period; and 0.006 m per day, respectively), which was noted over a 3-year span between 2010 and 2013 [44]. By comparison, a slightly lower rate (0.39 m per 3-week period and 0.02 m per day, respectively) was determined for the retreat of the Sólheimajökull glacier over a period of 14 years [16]. Furthermore, surface lowering also dominates (95%) in the narrow zone of the recently-deglaciated area, which results in an average decrease of 0.54 m (3-week rate) and 0.026 m (daily rate), respectively. It is worthy to note that a slight predomination of surface rising (53%) was only recorded in the glacier’s forefield zone. This slight advantage of deposition equates to an average increase of 0.064 m over the 3-week period (0.004 m per day). In the above-mentioned 3-year span, some much lower average rates had been determined for Scottbreen’s near forefield (0.025 m—annual; 0.001 m—3-week; and 0.0001 m—daily, respectively), whereas these rates were comparatively two-times higher for its intramarginal outwash fan (0.059 m; 0.003 m and 0.0002 m, respectively) [44]. However, this zone was observed to have different trends in its various cold regions. Similar average values but of surface lowering (−0.05 m—annual; 0.003 m—3-week; and 0.0001 m—daily, respectively) were determined for the Midtre Lovénbreenand (NW Svalbard) forefield over a 2-year period, and these were based on comparisons between LiDAR-derived DEMs/DoD. In reference to those values, average surface lowering was even higher (0.7 m per year; 0.04 m per 3-week period; and 0.002 m per day, respectively) for the moraine downwasting [37]. Quantitative analyses (Table A1, Table A2, Table A3 and Table A4) show a dominance of surface lowering in the clear ice zone (ice-melting) and in the recently deglaciated zone (erosion). In the inner marginal zone, where there is a considerable balance of surface elevation changes, erosion is roughly equal to deposition. It is also where periodic sediment deposition is generally separated from the lower parts of the valleys by the terminal and lateral moraine rampart. The river valley that cuts this rampart crosswise performs a transit role in this system, however, it traps the coarsest fractions of the sediments [71]. Dislodged pebbles and boulders feed the sediment load of the river but are transported over small distances only, which causes aggradation to predominate on the bottoms of proglacial rivers [44]. This study shows that an intensive deglaciation was accompanied by considerable changes in the morphology of the uncovered ice areas [72], which resulted in erosion (most often) as well as deposition (less frequently), within the landforms that had already existed and the newly created landforms—often very ephemeral. The area’s overbuilding, which was recorded in the ablation zone (in the northern part of the terminus) at the outlet of the debris, refers to zones of thrust faults. The fault zones create a discontinuity along which some debris is transported to the glacier surface. However, an increase within the area of the analysed scree crest is not connected to increased sediment transport from the glacier’s bedrock, but is rather caused by the fact that ice, which is devoid of its rock cover, undergoes an intensive ablation. Such a mechanism of sediment transmission and formation of crosswise ridges in the surface moraine, which has been widely described in literature e.g., [73,74], is characteristic of polythermal glaciers with a base of frozen terminus. The analysed landform is ephemeral and its functioning time depends on the permanence of an ice core covered with supraglacial debris. An analogous form at a later developmental stage was recorded in the southern part of the terminus. Only a small-area, maximally 0.5 m high elevation took place within the area of the ridge whose length is approximately 80 m. This is connected to the fact that the form situated closer to the edge of the terminus underwent intensive washing away processes.
Meteorological observations recorded throughout the summer melting period together with ablation measurements at the Scottbreen show an asynchronism between precipitation as well as ablation volumes within the glacier’s area and the ’morphological effect‘ in the newly uncovered areas. A precipitation episode, which had been noted at the beginning of the observation period (approximately 35% of the volume of recorded precipitation), resulted in a small area lowering (0.2 m) in a part of the Scottbreen’s terminus. Between 7–18 August 2013, the glacier surface at stake SC1 (Figure 1B) decreased by 29 cm and at stake SC2 by 33 cm. That same year in the period from 13 July to 18 August, before the rainfall episode, SC1 showed that the surface decreased at a fairly constant pace, which averaged a max of 20.3 cm. In the same period of time, SC2 (Figure 1B) showed that the mean value of the glacier surface descent was 18.8 cm. The causes of such a state might be found in an increased capacity to retain precipitation waters in the Scottbreen’s accumulation zone and water percolation in empty areas of the snow, firn, and ice [75,76,77,78]. Percolation is a slow process that efficiently stopped the surface flow of ablation-precipitation waters down the glacier’s surface. The rainfall episode (from 13 to 16 August) contributed to an increased surface ablation of the glacier, in particular in its terminus part (registered area lowering at SC1—0.75 m (Figure 1B,C), and by comparison of the average area lowering at DoD—1.1–1.5 m). In fact, such an extensive area lowering was caused not only by record precipitation together with a considerable increase in the average air temperature, but it is also influenced by the release of water retained in snow and firn that were stored in higher glacial zones. This was accompanied by a simultaneous intensive flow down the glacier’s surface area within the ablation zone.
The methodology of comparative studies showed considerable development of glacial and proglacial landforms located in the glacier’s recently deglaciated and inner marginal areas, which resulted from above-average weather conditions. The effects of the 3-day rainfall with its volume being close to the multi-annual sum (registered in the melt period) suggest that events of an above-average character within a very brief timescale may diametrically alter the short-term transformation trend. The glacier’s ablation rate, the range of area lowering, or the changes in the volume of forefield landforms, which occur as a result of these episodic events, may equal or even exceed annual mean values that have been registered. Research to date [19,57,68] has documented the glacier’s terminus retreat to be at a rate of 3 to 22 m annually (Figure 2). Moreover, Kociuba [56] estimated the annual (2010–2013) mean ice loss in this zone at 2.2 m year−1, which corresponds to the water equivalent of 2.0 m3 from each square meter. The intensive ice-melting leads to concentrated runoff of sub- as well as supraglacial waters and results in a considerable reshaping of ephemeral landforms within the newly uncovered parts of the valley. Corresponding research that was performed using the glaciological method on the intensive ablation zone of the glacier’s terminus confirmed the value of the mean lowering of the glacier’s surface, which was registered as per the DoD results. In the analysed period, the mean lowering registered at SC1 (Figure 1B,C), in a location approximately 70 m over the glacier’s longitudinal profile, equalled 0.75 m. All these values were additionally confirmed by the juxtaposition of numerical terrain models, which had been obtained from the available photogrammetric depictions and terrain studies (by GPS of the glacier’s surface) over the 1990–2012 period. In that same period, the glacier’s surface in its terminus part lowered by approximately 58 m and averaged out at an annual value of 2.3 m. These values are fully compatible with the results obtained at the time of field studies in 2012. Then, during the 5 weeks of the ablation period, the glacier’s area lowered by 1.2 m in its terminus zone.
6. Conclusions
- The foreland of the Scottbreen—a typical valley glacier that has undergone dynamic transformations connected with its terminus, which in turn have retreated at a rate of 22 m year−1—makes up an interesting research study into the contemporary development of newly deglaciated areas. Comparative measurements in the 3-week period at the turn of July and August of 2013 introduce a new quality into spatial analyses of glacial areas. They have made it possible to perform quantitative and qualitative evaluations on the range and direction of landform development. The spatial analysis on the dynamics of geomorphic processes that shape said zone has given rise to tracing short-term landform transformations under conditions of progressive degradation of the glacial catchment’s cryosphere in the sensitive High-Arctic environment.
- Three zones were distinguished with respect to the differences in the dynamics of geomorphological processes: (i) the glacier front zone, which is characterised by a glacier surface lowering rate of 2 m year−1; (ii) the recently deglaciated zone with dynamic geomorphic processes, which worsens during extreme and above-average meteorological events (e.g., heavy rainfall, rapid increase in air temperature); and (iii) the inner marginal zone, which is relatively stable and characterised by an erosion/deposition balance.
- The range of transportation of supraglacial debris is limited. The majority of newly provided debris that comes from the glacier’s ablation is deposited in a narrow, recently deglaciated zone (up to 12 m). Here, a predominance of aggradation was registered in the analysed 3-week period. Moreover, redeposition of sediments into the inner marginal zone is restricted by a range of hills in the terminus and lateral moraines located at the foot of the zone, which includes numerous intramoraine fluvial basins (or, less frequently, basins that are not drained by any outflow) catching the supraglacial debris. However, during the period of above-average floods, the scree deposited in the basins may be channelled to the basins’ lower parts where it overbuilds the landform of the inner marginal outwash plain.
- It has been shown that in a very short timescale, rapid meteorological phenomena can result in relief changes that are diametrically different from the rates and directions of annual and perennial changes. The occurrence of events characterised as above-average, i.e., high precipitation and an increase in temperature during the 3-week comparative period (July–August 2013), cause the glacier’s area to lower by up to 3.5 m—this is nearly two times more than the annual mean (2 m year−1) in the 2010–2013 period.
- The conducted analysis on the dynamics of spatial changes in the proglacial zone may contribute to a better understanding of the way modern processes shape the forefield of the glacier’s terminus. Detailed comparative analyses confirmed the high precision and efficiency of high-resolution TLS-based DEM as a tool for inventorying and tracking high-dynamic development of glacial and proglacial landforms. This tool is particularly useful in analysing ephemeral landforms (from several days to several weeks long). This study’s adopted methodology for performing both measurements and comparative analyses on high-resolution models of investigated areas is far more universal and effective than methods that have been traditionally used in glaciology. Consequently, the amount of data provided during a single measurement cycle and the comparability of the findings should be the basis for implementing the TLS-based DEM analysis as a standard tool in a new comprehensive approach to conducting glaciological and geomorphological research into glacier forefields.
Author Contributions
Conceptualization: W.K.; methodology, W.K., G.G. and Ł.F.; field study, high-resolution survey W.K., G.G. and Ł.F.; writing—original draft preparation, W.K., G.G. and Ł.F.; visualization, W.K., G.G. and Ł.F., writing—review and editing, W.K. and G.G.; visualization, Ł.F. All authors have read and agreed to the published version of the manuscript.
Funding
This research received no external funding.
Institutional Review Board Statement
Not applicable.
Informed Consent Statement
Not applicable.
Data Availability Statement
Data is contained within the article.
Acknowledgments
The study was carried out in the Scott River catchment in the summer season of 2013 with the participation of the University of Maria Curie-Skłodowska’s Polar Expeditions Team. The study was supported by: the scientific project of the National Science Centre 2011/01/B/ST10/06996 ‘Mechanisms of fluvial transport and sediment supply to channels of Arctic rivers with various hydrological regimes (SW Spitsbergen)’, and the statutory research of FESSM MCSU ‘Application of the TLS in the geomorphological research’. The authors would like to thank the reviewers for their valuable comments which helped to make the improvements that were essential to the successful completion of this work. The authors are also grateful for the English language proofreading by Luke Boczkowski.
Conflicts of Interest
The authors declare no conflict of interest.
Appendix A
Changes in spatial parameters of the studied area calculated volumetrically with reference to the total volume of ice/material net change recorded by the DoD (both melting/erosion and deposition) from 28 July to 18 August 2013. [Table A1] The entire analysed area; [Table A2] the terminus of the Scottbreen in the range of 28 July 2013; [Table A3] the area uncovered to 18 August 2013 (recent-deglaciated area); [Table A4] the glacier forefield—inner marginal zone.

Table A1.
The entire analysed area.
Table A1.
The entire analysed area.
| Attribute | Raw | Thresholded DoD Estimate: | ||
|---|---|---|---|---|
| Areal Metrics | ||||
| Total Area of Surface Lowering (m2) | 143,326 | 108,948 | ||
| Total Area of Surface Raising (m2) | 62,063 | 42,225 | ||
| Total Area (m2) | 205,389 | 151,173 | 74% | |
| Total Volumetric Metrics | ± Error Volume | % Error | ||
| Total Volume of Surface Lowering (m3) | 66,049 | 65,647 | ±3082 | 5% |
| Total Volume of Surface Raising (m3) | 17,945 | 17,741 | ±1194 | 7% |
| Total Volume of Difference (m3) | 83,994 | 83,388 | ±4276 | 5% |
| Total Net Volume Difference (m3) | −48,103 | −47,905 | ±3305 | −7% |
| Vertical Averages: | ||||
| Average Depth of Surface Lowering (m) | 0.46 | 0.60 | ±0.03 | 5% |
| Average Depth of Surface Raising (m) | 0.29 | 0.42 | ±0.03 | 7% |
| Average Total Thickness of Difference (m) for Area of Interest | 0.41 | 0.41 | ±0.02 | 5% |
| Average Net Thickness Difference (m) for Study Area | −0.23 | −0.23 | ±0.02 | −7% |
| Percentages (by volume) | ||||
| Percent Elevation Lowering | 79% | 79% | ||
| Percent Surface Raising | 21% | 21% | ||
| Percent Imbalance (departure from equilibrium) | −29% | −29% | ||

Table A2.
The terminus of the Scottbreen in the range of 28 July 2013.
Table A2.
The terminus of the Scottbreen in the range of 28 July 2013.
| Attribute | Raw | Thresholded DoD Estimate: | ||
|---|---|---|---|---|
| Areal Metrics | ||||
| Total Area of Surface Lowering (m2) | 62,558 | 62,250 | ||
| Total Area of Surface Raising (m2) | 911 | 731 | ||
| Total Area (m2) | 63,469 | 62,981 | 99% | |
| Total Volumetric Metrics | ± Error Volume | % Error | ||
| Total Volume of Surface Lowering (m3) | 53,479 | 53,475 | ±1761 | 3% |
| Total Volume of Surface Raising (m3) | 164 | 162 | ±21 | 13% |
| Total Volume of Difference (m3) | 53,643 | 53,637 | ±1781 | 3% |
| Total Net Volume Difference (m3) | −53,315 | −53,313 | ±1761 | −3% |
| Vertical Averages: | ||||
| Average Depth of Surface Lowering (m) | 0.85 | 0.86 | ±0.03 | 5% |
| Average Depth of Surface Raising (m) | 0.18 | 0.22 | ±0.03 | 7% |
| Average Total Thickness of Difference (m) for glacier terminus | 0.85 | 0.85 | ±0.02 | 5% |
| Average Net Thickness Difference (m) for Area of Interest | −0.84 | −0.84 | ±0.02 | −7% |
| Percentages (by volume) | ||||
| Percent Elevation Lowering | 79% | 79% | ||
| Percent Surface Raising | 21% | 21% | ||
| Percent Imbalance (departure from equilibrium) | −29% | −29% | ||

Table A3.
The area uncovered to 18 August 2013 (recent-deglaciated area)
Table A3.
The area uncovered to 18 August 2013 (recent-deglaciated area)
| Attribute | Raw | Thresholded DoD Estimate: | ||
|---|---|---|---|---|
| Areal Metrics | ||||
| Total Area of Surface Lowering (m2) | 4495 | 4302 | ||
| Total Area of Surface Raising (m2) | 356 | 247 | ||
| Total Area (m2) | 4851 | 4549 | 94% | |
| Total Volumetric Metrics | ± Error Volume | %Error | ||
| Total Volume of Surface Lowering (m3) | 2497 | 2494 | ±122 | 5% |
| Total Volume of Surface Raising (m3) | 55 | 54 | ±7 | 13% |
| Total Volume of Difference (m3) | 2552 | 2549 | ±129 | 5% |
| Total Net Volume Difference (m3) | −2441 | −2440 | ±122 | −5% |
| Vertical Averages: | ||||
| Average Depth of Surface Lowering (m) | 0.56 | 0.58 | ±0.03 | 5% |
| Average Depth of Surface Raising (m) | 0.16 | 0.22 | ±0.03 | 13% |
| Average Total Thickness of Difference (m) for Area of Interest | 0.53 | 0.53 | ±0.03 | 5% |
| Average Net Thickness Difference (m) for Recent-Deglaciated Area | −0.50 | −0.50 | ±0.03 | −5% |
| Percentages (by volume) | ||||
| Percent Elevation Lowering | 98% | 98% | ||
| Percent Surface Raising | 2% | 2% | ||
| Percent Imbalance (departure from equilibrium) | −48% | −48% | ||

Table A4.
The glacier forefield—inner marginal zone.
Table A4.
The glacier forefield—inner marginal zone.
| Attribute | Raw | Thresholded DoD Estimate: | ||
|---|---|---|---|---|
| Areal Metrics | ||||
| Total Area of Surface Lowering (m2) | 80,495 | 46,429 | ||
| Total Area of Surface Raising (m2) | 61,106 | 41,451 | ||
| Total Area (m2) | 141,601 | 62% | ||
| Total Volumetric Metrics | ± Error Volume | % Error | ||
| Total Volume of Surface Lowering (m3) | 12,372 | 11,974 | ±1313 | 11% |
| Total Volume of Surface Raising (m3) | 17,773 | 17,570 | ±1172 | 7% |
| Total Volume of Difference (m3) | 30,145 | 29,545 | ±2486 | 8% |
| Total Net Volume Difference (m3) | 5400 | 5596 | ±1760 | 31% |
| Vertical Averages: | ||||
| Average Depth of Surface Lowering (m) | 0.15 | 0.26 | ±0.03 | 11% |
| Average Depth of Surface Raising (m) | 0.29 | 0.42 | ±0.03 | 7% |
| Average Total Thickness of Difference (m) for Area of Interest | 0.21 | 0.21 | ±0.02 | 8% |
| Average Net Thickness Difference (m) for Glacier Forefield | 0.04 | 0.04 | ±0.01 | 31% |
| Percentages (by volume) | ||||
| Percent Elevation Lowering | 41% | 41% | ||
| Percent Surface Raising | 59% | 59% | ||
| Percent Imbalance (departure from equilibrium) | 9% | 9% | ||
References
- Hagen, J.O.; Liestøl, O.; Roland, E.; Jørgensen, T. Glacier Atlas of Svalbard and Jan Mayen; Norsk Polarinstitutt Meddelelser: Oslo, Norway, 1993; p. 141. [Google Scholar]
- Jania, J.; Hagen, J.O. Mass Balance of Arctic Glaciers; University of Silesia: Sosnowiec-Oslo, Poland, 1996; p. 62. [Google Scholar]
- Hagen, J.O.; Melvold, K.; Pinglot, F.; Dowdeswell, J.A. On the net mass balance of the glaciers and ice caps in Svalbard, Norwegian. Arct. Antarct. Alp. Res. 2003, 35, 264–270. [Google Scholar] [CrossRef]
- Hagen, J.O.M.; Eiken, T.; Kohler, J.; Melvold, K. Geometry changes on Svalbard glaciers: Mass-balance or dynamic response? Ann. Glaciol. 2005, 42, 255–261. [Google Scholar] [CrossRef]
- Błaszczyk, M.; Jania, J.A.; Hagen, J.O. Tidewater glaciers of Svalbard: Recent changes and estimates of calving fluxes. Polar Res. 2009, 30, 85–142. [Google Scholar]
- Zemp, M.; Hoelzle, M.; Haeberli, W. Six decades of glacier mass-balance observations: A re-view of the worldwide monitoring network. Ann. Glaciol. 2009, 50, 101–111. [Google Scholar] [CrossRef]
- Pachauri, R.K.; Meyeer, L.A. (Eds.) IPCC Climate Change 2014: Synthesis Report. In Contribution of Working Groups I, II and III to the Fifth Assessment Report of the Intergovernmental Panel on Climate Change; IPCC: Geneva, Switzerland, 2014. [Google Scholar]
- Christianson, K.; Kohler, J.; Alley, R.B.; Nuth, C.; Van Pelt, W. Dynamic perennial firn aquifer on an Arctic glacier. Geophys. Res. Lett. 2015, 42, 1418–1426. [Google Scholar] [CrossRef]
- Nuth, C.; Schuler, T.V.; Kohler, J.; Altena, B.; Hagen, J.O. Estimating the long-term calving flux of Kronebreen, Svalbard, from geodetic elevation changes and mass-balance modeling. J. Glaciol. 2012, 58, 119–133. [Google Scholar] [CrossRef]
- Sobota, I. Selected methods in mass balance estimation of Waldemar Glacier Spitsbergen. Pol. Polar Res. 2007, 28, 249–268. [Google Scholar]
- Sobota, I.; Nowak, M.; Weckwerth, P. Long-term changes of glaciers in north-western Spitsbergen. Glob. Planet. Chang. 2016, 144, 182–197. [Google Scholar] [CrossRef]
- Connor, L.N.; Laxon, S.W.; Ridout, A.L.; Krabill, W.B.; McAdoo, D.C. Comparison of Envisat radar and airborne laser altimeter measurements over Arctic sea ice. Remote Sens. Environ. 2009, 113, 563–570. [Google Scholar] [CrossRef]
- Barnhart, T.B.; Crosby, B.T. Comparing Two Methods of Surface Change Detection on an Evolving Thermokarst Using High-Temporal-Frequency Terrestrial Laser Scanning, Selawik River, Alaska. Remote Sens. 2013, 5, 2813–2837. [Google Scholar] [CrossRef]
- Carrivick, J.L.; Berry, K.; Geilhausen, M.; James, W.H.; Williams, C.; Brown, L.E.; Rippin, D.M.; Carver, S.J. Decadal-scale changes of the ödenwinkelkees, central Austria, suggest increasing control of topography and evolution towards steady state. Geogr. Ann. 2015, 97, 543–562. [Google Scholar] [CrossRef]
- Papasodoro, C.; Berthier, E.; Royer, A.; Zdanowicz, C.; Langlois, A. Area, elevation and mass changes of the two southernmost ice caps of the Canadian Arctic Archipelago between 1952 and 2014. Cryosphere 2015, 9, 1535–1550. [Google Scholar] [CrossRef]
- Staines, K.E.H.; Carrivick, J.L.; Tweed, F.S.; Evans, A.J.; Russell, A.J.; Jóhannesson, T.; Roberts, M. A multi-dimensional analysis of pro-glacial landscape change at Sólheimajökull, southern Iceland. Earth Surf. Process. Landf. 2014, 40, 809–822. [Google Scholar] [CrossRef]
- Sobota, I.; Lankauf, K.R. Recession of Kaffiøyra Region Glaciers, Oscar II Land, Svalbard. Bull. Geogr. 2010, 3, 27–45. [Google Scholar] [CrossRef][Green Version]
- Lankauf, K.R. The Retreat of the Glaciers in the Kaffiøyra Region (Oscar II Land-Spitsbergen) in the Twentieth Century; Polish Academy of Science: Warsaw, Poland, 2002; p. 221. [Google Scholar]
- Zagórski, P.; Bartoszewski, S. An Attempt at the Estimation of the Recession of the Scott Glacier (Spitsbergen) on the Basis of Archival Materials and GPS Measurements. In Polish Polar Studies; Styszyńska, A., Marsz, A.A., Eds.; Katedra Meteorologii i Oceanografii Nautycznej AM: Gdynia, Poland, 2004; pp. 415–423. [Google Scholar]
- Brasington, J.; Rumsby, B.T.; McVey, R.A. Monitoring and modelling morphological change in a braided gravel-bed river using high resolution GPS-based survey. Earth Surf. Process. Landf. 2000, 25, 973–990. [Google Scholar] [CrossRef]
- Bolch, T.; Shea, J.M.; Liu, S.; Azam, F.M.; Gao, Y.; Gruber, S.; Immerzeel, W.W.; Kulkarni, A.; Li, H.; Tahir, A.A.; et al. Status and Change of the Cryosphere in the Extended Hindu Kush Himalaya Region. In The Hindu Kush Himalaya Assessment: Mountains, Climate Change, Sustainability and People; Wester, P., Ed.; Springer International Publishing: Chem, Switzerland, 2019; pp. 209–255. [Google Scholar]
- Zhang, G.; Bolch, T.; Allen, S.; Linsbauer, A.; Chen, W.; Wang, W. Glacial lake evolution and glacier–lake interactions in the Poiqu River basin, central Himalaya, 1964–2017. J. Glaciol. 2019, 65, 347–365. [Google Scholar] [CrossRef]
- Kääb, A.; Lefauconnier, B.; Melvold, K. Flow field of Kronebreen, Svalbard, using repeated Landsat 7 and ASTER data. Ann. Glaciol. 2005, 42, 7–13. [Google Scholar] [CrossRef]
- Dowdeswell, J.A.; Benham, T.J. A surge of Perseibreen, Svalbard, examined using aerial photography and ASTER high−Resolution satellite imagery. Polar Res. 2003, 22, 373–383. [Google Scholar] [CrossRef]
- Luckman, A.; Benn, D.I.; Cottier, F.; Bevan, S.; Nilsen, F.; Inall, M. Calving rates at tidewater glaciers vary strongly with ocean temperature. Nat. Commun. 2015, 6, 8566. [Google Scholar] [CrossRef]
- Vieli, A.; Jania, J.; Kolondra, L. The retreat of a tidewater glacier: Observations and model calculations on Hansbreen, Spitsbergen. J. Glaciol. 2002, 48, 592–600. [Google Scholar] [CrossRef]
- Kolondra, L. The centenary of Hans Glacier front position change measurements (S-Spitsbergen). Arch. Fotogram. Kartogr. Teledetekcji 2007, 17, 375–384. [Google Scholar]
- Wangensteen, B.; Eiken, T.; Ødegård, R.S.; Sollid, J.L. Measuring coastal cliff retreat in the Kongsfjorden area, Svalbard, using terrestrial photogrammetry. Polar Res. 2007, 26, 14–21. [Google Scholar] [CrossRef]
- Szczęsny, R.; Dzierżek, J.; Harasimiuk, H.; Nitychoruk, J.; Pękala, K.; Repelewska-Pękalowa, J. Photogeological Map of the Renardbreen, Scottbreen and Blomlibreen Forefield (Wedel Jarls-berg Land, Spitsbergen), Scale 1:10,000; Wydawnictwa Geologiczne: Warszawa, Poland, 1989.
- Colomina, I.; Molina, P. Unmanned aerial systems for photogrammetry and remote sensing: A review. ISPRS J. Photogramm. Remote Sens. 2014, 92, 79–97. [Google Scholar] [CrossRef]
- Westoby, M.J.; Brasington, J.; Glasser, N.F.; Hambrey, M.J.; Reyonds, M.J. Structure from Motion photogrammetry: A low-cost, effective tool for geoscience applications. Geomorphology 2012, 179, 300–314. [Google Scholar] [CrossRef]
- Lucieer, A.; Turner, D.; King, D.H.; Robinson, S.A. Using an Unmanned Aerial Vehicle (UAV) to capture micro-topography of Antarctic moss beds. Int. J. Appl. Earth Obs. Geoinf. 2014, 27, 53–62. [Google Scholar] [CrossRef]
- Ryani, J.C.; Hubbard, A.L.; Box, J.; Todd, J.; Christoffersen, P.; Carr, J.R.; Holt, T.O.; Snooke, N. UAV photogrammetry and structure from motion to assess calving dynamics at Store Glacier, a large outlet draining the Greenland ice sheet. Cryosphere 2015, 9, 1–11. [Google Scholar] [CrossRef]
- Charlton, M.E.; Large, A.R.G.; Fuller, I.C. Application of airborne LiDAR in river environments: The river Coquet, Northumberland, UK. Earth Surf. Process. Landf. 2003, 28, 299–306. [Google Scholar] [CrossRef]
- Bamber, J.L.; Krabill, W.; Raper, V.; Dowdeswel, J.A.; Oerlemans, J. Elevation changes measured on Svalbard glaciers and ice caps from airborne LiDAR data. Ann. Glaciol. 2005, 42, 202–208. [Google Scholar] [CrossRef][Green Version]
- Arnold, N.S.; Ress, W.G.; Devereux, B.J.; Amable, G.S. Evaluating the potential of high resolution airborne LiDAR data in glaciology. Int. J. Remote Sens. 2006, 27, 1233–1251. [Google Scholar] [CrossRef]
- Irvine-Fynn, T.D.L.; Barrand, N.; Porter, P.; Hodson, A.; Murray, T. Recent High-Arctic glacial sediment redistribution: A process perspective using airborne lidar. Geomorphology 2011, 125, 27–39. [Google Scholar] [CrossRef]
- Heritage, G.L.; Hetherington, D. Towards a protocol for laser scanning in fluvial geomorphology. Earth Surf. Process. Landf. 2007, 32, 66–74. [Google Scholar] [CrossRef]
- Heritage, G.L.; Milan, D.J.; Large, A.R.G.; Fuller, I.C. Influence of survey strategy and interpolation model on DEM quality. Geomorphology 2009, 112, 334–344. [Google Scholar] [CrossRef]
- Lichti, D.D.; Gordon, S.J.; Tipdecho, T. Error Models and Propagation in Directly Georeferenced Terrestrial Laser Scanner Networks. J. Surv. Eng. 2005, 131, 135–142. [Google Scholar] [CrossRef]
- Milan, D.J.; Heritage, G.L.; Hetherington, D. Application of a 3D laser scanner in the assess-ment of erosion and deposition volumes and channel change in a proglacial river. Earth Surf. Process. Landf. 2007, 32, 1657–1674. [Google Scholar] [CrossRef]
- Kenner, R.; Phillips, M.; Danioth, C.; Denier, C.; Thee, P.; Zgraggen, A. Investigation of rock and ice loss in a recently deglaciated mountain rock wall using terrestrial laser scanning: Gemsstock, Swiss Alps. Cold Reg. Sci. Technol. 2011, 67, 157–164. [Google Scholar] [CrossRef]
- Kociuba, W. Application of Terrestrial Laser Scanning in the assessment of the role of small debris flow in river sediment supply in the cold climate environment. Ann. UMCS 2014, 69, 79–91. [Google Scholar] [CrossRef]
- Kociuba, W. Assessment of sediment sources throughout the proglacial area of a small Arctic catchment based on high-resolution digital elevation models. Geomorphology 2017, 287, 73–89. [Google Scholar] [CrossRef]
- Kociuba, W. Analysis of geomorphic changes and quantification of sediment budgets of a small Arctic valley with the application of repeat TLS surveys. Z. Geomorphol. Suppl. Issues 2017, 61, 105–120. [Google Scholar] [CrossRef]
- Ewertowski, M.W.; Evans, D.J.A.; Roberts, D.H.; Tomczyk, A.M.; Ewertowski, W.; Pleksot, K. Quantification of historical landscape change on the foreland of a receding polythermal glacier, Hørbyebreen, Svalbard. Geomorphology 2019, 325, 40–54. [Google Scholar] [CrossRef]
- Ewertowski, M.W.; Tomczyk, A.M.; Evans, D.J.A.; Roberts, D.H.; Ewertowski, W. Operational Framework for Rapid, Very-high Resolution Mapping of Glacial Geomorphology Using Low-cost Unmanned Aerial Vehicles and Structure-from-Motion Approach. Remote Sens. 2019, 11, 65. [Google Scholar] [CrossRef]
- Chandler, B.M.; Lovell, H.; Boston, C.M.; Lukas, S.; Barr, I.D.; Benediktsson, Í.Ö.; Benn, D.I.; Clark, C.D.; Darvill, C.M.; Evans, D.J.; et al. Glacial geomorphological mapping: A review of approaches and frameworks for best practice. Earth Sci. Rev. 2018, 185, 806–846. [Google Scholar] [CrossRef]
- Chandler, B.M.; Evans, D.J.; Chandler, S.J.; Ewertowski, M.W.; Lovell, H.; Roberts, D.H.; Schaefer, M.; Tomczyk, A.M. The glacial landsystem of Fjallsjökull, Iceland: Spatial and temporal evolution of process-form regimes at an active temperate glacier. Geomorphology 2020, 361, 107192. [Google Scholar] [CrossRef]
- Hagen, J.O.; Kohler, J.; Melvold, K.; Winther, J.G. Glaciers in Svalbard: Mass balance, runoff and fresh water flux. Pollut. Res. 2003, 22, 145–159. [Google Scholar] [CrossRef]
- Baranowski, S. Subpolarne Lodowce Spitsbergenu na tle Klimatu Tego Regionu; Acta Universitatis Wratislaviensis: Wrocław, Poland, 1977; pp. 1–157. [Google Scholar]
- Rodzik, J.; Gajek, G.; Reder, J.; Zagórski, P. Glacial Geomorphology. In Geographical Environment of NW Part of Wedel Jarlsberg Land (Spitsbergen, Svalbard); Zagórski, P., Harasimiuk, M., Rodzik, J., Eds.; MCSU Press: Lublin, Poland, 2013; pp. 36–165. [Google Scholar]
- Kociuba, W.; Janicki, G. Changeability of movable bed-surface particles in natural, gravel-bed channels and its relation to bedload grain size distribution (scott river, svalbard). Geogr. Ann. 2015, 97, 507–521. [Google Scholar] [CrossRef]
- Bartoszewski, S. Outflow Regime of the Rivers of the Wedel Jarlsberg Land; Wydawnictwo UMCS: Lublin, Poland, 1998; pp. 1–167. [Google Scholar]
- Navarro, F.; Martín-Español, A.; Lapazaran, J.; Grabiec, M.; Otero, J.; Vasilenko, E.V.; Puczko, D. Ice Volume Estimates from Ground-Penetrating Radar Surveys, Wedel Jarlsberg Land Glaciers, Svalbard. Arct. Antarct. Alp. Res. 2014, 46, 394–406. [Google Scholar] [CrossRef]
- Kociuba, W. The Mechanism and Dynamics of Sediment Supply and Fluvial Transport in a Glacial Catchment; MCSU Press: Lublin, Poland, 2015; p. 151. [Google Scholar]
- Reder, J.; Zagórski, P. Recession and development of marginal zone of the Scott Glacier. Landf. Anal. 2007, 5, 175–178. [Google Scholar]
- Kociuba, W.; Krząstek, P.; Superson, J. Combining GPS-RTK and rephotographic methodolo-gies for the assessment of transformations of the ephemeral landforms of the near foreland of a valley glacier (Scottbreen, Svalbard). Z. Geomorphol. 2016, 60, 29–44. [Google Scholar] [CrossRef]
- Leica-geosystems. Leica ScanStation C10—Datasheet. 2012. Available online: http://www.leica-geosystems.co.uk/downloads123/hds/hds/ScanStation%20C10/brochures-datasheet/Leica_ScanStation_C10_DS_en.pdf (accessed on 22 October 2020).
- Smith, M.W.; Vericat, D. Evaluating shallow-water bathymetry from through-water terres-trial laser scanning under a range of hydraulic and physical water quality conditions. River Res. Appl. 2014, 30, 905–924. [Google Scholar] [CrossRef]
- Kociuba, W.; Kubisz, W.; Zagórski, P. Use of terrestrial laser scanning (TLS) for monitoring and modelling of geomorphic processes and phenomena at a small and medium spatial scale in Polar environment (Scott River—Spitsbergen). Geomorphology 2014, 212, 84–96. [Google Scholar] [CrossRef]
- Kociuba, W. Different Paths for Developing Terrestrial LiDAR Data for Comparative Analyses of Topographic Surface Changes. Appl. Sci. 2020, 10, 7409. [Google Scholar] [CrossRef]
- Wheaton, J.M.; Brasington, J.; Darby, S.E.; Sear, D.A. Accounting for uncertainty in DEMs from repeat topographic surveys: Improved sediment budgets. Earth Surf. Process. Landf. 2009, 35, 136–156. [Google Scholar] [CrossRef]
- Brasington, J.; Langham, J.; Rumsby, B. Methodological sensitivity of morphometric esti-mates of coarse fluvial sediment transport. Geomorphology 2003, 53, 299–316. [Google Scholar] [CrossRef]
- Heritage, G.; Large, A.R.G. Laser Scanning for the Environmental Sciences; Wiley-Blackwell: Chichester, UK, 2009; p. 288. [Google Scholar]
- Milan, D.J.; Heritage, G.L.; Large, A.R.G.; Fuller, I.C. Filtering spatial error from DEMs: Implications for morphological change estimation. Geomorphology 2011, 125, 160–171. [Google Scholar] [CrossRef]
- Schwendel, A.C.; Fuller, I.C.; Death, R.G. Assessing DEM interpolation methods for effective representation of upland stream morphology for rapid appraisal of bed stability. River Res. Appl. 2012, 28, 567–584. [Google Scholar] [CrossRef]
- Reder, J. Ewolucja Stref Marginalnych Lodowców NW Części Ziemi Wedela Jarlsberga. In XX Lat Badań Polarnych Instytutu Nauk o Ziemi UMCS na Spitsbergenie; Superson, J., Zagórski, P., Eds.; MCSU Press: Lublin, Poland, 2006; pp. 45–51. [Google Scholar]
- Nuth, C.; Kohler, J.; Aas, H.F.; Brandt, O.; Hagen, J.O. Glacier geometry and elevation changes on Svalbard (1936–90): A baseline dataset. Ann. Glaciol. 2007, 46, 106–116. [Google Scholar] [CrossRef]
- Ewertowski, M.W.; Tomczyk, A.M. Quantification of the ice-cored moraines’ short-term dynamics in the high-Arctic glaciers Ebbabreen and Ragnarbreen, Petuniabukta, Svalbard. Geomorphology 2015, 234, 211–227. [Google Scholar] [CrossRef]
- Westoby, M.J.; Glasser, N.F.; Hambrey, M.J.; Brasington, J.; Reyonds, M.J.; Hassan, M.A.A. Reconstructing historic Glacial LakeOutburst Floods through numerical modelling and geomorphological assessment: Extreme events in the Himalaya. Earth Surf. Process. Landf. 2014, 39, 1675–1692. [Google Scholar] [CrossRef]
- Carrivick, J.L.; Heckmann, T. Short-term geomorphological evolution of proglacial systems. Geomorphology 2017, 287, 3–28. [Google Scholar] [CrossRef]
- Hambrey, M.J.; Glasser, N.F. The Role of Folding and Foliation Development in the Genesis of Medial Moraines: Examples from Svalbard Glaciers. J. Geol. 2003, 111, 471–485. [Google Scholar] [CrossRef]
- Bennett, M.R.; Glasser, N.F. Glacial Geology: Ice Sheets and Landforms, 2nd ed.; Wiley-Blackwell: Oxford, UK, 2009; pp. 1–385. [Google Scholar]
- Colbeck, S.C. A theory of water percolation in snow. J. Glaciol. 1972, 1, 369–385. [Google Scholar] [CrossRef]
- Conway, H.; Benedict, R. Infiltration of water into snow. Water Resour. Res. 1994, 30, 641–649. [Google Scholar] [CrossRef]
- Bales, R.C.; Harrington, R.F. Resent progress in snow hydrology. Rev. Geophys. 1995, 33, 1011–1020. [Google Scholar] [CrossRef]
- Cuffey, K.M.; Paterson, W.S.B. The Physics of Glaciers, 4th ed.; Elsevier: Oxford, UK, 2010; pp. 1–674. [Google Scholar]
Publisher’s Note: MDPI stays neutral with regard to jurisdictional claims in published maps and institutional affiliations. |
© 2020 by the authors. Licensee MDPI, Basel, Switzerland. This article is an open access article distributed under the terms and conditions of the Creative Commons Attribution (CC BY) license (http://creativecommons.org/licenses/by/4.0/).

