Abstract
This paper presents a systematic approach to extract electrical equivalent circuit model (ECM) parameters of the Li-ion battery (LIB) based on electrochemical impedance spectroscopy (EIS). Particularly, the proposed approach is suitable to practical applications where the measurement noise can be significant, resulting in a low signal-to-noise ratio. Given the EIS measurements, the proposed approach can be used to obtain the ECM parameters of a battery. Then, a time domain approach is employed to validate the accuracy of estimated ECM parameters. In order to investigate whether the ECM parameters vary as the battery’s state of charge (SOC) changes, the EIS experiment was repeated at nine different SOCs. The experimental results show that the proposed approach is consistent in estimating the ECM parameters. It is found that the battery parameters, such as internal resistance, capacitance and inductance, remain the same for practical SOC ranges starting from 20% until 90%. The ECM parameters saw a significant change at low SOC levels. Furthermore, the experimental data show that the resistive components estimated in the frequency domain are very close to the internal resistance estimated in the time domain. The proposed approach was applied to eight different battery cells consisting of two different manufacturers and produced consistent results.
1. Introduction
Lithium-based rechargeable battery packs have been widely adopted in electric vehicles (EVs). The behavior of the lithium-ion battery (LIB) is highly nonlinear. A battery management system (BMS) [1] ensures the safety, efficiency and reliability of electric vehicles by continuously monitoring the battery packs. The main component of a BMS is the battery fuel gauge (BFG). The BFG estimates all the critical parameters of the battery, such as state of charge (SOC), state of health (SOH), time to shut down (TTS) and remaining useful life (RUL) [2,3,4]. In order for the BFG to achieve all these aspects, identifying a battery model and estimating its parameters remains a crucial step [5].
So far, two approaches have been developed in the literature for estimating a battery’s electrical equivalent circuit model (ECM) parameters: time domain and frequency domain approaches [6]. In the time domain approach, voltage and current measurements from the battery are used [7,8] to estimate the ECM parameters. The EIS is a well-known frequency domain technique in which the output response is the impedance of the battery [9] at different frequencies; it was introduced by Heaviside in 1894 [10]. In electrochemical impedance spectroscopy (EIS), special excitation signals with varying frequencies are superimposed on the charging or discharging current of the battery. The measured time domain responses (voltage and current) are converted to frequency domain using Fast Fourier Transform (FFT) [11] and the impedance is computed in the frequency domain. The battery’s ECM parameters can be estimated based on the impedance computed at a specified range of frequencies.
Significant work has been reported in the literature about the application of the EIS technique in battery management. In [9], the measurement accuracy was enhanced by using an improved input excitation method and a precise impedance measurement technique which can clip offset and amplify signals together with FFT. Insteading of using FFT to estimate the battery’s EIS, Felder et al. [12] estimated a battery’s EIS by computing the signal’s amplitude and phase; furthermore, changing sampling frequency does not affect the accuracy of this approach. Allagui et al. [13] analyzed the stability, linearity, dissipation, and degradation of a battery cell’s electrochemical behavior in frequency and time domain and found that a modified constant phase element can be used to fit EIS data in low frequency. Physics-based battery modeling was addressed in [14] by using the EIS technique. Models using the EIS technique to estimate the battery’s SOC based on fractional order impedance have been developed in [15,16]. Battery aging identification and quantification was completed using EIS for four parallel Li-ion cells in [17]. A power converter was used in a closed loop with a step perturbation current for better control of the output from EIS [18].
Nonlinear least square (NLS) estimation techniques were used in [19] to estimate the ECM parameters of the battery. NLS techniques were employed to estimate battery ECM parameters in the presence of Gaussian noise with a high signal-to-noise ratio (SNR) [20]. However, in [20], the estimated parameters were not analyzed against SOC. A circuit parameter extraction algorithm for the LIB charging system using online EIS was performed in [21]. In [22], ECM parameters were extracted using the recursive time and frequency domain estimation approach. Additionally, EIS at different SOC levels of a battery was performed in [23]; however, the estimation accuracy was not shown. Parameter estimation in both the time and frequency domain using the least square genetic algorithm (LSGA) was demonstrated in [16]; however, the resulting parameters at different SOC levels were not shown. In [24], EIS at different SOC levels was performed; however, the experimentation was not for estimating parameters but rather for investigating the effect in SOH. Feng et al. [25] applied complex nonlinear least-squares (CNLS) to estimate ECM parameters with the EIS data measured from one battery at different SOC and temperatures; however, their parameter estimation approach was based on a simplified ECM (SECM) which aims to model the solid–liquid electrolyte lithium-ion batterie (SLELB); in addition, they only estimated resistive components of the SECM and did not employ any independent approaches to validate the estimated parameters. Pastor-Fernández et al. [26] applied a CNLS fitting algorithm to extract ECM parameters with the EIS data measured from four 3 Ah 18650 NCA-C Lion-ion batteries; their estimation approach is based on AR-ECM, but they only estimated the ohmic, solid electrolyte interface (SEI), charge transfer (CT), and Warburg resistance of the AR-ECM at , , and SOC over different aging cycles.
In general, the EIS approach has been significantly employed in the literature for battery analysis. However, little had been accomplished to develop closed-form approaches to estimate the ECM parameters of the battery. Such approaches to battery parameter estimation need to be tested using data from multiple, yet identical batteries for consistency. It is also important to verify the efficacy of the parameter extraction approach with alternate methods. The existing works in the literature lack these avenues, and the present paper aims to contribute toward closed-form battery parameter estimation based on EIS.
The contributions of this paper can be summarized as follows:
- This paper uses the parameter estimation approach presented in [27] to extract the battery ECM parameters based on EIS at multiple SOC levels.
- For the first time, the closed-form ECM parameters obtained using the frequency domain (EIS) approach were compared to the ECM parameters obtained using a time domain approach at multiple SOC levels. This time domain ECM parameter estimation approach [28] exploits the pulse stream current profile to reduce the error due to measurement noise. Furthermore, the proposed parameter estimation approach was partially tested based on parameters reported by the scientific grade measurement system.
- The ECM parameter estimation approach was applied to four different battery cells belonging to two different manufacturers, and the results were found to be consistent.
The remainder of the paper is organized as follows: Section 2 describes the algorithms used to estimate ECM parameters in the frequency domain. Section 3 describes the algorithms used to estimate ECM parameters in the time domain. The experimental procedure is explained in Section 4. Results are discussed in Section 5. Section 6 concludes the paper.
2. Frequency Domain Approach to ECM Parameter Estimation
EIS is a widely used technique to study the impedance response of the battery. In EIS, a small perturbation current with a wide range of frequencies (0.01 Hz to 10 kHZ) is supplied to the battery, and its impedance at those frequencies can be measured. The battery impedance is then represented by real values on the x-axis and imaginary values on the y-axis in a Nyquist plot [29,30]. This plot represents the impedance spectrum of the battery from which the model parameters are estimated with algorithms using identified feature points on the curve.
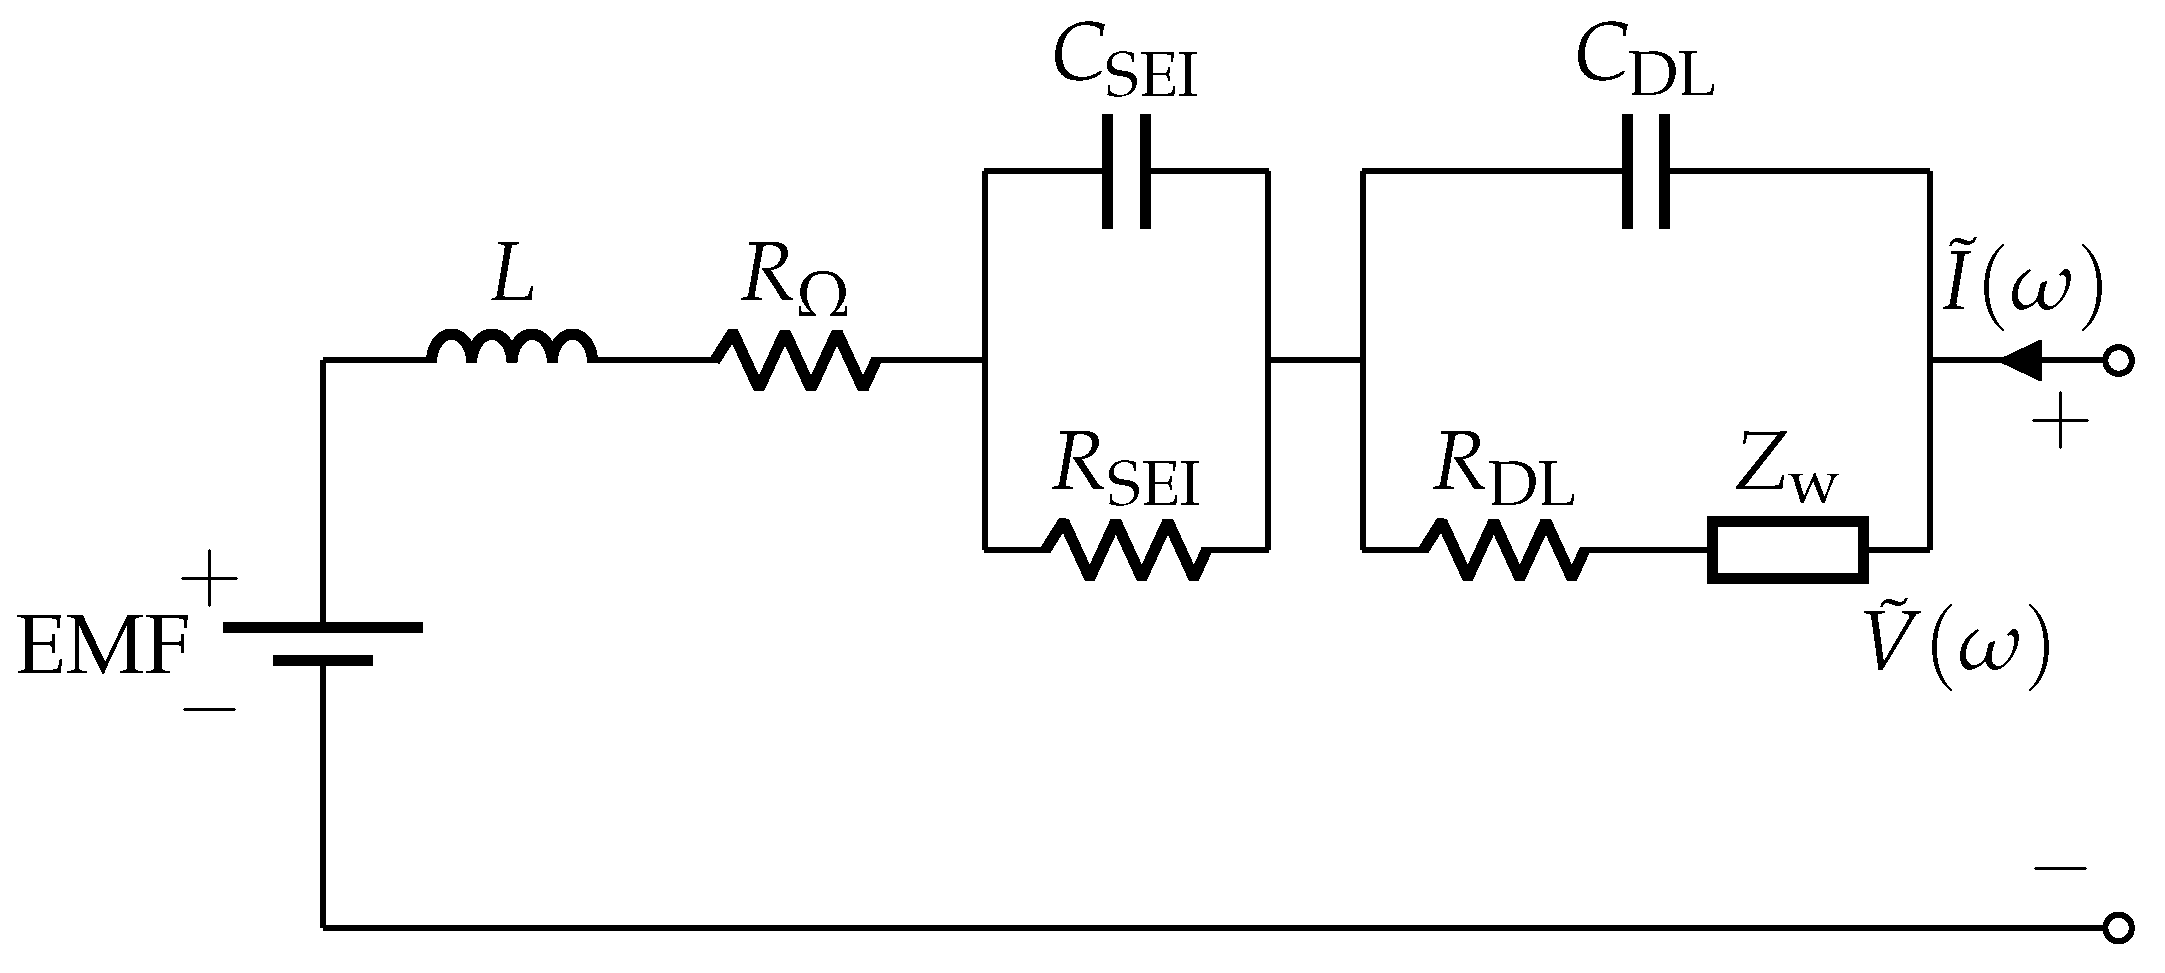
The frequency domain approach uses the Adaptive Randles equivalent circuit model (AR-ECM) shown in Figure 1. The AR-ECM consists of the following elements: battery voltage source, ohmic resistance (), stray inductance (L), resistance due to SEI layer (), capacitance due to SEI layer (), charge transfer resistance (), double layer capacitance () and Warburg impedance (). Figure 2.1(b) in [27] shows the Nyquist plot relevant to the AR-ECM.

Figure 1.
Adaptive Randles equivalent circuit model (AR-ECM) of a battery.
According to Figure 1, the AC impedance corresponding to AR-ECM can be written as [27]
where denotes the impedance in the RL arc, denotes the impedance in the SEI arc, and denotes the impedance in the CT arc and Diffusion arc.
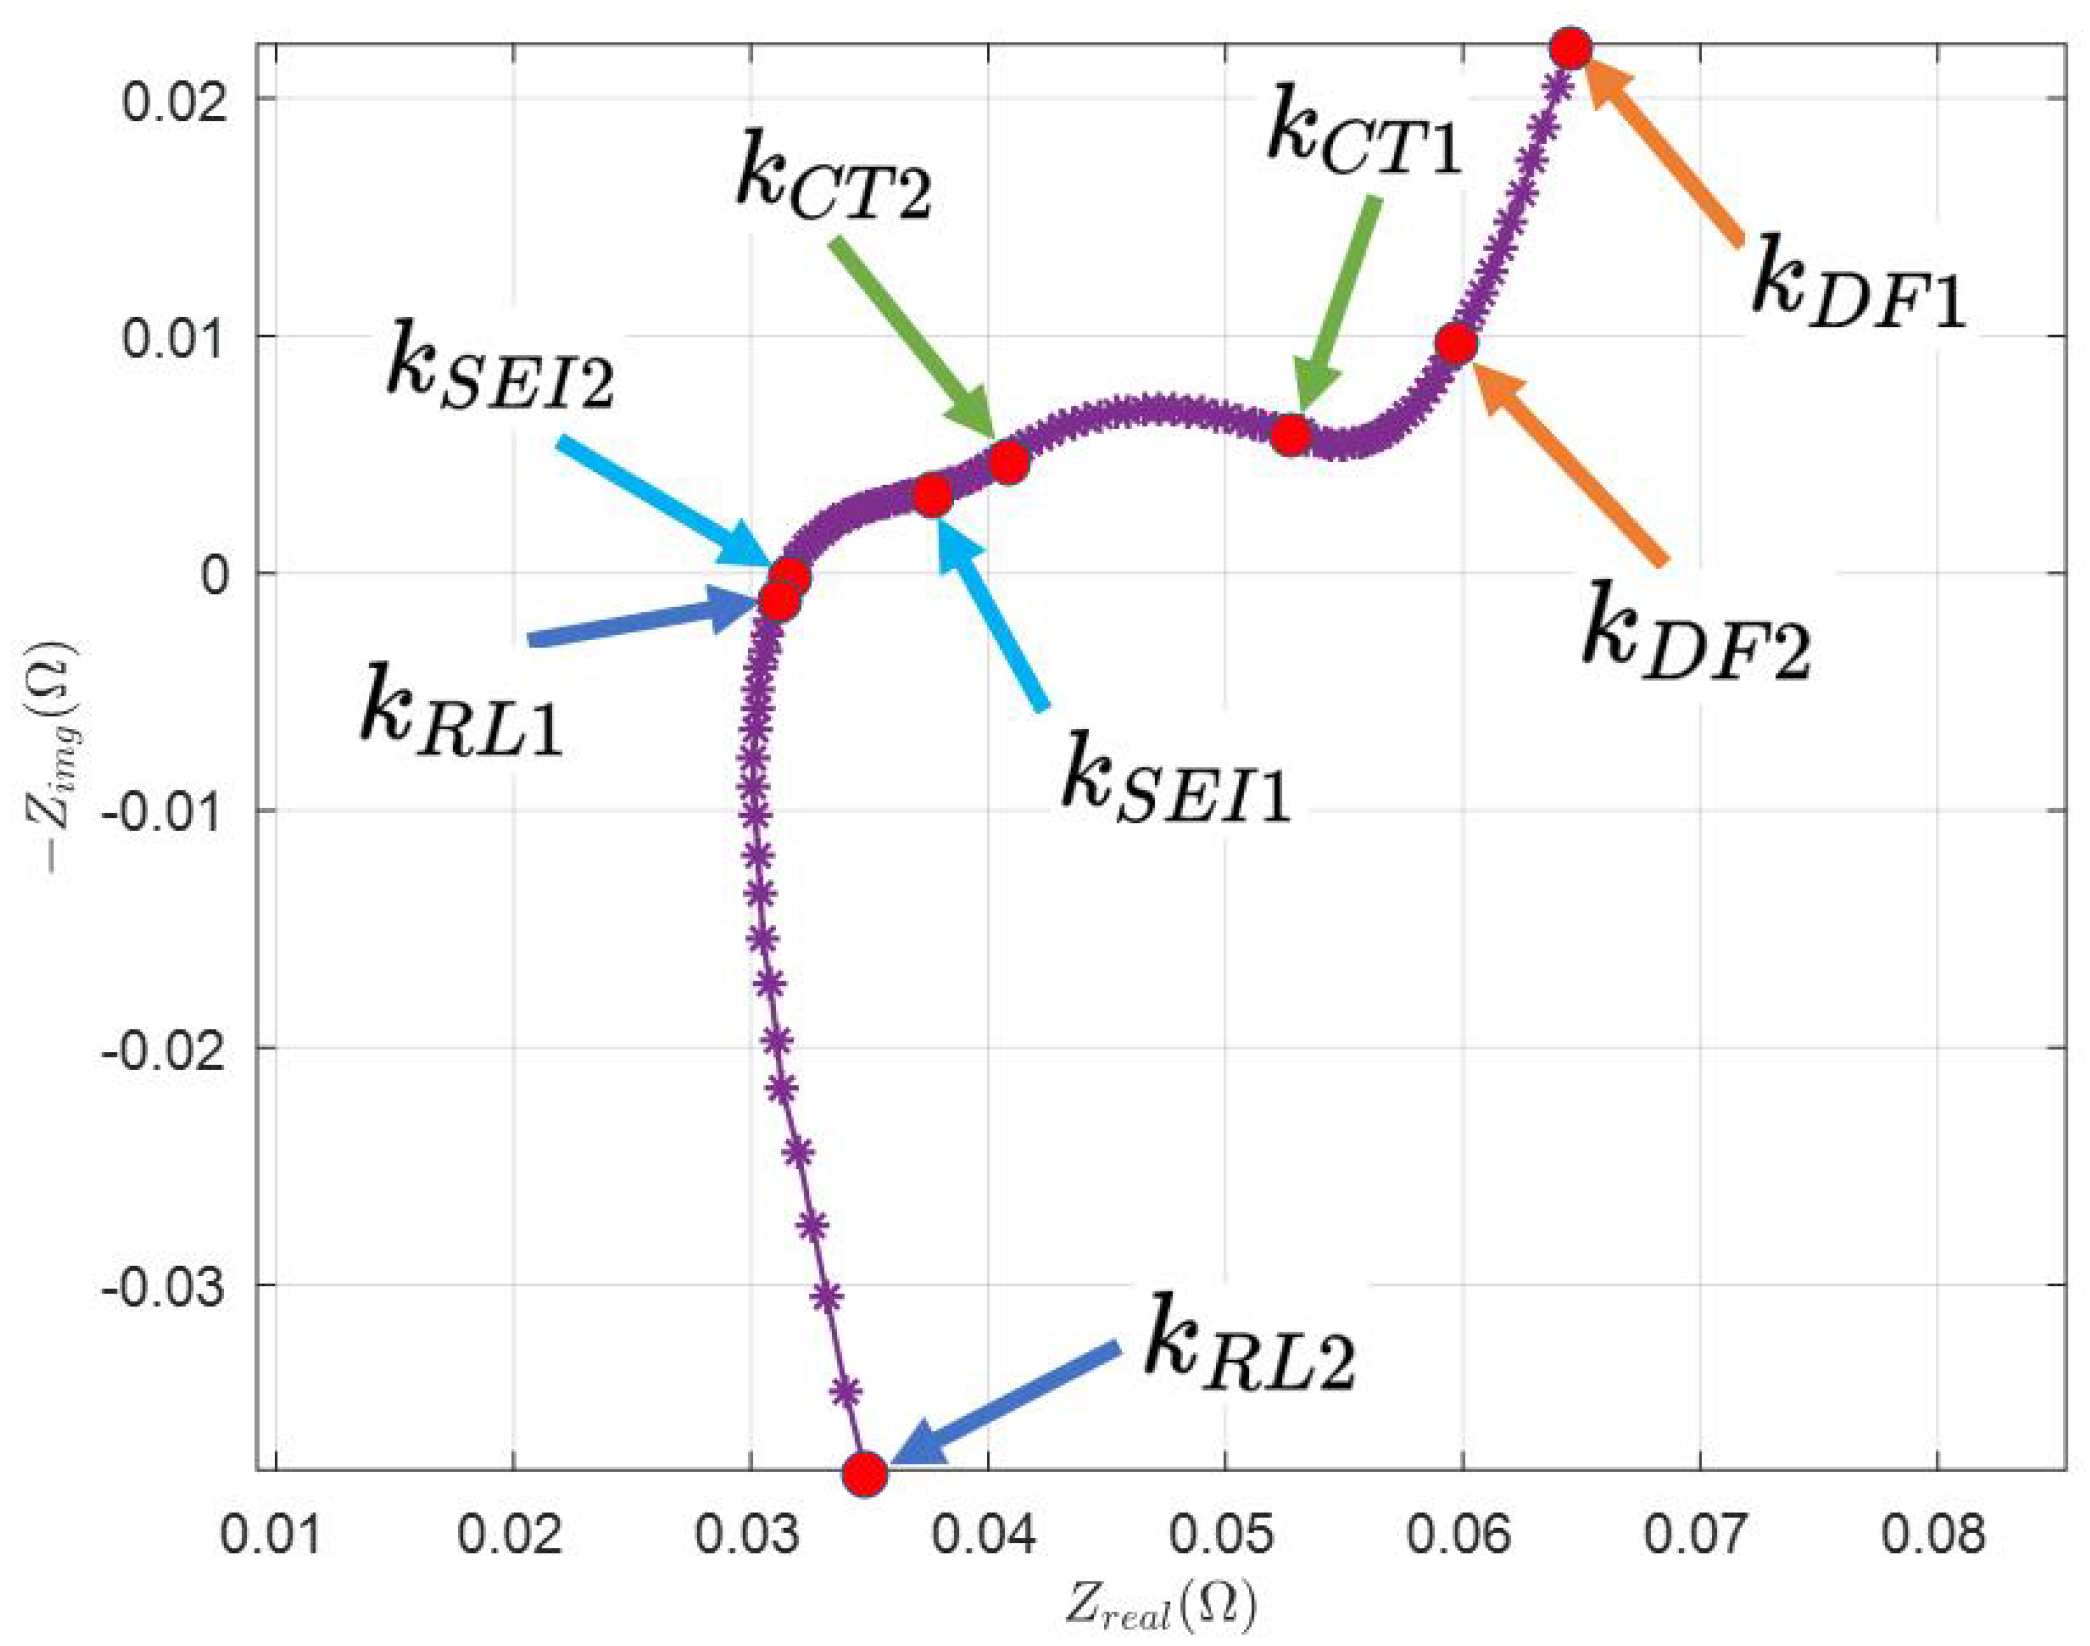
In Figure 2, the feature points are selected manually, which are indicated by index and . From Figure 1, it is clear that the measured Nyquist plot needs to be divided into several parts to see how it is directly related to the AR-ECM. Different parts of the Nyquist plot represent the battery’s impedance at different frequencies.
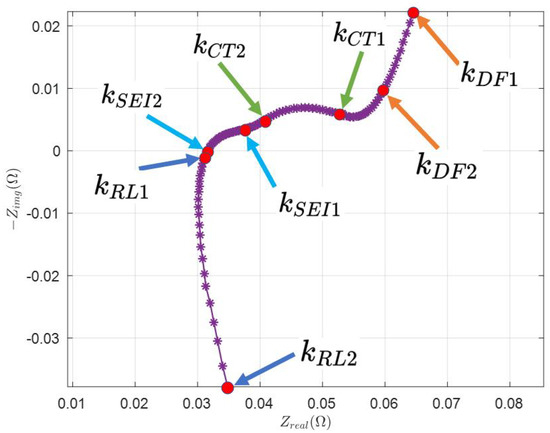
Figure 2.
Selection of feature points from the real Nyquist plot.
- is the index of the first data point, that is, .
- is selected such that the data points from to follow the linear line.
- is selected at the beginning of the CT arc such that the data points start to follow the arc.
- is selected at the end of CT arc such that to follows the CT arc to achieve the best fit.
- Similarly, is selected at the beginning of the SEI arc.
- is selected at the end of the SEI arc such that follow the SEI arc to achieve the best fit.
- is selected at the beginning of the RL arc.
- is selected at the end of the RL arc.
To solve the problem of ECM parameter estimation, using the least squares (LS) algorithm to fit the real Nyquist plot as shown in Figure 2 is a promising approach, as this can reduce the effect of measurement noise to increase the accuracy of estimated parameters. The following section will summarize the LS approach [27] to ECM parameters estimation based on the manually selected feature points.
2.1. Estimation of Ohmic Resistance and Stray Inductance
From the previous work in [27], ohmic resistance can be estimated as
and stray inductance L can be estimated as
where and , and .
2.2. Estimation of Warburg Coefficient
Warburg impedance is defined mathematically as
where is the Warburg coefficient.
From Figure 1, it is clear that the Warburg impedance is significant only at lower frequencies (). In Figure 2, feature points from to are selected (where = 1), considering the real part of the impedance in the diffusion arc:
where . The expression is used to reduce the effect of noise in the measurements.
The LS estimate of is
2.3. Estimation of and
The impedance for frequencies is in a practical Nyquist plot as shown in Figure 2; to fit the SEI arc precisely, we select feature points that lie between and . Therefore, the impedance of the SEI arc between is given as
The impedance measurements in the SEI arc can be denoted as:
where and .
Estimation of the SEI arc is essentially the problem of fitting a semicircle with its center lying on the real axis; the coordinates of this semicircle’s center can be noted as (, 0); the radius of the semicircle can be noted as ; therefore, the measurements in (9) should satisfy the equation of the semicircle, which are given by
Let and , thus
In addition, (11) can be rewritten as
In the matrix form, (14) can be written as
Using the LS algorithm, the estimate of will be given by
The estimates of c and d are:
From Figure 2.1(b) in [27], the solid electrolyte interface resistance is the diameter of the SEI arc; thus, by substituting the values of c and d in (13), the estimate of is
In (1), when the frequency is very high, we assume the impedance in the CT arc and Diffusion arc will be very small so that it is negligible; thus, the term will become zero, that is
Therefore, the impedance in the SEI arc can be expressed as:
Taking the imaginary part on both sides of the above equation,
Finally, we average all the estimates to obtain the final estimate
2.4. Estimation of and
The practical Nyquist plot is shown in Figure 2; to fit the CT arc precisely, we select feature points that lie between and ; therefore, the impedance of the CT arc between is given as
The impedance measurements in the CT arc can be denoted as:
where and .
Similar to the estimation of , can be estimated by fitting a semicircle to the CT arc. Assuming that the center of the semicircle lies on the real axis, which is noted as (, 0), the radius of the semicircle can be noted as ; therefore, the measurements in (28) should satisfy the equation of the semicircle, which is given by
Let and ; thus,
Now, (30) can be rewritten as
In the matrix form, (33) can be written as
From (34), can be estimated using the LS algorithm
Thus, the estimates of a and b are:
From Figure 2.1(b) in [27], the charge transfer resistance is the diameter of the CT arc; thus, by substituting the values of a and b in (32), the estimate of is
From (1),
Therefore, the impedance in the CT arc and Diffusion arc can be expressed as:
Taking the imaginary part on both sides of the above equation, and substituting with the expression given in (5), we obtain
Substituting L, , , , and with the estimations given in (3), (2), (18), (26), (37), and (7), respectively, in (24) at :
Finally, we average all the estimates to obtain the final estimate
3. Time Domain Approach to ECM Parameter Estimation
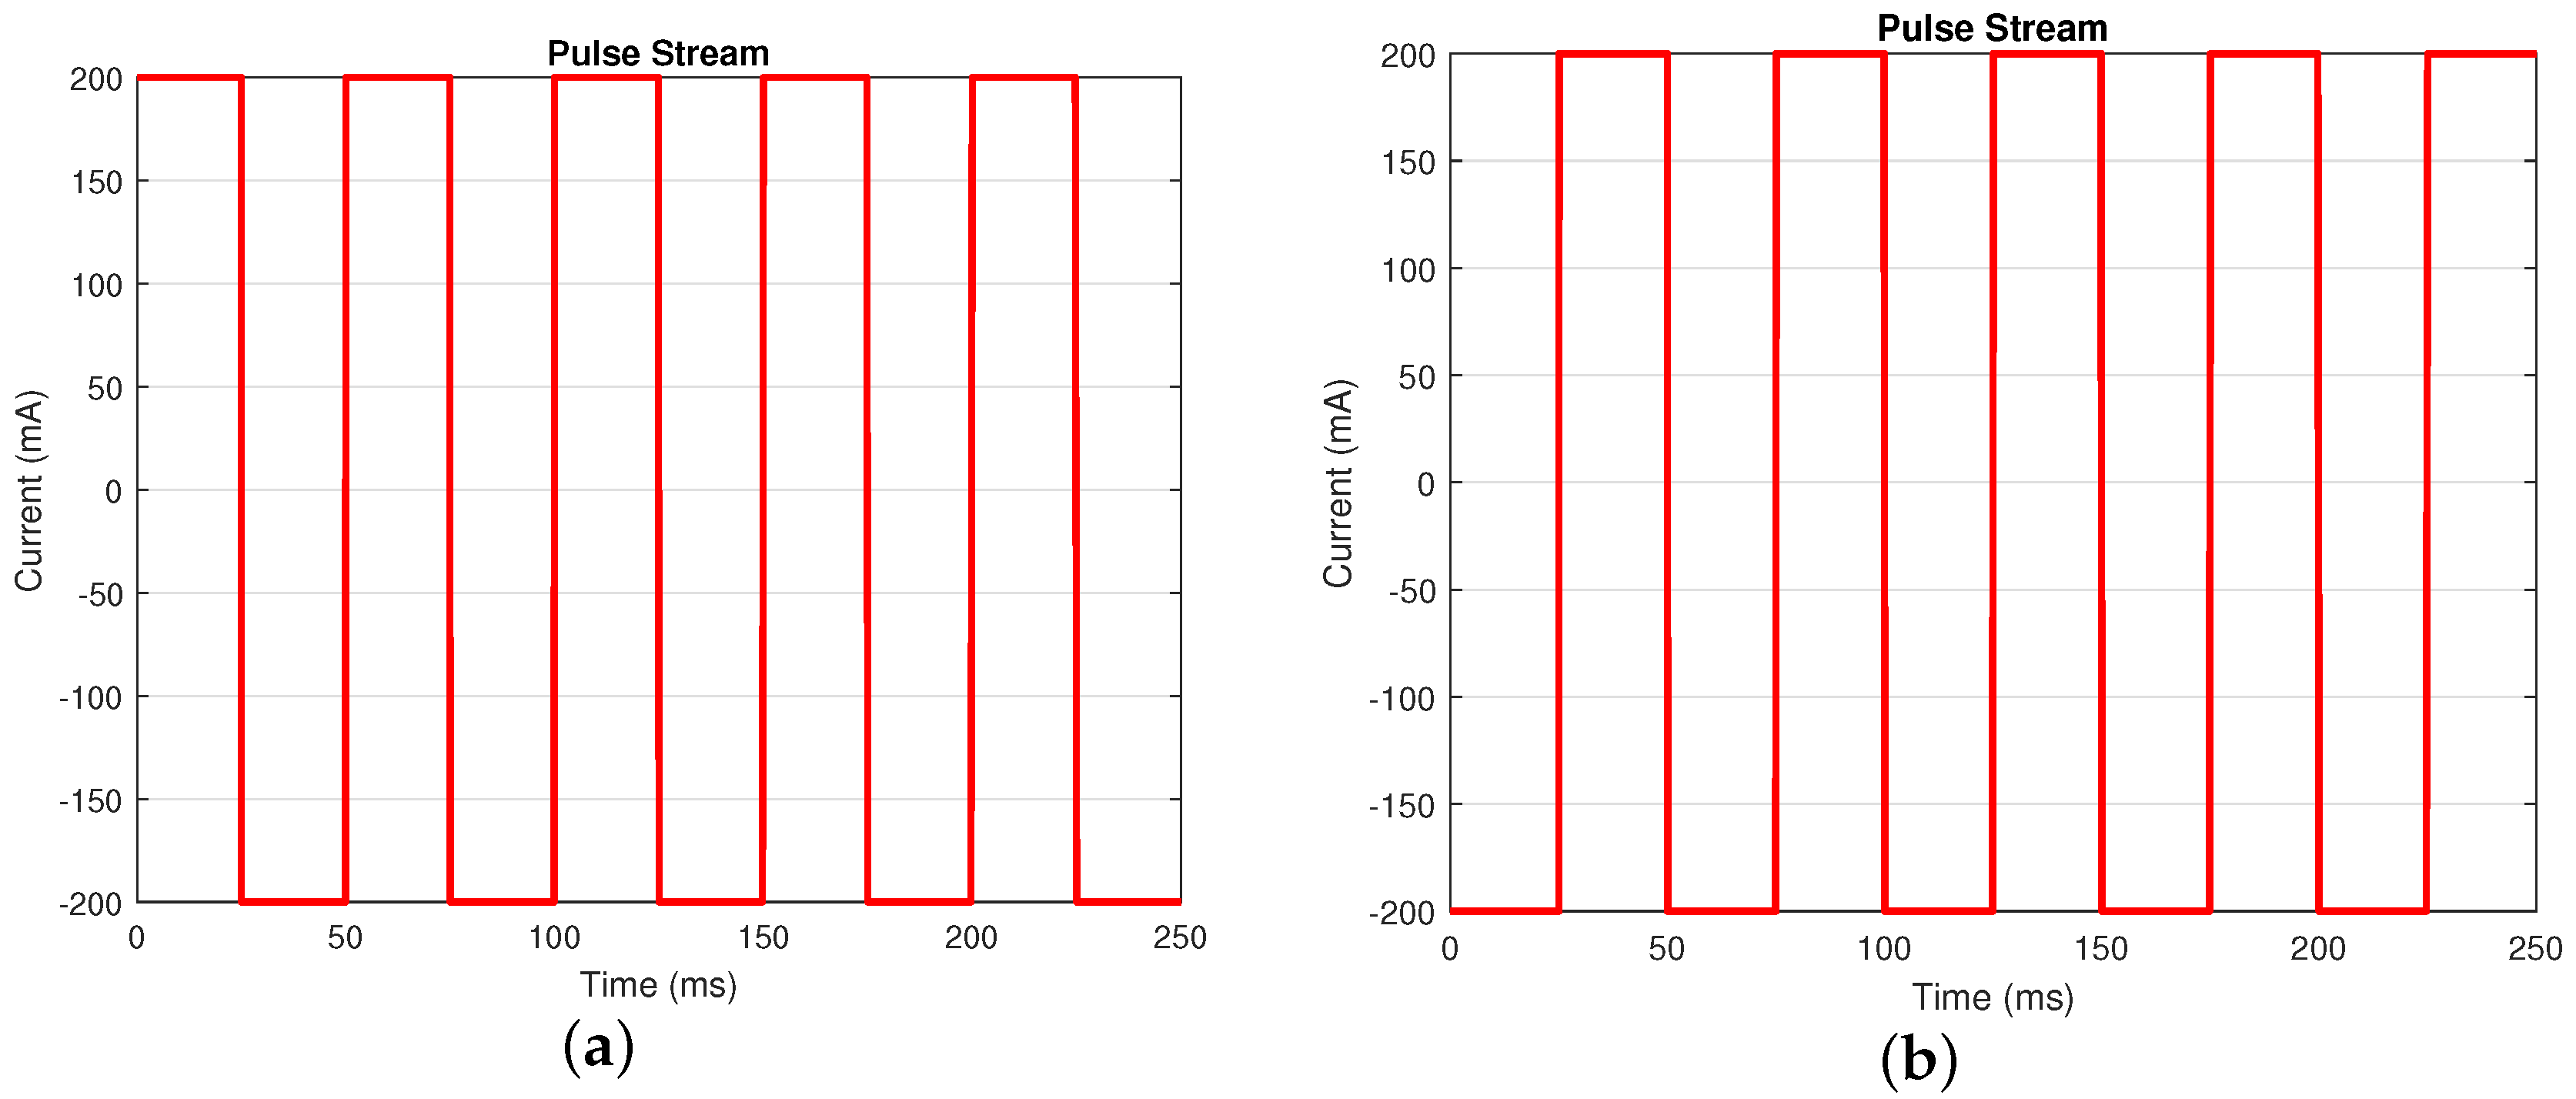
Time domain approaches are widely used to estimate the internal resistance of the battery. Due to requiring less time consumption for its implementation, this approach is more suitable for real-time applications [7,8,29]. One of the methods is to use the pulse stream current profile [28], as shown in Figure 3, to estimate the internal resistance of the battery.
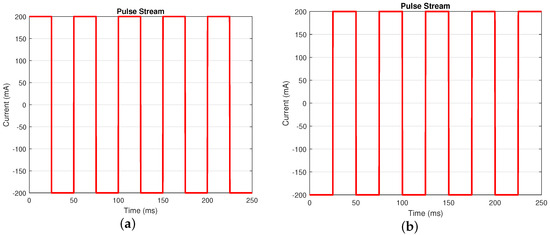
Figure 3.
Current profile for pulse stream test. Use pulse stream A when the battery’s SOC is between and ; use pulse stream B when the battery’s SOC is . (a) Pulse stream A (frequency: 20 Hz; Duty Cycle: 50%). (b) Pulse stream B (frequency: 20 Hz; Duty Cycle: 50%).
In Figure 4, considering a simple R-int model: when current is supplied to the battery, voltage across its terminal is given by
where E denotes the open circuit voltage, and is the internal resistance of the battery.

Figure 4.
R-int model of battery.
Considering the presence of noise in measured voltage , (46) can be rewritten as
Equation (48) can be written in the matrix form
E and can be estimated using the LS approach:
4. Experimental Procedure
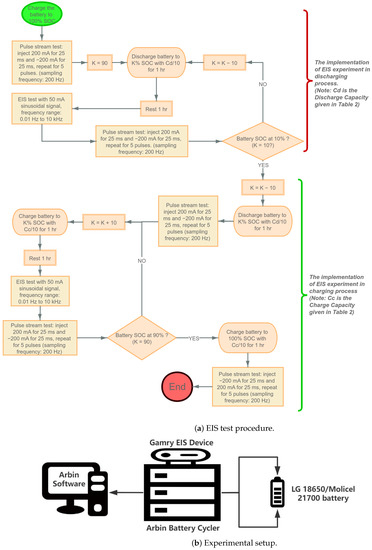
This section explains the experimental procedure for data collection. The specifications of LG and Molicel batteries are shown in Table 1; four LG batteries are labeled as LG01, LG02, LG03, and LG04; and four Molicel batteries are labeled as MCL01, MCL02, MCL03, and MCL04. The data are collected using the Arbin battery cycler (Model: LBT21084UC). The Arbin cycler has 16 channels that can operate in parallel; eight channels were used to collect data simultaneously at room temperature (23 C).

Table 1.
Specifications of LG and Molicel battery [32,33].
The EIS data are collected by the EIS device (Gamry interface 5000P). A Gamry EIS device and Arbin battery cycler are operated using the software named Mits Pro provided by Arbin. The voltage measurement error of the Gamry EIS device, as specified, is 0.2 mV [31].
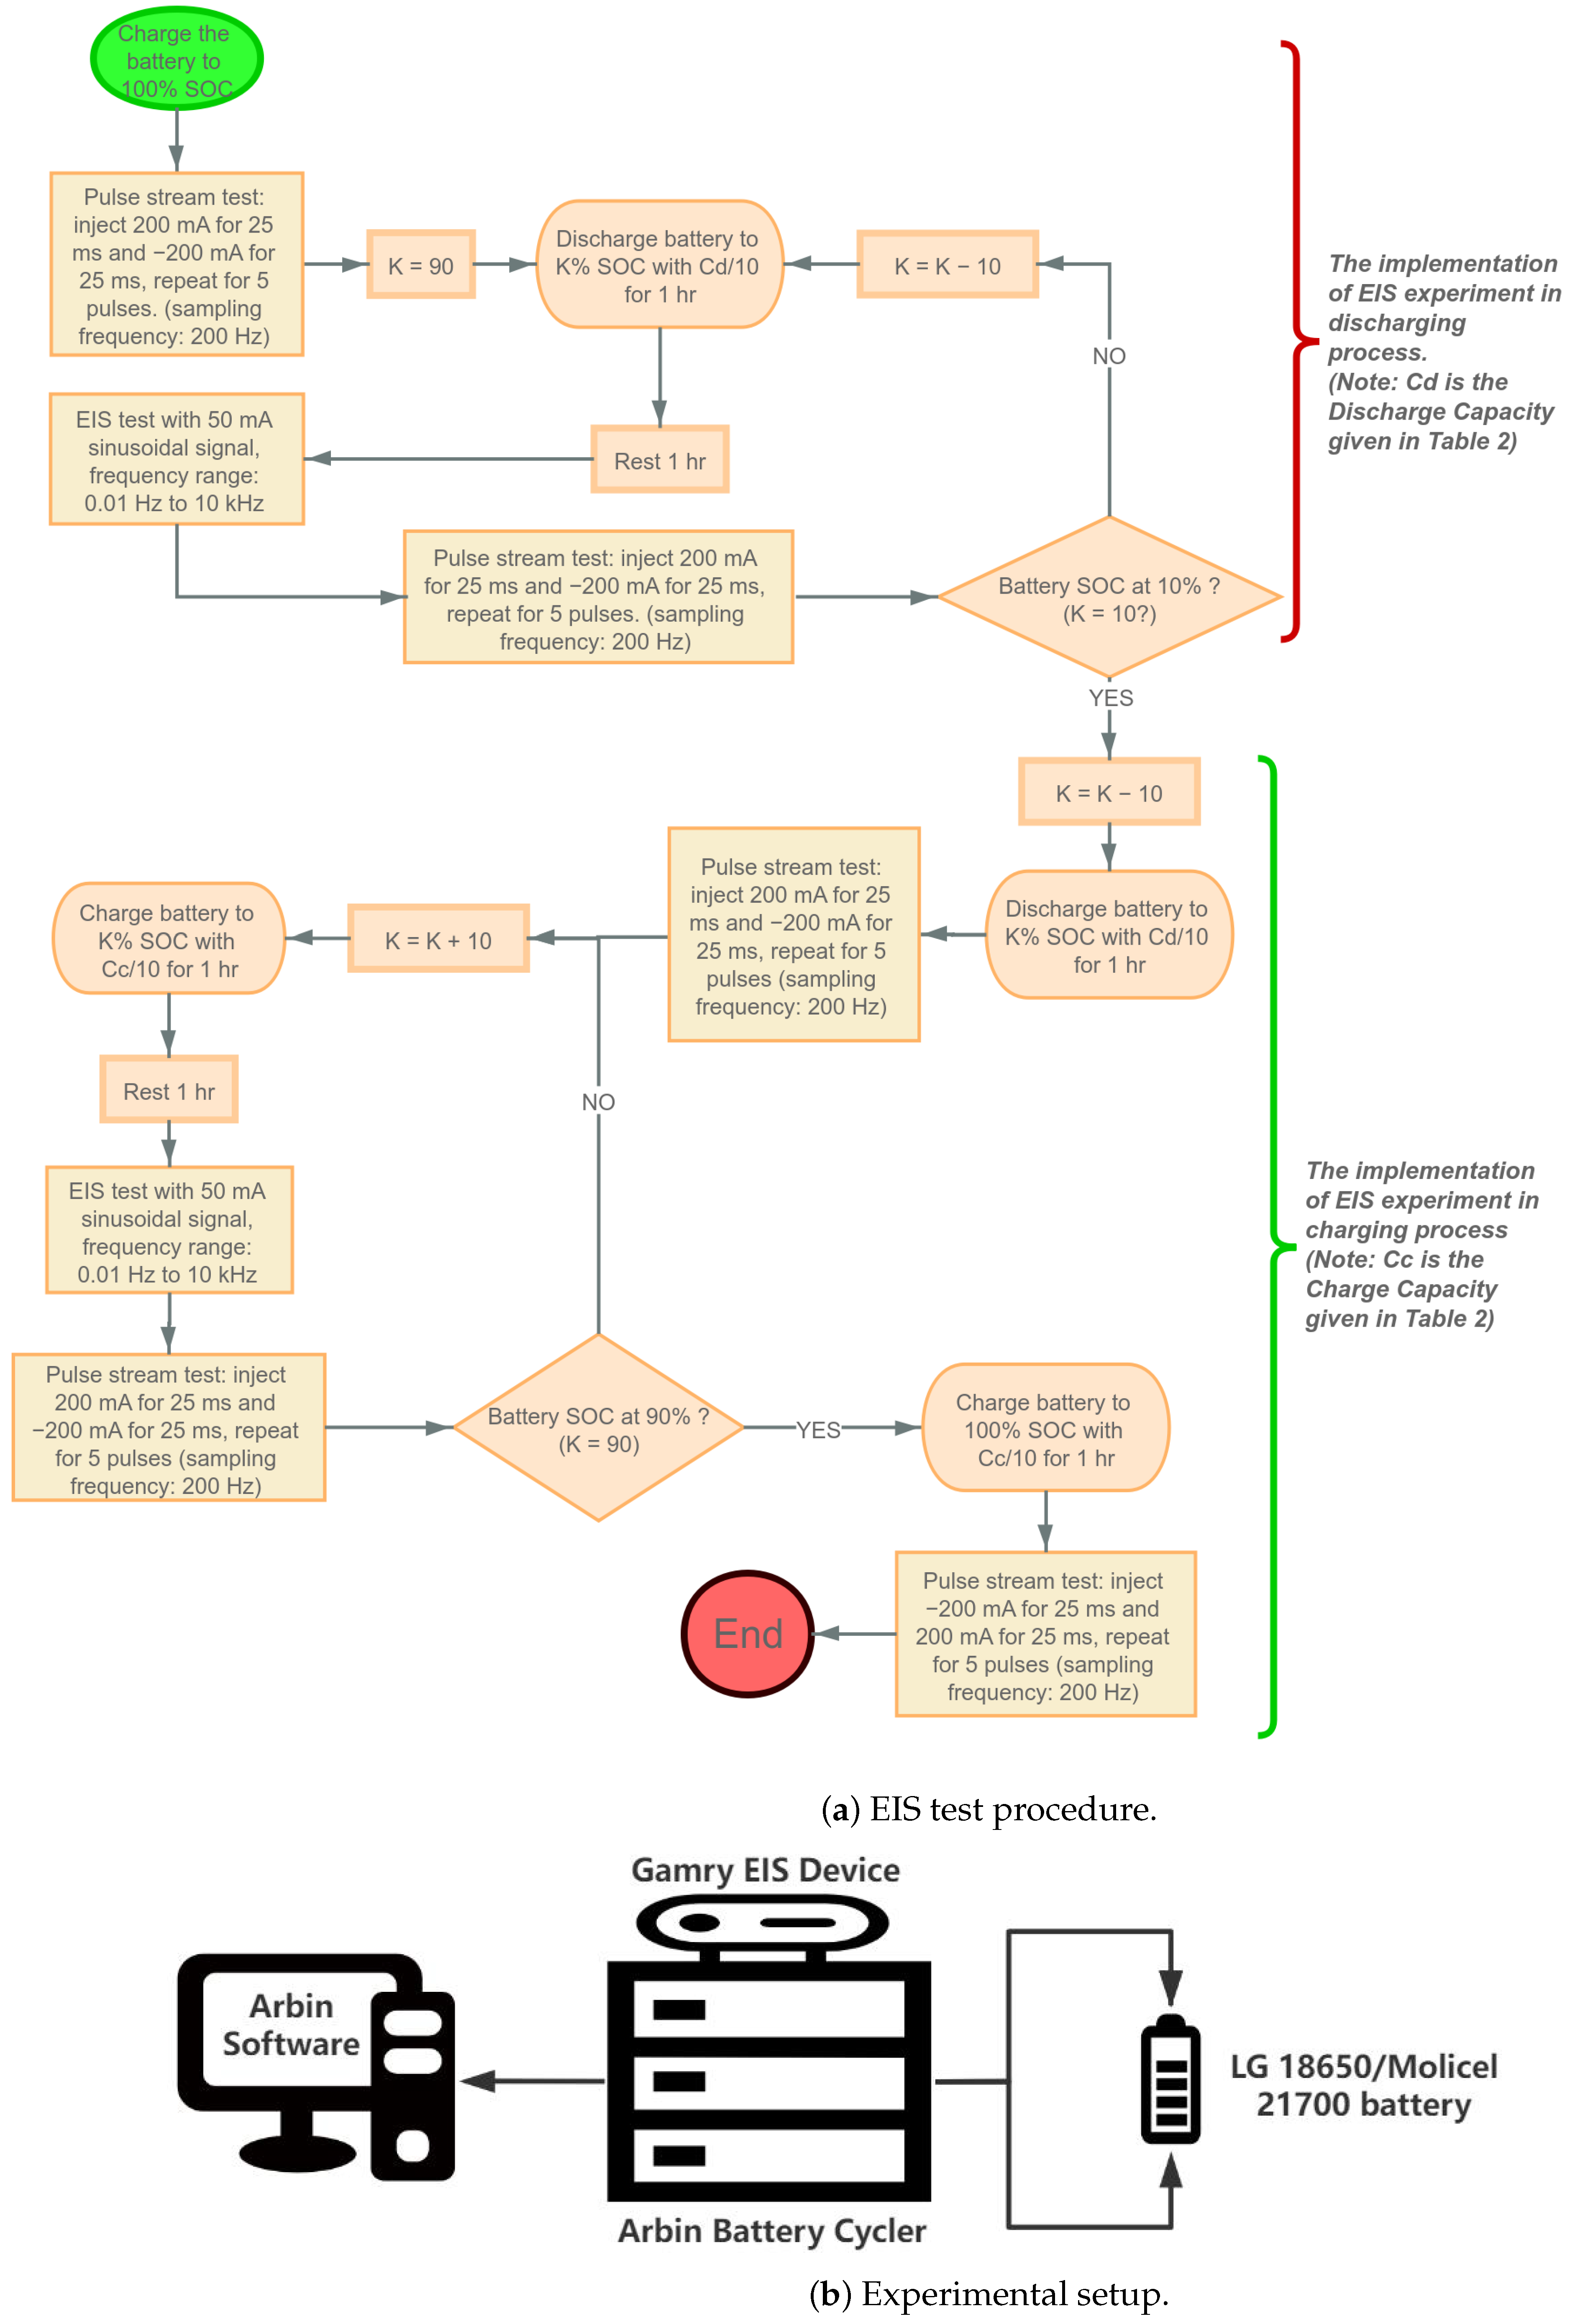
All experiments presented in this paper started with a fully charged battery (SOC = 100%) and the SOC is reduced by 10% at a time until the SOC reached 0%; after that, the SOC is increased by 10% at a time until the SOC returned to 100%. In this paper, discharging the battery with A constant current or charging the battery with A constant current for 1 h will decrease/increase the SOC by ; here, is the discharge capacity and is the charge capacity of the battery, which are given in Table 2.

Table 2.
Discharge and charge capacity of different batteries. Models LG01/02/03/04 use the LG INR 18650 MJ1 battery, models MCL01/02/03/04 use the Molicel INR 21700-P42A battery.
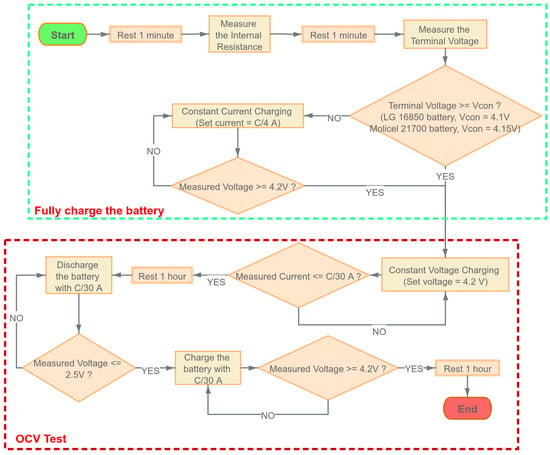
At each of these SOC levels except for and , an EIS experiment is performed; additionally, a time-domain experiment is also performed. For the time-domain experiment, the current profile detailed in Figure 3 is applied right after the EIS experiment is conducted at the corresponding SOC. The detailed procedure is shown as follows:
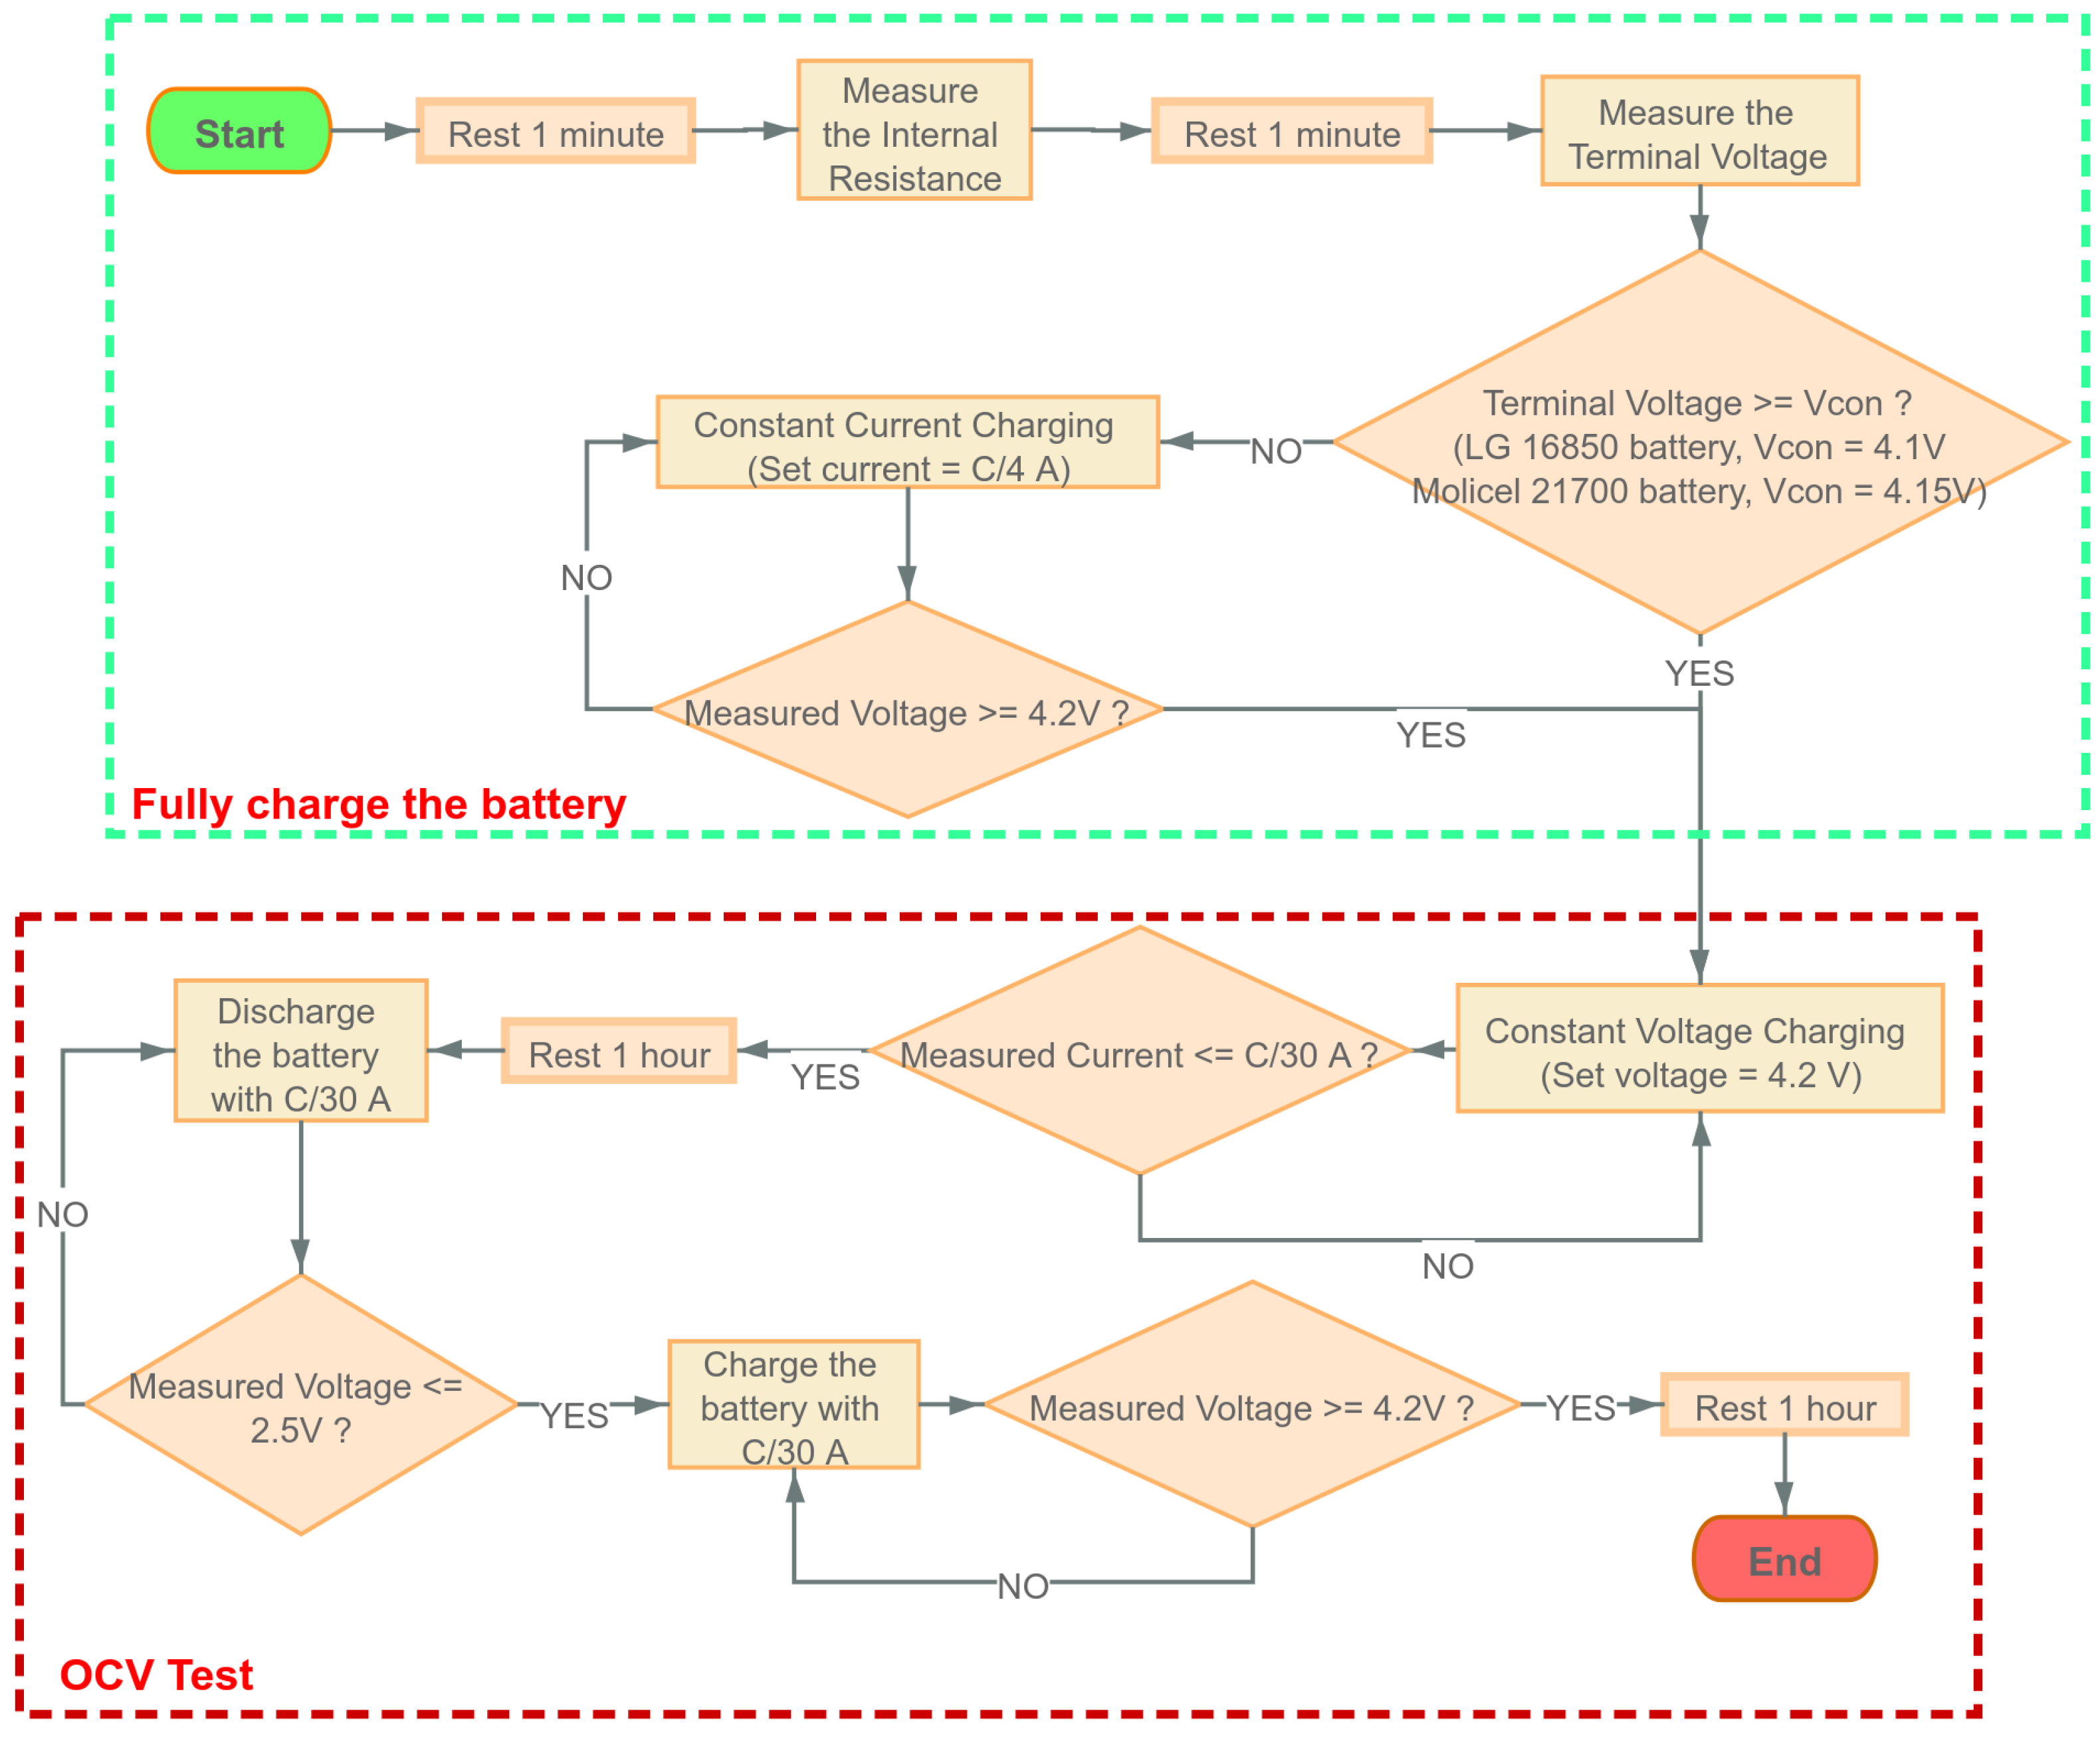
- Find the cut-off voltageTo ensure the maximum current in the CC-CV charging process below the safety limit, we need to set a conditional voltage, which should be greater than the cut-off voltage to decide when to start the CC or CV charging; the cut-off voltage can be written as:From Table 1, the internal resistance of the LG battery is less than 40 m, and the internal resistance of the Molicel battery is less than 15 m. The maximum current = 4.2 A, and the maximum voltage = 4.2 V. Therefore, in the OCV test, we set the conditional voltage = 4.1 V for LG batteries and = 4.15 V for Molicel batteries.
- OCV Test
5. Results
In this section, the results obtained from the experiment are shown and discussed.
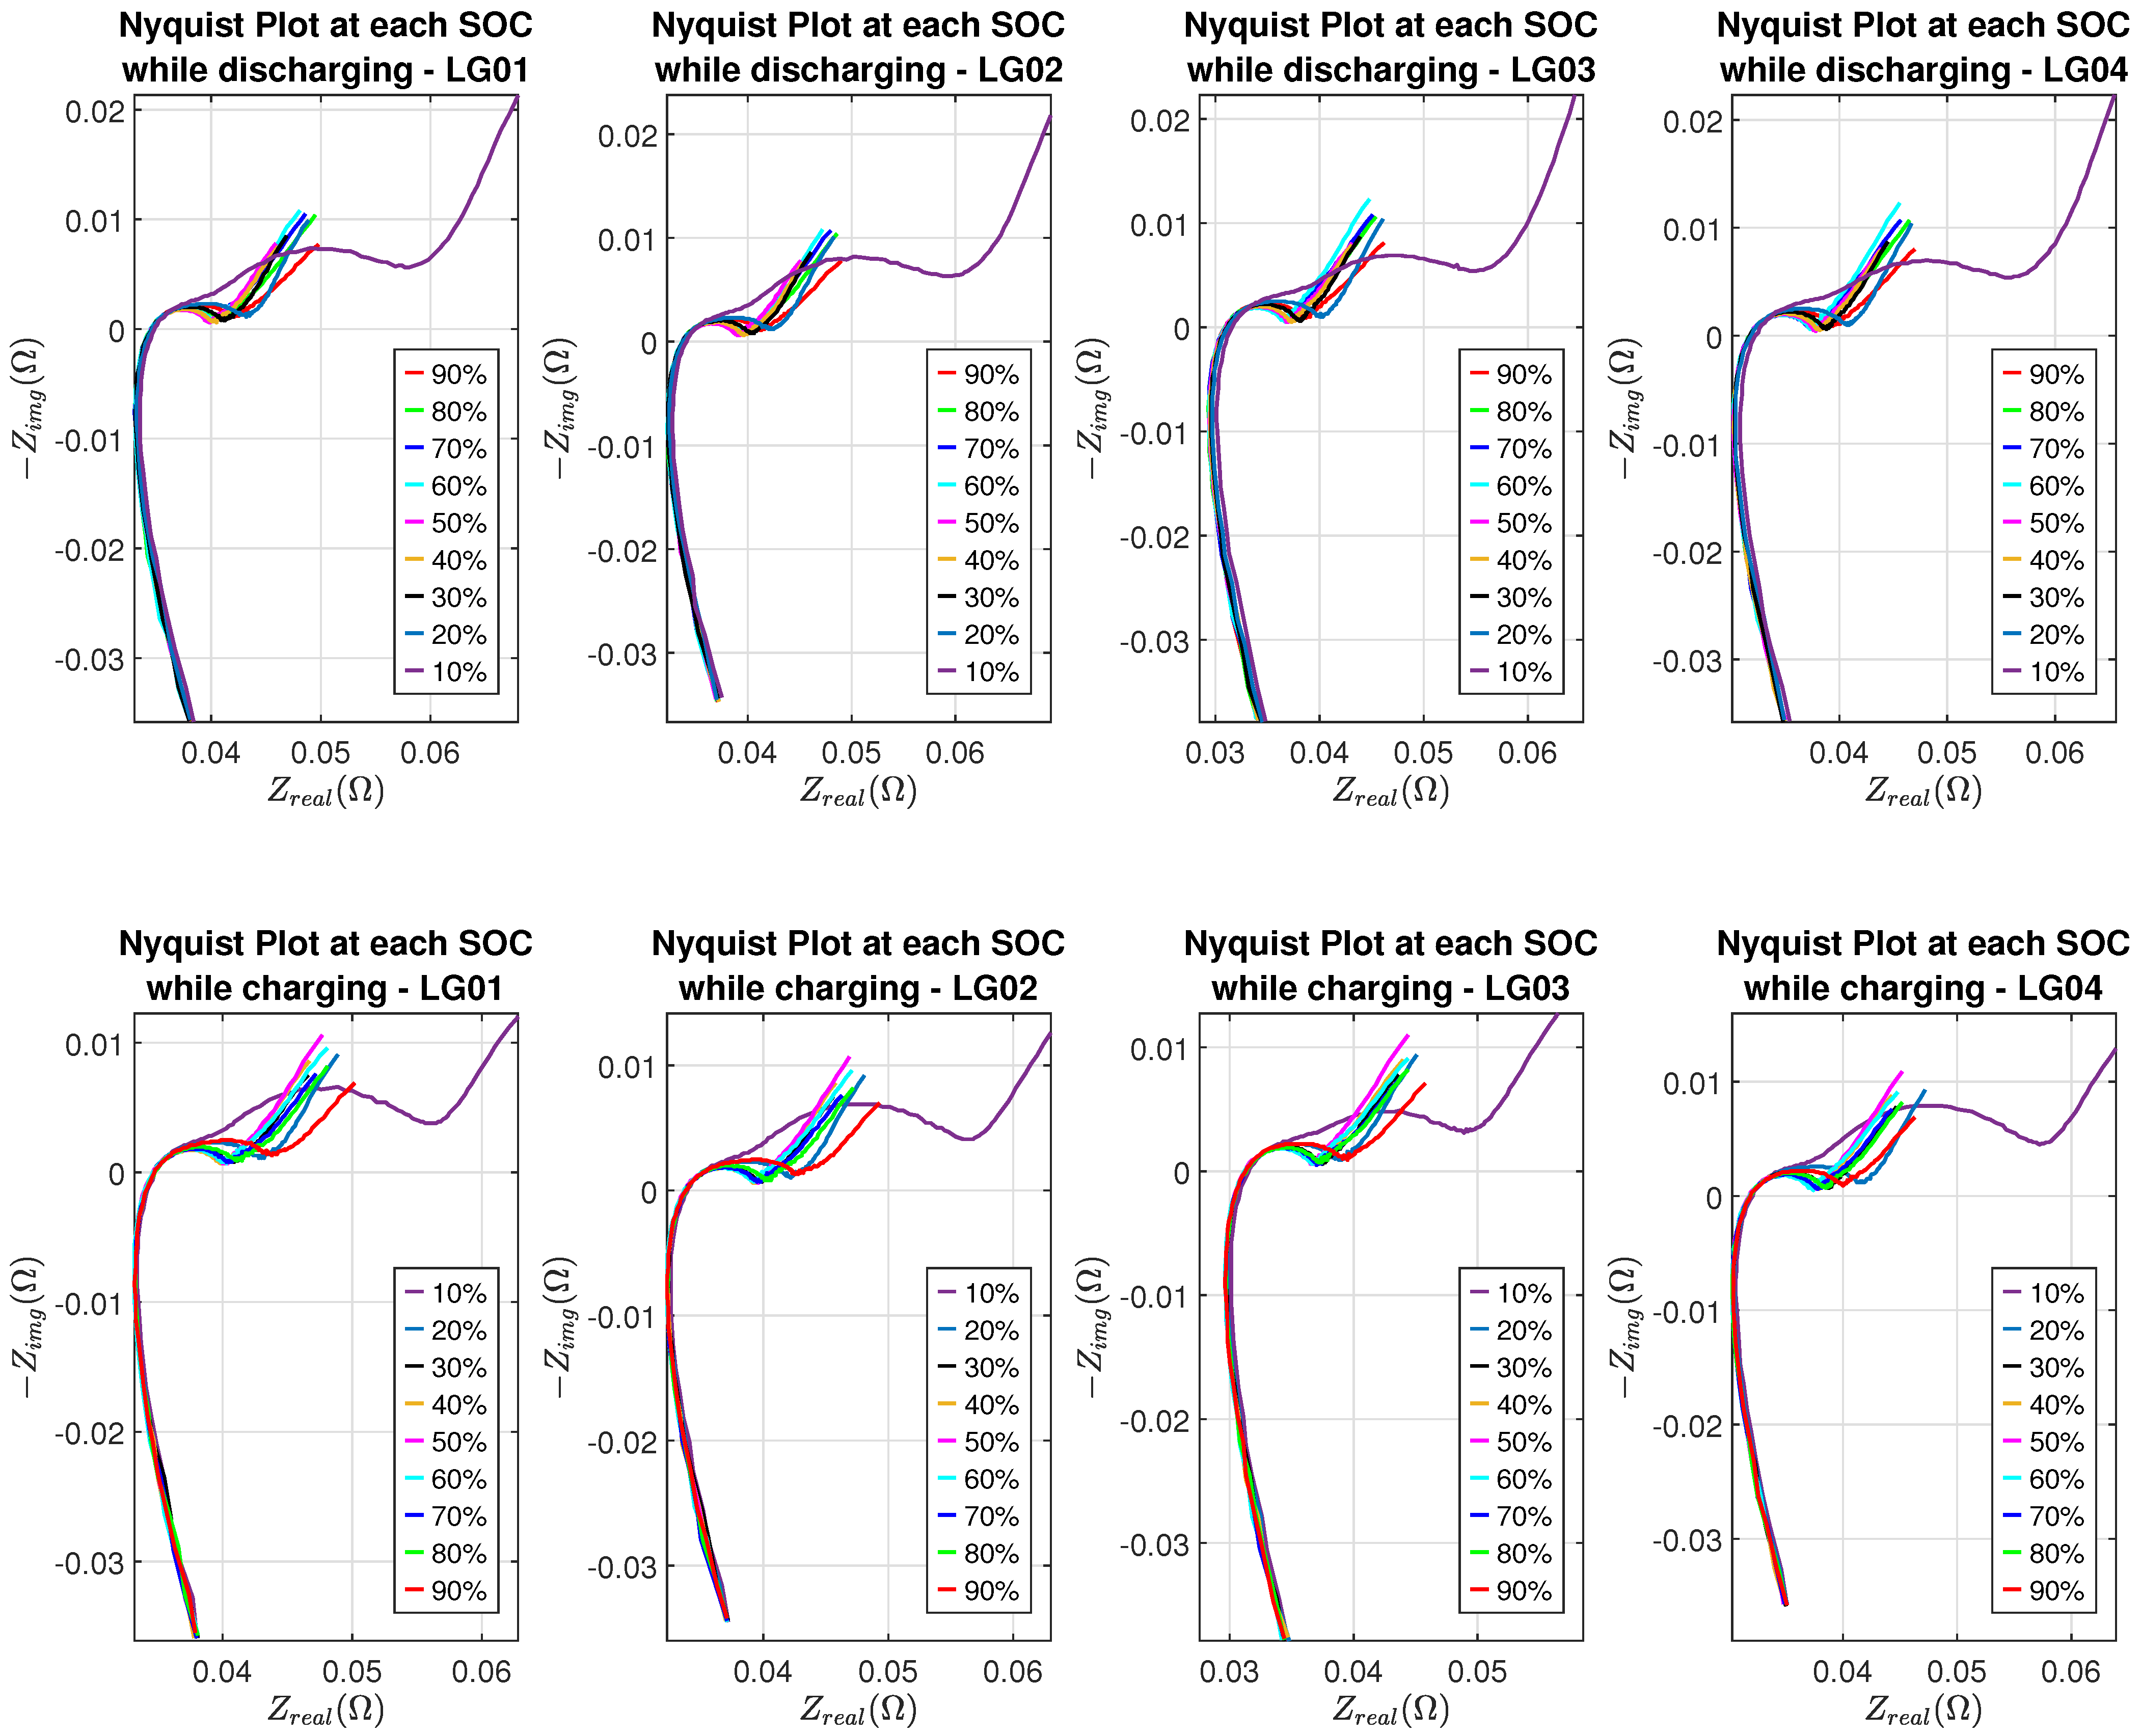
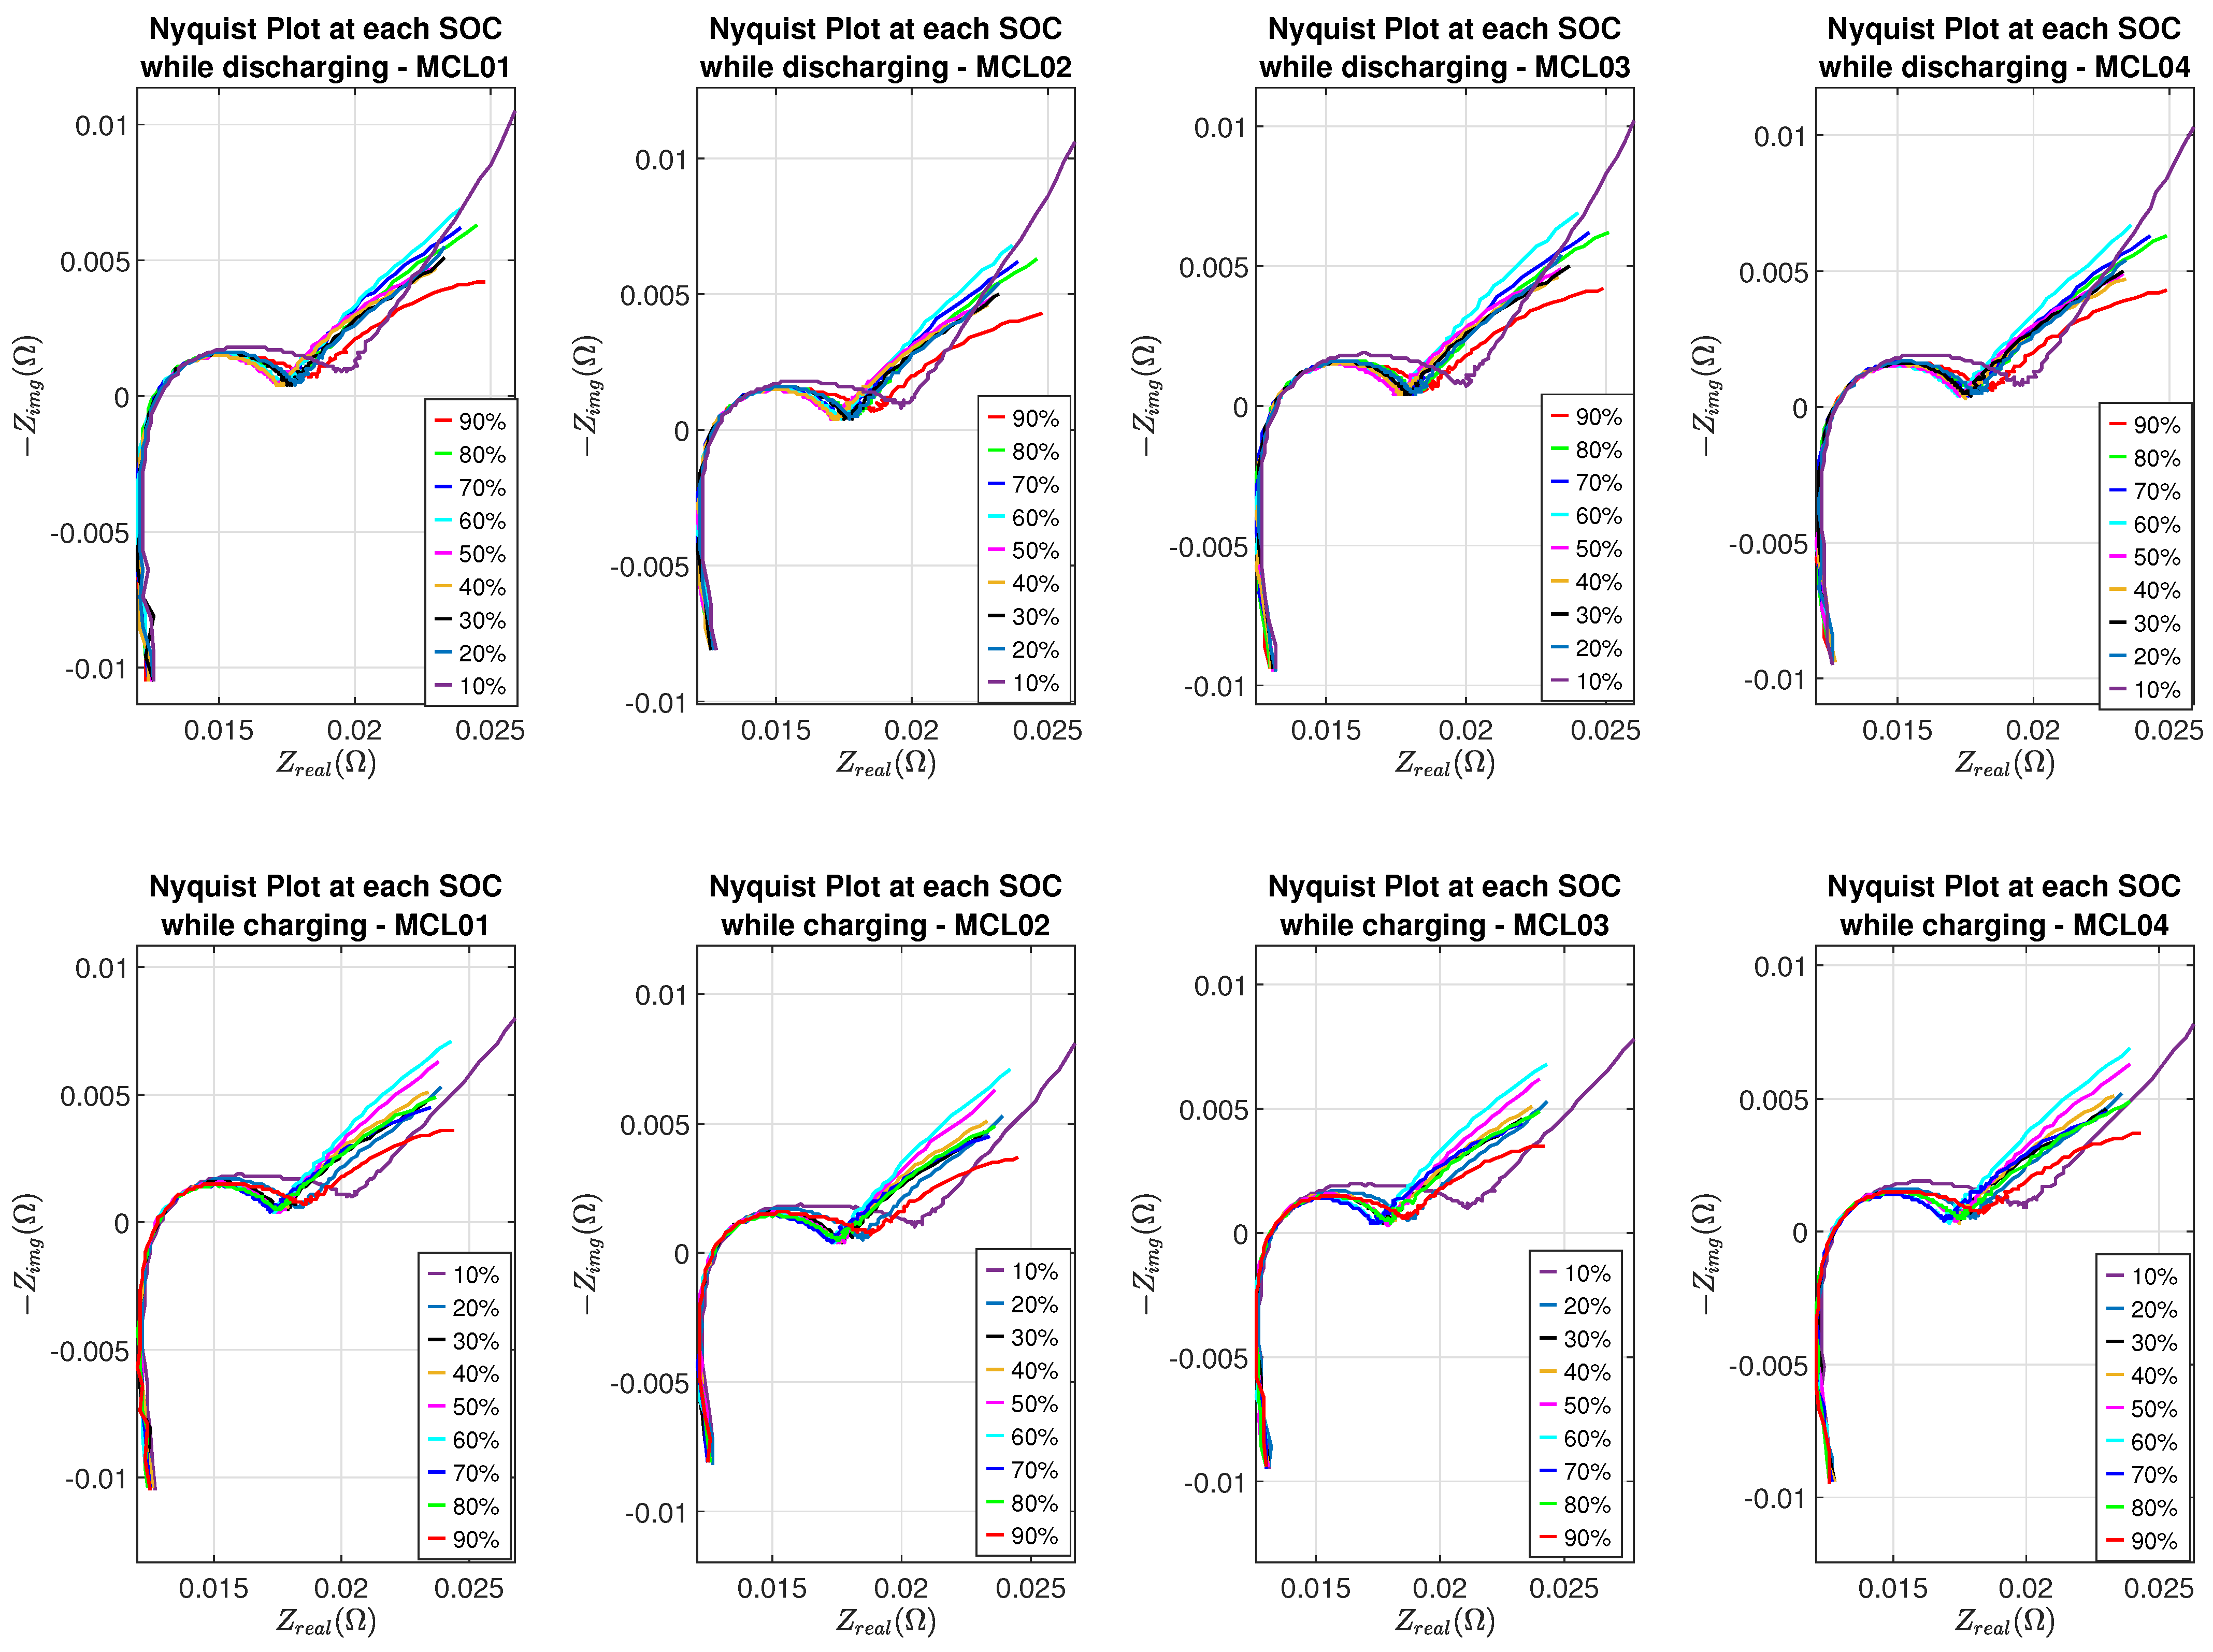
Nyquist plots of eight batteries at different SOC levels are shown in Figure 7 and Figure 8, where the SEI effect can be seen clearly in the Nyquist plot corresponding to 10% SOC while batteries are in the discharging or charging process.
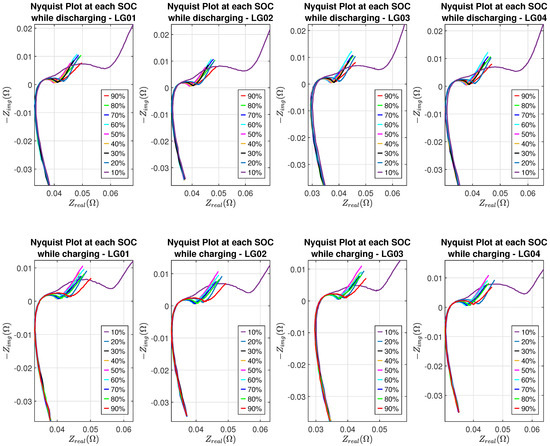
Figure 7.
Nyquist plots of LG batteries.
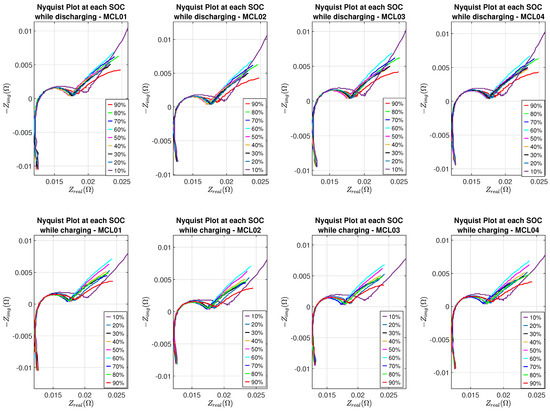
Figure 8.
Nyquist plots of Molicel batteries.
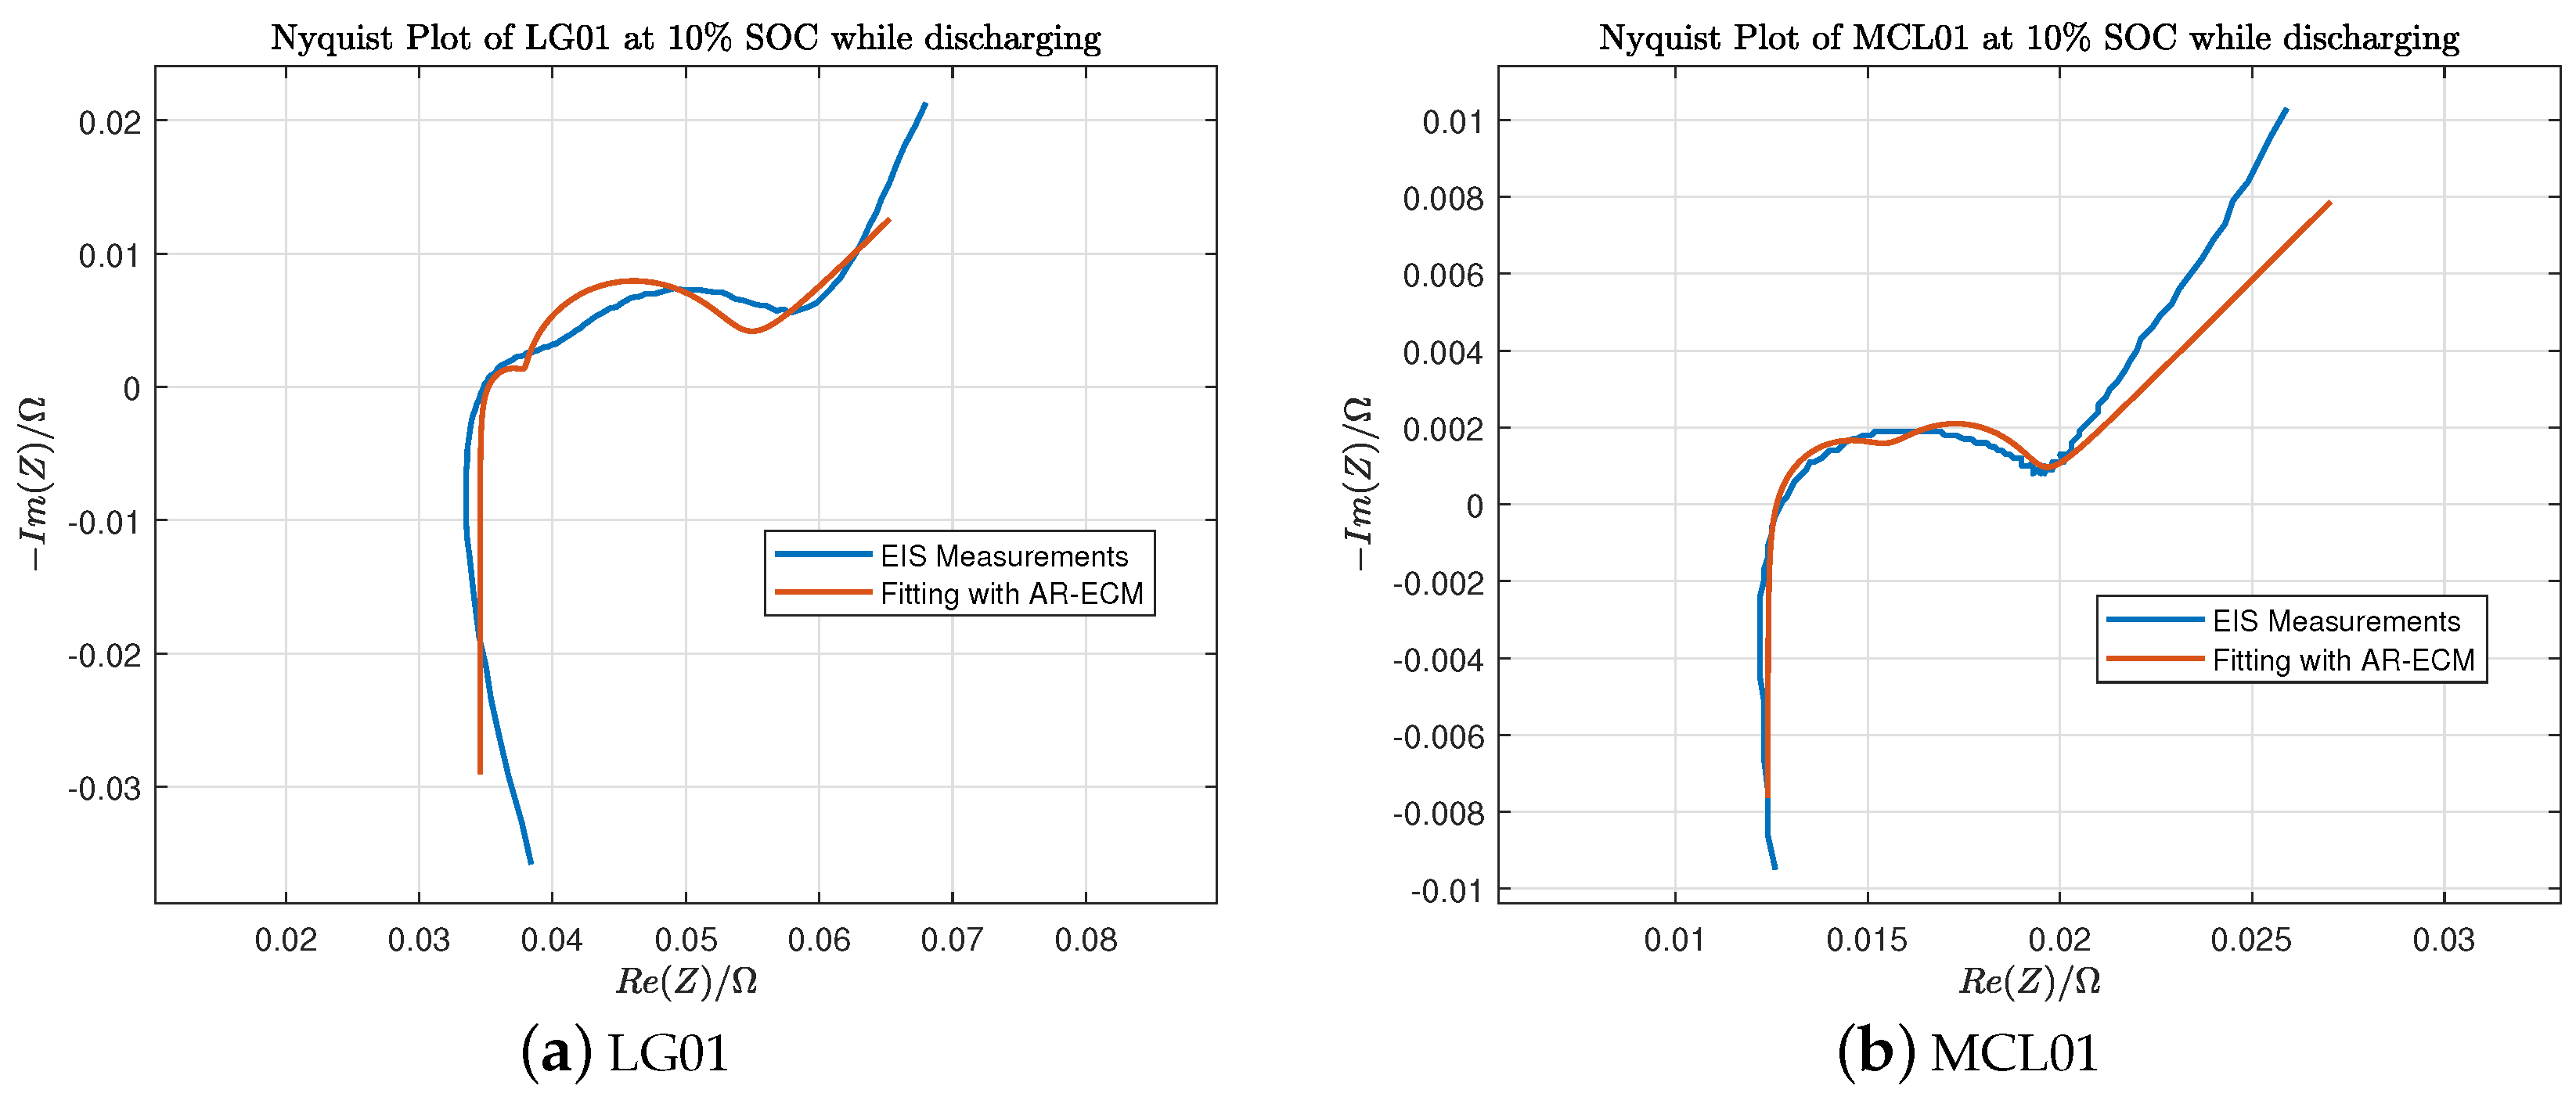
In Table 3, Table 4, Table 5 and Table 6, the estimated ECM parameters for LG and Molicel batteries are obtained using the algorithms explained in Section 2. We can observe that the internal resistance measured by Arbin is quite close to the ohmic resistance . Furthermore, Figure 9a shows the fitted Nyquist plot of LG01 battery at SOC while discharging, and Figure 9b shows the fitted Nyquist plot of MCL01 battery at SOC while discharging.

Table 3.
Estimated ECM parameters of LG batteries at each SOC while discharging. (Note: is the internal resistance measured by Arbin.)

Table 4.
Estimated ECM parameters of LG batteries at each SOC while charging. (Note: is the internal resistance measured by Arbin.)

Table 5.
Estimated ECM parameters of Molicel batteries at each SOC while discharging. (Note: is the internal resistance measured by Arbin.)

Table 6.
Estimated ECM parameters of Molicel batteries at each SOC while charging. (Note: is the internal resistance measured by Arbin.)
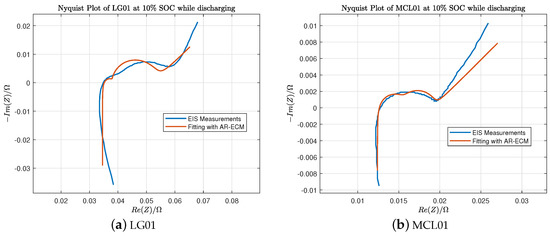
Figure 9.
EIS fitting of LG01 and MCL01 batteries at SOC while discharging.
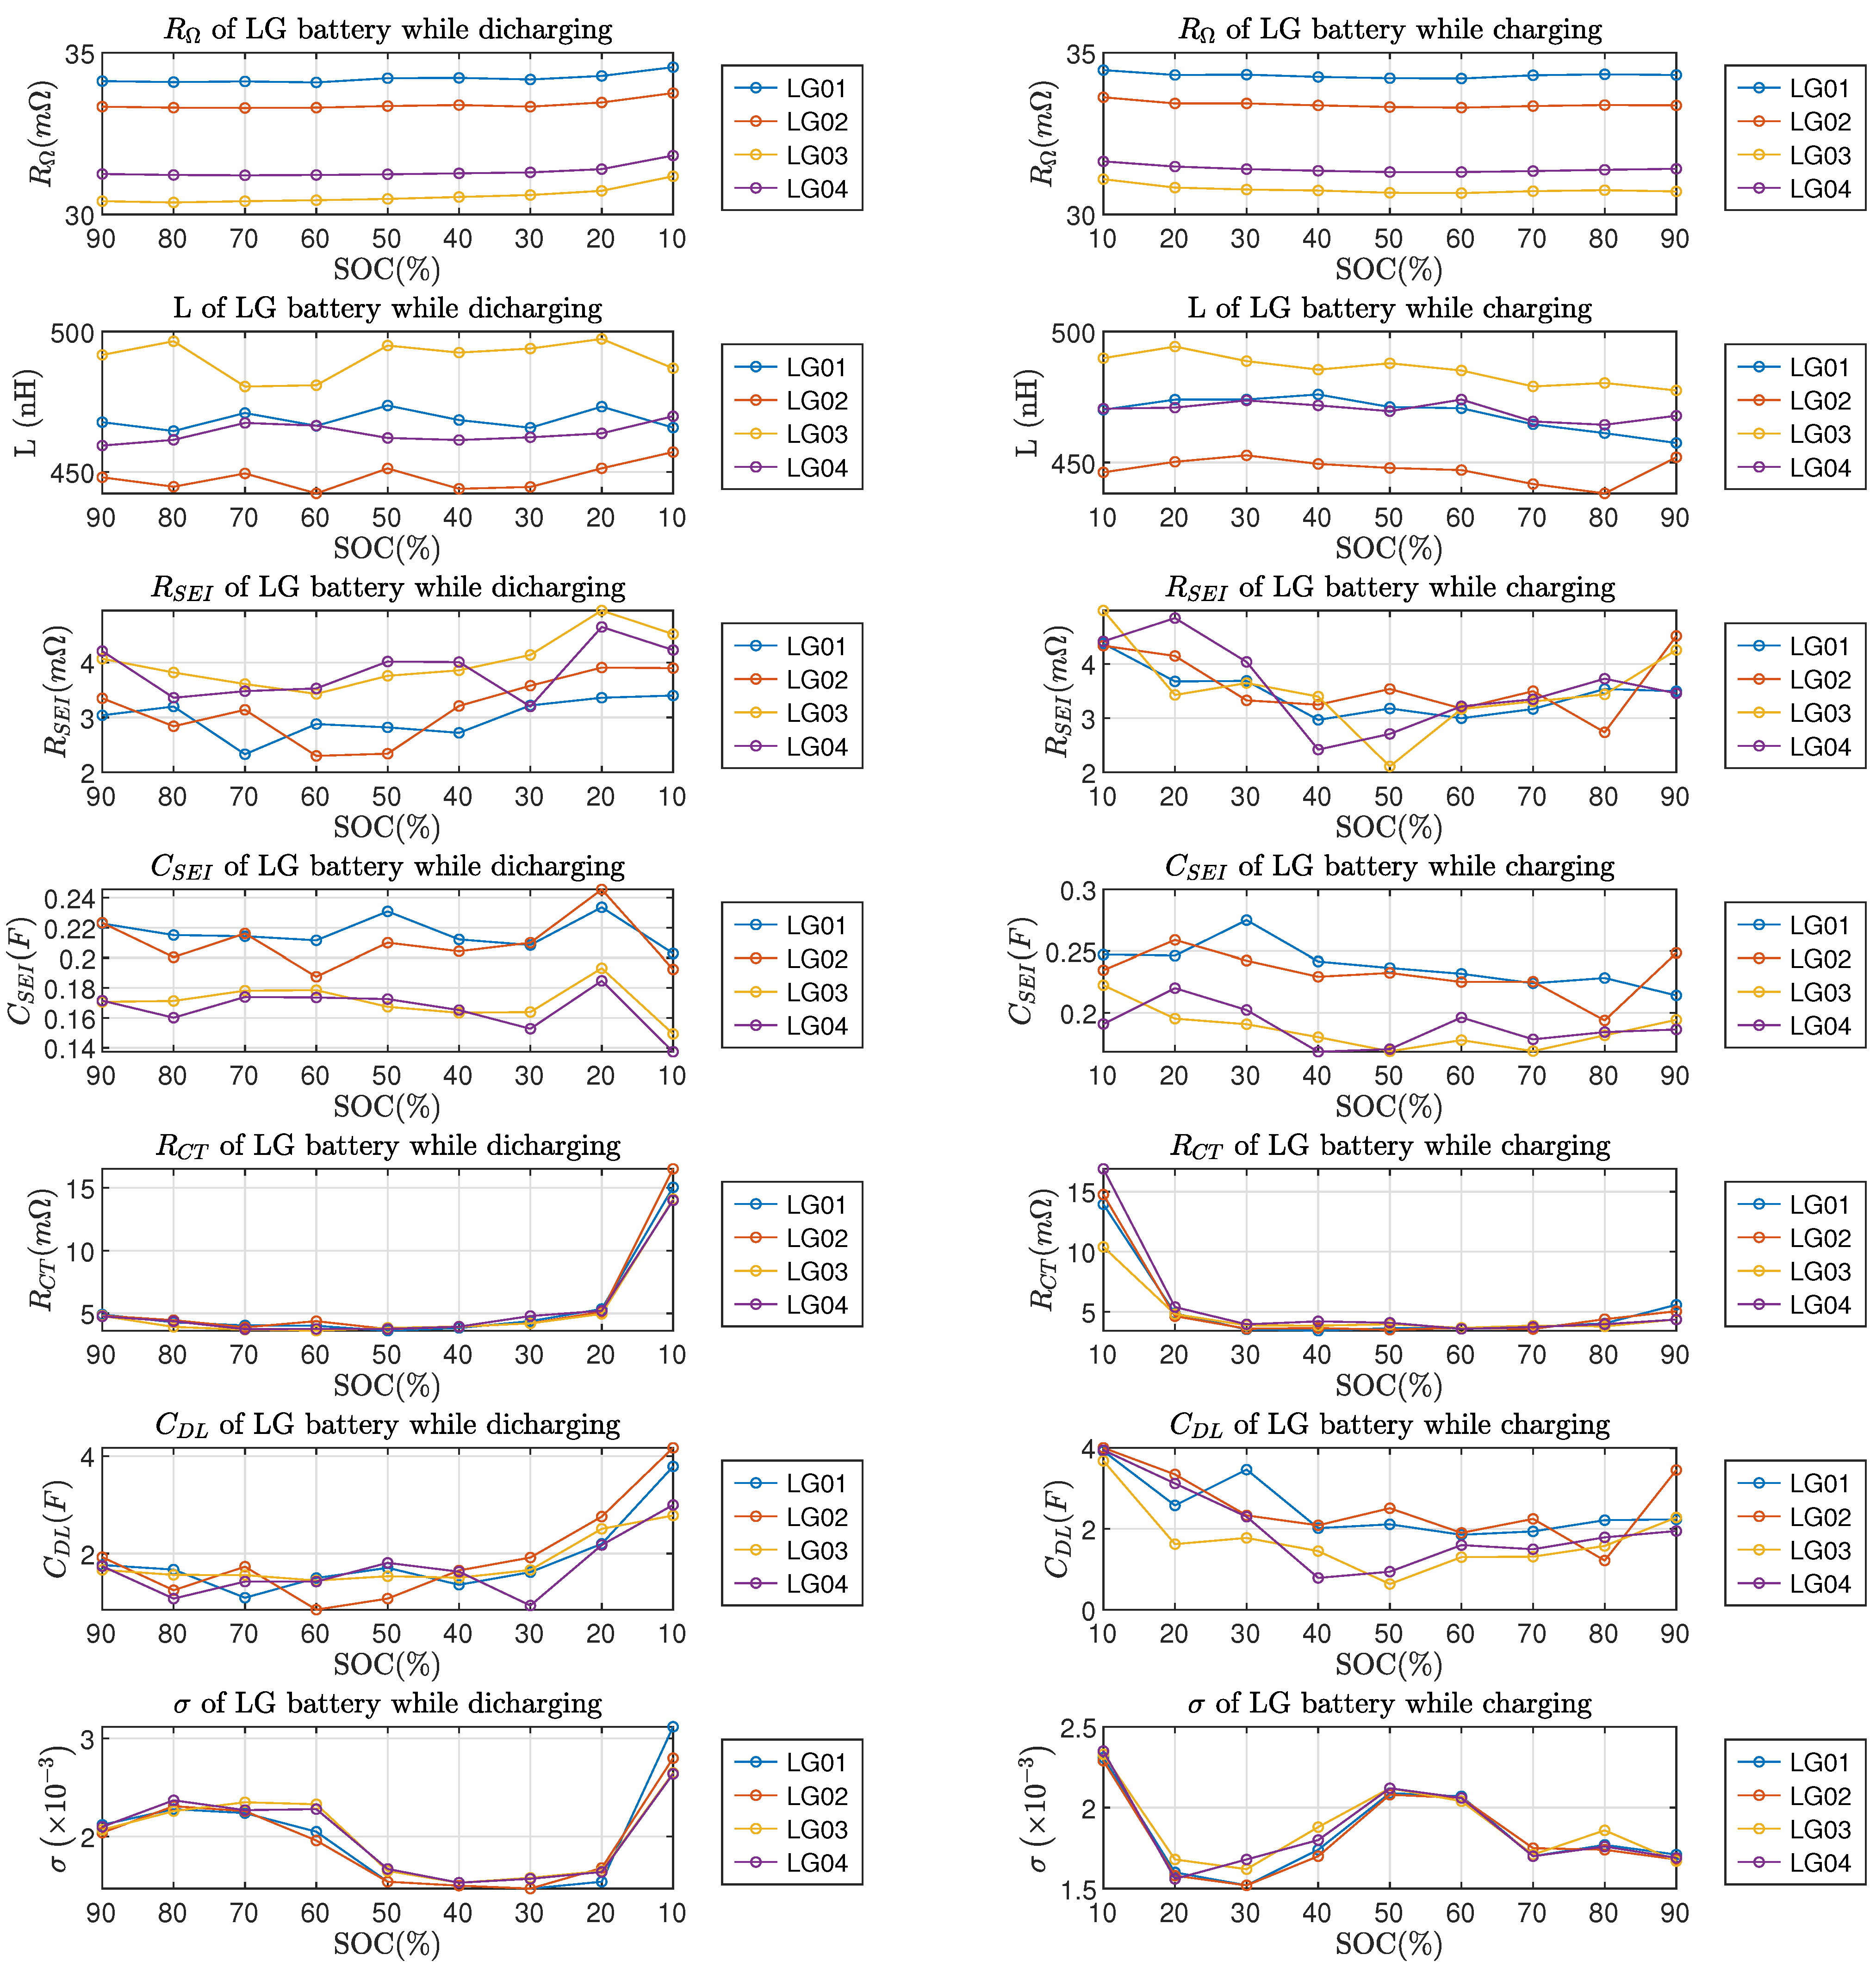
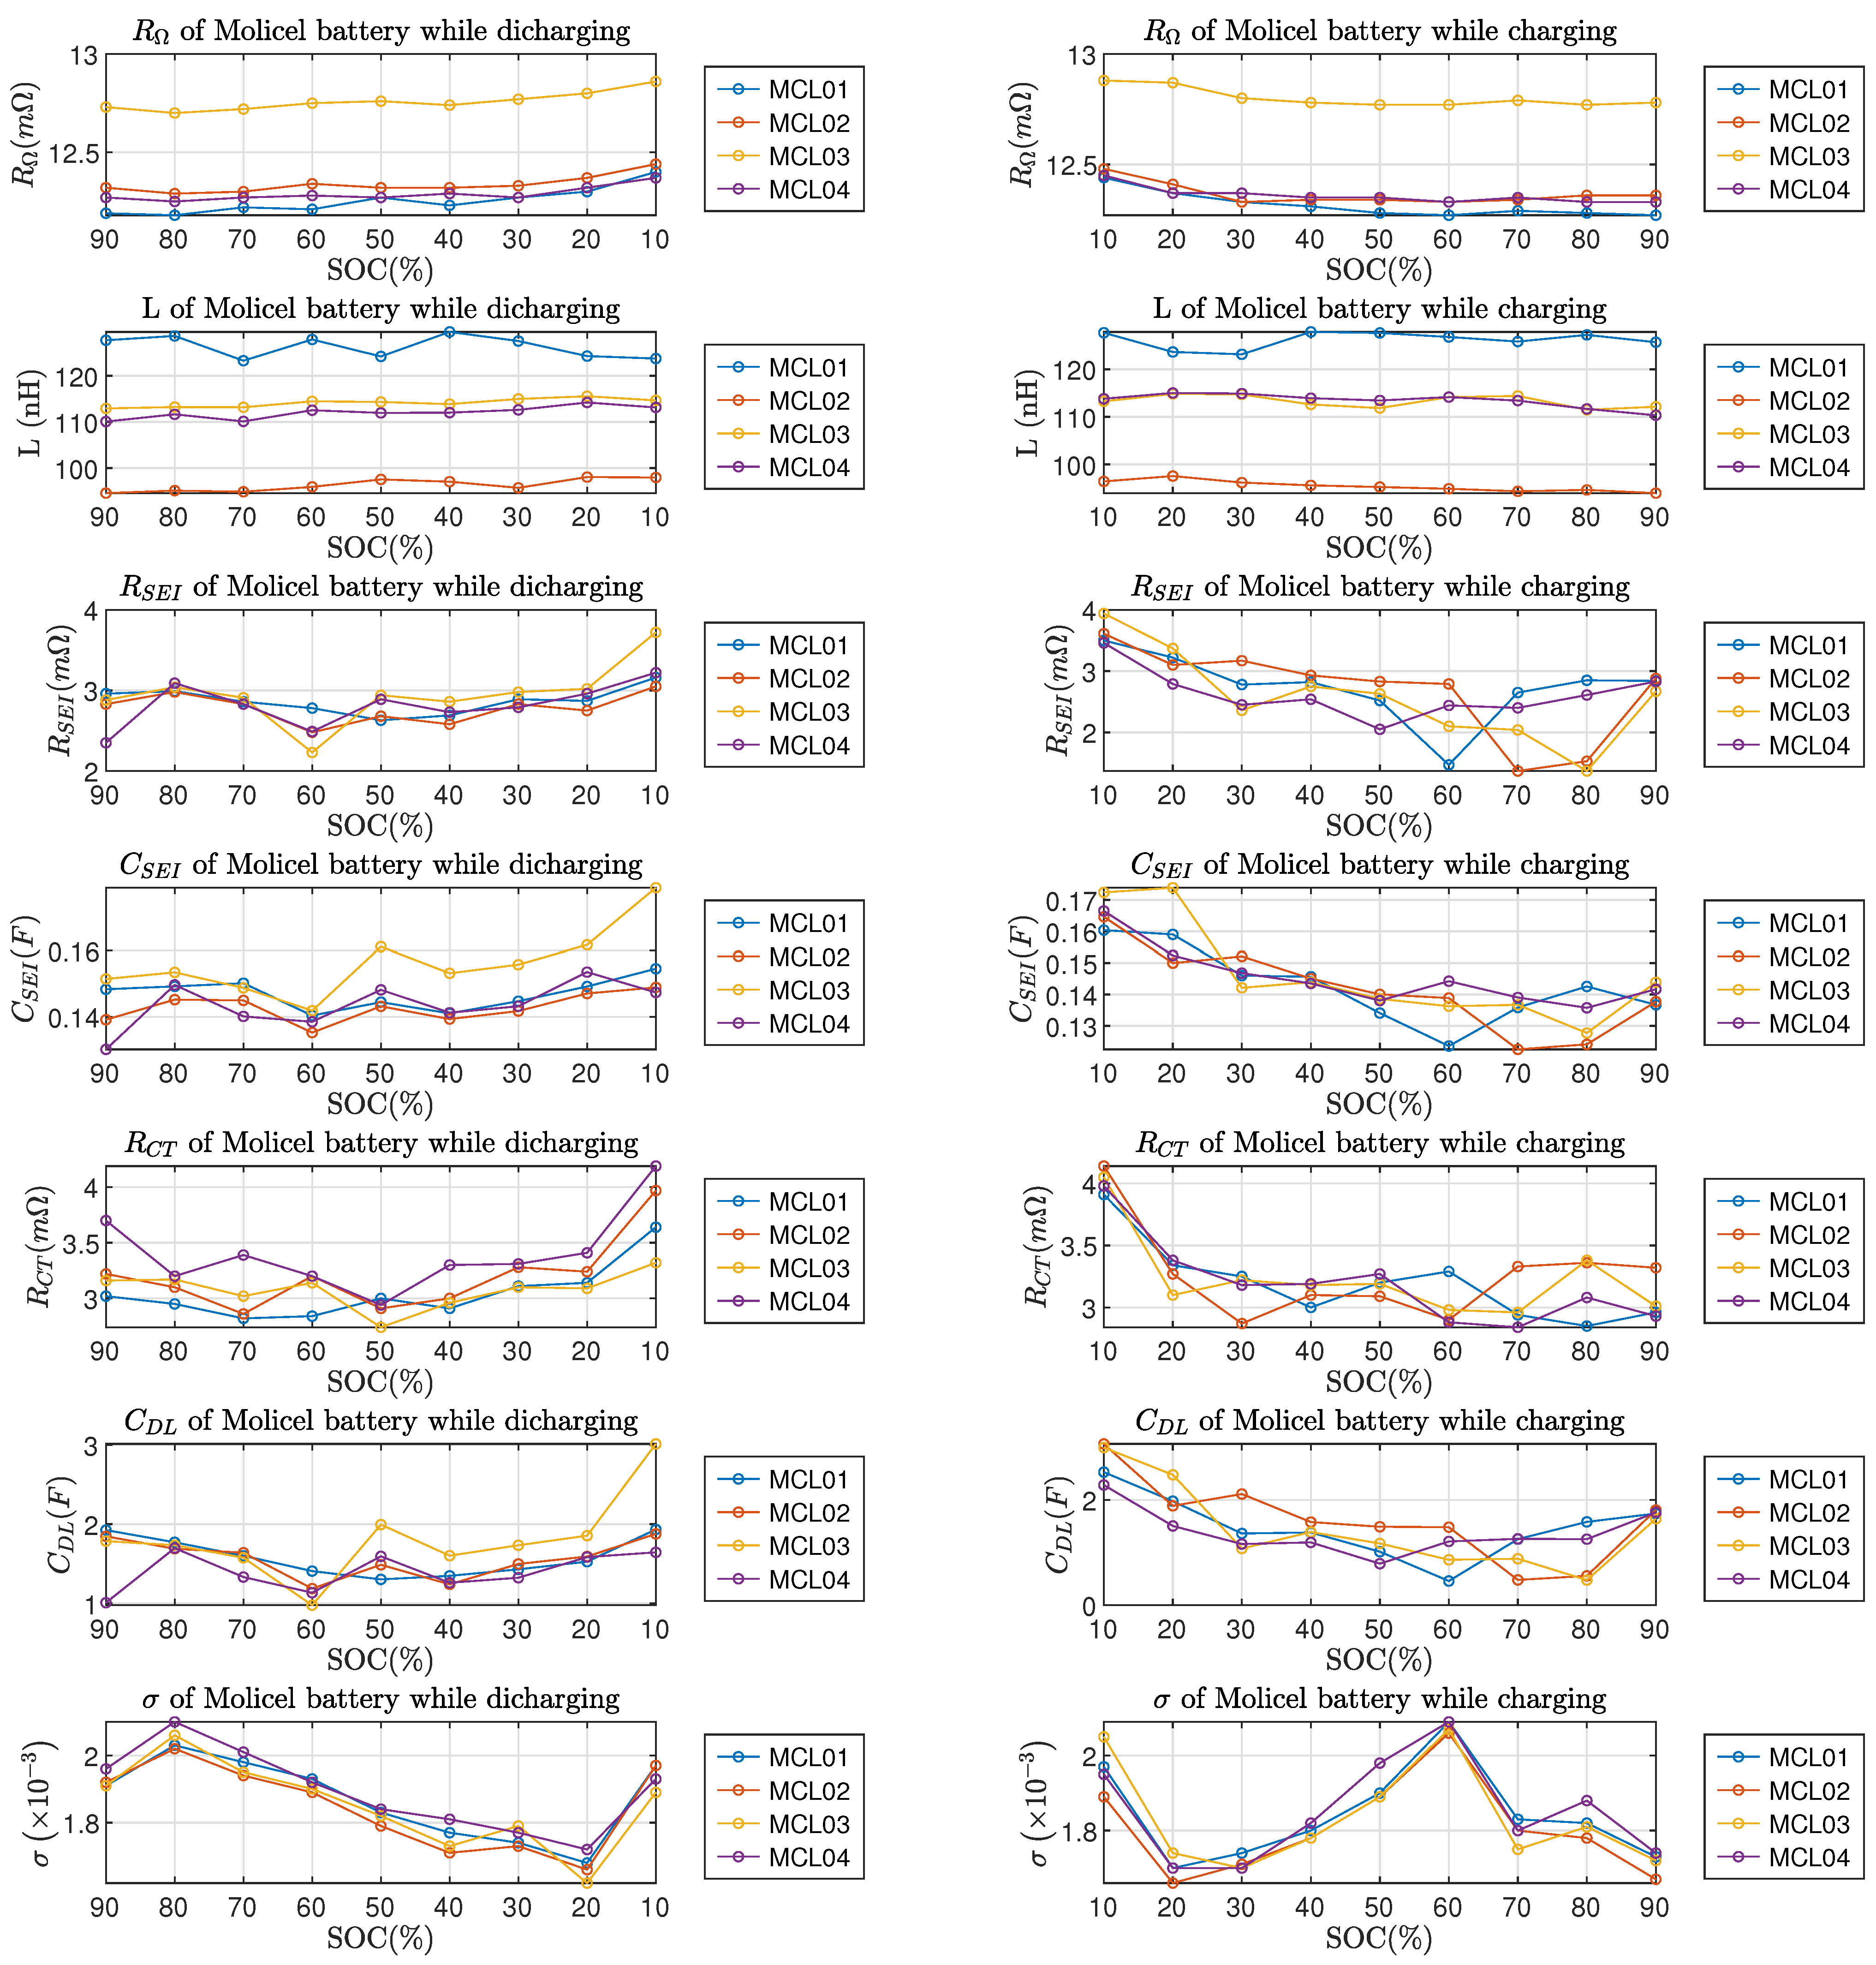
From Figure 10 and Figure 11, it can be observed that the ohmic resistance , charge transfer resistance and double-layer capacitance all reached the highest value at SOC; this phenomenon applies to both LG and Molicel batteries. The Warburg coefficient of LG batteries reached the highest value at SOC; as for Molicel batteries, the highest occured at while discharging and while charging. In addition, no regularity can be found in LG and Molicel batteries with respect to the variations of L, and at the SOC level; also, the variations of all ECM parameters between and SOC are not significant in general.
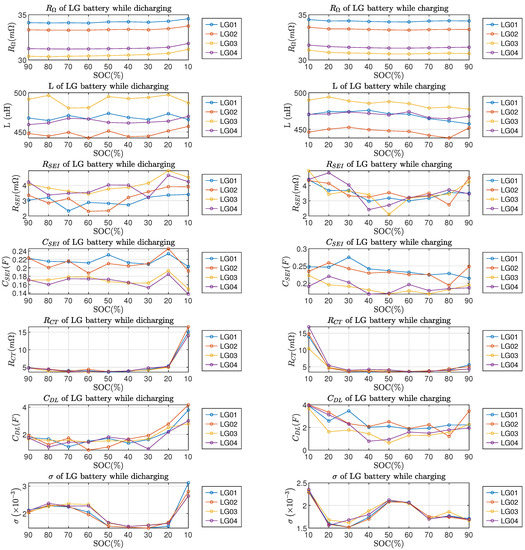
Figure 10.
ECM parameters of LG batteries vs. SOC. Left column is for discharging and right column is for charging.
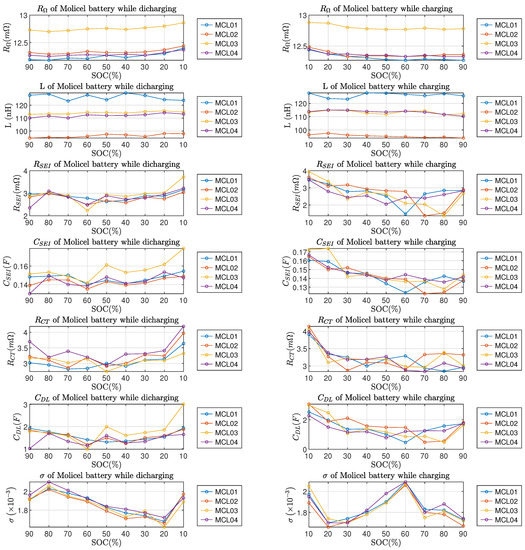
Figure 11.
ECM parameters of Molicel batteries vs. SOC. Left column is for discharging and right column is for charging.
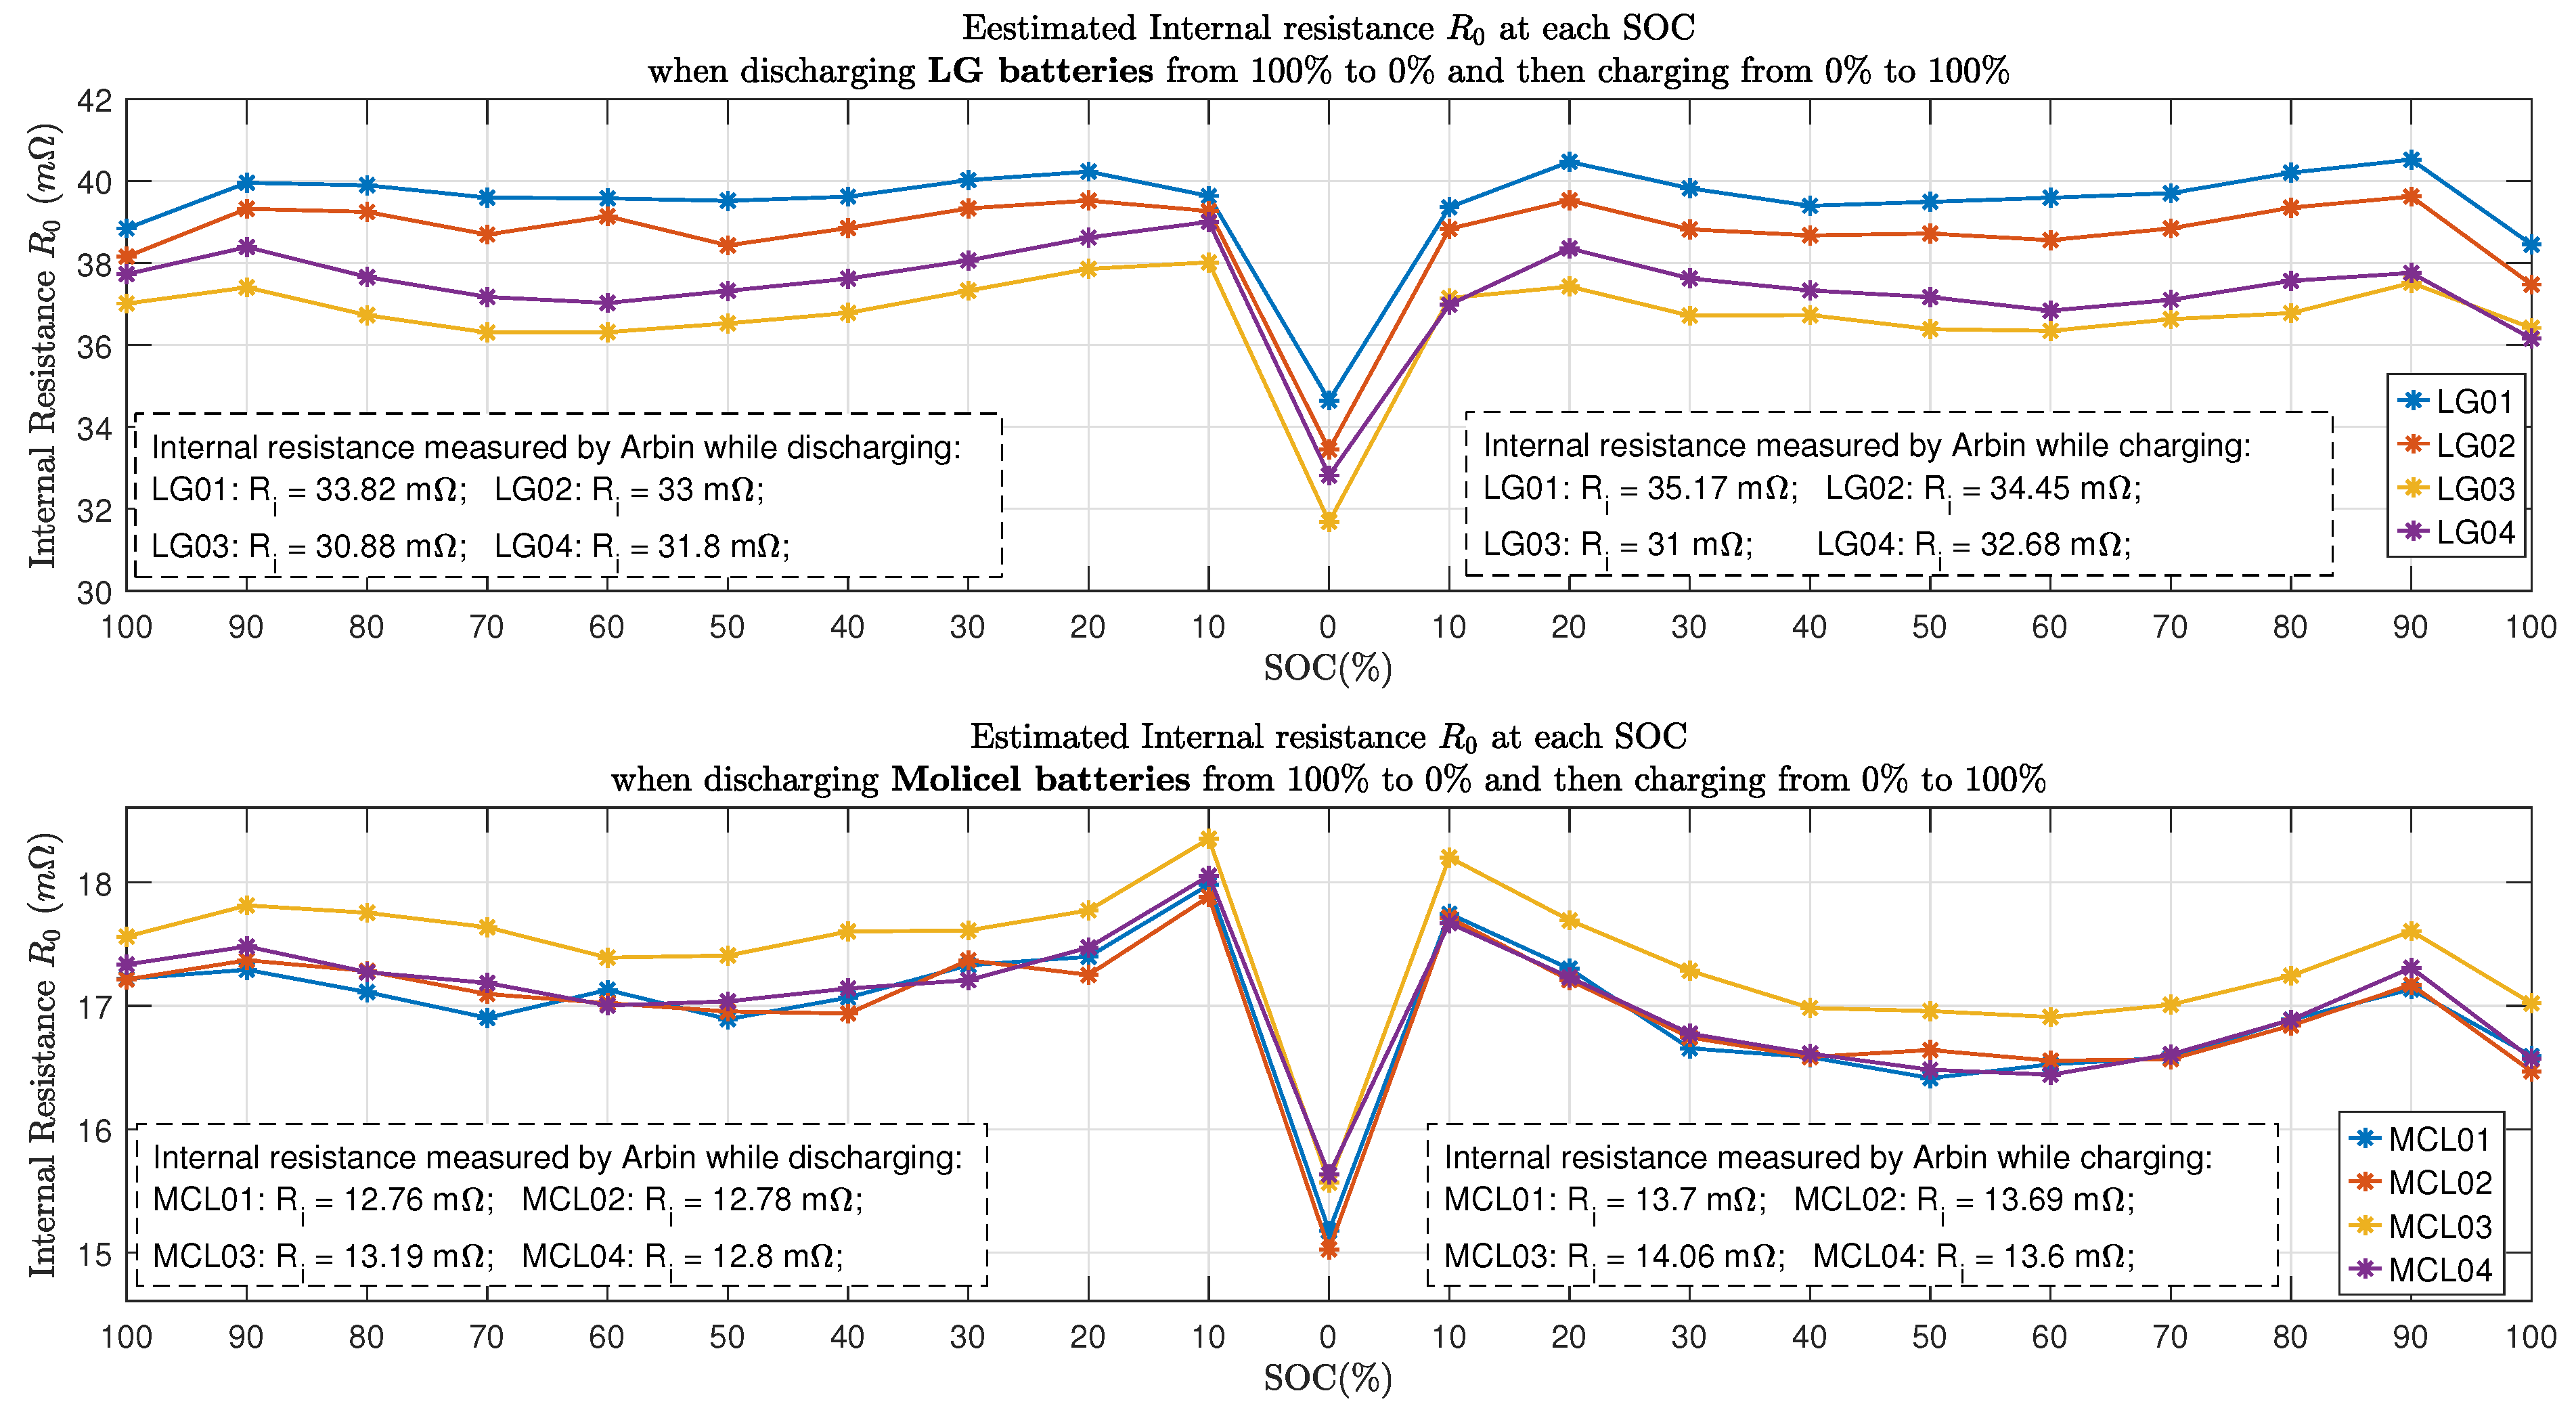
Figure 12 shows all the estimated internal resistance using the time domain approaches presented in Section 3. It can be seen that at , both LG and Molicel batteries’ internal resistance declined to the lowest value, whereas at SOC, all the Molicel batteries’ internal resistance reached the highest value.
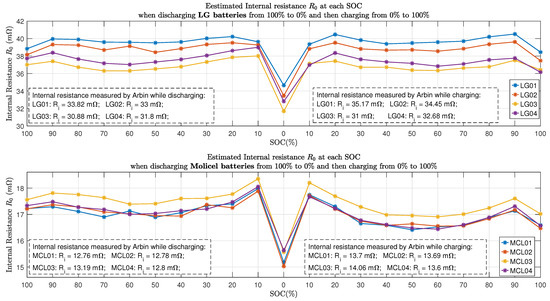
Figure 12.
Internal resistance at each SOC.
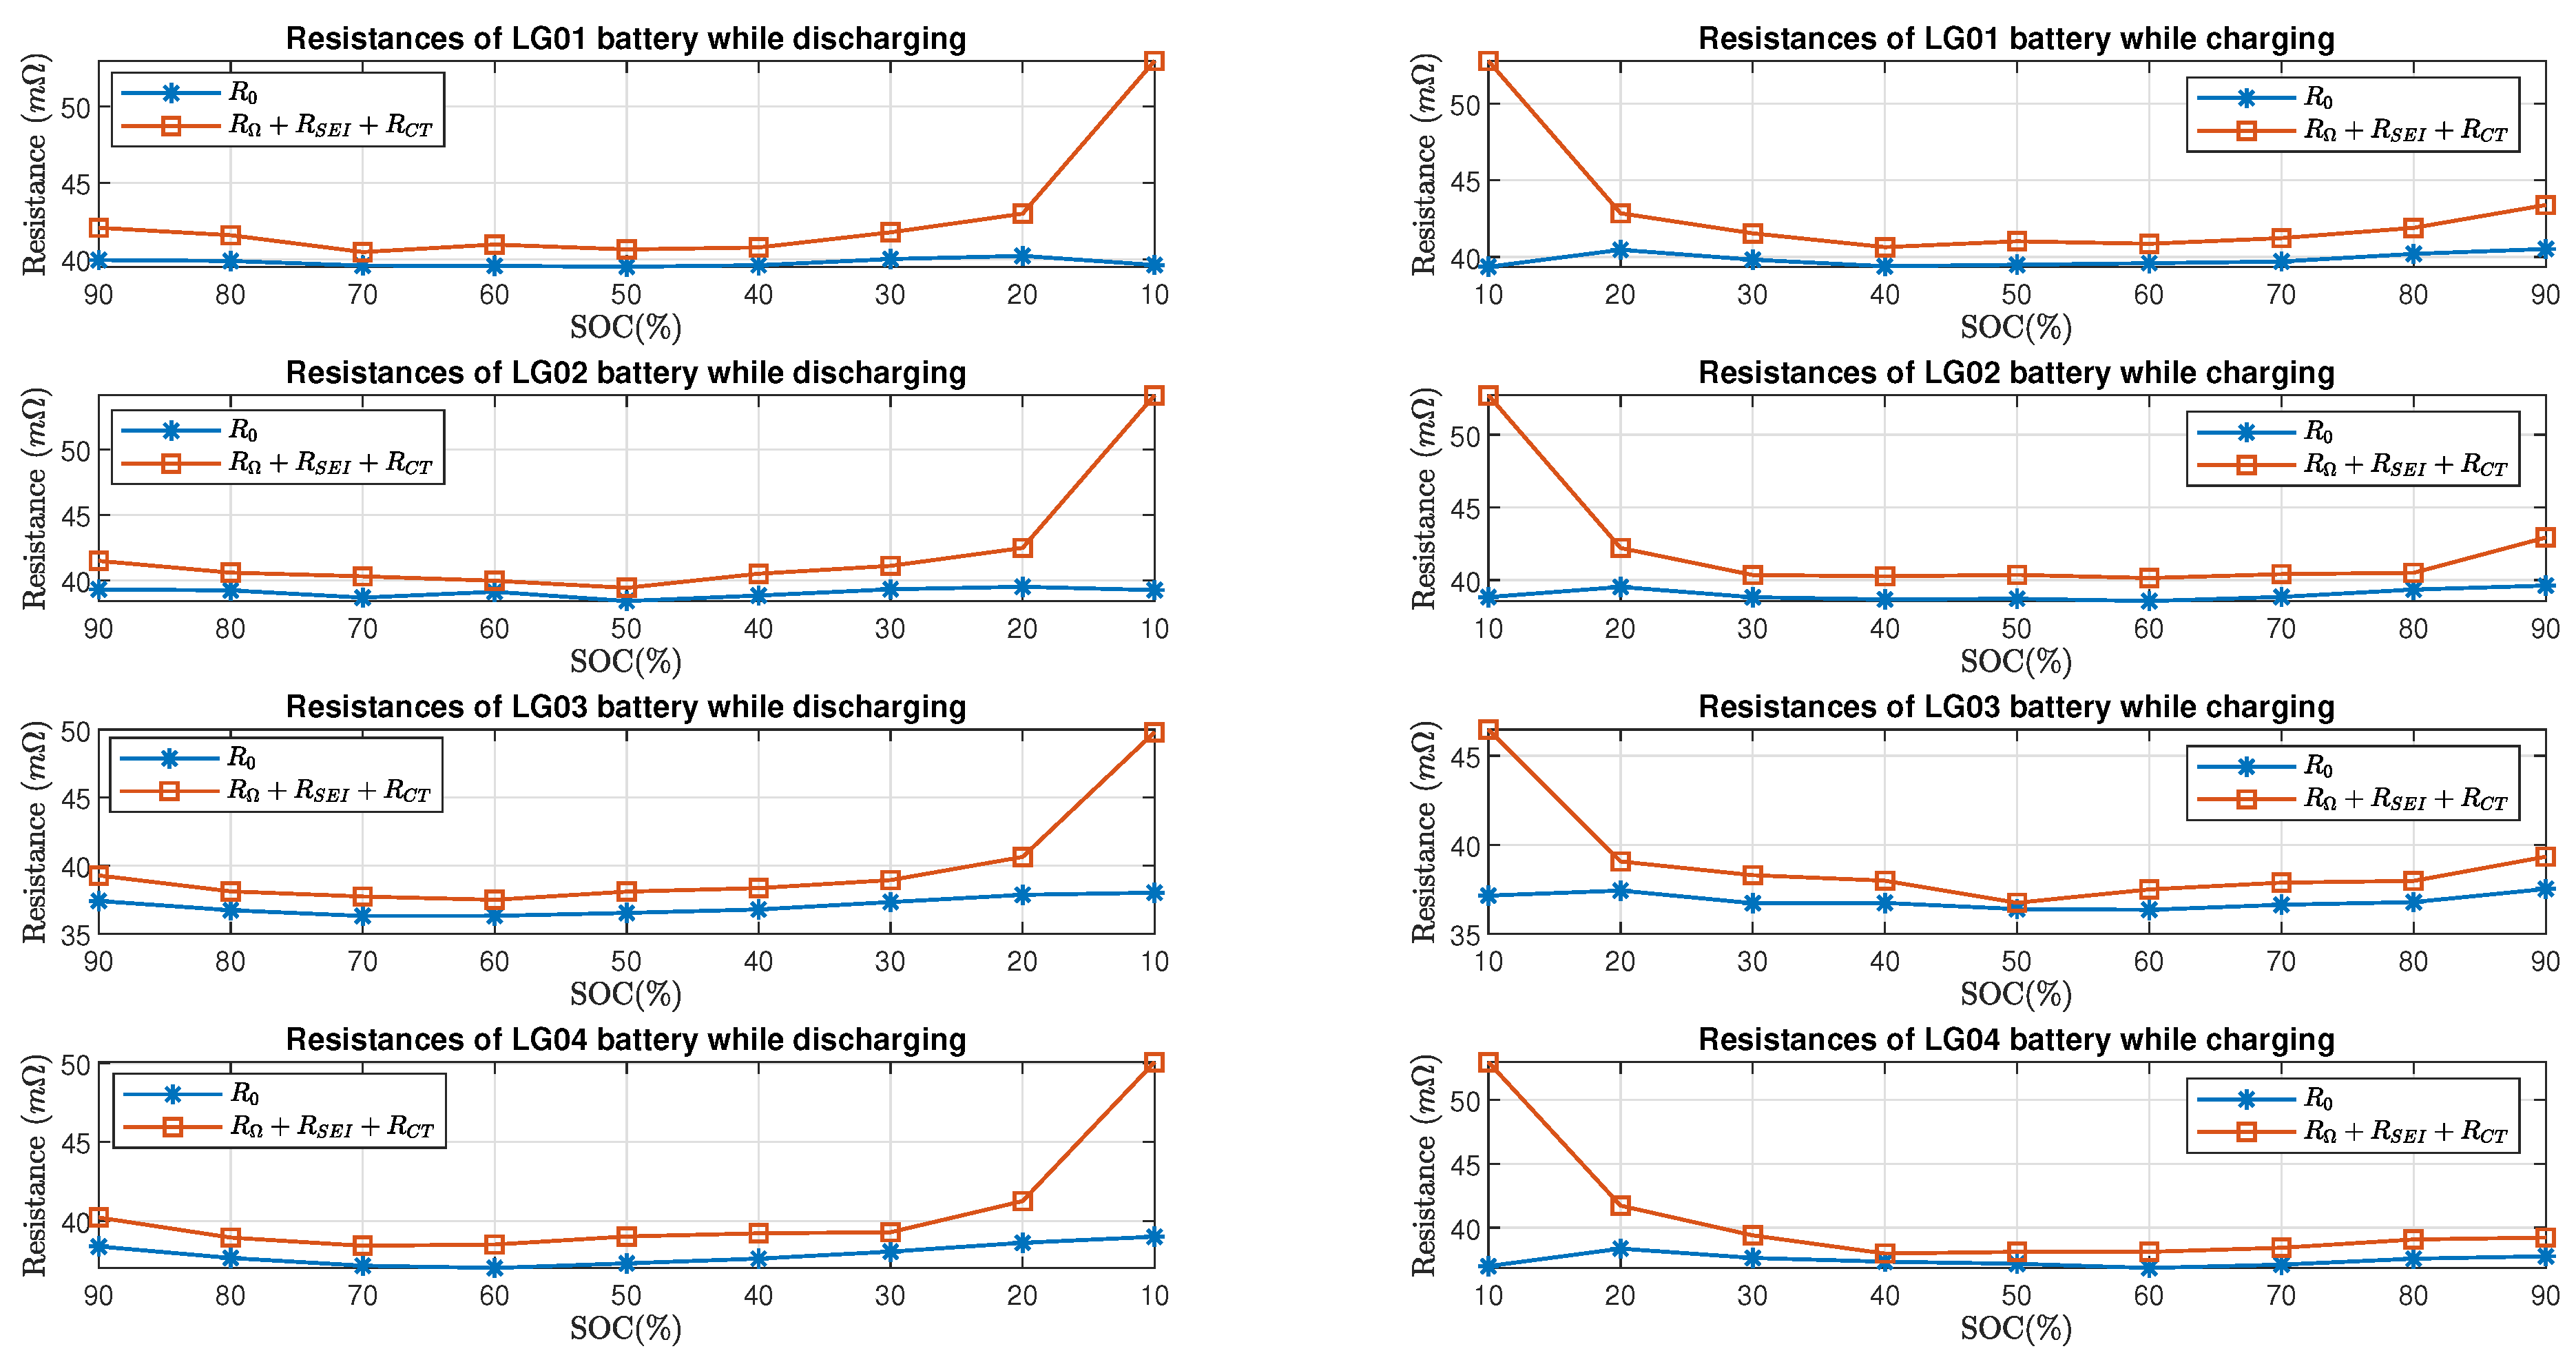
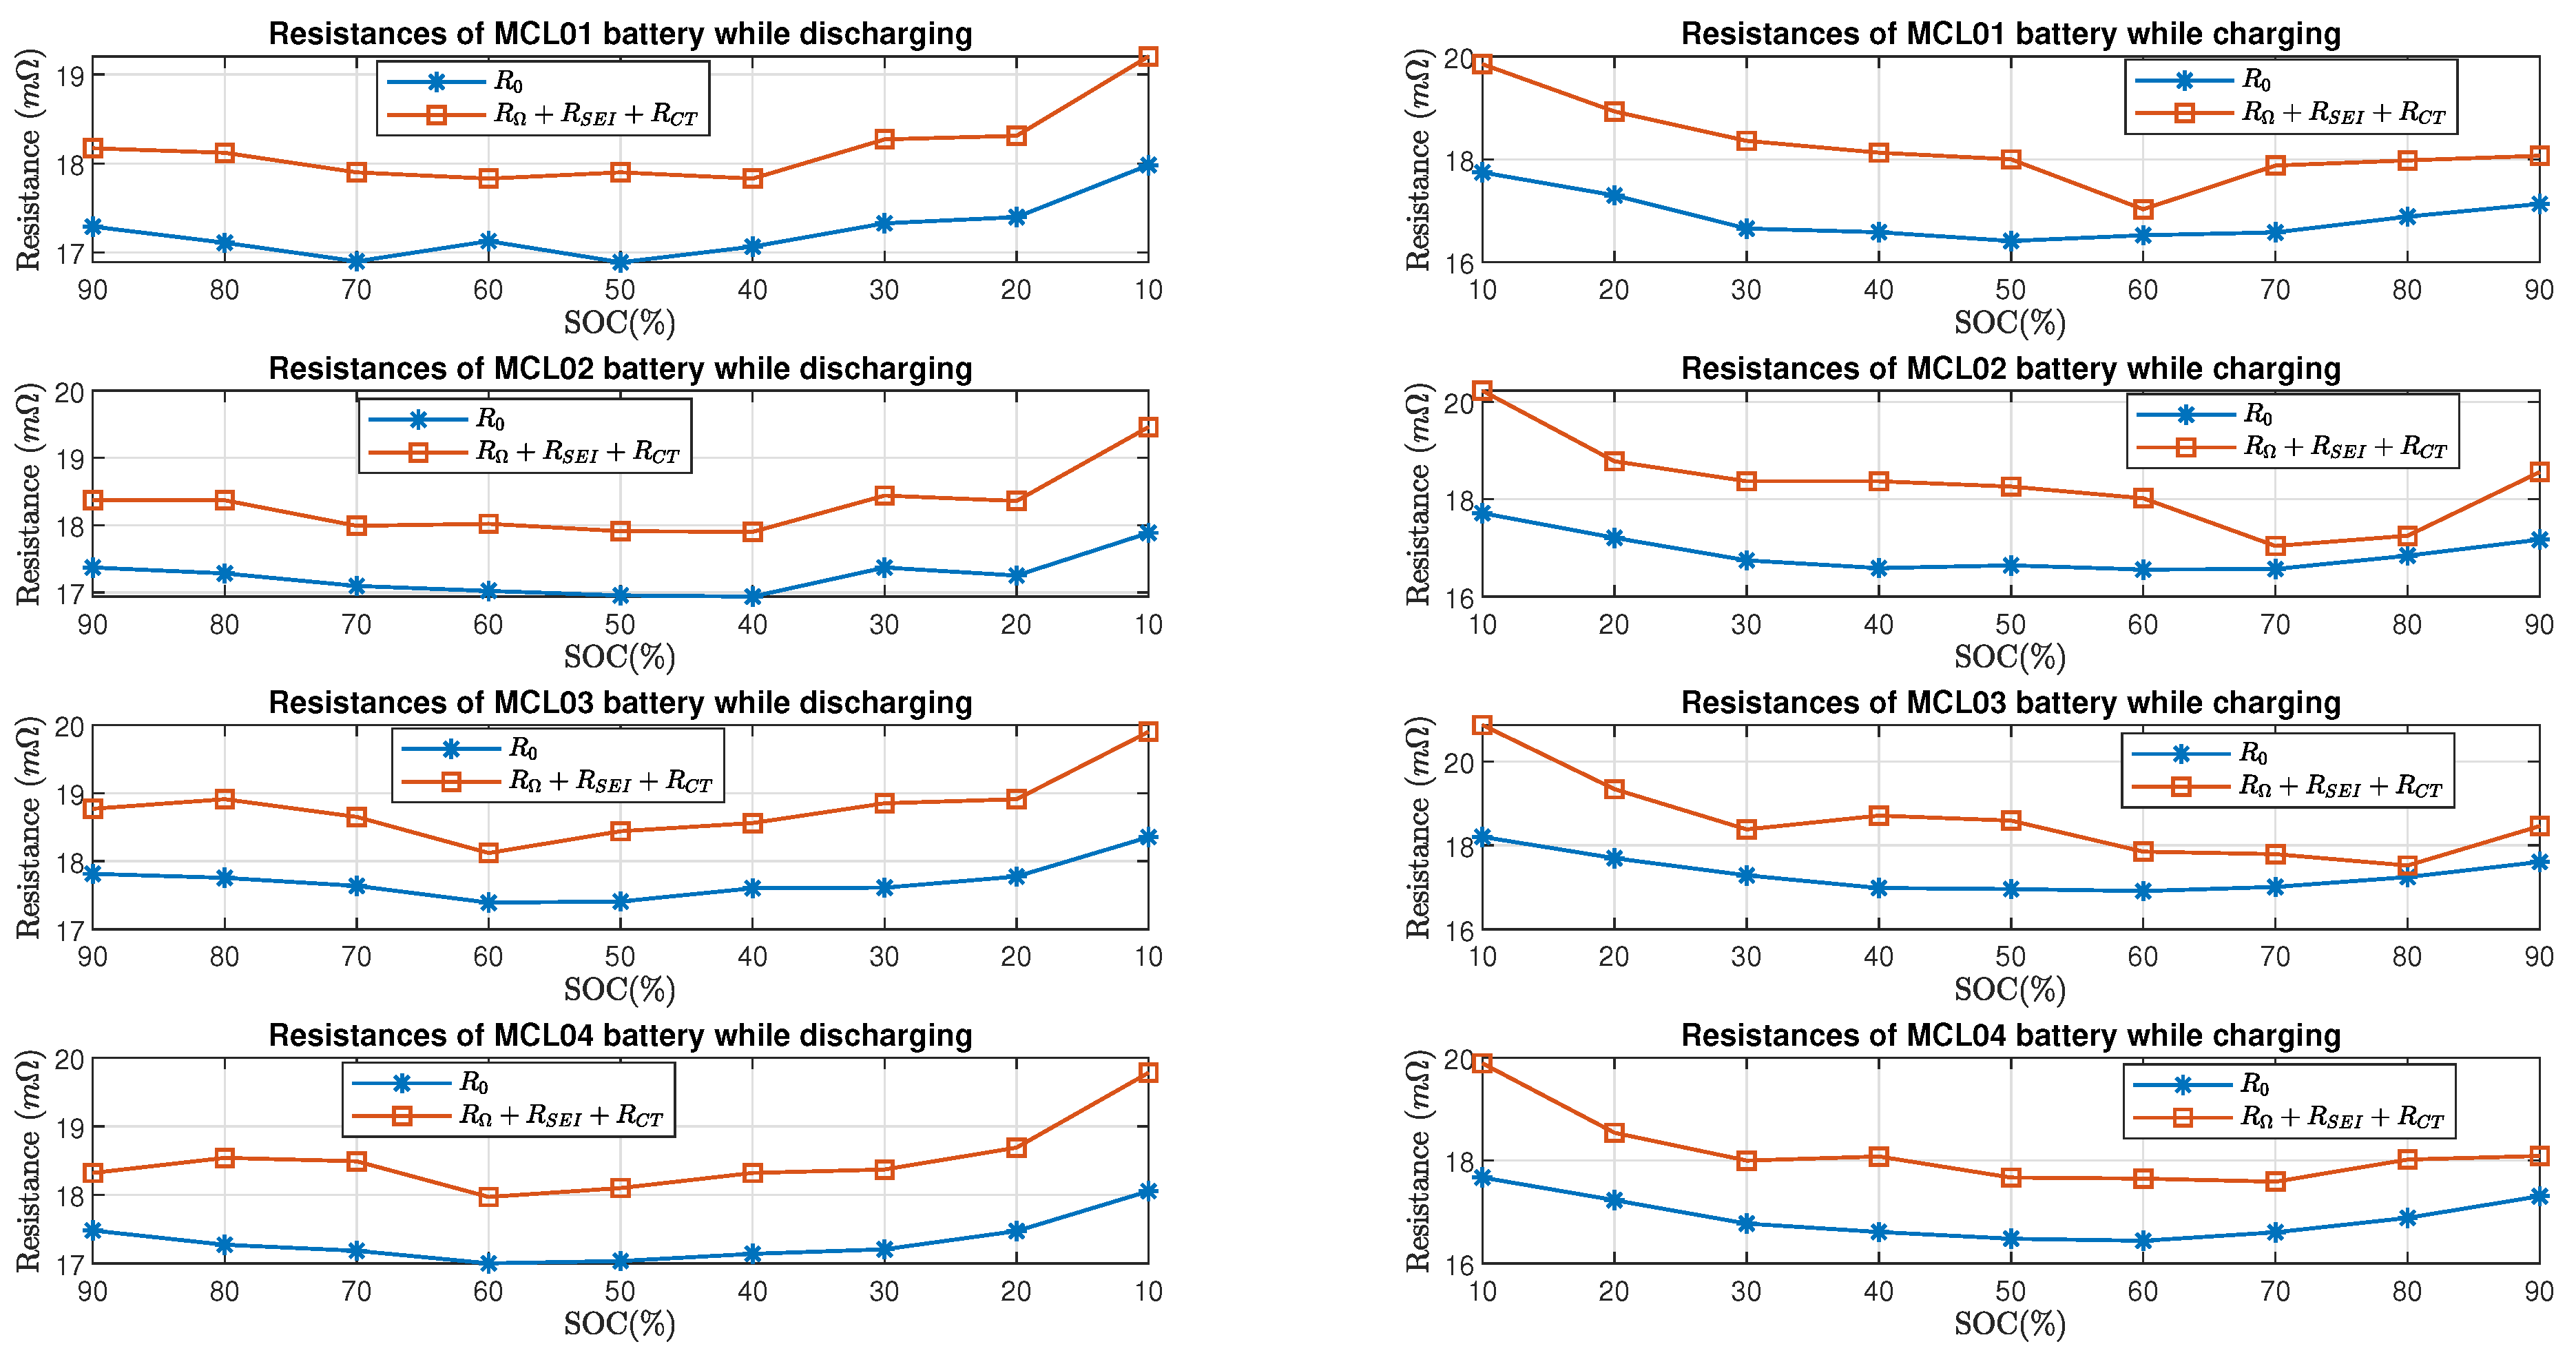
Figure 13 and Figure 14 show the comparison of estimated total resistance and the estimated internal resistance of LG batteries and Molicel batteries, respectively. As for LG and Molicel batteries, is slightly higher than at all SOC, and it reached the highest value at SOC.
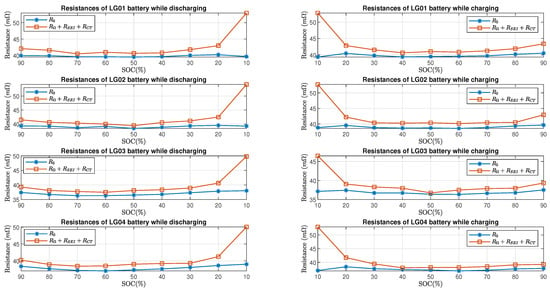
Figure 13.
LG batteries’ resistance estimate in time domain and frequency domain.
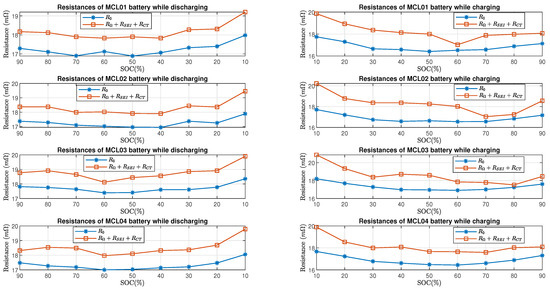
Figure 14.
Molicel batteries’ resistance estimate in time domain and frequency domain.
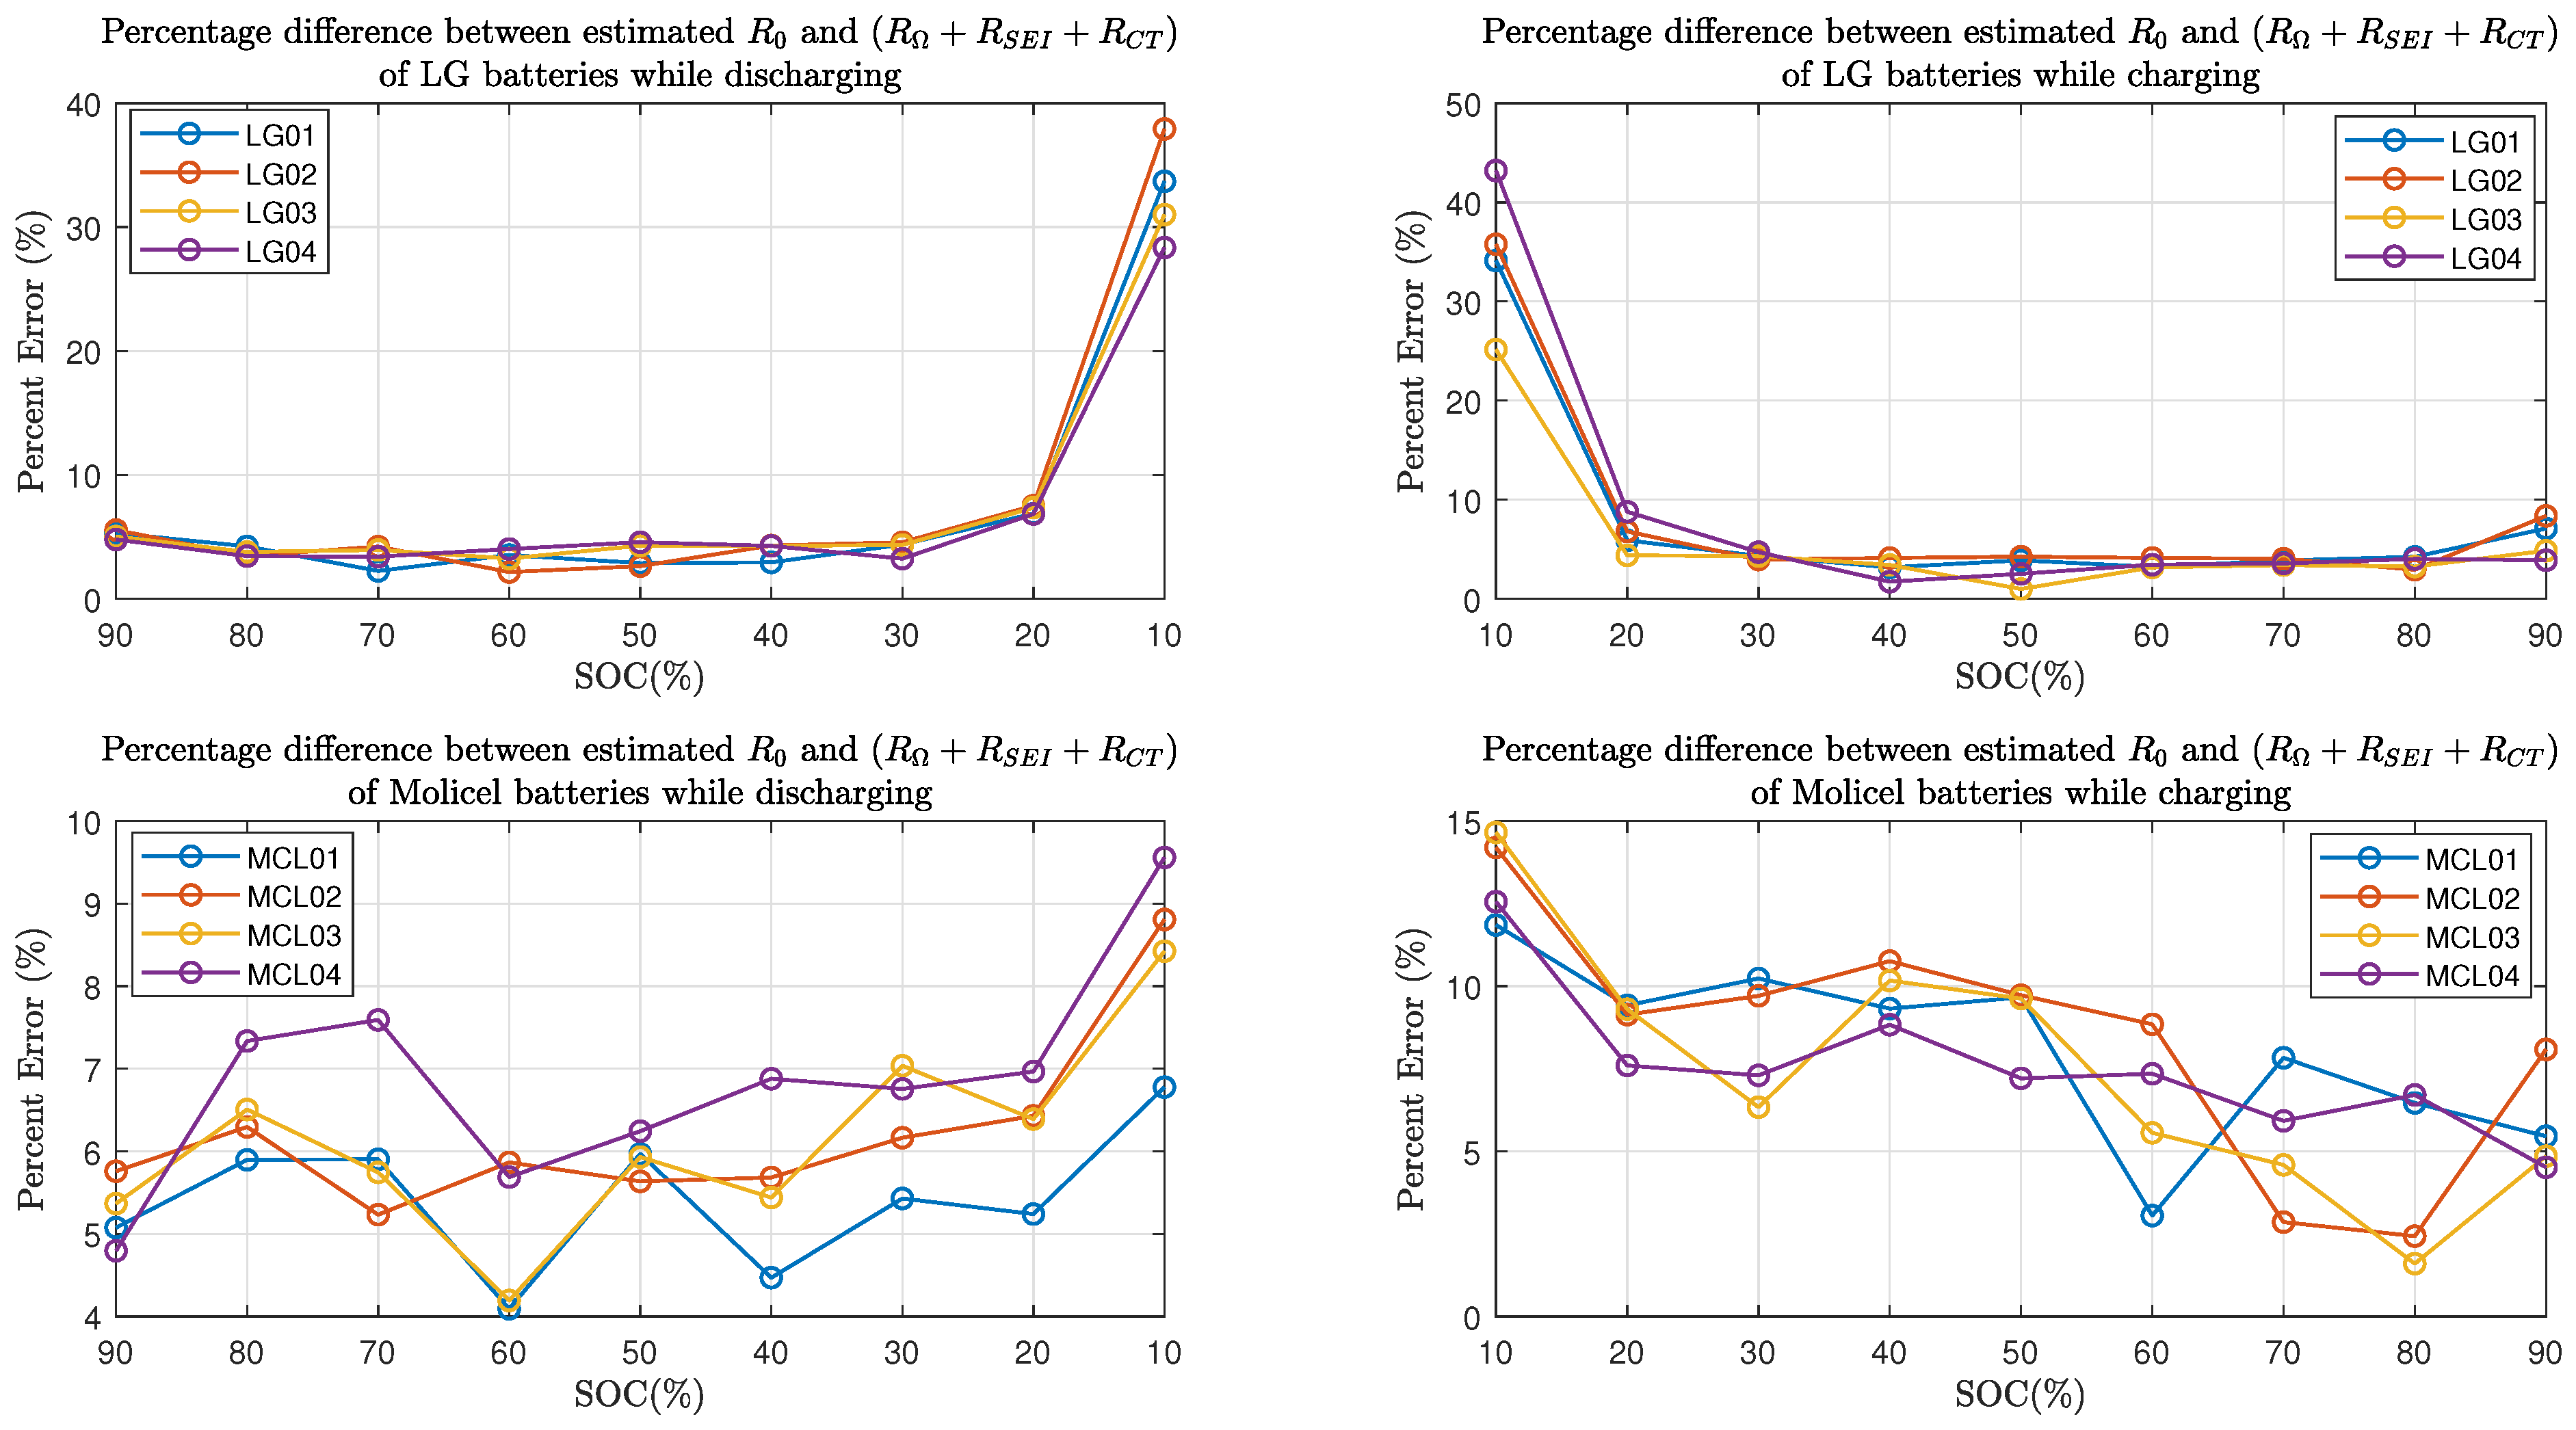
Furthermore, Figure 15 shows the percent error of the estimated resistive elements with respect to the internal resistance in the charging and discharging process. As for LG batteries, it can be seen that the percent errors are within when the batteries’ SOC is between and while charging or discharging; at SOC, the percent errors are between and in the discharging process, and they are between and in the charging process. As for Molicel batteries, when the SOC is between and , the percentage errors are within while discharging and are within while charging; at SOC, the percentage errors are between and in the discharging process, and they are between and in the charging process.
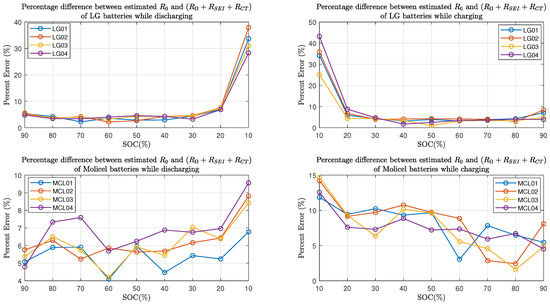
Figure 15.
Percent error between time domain and frequency domain estimates.
6. Conclusions and Discussions
This paper demonstrates the parameter estimation to identify the resistive and inductive components in an AR-ECM based on the battery’s EIS.
The ECM parameter estimation approach is applied to the EIS data collected from LG 16850 and Molicel 21700 batteries at multiple SOC levels. The proposed approach is implemented via the manual selection of feature points from actual Nyquist plot; this relies on the precise separation of SEI arc, CT arc, and Diffusion arc from the real Nyquist plot, which has a low signal-to-noise ratio.
From the experiment, it is clear that the internal resistance measured by Arbin is actually the ohmic resistance from the AR-ECM; besides, whether it is an LG or Molicel battery, the variation of all estimated ECM parameters is very small when the SOC ranges from to ; furthermore; , and reached the highest value at SOC, whereas the variation of L, , and show irregularity at SOC; moreover, the total resistance reaches the highest value at SOC.
In addition, a time domain approach is developed to check the validity of the estimated ECM parameters; the validation is performed by using data collected from eight different batteries at nine different SOC levels both in the discharging and charging process, which shows good agreement between the time domain and frequency domain approaches when the battery’s SOC is between and . It must be noted that this approach is well suited to estimate resistive components only. When the RC effect increases, the accuracy of resistance estimation is expected to drop. The prominent error observed at SOC is due to the significant RC effect; this makes sense, since there are two RC elements in the AR-ECM. As a result, it can be concluded that there exists an inadequacy in the time domain approach for modeling all resistive elements at low SOC.
In future works, the automatic detection of feature points will be developed to improve the efficiency of ECM parameter estimation. Another limitation of the present work is that all the experiments were conducted at room temperature. Future studies will repeat these experiments at various temperatures to investigate whether the variation of temperature has an impact on ECM parameters.
Author Contributions
Conceptualization, Y.W., S.S. and B.B.; investigation, Y.W. and S.S., review and editing, Y.W. and B.B., validation, Y.W. visualization, Y.W., supervision, B.B. All the authors contributed to the design and development of the experiments. All authors have read and agreed to the published version of the manuscript.
Funding
This research was funded by Natural Sciences and Engineering Research Council of Canada (NSERC) grant number RGPIN-2018-04557.
Data Availability Statement
Not applicable.
Acknowledgments
B. Balasingam would like to acknowledge the Natural Sciences and Engineering Research Council of Canada (NSERC) for financial support under the Discovery Grants (DG) program (funding reference number RGPIN-2018-04557) and the Alliance Program (funding reference number ALLRP 561015).
Conflicts of Interest
The authors declare no conflict of interest.
References
- Movahedi, H.; Tian, N.; Fang, H.; Rajamani, R. Hysteresis compensation and nonlinear observer design for state-of-charge estimation using a nonlinear double-capacitor li-ion battery model. IEEE/ASME Trans. Mechatronics 2021, 27, 594–604. [Google Scholar] [CrossRef]
- Pattipati, B.; Balasingam, B.; Avvari, G.V.; Pattipati, K.R.; Bar-Shalom, Y. Open circuit voltage characterization of lithium-ion batteries. J. Power Sources 2014, 269, 317–333. [Google Scholar] [CrossRef]
- Gao, Y.; Zhang, X.; Zhu, C.; Guo, B. Global parameter sensitivity analysis of electrochemical model for lithium-ion batteries considering aging. IEEE/ASME Trans. Mechatronics 2021, 26, 1283–1294. [Google Scholar] [CrossRef]
- Deng, Z.; Hu, X.; Lin, X.; Xu, L.; Che, Y.; Hu, L. General discharge voltage information enabled health evaluation for lithium-ion batteries. IEEE/ASME Trans. Mechatronics 2020, 26, 1295–1306. [Google Scholar] [CrossRef]
- Ahmed, M.S.; Balasingam, B. A scaling approach for improved open circuit voltage modeling in li-ion batteries. In Proceedings of the 2019 IEEE Electrical Power and Energy Conference (EPEC), Montreal, QC, Canada, 16–18 October 2019; pp. 1–6. [Google Scholar]
- Agudelo, B.O.; Zamboni, W.; Monmasson, E. A comparison of time-domain implementation methods for fractional-order battery impedance models. Energies 2021, 14, 4415. [Google Scholar] [CrossRef]
- Balasingam, B.; Avvari, G.; Pattipati, B.; Pattipati, K.; Bar-Shalom, Y. A robust approach to battery fuel gauging, part i: Real time model identification. J. Power Sources 2014, 272, 1142–1153. [Google Scholar] [CrossRef]
- He, H.; Xiong, R.; Guo, H. Online estimation of model parameters and state-of-charge of lifepo4 batteries in electric vehicles. Appl. Energy 2012, 89, 413–420. [Google Scholar] [CrossRef]
- Islam, S.R.; Park, S.-Y. Precise online electrochemical impedance spectroscopy strategies for li-ion batteries. IEEE Trans. Ind. Appl. 2019, 56, 1661–1669. [Google Scholar] [CrossRef]
- Heaviside, O. Electrical Papers by Oliver Heaviside (In Two Volumes); MacMillon & Co.: New York, NY, USA, 1894; Volume 268. [Google Scholar]
- Orazem, M.E.; Tribollet, B. Electrochemical impedance spectroscopy. New Jersey 2008, 1, 383–389. [Google Scholar]
- Felder, M.P.; Gotze, J.; Banerjee, S.; Jansen, P. SoLE—An alternative approach for impedance measurement of Lithium-ion battery cells. In Proceedings of the 8th IET International Conference on Power Electronics, Machines and Drives (PEMD 2016), Glasgow, UK, 19–21 April 2016. [Google Scholar]
- Allagui, A.; Baboukani, A.R.; Elwakil, A.S.; Wang, C. Electrochemical stability analysis of red phosphorus-based anode for lithium-ion batteries. Electrochim. Acta 2021, 395, 139149. [Google Scholar] [CrossRef]
- Murbach, M.D.; Schwartz, D.T. Analysis of li-ion battery electrochemical impedance spectroscopy data: An easy-to-implement approach for physics-based parameter estimation using an open-source tool. J. Electrochem. Soc. 2018, 165, A297. [Google Scholar] [CrossRef]
- Xu, J.; Mi, C.C.; Cao, B.; Cao, J. A new method to estimate the state of charge of lithium-ion batteries based on the battery impedance model. J. Power Sources 2013, 233, 277–284. [Google Scholar] [CrossRef]
- Yang, Q.; Xu, J.; Cao, B.; Li, X. A simplified fractional order impedance model and parameter identification method for lithium-ion batteries. PLoS ONE 2017, 12, e0172424. [Google Scholar] [CrossRef] [PubMed]
- Pastor-Fernández, C.; Widanage, W.D.; Marco, J.; Gama-Valdez, M.-Á.; Chouchelamane, G.H. Identification and quantification of ageing mechanisms in lithium-ion batteries using the eis technique. In Proceedings of the 2016 IEEE Transportation Electrification Conference and Expo (ITEC), Dearborn, MI, USA, 27–29 June 2016; pp. 1–6. [Google Scholar]
- Qahouq, J.A.A.; Xia, Z. Single-perturbation-cycle online battery impedance spectrum measurement method with closed-loop control of power converter. IEEE Trans. Ind. Electron. 2017, 64, 7019–7029. [Google Scholar] [CrossRef]
- Pattipati, B.; Sankavaram, C.; Pattipati, K. System identification and estimation framework for pivotal automotive battery management system characteristics. IEEE Trans. Syst. Man Cybern. Part C (Appl. Rev.) 2011, 41, 869–884. [Google Scholar] [CrossRef]
- Agudelo, B.; Zamboni, W.; Monmasson, E.; Spagnuolo, G. Identification of battery circuit model from eis data. In JCGE-Congrès des Jeunes Chercheurs en Génie Electrique. 2019. Available online: https://hal.science/hal-02915697/document (accessed on 13 April 2023).
- Islam, S.; Park, S.-Y.; Balasingam, B. Unification of internal resistance estimation methods for li-ion batteries using hysteresis-free equivalent circuit models. Batteries 2020, 6, 32. [Google Scholar] [CrossRef]
- Kersten, A.; Kuder, M.; Han, W.; Thiringer, T.; Lesnicar, A.; Weyh, T.; Eckerle, R. Online and on-board battery impedance estimation of battery cells, modules or packs in a reconfigurable battery system or multilevel inverter. In Proceedings of the IECON 2020 The 46th Annual Conference of the IEEE Industrial Electronics Society, Singapore, 18–21 October 2020; pp. 1884–1891. [Google Scholar]
- Galeotti, M.; Cinà, L.; Giammanco, C.; Cordiner, S.; Carlo, A.D. Performance analysis and soh (state of health) evaluation of lithium polymer batteries through electrochemical impedance spectroscopy. Energy 2015, 89, 678–686. [Google Scholar] [CrossRef]
- Jiang, J.; Shi, W.; Zheng, J.; Zuo, P.; Xiao, J.; Chen, X.; Xu, W.; Zhang, J.-G. Optimized operating range for large-format lifepo4/graphite batteries. J. Electrochem. Soc. 2013, 161, A336. [Google Scholar] [CrossRef]
- Feng, F.; Yang, R.; Meng, J.; Xie, Y.; Zhang, Z.; Chai, Y.; Mou, L. Electrochemical impedance characteristics at various conditions for commercial solid–liquid electrolyte lithium-ion batteries: Part. 2. Modeling and prediction. Energy 2022, 243, 123091. [Google Scholar] [CrossRef]
- Pastor-Fernández, C.; Uddin, K.; Chouchelamane, G.H.; Widanage, W.D.; Marco, J. A comparison between electrochemical impedance spectroscopy and incremental capacity-differential voltage as Li-ion diagnostic techniques to identify and quantify the effects of degradation modes within battery management systems. J. Power Sources 2017, 360, 301–318. [Google Scholar] [CrossRef]
- Ghadi, M.A. Performance Analysis and Improvement of Electrochemical Impedance Spectroscopy for Online Estimation of Battery Parameters. Master’s Thesis, University of Windsor (Canada), Windsor, ON, Canada, 2021. [Google Scholar]
- Pillai, P.; Sundaresan, S.; Pattipati, K.R.; Balasingam, B. Optimizing current profiles for efficient online estimation of battery equivalent circuit model parameters based on Cramer–Rao lower bound. Energies 2022, 15, 8441. [Google Scholar] [CrossRef]
- Balasingam, B.; Pattipati, K.R. On the identification of electrical equivalent circuit models based on noisy measurements. IEEE Trans. Instrum. Meas. 2021, 70, 1–16. [Google Scholar] [CrossRef]
- Waag, W.; Käbitz, S.; Sauer, D.U. Experimental investigation of the lithium-ion battery impedance characteristic at various conditions and aging states and its influence on the application. Appl. Energy 2013, 102, 885–897. [Google Scholar] [CrossRef]
- Instrument Operator’s Manual; EIS Box; Gamry Instruments Inc.: Warminster, PA, USA, 2018.
- Approval Sheet–Lithium-Ion Rechargeable Battery; MOLICEL: Richmond, CA, USA, 2018.
- Product Specification–Rechargeable Lithium Ion Battery; LG Chem: Seoul, Republic of Korea, 2014.
Disclaimer/Publisher’s Note: The statements, opinions and data contained in all publications are solely those of the individual author(s) and contributor(s) and not of MDPI and/or the editor(s). MDPI and/or the editor(s) disclaim responsibility for any injury to people or property resulting from any ideas, methods, instructions or products referred to in the content. |
© 2023 by the authors. Licensee MDPI, Basel, Switzerland. This article is an open access article distributed under the terms and conditions of the Creative Commons Attribution (CC BY) license (https://creativecommons.org/licenses/by/4.0/).

