Article

COVID-19 Case Rates in the UK: Modelling Uncertainties as Lockdown Lifts

by
Claire Brereton
1,* and
Matteo Pedercini
2
1
Child Health Research Centre, University of Queensland, Brisbane, QLD 4101, Australia
2
Millennium Institute, 2200 Pennsylvania Ave NW, Washington, DC 20037, USA
*
Author to whom correspondence should be addressed.
Systems 2021, 9(3), 60; https://doi.org/10.3390/systems9030060
Submission received: 10 May 2021 / Revised: 19 July 2021 / Accepted: 21 July 2021 / Published: 6 August 2021

Abstract

:
Background: The UK was one of the countries worst affected by the COVID-19 pandemic in Europe. A strict lockdown from early 2021 combined with an aggressive vaccination programme enabled a gradual easing of lockdown measures to be introduced whilst both deaths and reported case numbers reduced to less than 3% of their peak. The emergence of the Delta variant in April 2021 has reversed this trend, and the UK is once again experiencing surging cases, albeit with reduced average severity due to the success of the vaccination rollout. This study presents the results of a modelling exercise which simulates the progression of the pandemic in the UK through projection of daily case numbers as lockdown lifts. Methods: A simulation model based on the Susceptible-Exposed-Infected-Recovered structure was built. A timeline of UK lockdown measures was used to simulate the changing restrictions. The model was tailored for the UK, with some values set based on research and others obtained through calibration against 16 months of historical data. Results: The model projects that if lockdown restrictions are lifted in July 2021, UK COVID-19 cases will peak at hundreds of thousands daily in most viable scenarios, reducing in late 2021 as immunity acquired through both vaccination and infection reduces the susceptible population percentage. Further lockdown measures can be used to reduce daily cases. Other than the ever-present threat of the emergence of new variants, the most significant unknown factors affecting the profile of the pandemic in the UK are the length and strength of immunity, with daily peak cases over 50% higher if immunity lasts 8 months compared to 12 months. Another significant factor is the percentage of unreported cases. The reduced case severity associated with vaccination may lead to a higher proportion of unreported mild or asymptomatic cases, meaning that unmanaged infections resulting from unknown cases will continue to be a major source of infection. Conclusions: Further research into the length and strength of both recovered and vaccinated COVID-19 immunity is critical to delivering more accurate projections from models, thus enabling more finely tuned policy decisions. The model presented in this article, whilst by no means perfect, aims to contribute to greater transparency of the modelling process, which can only increase trust between policy makers, journalists and the general public.

1. Introduction

The COVID-19 pandemic is an unprecedented global crisis. The unusual nature of the SARS-CoV-2 virus, which can be deadly for one person whilst having no symptoms for another, was misunderstood by scientists and policy makers during the early stages of the pandemic, leading to underestimation of case numbers and focus on control of symptomatic infections [1]. Modelling studies [2,3] and research on the prevalence of COVID-19 antibodies in the UK population [4] indicated early on that confirmed cases were less than half of true infection estimates, and this reality is reflected in global pandemic planning guidance [5] and in the continuing use of measures such as lockdowns, which restrict social contact irrespective of known infection status across an entire population.
The United Kingdom (UK) was one of the countries worst affected by COVID-19 in the developed world, characterized by a slow initial response, lack of border controls, changing regional guidance and ease of movement between regions [6]. The UK is made up of four countries—England, Scotland, Wales and Northern Ireland, each with the autonomy to establish their own COVID-19 controls—but as 84% of the population resides in England, the profile of the pandemic in England and the measures taken there are the most significant driver of the UK’s COVID-19 statistics. The escalating number of cases and deaths in the UK led to their being the first country to give authorisation for emergency use of the Pfizer/BioNTech (PB) vaccine. The vaccination programme started on 8 December 2020 and committed funds for an initial 30 million doses [7]. The AstraZeneca (AZ) vaccine was authorised on the same basis for rollout commencing 4 January 2021, with 100 million doses ordered. These vaccines delivered the capability to immunise 50 million people, effectively covering the entire eligible population of the UK for two doses each [8]. By end June 2021, 78 million vaccinations had been administered, with 33 million people fully vaccinated. The Moderna vaccine was also approved by the UK Government [9], and in mid-April 2021, it started rolling out to under 30 year olds as an alternative to AZ.
Mass vaccination has two main objectives: to protect individuals from death and severe illness and to increase the number of immune individuals to the point where enough people are protected from the virus to protect the population as a whole (herd immunity). For both vaccinated and recovered individuals, the longevity of protection from infection and the degree of protection conferred are still uncertain. The level of population protection required for herd immunity in the UK, or any other country, has been estimated but is as yet unknown.
As the COVID-19 pandemic has evolved, new strains have emerged, and in the UK, the Alpha variant and Delta variant have successively become dominant. Each of these strains have been more infectious than their predecessors, increasing the challenges to health systems.
Modelling studies have reached a new level of public health importance in 2020/2021 as policy makers have seen their value for predicting and analysing the future progression of the COVID-19 pandemic and allowing a comparison of interventions and policy decisions. There are broadly two modelling approaches being used. Mechanistic (dynamic) models such as the Imperial College London (ICL) model [10] reflect the underlying transmission process and contain non-linear feedback loops and delays, enabling longer term projection and inference of the results of changing assumptions or scenarios [11]. Statistical models, for example the Institute for Health Metrics and Evaluation model [12], use regression based or machine learning methods. These models do not account for how transmission occurs and are therefore not so well suited for long term projections about epidemiological dynamics. The Scientific Advisory Group for Emergencies (SAGE) in the UK uses a number of models to inform its advice [13]. In order to support a broad public debate on the upcoming precautionary measures against COVID-19, we develop a simulation model with three purposes:
  • to investigate the likely effects of lockdown easing on the UK pandemic, exploring the remaining uncertainties on vaccine efficacy and post-infection immunity;
  • to estimate the unknown proportion of COVID-19 cases in the UK and the role of unknown cases in the spread of the disease;
  • to increase the transparency of the modelling and analysis process, by focusing on containing the model detail complexity and clearly establishing the implications of different assumptions.

2. Background

2.1. Recovered and Post-Vaccination Immunity

As the COVID-19 epidemic continues in the UK, recovered population immunity is building. There is growing consensus amongst researchers that recovered immunity will not be lifelong and may be ineffective against new strains. Seasonal coronaviruses such as COVID-19, which infect mucosal surfaces and do not have a viremic phase, typically result in antibody responses that are detected for months or a few years [14]. Estimates of the longevity of recovered immunity range from at least 5 months to more than 12 months [15,16,17]. The longevity and level of protection of post-vaccination immunity is not necessarily the same as that of recovered immunity and will also become better understood with elapsed time, as will the protection which it gives against emerging variants. The first studies specific to COVID-19 reported that in the short term, recovery from infection gave 83% protection (95% CI 76–87%) from reinfection for at least 5 months [18,19]. Results from newer UK population research released in April 2021 showed 70% (95% CI 62–77%) protection from reinfection after either infection or vaccination [20]. Clinical trials continue to investigate vaccine efficacy, the protective effect of past infection and the effectiveness of both vaccines and past infection against emerging COVID-19 strains.

2.2. Transmissibility after Vaccination

Vaccine efficacy has three components: prevention of infection, reduction of disease severity and prevention of transmission [21]. Results from clinical trials focus on prevention and severity of infection, which is directly measurable, rather than on prevention of transmission. For this study, the relevant component of vaccine efficacy is its effectiveness in protecting against onwards transmission of the virus. Research shows that the UK’s vaccination programme has resulted not only in protection from infection but also in a lower viral burden if infected, leading to a much higher proportion of asymptomatic and mild infections. Comparison of viral burden in vaccinated and unvaccinated groups shows a 65% decrease three weeks after one dose of either AZ or PB, and a 70% decrease 1 week after a second dose [20]. Viral burden can be used as a proxy for post-vaccination transmissibility decrease, which is not directly measurable.

2.3. Known, Unknown and Asymptomatic Cases

Asymptomatic transmission is recognised as a significant contributor to the COVID-19 pandemic, both from pre-symptomatic individuals and from those who never develop symptoms [22,23]. The effect of vaccines in reducing the severity to asymptomatic or mild disease may also mean that more cases go undetected in the community, contributing to increased transmission [24]. At least 50% of new infections are estimated to have originated from exposure to individuals with infection but without symptoms [25]. Evidence suggests a 42% lower transmission rate for asymptomatic cases [26,27]. It is broadly acknowledged that there is massive global under-reporting of symptomatic COVID-19 cases for many reasons ranging from perception of low personal risk from COVID-19 infection to lack of trust in health services, lack of testing capacity and a desire to avoid the negative consequences of enforced isolation [28]. The unknown proportion of cases is thus likely to be higher than the truly asymptomatic proportion and the modelling exercise uses optimisation techniques to estimate this unknown proportion.

3. Method and Data Sources

3.1. Model Development

We developed a dynamic model of the COVID-19 pandemic based on the established Susceptible-Exposed-Infected-Recovered (SEIR) compartmental infectious disease model structure [29]. The model, shown in Figure 1, was constructed using Stella Architect software supplied by isee systems, Lebanon, NH, USA.
The SEIR system structure is based on a reinforcing feedback loop of exponentially growing infections over time, balanced by an eventual reduction of susceptible individuals due to death or increasing population immunity. Speed of transmission is tracked by the calculated reproduction number, Rt, with daily case numbers reducing when Rt falls below 1 (R0, initial reproduction number, is often used incorrectly in place of Rt).
The model includes the effects of the social distancing and infection spread measures used to control the spread of COVID-19. Infections are classified as known or unknown, with the parameters associated with contact rates given different values depending on known/unknown status. The effects of a vaccination programme, which reduces the susceptible population, and the effects of recovered immunity drop-off [30], which increases the susceptible population, are also included.
The model consists of stocks, flows and auxiliary variables including intermediate calculations for the determination of flows. Stocks represent levels or state variables, including the numbers of people in the different infectious states or the numbers of vaccine doses available; these are represented by rectangles. Flows represent the rates at which people and doses transition between states and are represented by valve symbols. These rates are determined by time constants or probability estimates of moving to one state or another. The model captures the fundamental drivers of the COVID-19 pandemic and does not provide spatial or individual-level disaggregation. Its lack of detail complexity is meant to provide transparency in the modelling and analysis process, whilst allowing the exploration of a broad range of alternative scenarios.
The model runs from 1 February 2020, when the total population is susceptible, to 31 December 2021, with a time step of 6 h. Individuals acquire the infection, incubate the disease during an initial latent period and then become infectious. Each stage introduces a delay into the system. An individual’s infectious state is at first unknown, then, as the disease becomes symptomatic, it becomes known in a proportion of the infected population. Some individuals’ infectious state is never known to health authorities, either because they are asymptomatic or because they do not recognize or wish to disclose their symptoms for various reasons. Most infected individuals recover, with a proportion of known infected individuals dying. Recovered individuals acquire a level of protective immunity, which reduces the susceptible population. The model also projects the effects of potential future UK Government interventions by simulating increased lockdowns when known daily cases rise above threshold levels. All equations, auxiliary variable values and initial values of stocks are listed in Supplementary Materials Table S1.

3.2. Model Data Sources

The infection rate in the model is calculated from the susceptible population and the daily infecting contact rate, which is affected by social distancing, hygiene and lockdown measures and is significantly lower for known infected individuals. Infectivity in the model increases from 5 December 2020 and again from 13 April 2021, reflecting the emergence of the ‘UK variant’ B.1.1.7, now known as the Alpha variant, which was measured as 35% more contagious (95% CI 2–69%) [31,32] and then the ‘Delta variant’, assumed to be twice as contagious as the original virus. The model uses data for the PB and AZ vaccines only, as the Moderna vaccine has not yet been deployed in quantity in the UK.
The values of the parameters used in the model, shown in Table 1, were established in two ways:
  • For parameters where reliable data was available from published research, e.g., virus incubation time, the median values from the research were used;
  • For parameters where data was either unavailable or considered unreliable, the Powell optimisation method was used to calibrate the model and confirm a narrow spread of 95% confidence intervals.

3.3. Lockdown Effectiveness Timeline Estimation

As social distancing and lockdowns have proven to be one of the most effective ways of combating the spread of the virus [42], a composite measure of lockdown effectiveness based on the timeline of the various restrictions and their easing measures was a key part of the model. This measure is known as the ‘lockdown percentage’. It varies throughout the life of the model and measures the timeline of social distancing, mask wearing and movement restriction measures and varies between 0% and 100%, where 0% represents society with no restrictions in place and 100% a hypothetical total restriction scenario with no contact and therefore no transmission of the virus.
From January 2021, the UK Government implemented a set of country lockdown plans which specified staged step downs separated by a minimum of five weeks, with 7 day’s notice of each change [43] to enable the observation of the data before proceeding. The dates of the most significant measures taken and the future plans [43] are shown in Table 2. The lockdown percentage timeline was estimated from this table and compared with data from a UK social distancing measures adherence study [44].

3.4. Model Calibration and Optimisation

The model was calibrated against historical UK COVID-19 case, death and vaccination data up to 12 July 2021 sourced from Johns Hopkins University [36]. Calibration was done using an optimisation process to find the model variables which produced the best fit to the historical data. The variables which were used for optimisation were: the known and unknown infecting contact rates, the infectiousness ratio of unknown to known cases and the known proportion of cases. This optimisation produced the model ‘base case’ which was used as the starting point for varying uncertainties. Optimisation was also performed for differing immunity length scenarios. The relative infectivity of the Alpha variant and the Delta variant were calibrated by later optimisations.
After calibration, the following validation checks were performed:
  • The ‘new susceptible’ and ‘recovered susceptible’ stocks in the model were validated against UK COVID-19 antibody prevalence studies to ensure that the population fraction of people with antibodies, who can be presumed to have recovered from COVID-19, aligns with the modelled fraction [4];
  • Modelled UK case fatality rates were compared with historical data to ensure broad alignment [36];
  • The reproduction number Rt, calculated by the model over time, was compared with studies of the initial R0 and the ongoing COVID-19 Rt values to check consistency [45];
  • The unknown infectiousness ratio was compared with previous research to ensure that it was at least as high as the estimated asymptomatic infectiousness ratio [26,27].
The major assumptions made in the model in addition to the assumed parameter values were:
  • The relative infectivity increases at two points in time due to the new Alpha and Delta variants;
  • Vaccination proceeds at a steady daily rate in all scenarios and is offered to the total eligible population irrespective of whether an individual is known to have recovered from COVID-19;
  • The maximum achievable population immunity fraction of 70% is capped by ineligible population sectors (pregnant women and most children under 18), vaccine hesitancy [37] and logistical difficulties;
  • The second dose of a vaccine is given 12 weeks after the first dose;
  • The protective effect of the first dose of the vaccine is established 21 days after administration, and increased protection is established 7 days after the second dose;
  • The average time lag between symptom onset and the reporting of a positive case to the data source is 4 days.

3.5. Uncertainty Modelling

Having established the model ‘base case’ through calibration and validation, uncertain parameters in the model were then varied between the 95% CIs reported in clinical trials, enabling the exploration of the effect on future daily case rates. A summary of the areas of uncertainty investigated is shown in Table 3.

4. Results

4.1. Model Fit to Actuals

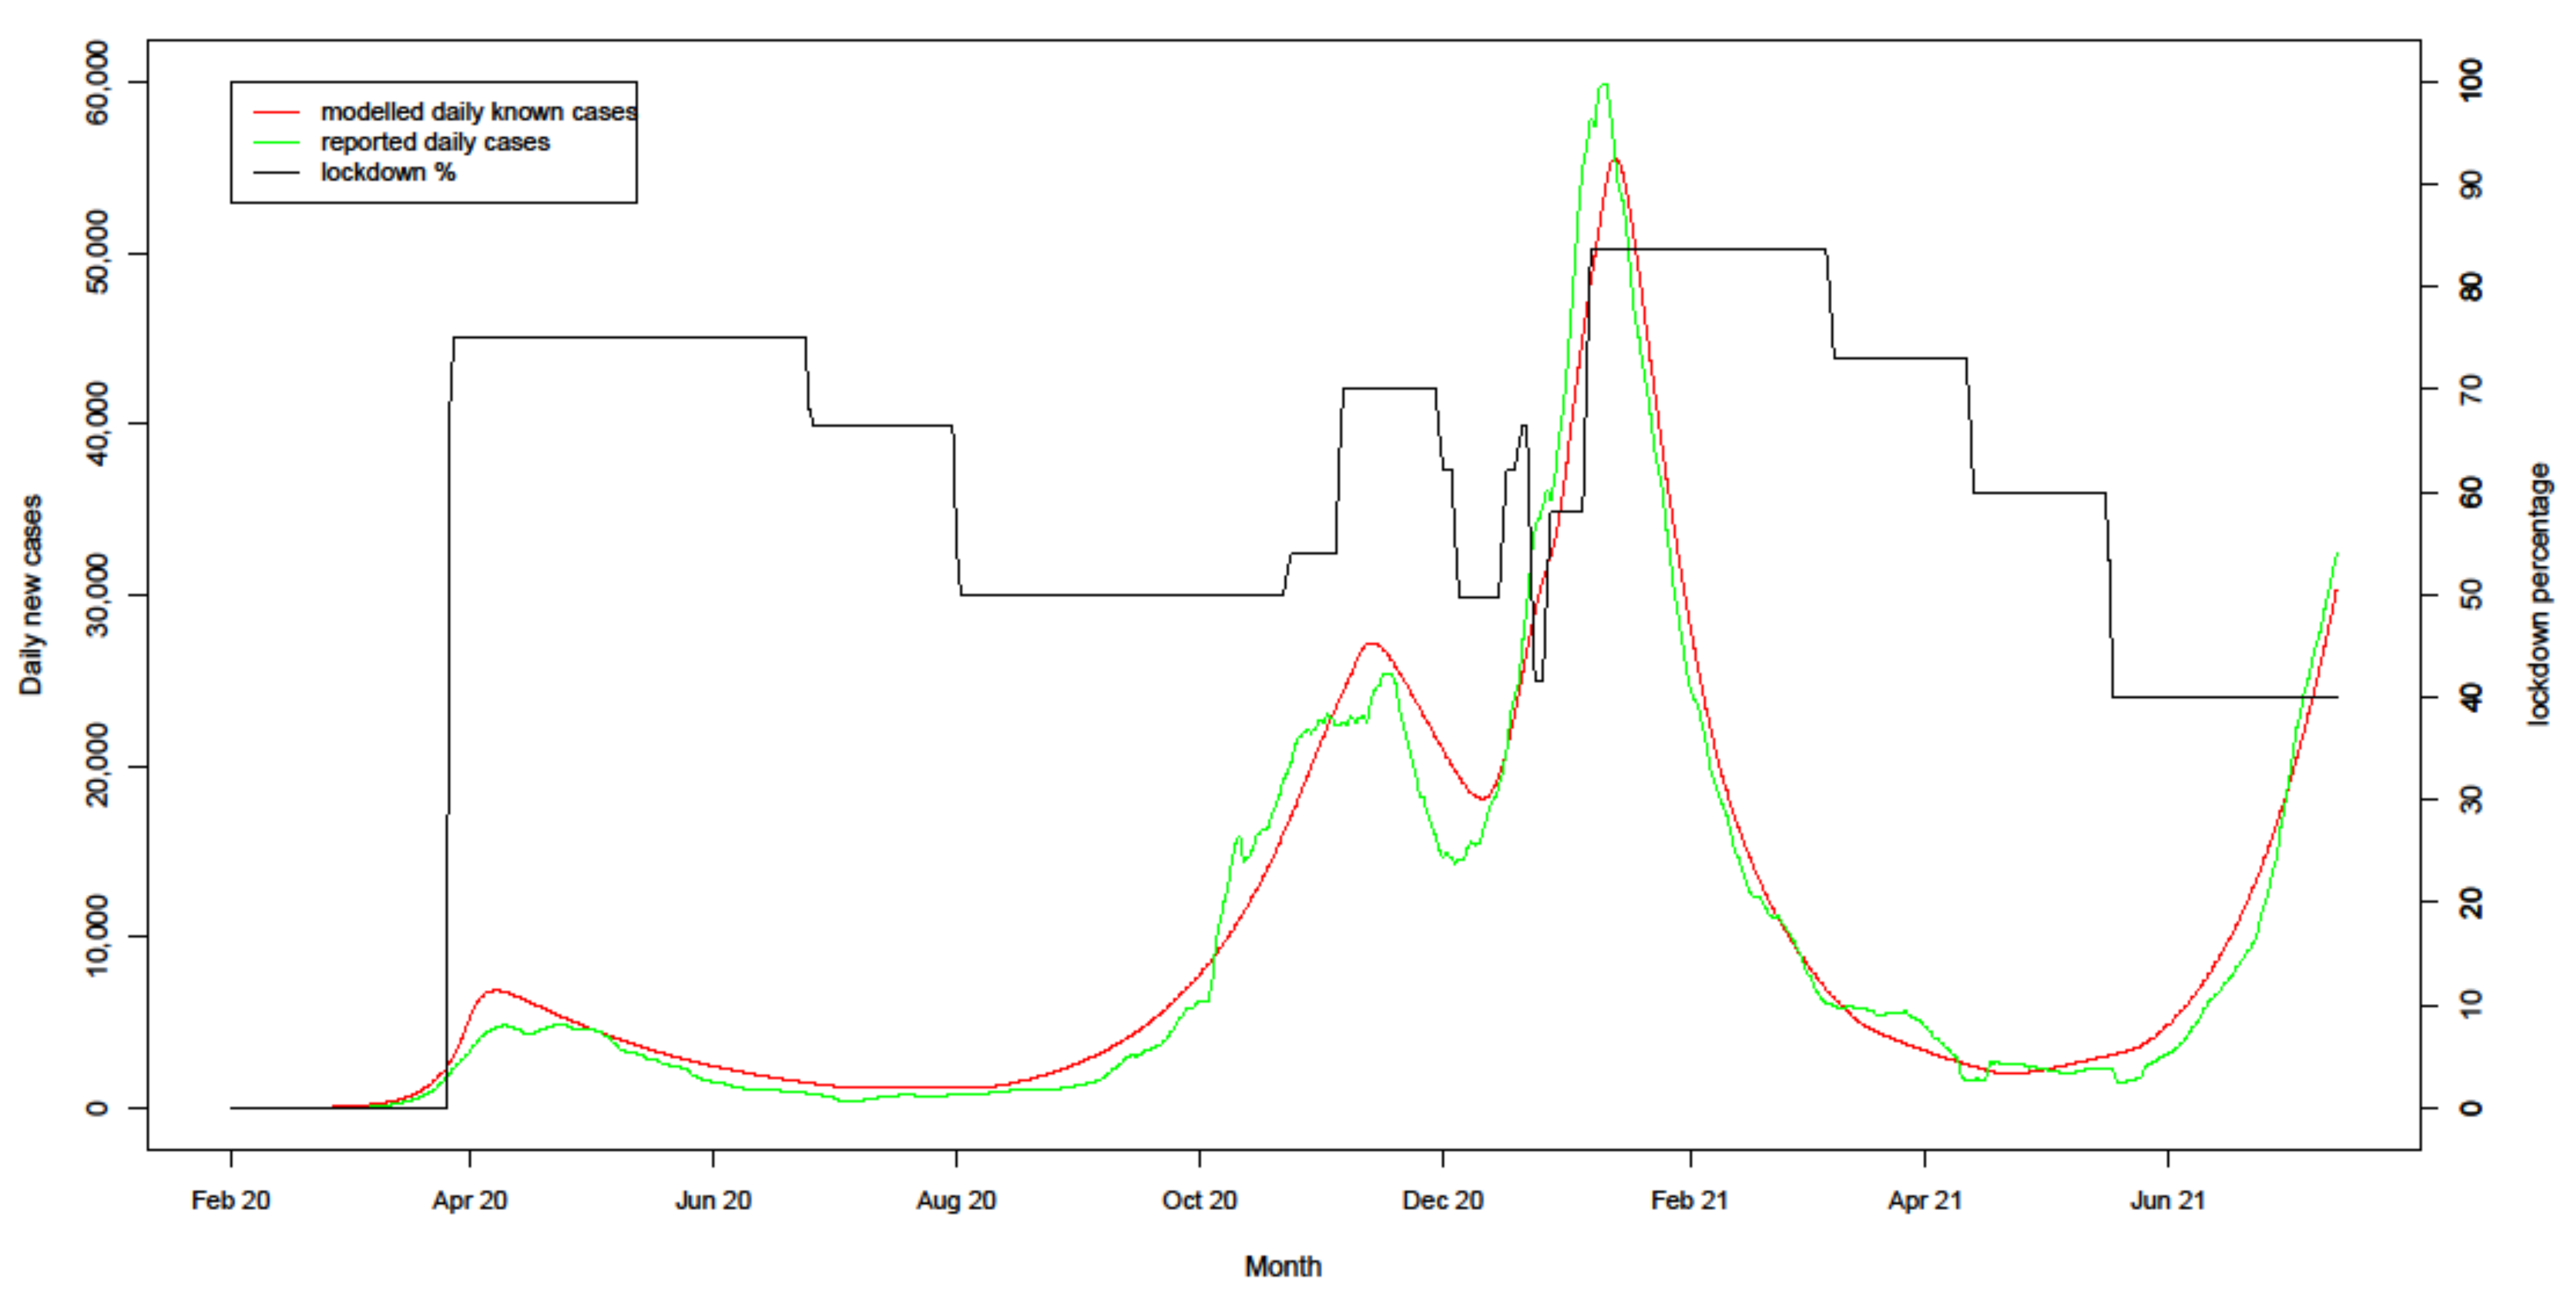
Figure 2 shows the reported historical and modelled 7-day averages for the UK’s new known daily COVID-19 cases from 1 February 2020 to 12 July 2021. The error statistics calculations (R2: = 0.97, RMSPE = 3.6% and Theil’s inequality coefficient = 0.07) confirm a good fit of the simulated results to historical actuals. The lockdown percentage is represented as a black line with its scale on the right axis. The left axis shows the scales for the actual and modelled new known daily cases and deaths, with cases climbing to 60,000 in January 2021. The x-axis markings show the beginning of each month.
The effect of the first UK-wide lockdown, which was estimated as 75% effective [44], can be seen in April 2020, with known case numbers peaking 16 days later. The gradual easing of the lockdown from 5 July 2020 resulted in an increase in known cases from August 2020, with the UK Government ‘Eat out to help out’ scheme estimated to have raised infection rates by 8 to 17% [46]. The lockdown percentage increased from mid-October 2020 in response to rising rates as the English tiered alert system started and Northern Ireland and Wales imposed ‘firebreak lockdowns’, followed by regional restrictions in Scotland and a four-week English lockdown starting 5 November in an attempt to reduce case numbers before the Christmas period. The effect of these consolidated lockdowns was to reduce the known case numbers from mid-November 2020 for 16 days, only for them to climb from 5 December 2020 onwards as the UK moved into its holiday period. The emergence of the more contagious Alpha variant in December 2020 accelerated the new case rate and made a strict lockdown in January 2021 necessary to contain the ‘second wave’. The lockdown was effective in reducing cases, which peaked at 60,000 per day 12 days after the Christmas lockdown relaxation and then fell below 2000 per day in May 2021. However, the Delta variant, which became dominant in the UK in April 2021, combined with easing of lockdown restrictions in April and May, reversed the downwards trend and cases climbed to over 30,000 per day in July 2021.
The optimisation process described in Section 3.2 calculated a relative infectiousness value of 72% for unknown cases, which is in the range supported by the research [5]. The known proportion of 21% of cases at the end of January 2021 was also obtained through optimisation, assuming a logarithmic growth rate from the beginning of the model’s timeframe. This is in the range supported by other models [2] and helps to explain why non-discriminatory lockdowns were adopted as the only effective means of controlling the spread of COVID-19 before vaccines were developed. The known proportion was assumed to increase to 50% by end March 2021 as cases fell, testing capability improved and self-testing became mandatory for certain professions, e.g., teaching. This assumption was validated by a comparison of reported cases against random population sampling.

4.2. Exploring Uncertainty

The scenarios identified in Table 3 were simulated by varying the selected variables whilst keeping other variables at ‘base case’ levels.

4.2.1. Uncertain Immunity Length

The ‘base case’ defined in Table 3 assumes 8 months average immunity, either after vaccination or recovery from infection [15], a 65% reduction in transmission protection after one dose, a 70% reduction after two doses of either the PB or AZ vaccine and 70% protection from reinfection after recovery from COVID-19 [20]. Research to date reports that immunity is likely to vary between 5 and 12 months [15,16,17,19], and Table 4 shows the simulated scenarios. Immunity against emerging variants may be different and is not accounted for in this model.
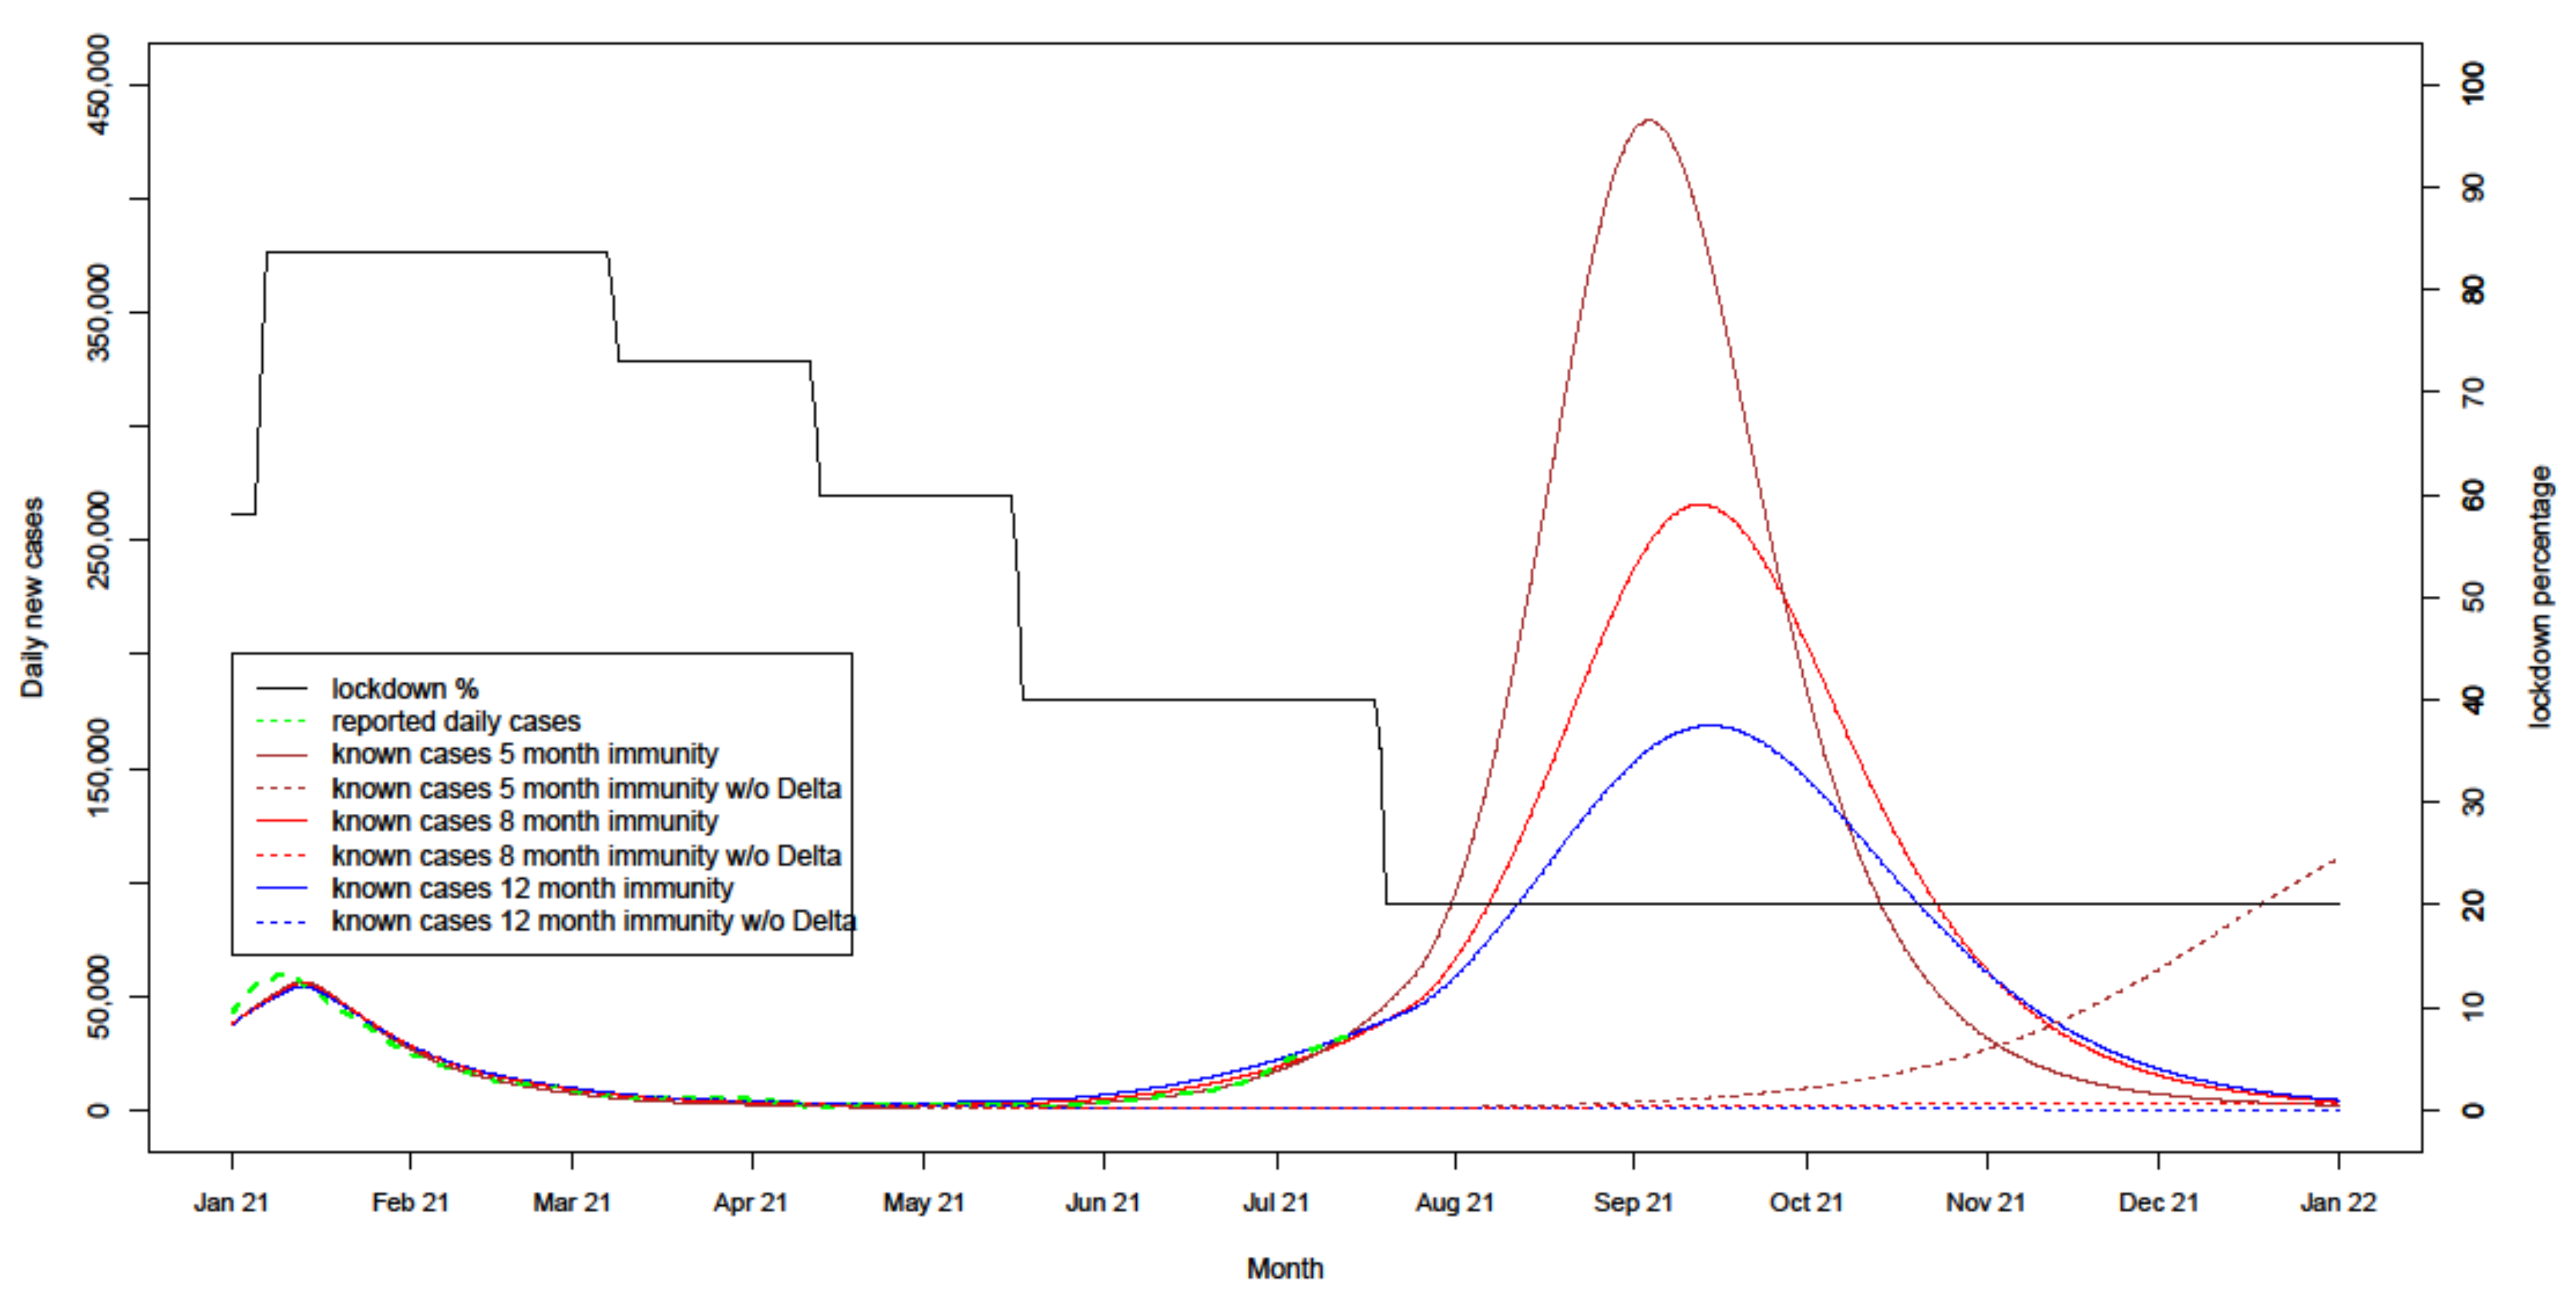
The model was run from 1 February 2020 to 31 December 2021 to simulate the ‘base case’ of 8 months immunity and shorter and longer average immunity lengths of 5 and 12 months. Figure 3 shows the projected daily known cases for the three scenarios, assuming a stepped lockdown percentage decrease from March 2021 onwards, which reduces to 20% in mid July 2021 according to the current UK Government timelines [43]. The figure of 20% assumes that some distancing restrictions are still in place until the end of 2021, that people will continue to exercise caution and that businesses will continue risk reduction policies such as disinfection and management of crowds.
For the ‘base case’, the solid red line in Figure 3 shows the model’s projection of a continuing rapid increase in known daily cases, driven by increased transmission opportunities and an increased susceptible population percentage as those infected in early 2021 lose their immunity. This peaks in September 2021 at 260,000 daily known cases when population immunity created by both vaccination and recovery from infection reduces the susceptible percentage and numbers start to fall. This projection is starkly different from the pre-Delta variant scenario, which is represented by the dotted red line. In this scenario, immunity from both vaccination and recovery would have contained daily known cases below 3000 from May 2021. Increasing the average immunity length to 12 months is projected to contain the surge to 160,000 daily known cases, peaking in October 2021. If immunity only lasts for 5 months, the surge is higher and a peak of 430,000 daily known cases is reached in August 2021. A 5-month immunity scenario assuming no Delta variant would also see cases rising more slowly, peaking in December 2021. The 5-month immunity scenarios, however, seem unlikely as actual known daily cases are not surging fast enough in July 2021 to align with the model’s projections.
The results shown in Figure 3 are based on the assumption that from May 2021 onwards, 50% of cases continue to be detected due to increased testing capability. However, this detection rate may well be unachievable at these high case levels, in which case reported results would show lower numbers than those projected in the simulation.

4.2.2. Uncertain Immunity Effectiveness

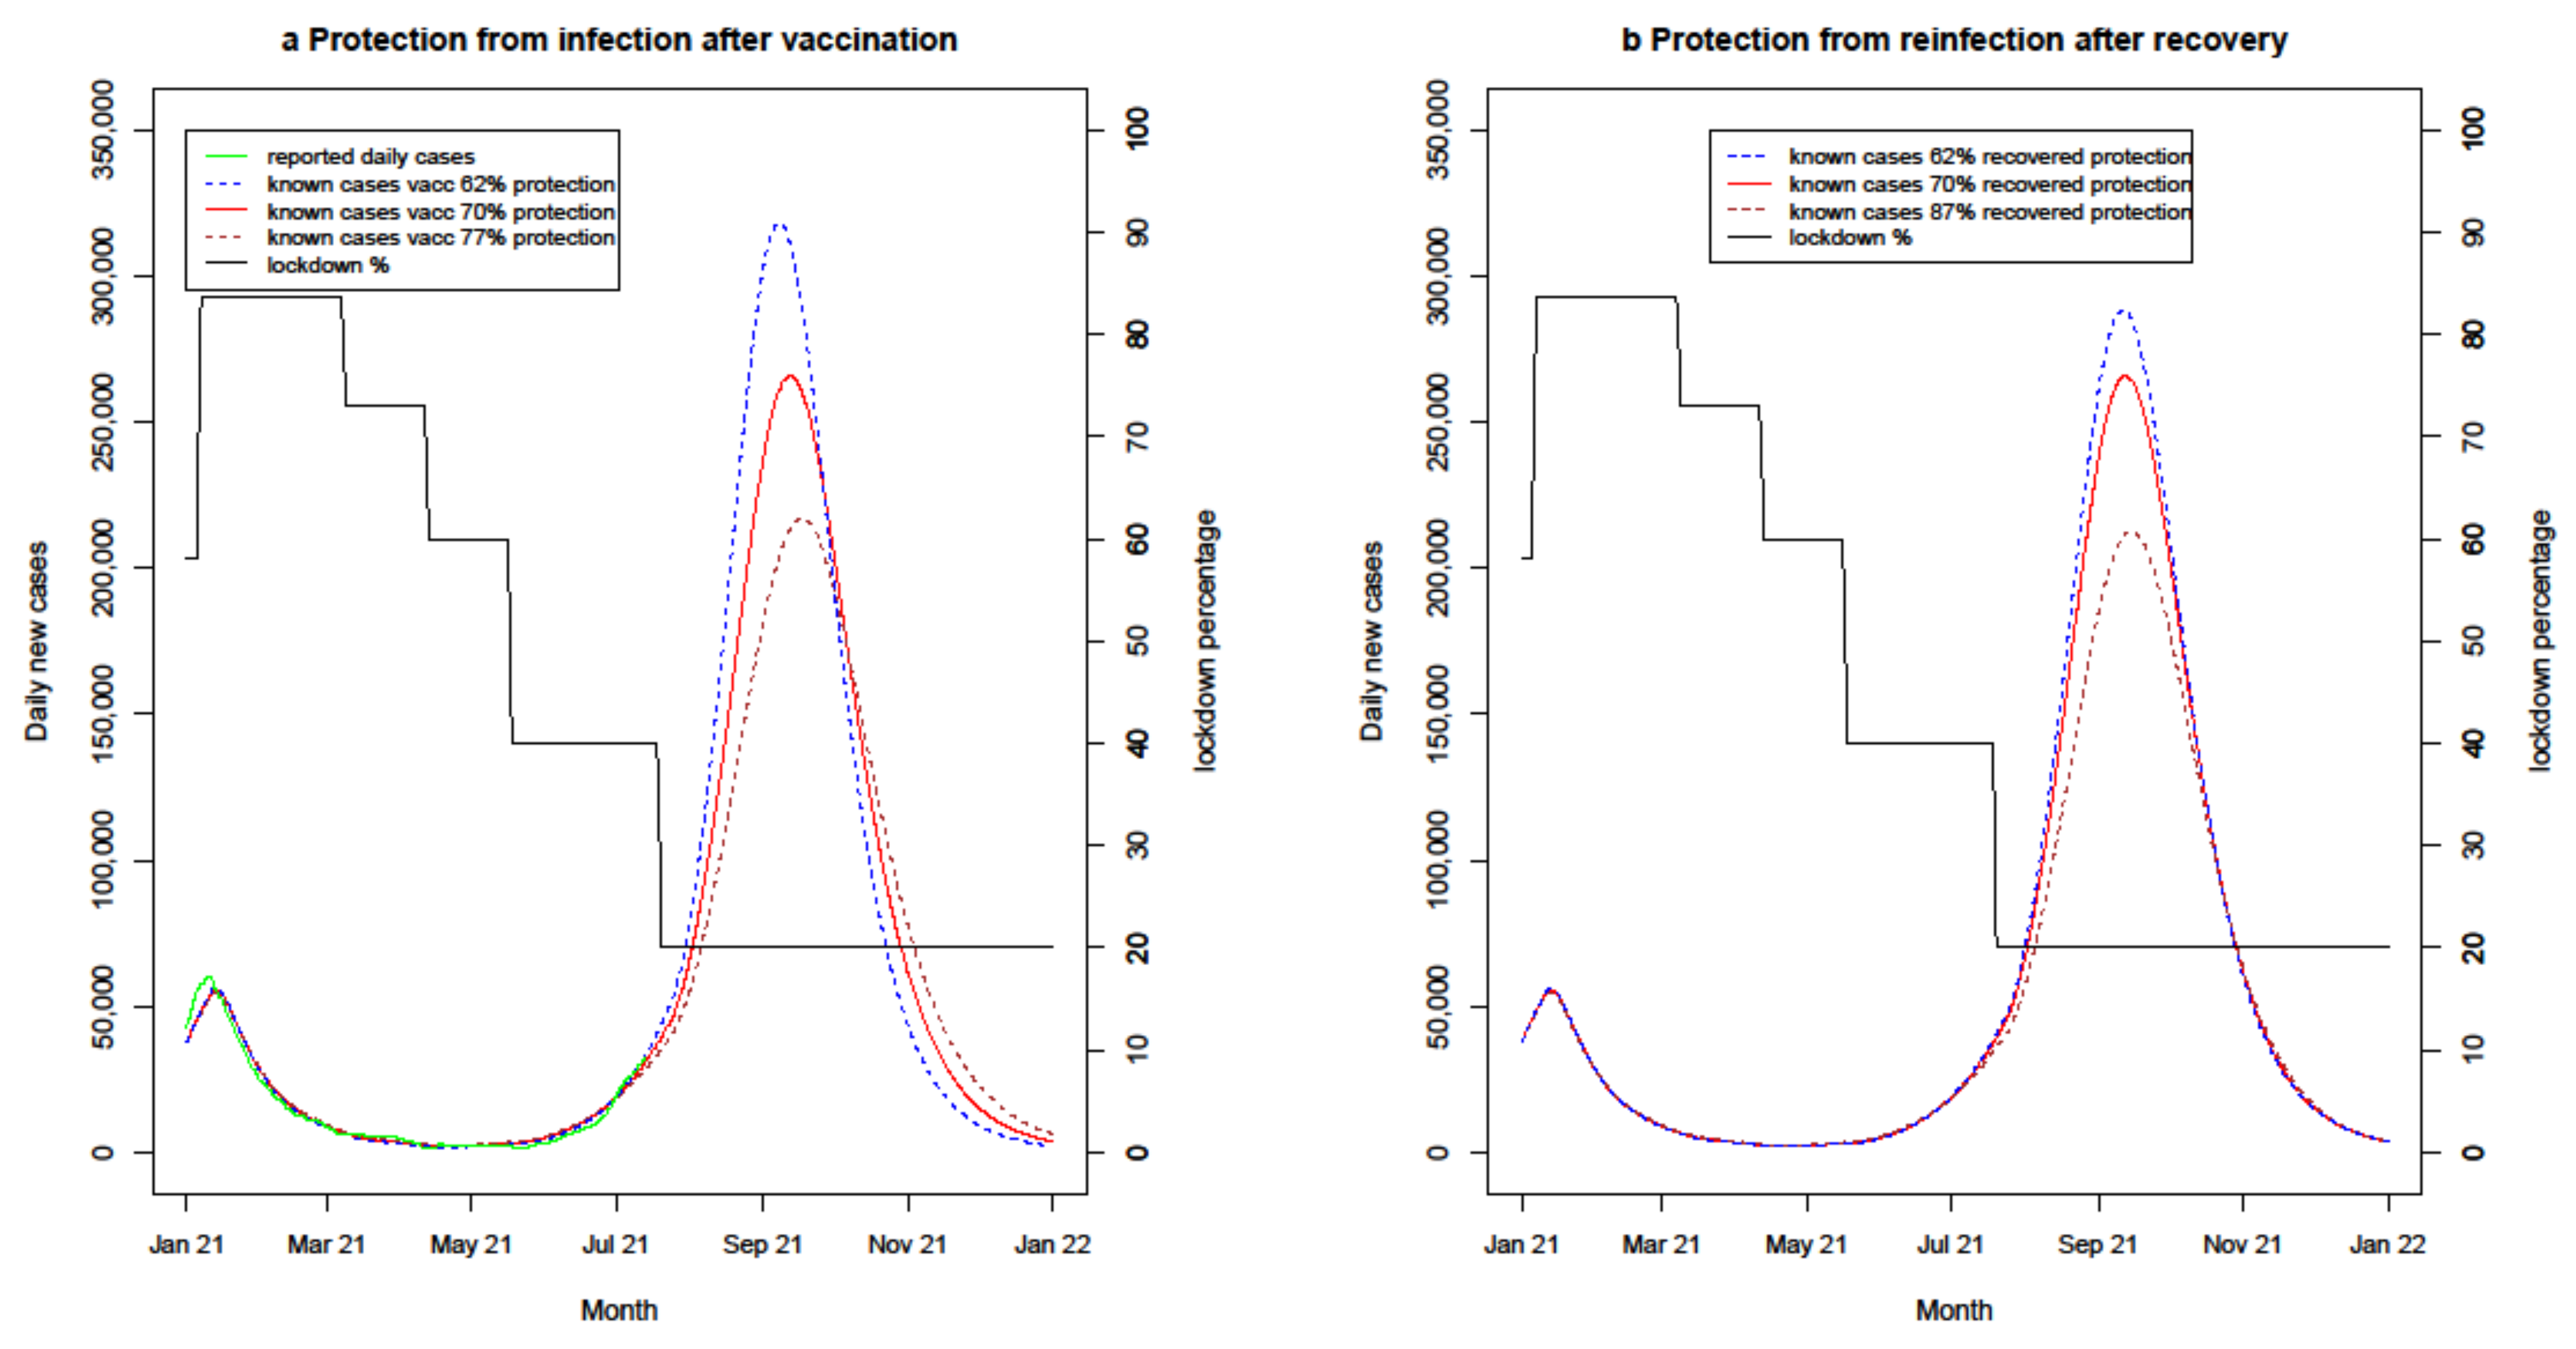
Research has produced a range of effectiveness results and confidence intervals for both recovered and vaccinated immunity. Table 5 shows the varying immunity effectiveness scenarios simulated. The scenarios reflect the 95% CI range of post-vaccination and post-recovery immunity protection from the results of clinical research [20], assuming the ‘base case’ for other values [15,16,17,19,20]. The 95% CI ranges for recovered and vaccinated immunity are different, and this is reflected in the scenarios used. Figure 4 shows the modelled projections for these scenarios.
Figure 4a projects that if post-vaccination protection from infection is at the lower boundary of 62% after two doses, known infections will build to 320,000 in September. Using the higher boundary of 77% protection after two doses, the model projects that known daily cases will peak at 210,000 before dropping as herd immunity from both vaccination and recovery reduces the susceptible percentage.
Figure 4b shows the projected range of known cases for recovered immunity variation. The model projects that the lower value of recovered immunity of 62% will result in a daily known case surge to 280,000 in September 2021, reducing to 215,000 with the higher value of 87%. As described in Section 4.2.1, 50% detection at these high daily case numbers may be unachievable, which would reduce the reported case peaks.

4.2.3. Uncertain Known Proportion

The results presented so far show only the known proportion of COVID-19 cases in the UK. As vaccination reduces not only the case numbers but also the average case severity, the unknown proportion may increase further as the proportion of mild or asymptomatic cases grows, even with increased ease and availability of testing. Table 6 shows the scenarios modelled.
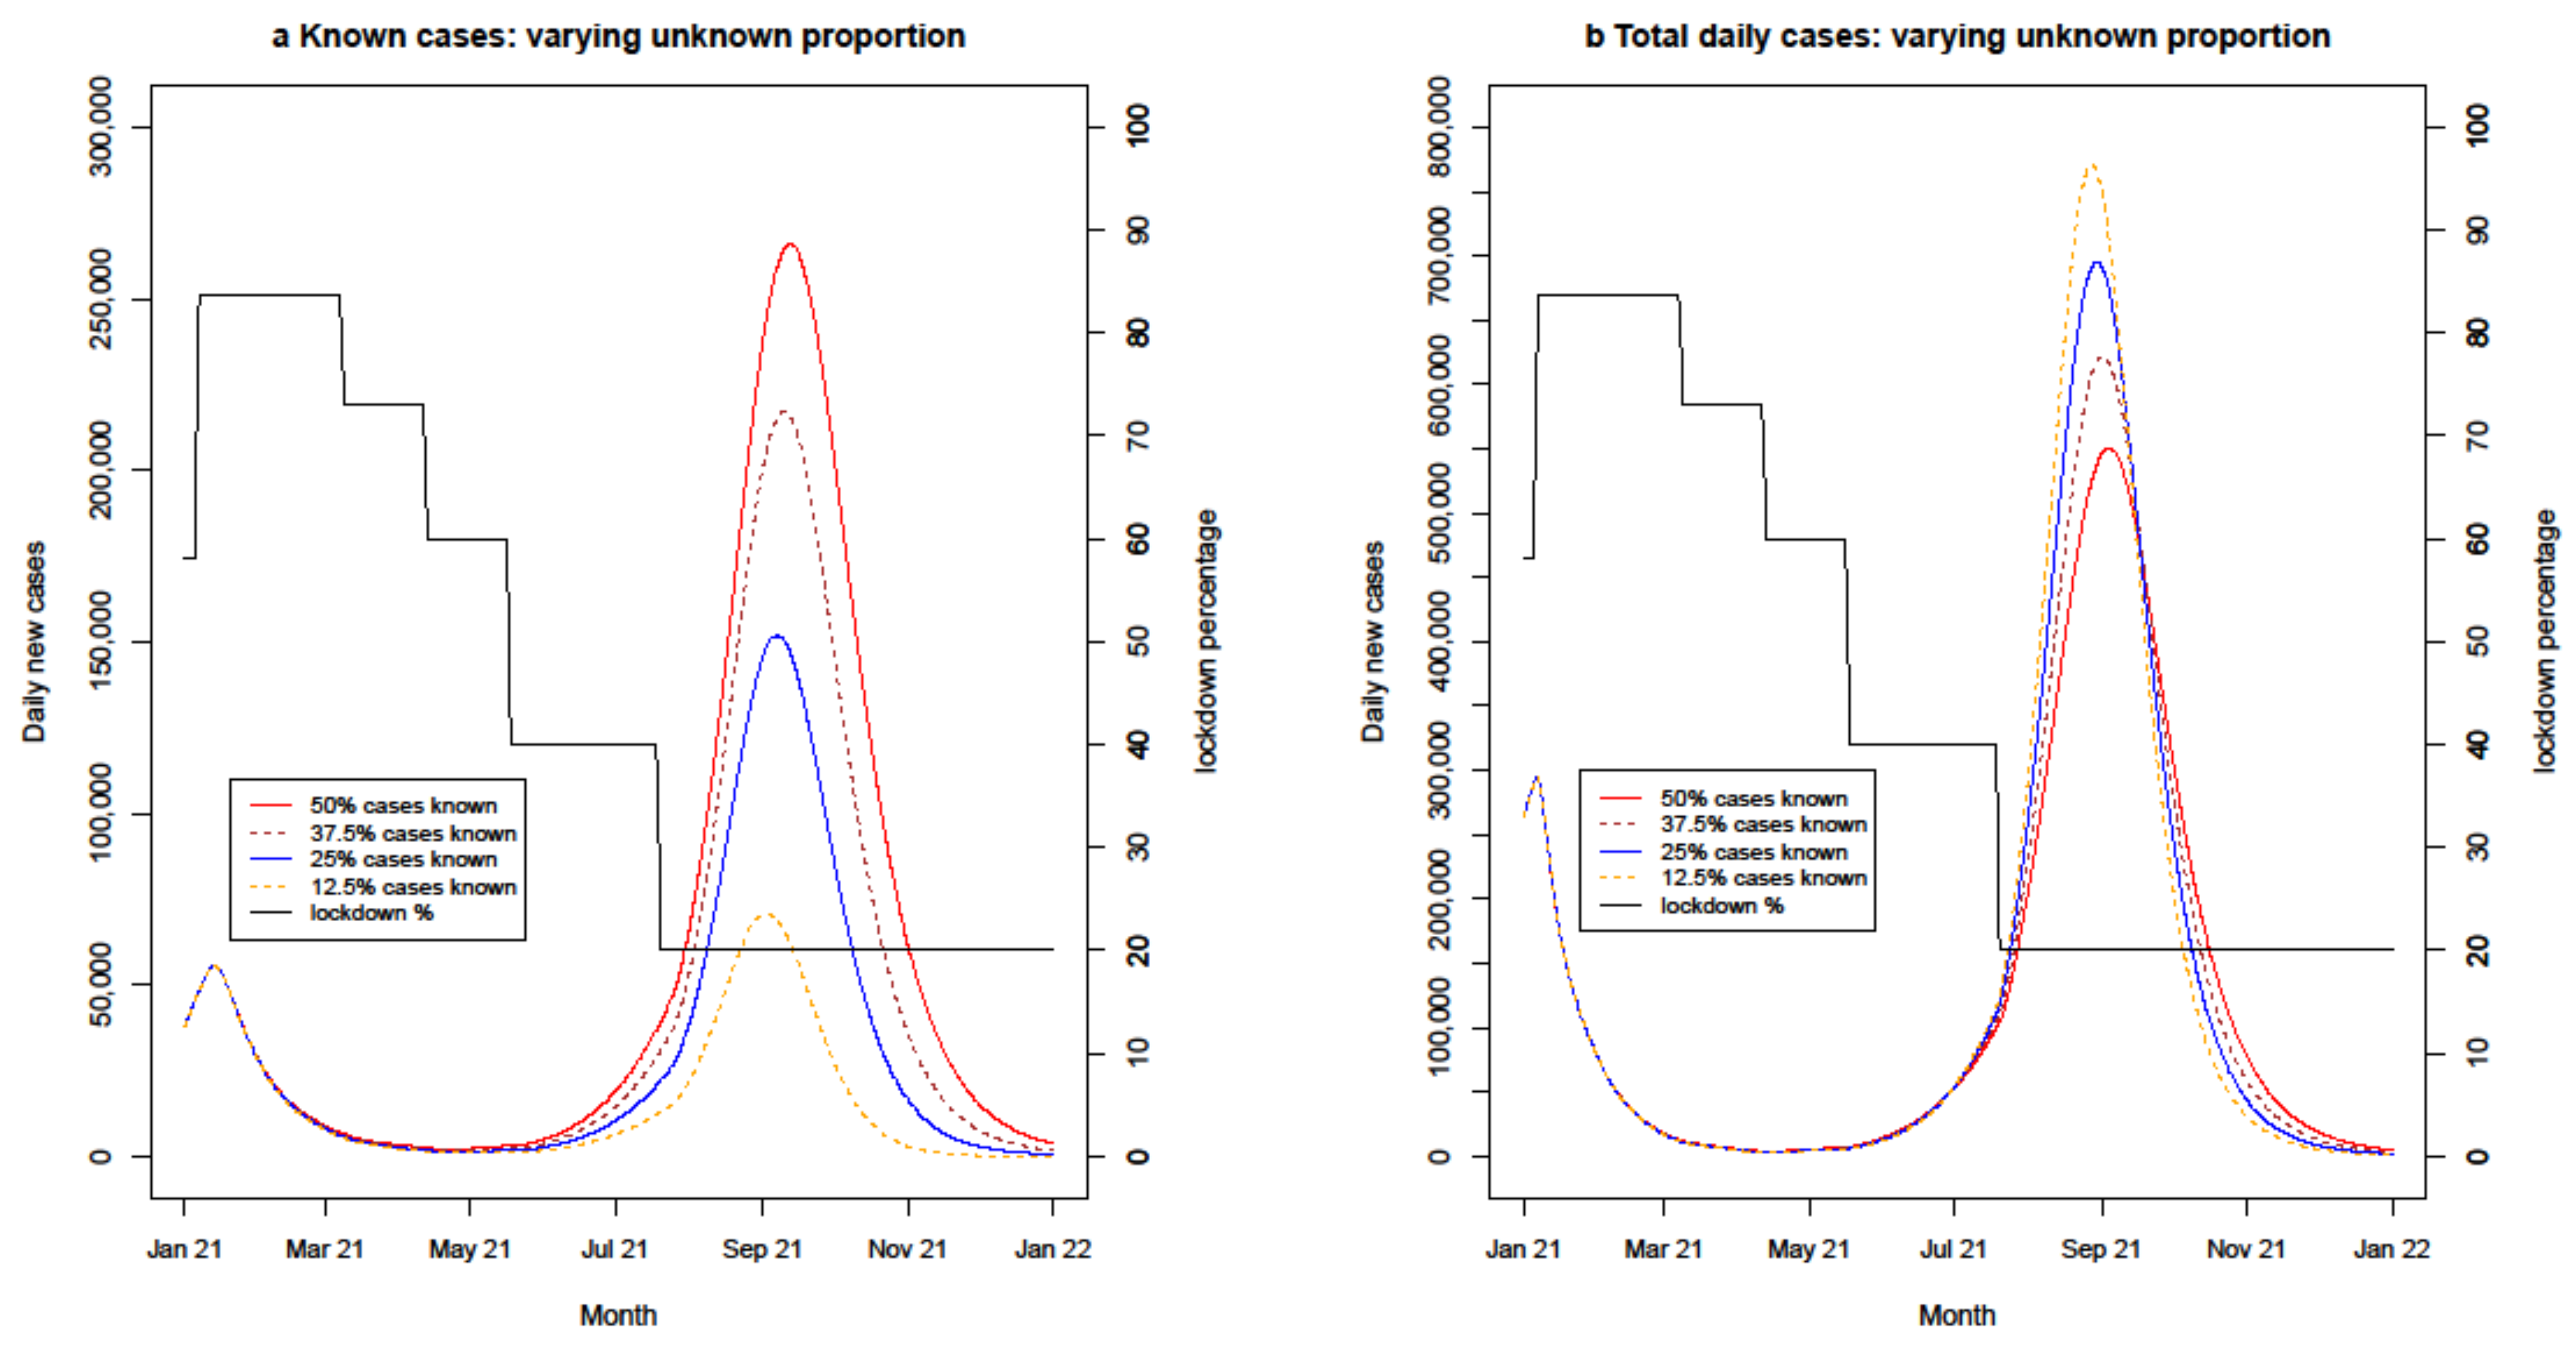
Figure 5a,b project the daily known and total cases for 2021 for the ‘base case’ scenario with the percentage of known cases to unknown ranging from 50% to 12.5%. The base case assumes that 50% of cases are known.
As expected, the projected known case numbers drop as the unknown proportion rises. The projected total cases would be expected to increase when a lower percentage of the cases are known because transmission is not being managed through isolation of infected individuals. However, because unknown cases are assumed to be less infectious and of a shorter duration than known cases [26,27], a 75% reduction in the proportion of known cases (from 50% to 12.5%) generates only a 40% increase in total case numbers.

4.2.4. Modelling the Effect of Interventions

The UK Government’s planned landmark date of 21 June 2021, ‘Freedom day’, when masks could be removed and other significant restrictions would be lifted, was moved to 19 July as daily case numbers started to rise in May 2021 [47]. This rise, driven by the more transmissible Delta variant and the eased restrictions, raises the question of whether further lockdowns should be considered despite the increasing vaccination numbers. From the results shown in Figure 3, Figure 4 and Figure 5, it can be seen that varying immunity length has a larger impact on case number projections than varying vaccination and recovered immunity protection within their likely ranges. Therefore, potential lockdown scenarios were explored with differing immunity length assumptions, as shown in Table 7.
Figure 6a,b simulate the effects of a Government policy which reacts to daily known cases rising above 50,000 by increasing lockdown levels by 20%. The 20% is a theoretical number which could be made up of a number of different measures, e.g., self-isolation restrictions, masks, number limits. A 7-day reaction time is built into the simulation, in line with current Government policy.
Figure 6a projects that for an 8-month immunity length, a 3-month-long return to the 40% lockdown level would be required from late July 2021 to return cases to below 50,000. For a 12-month immunity length, a 2-month return to the 40% lockdown level would be required, starting at a similar time. Figure 6b projects that for a 5-month immunity length, the 50,000-case threshold will be breached in July and continuing lockdown at the July levels would reduce the peak daily numbers to 250,000 before they drop down in November 2021.

4.2.5. Lockdown Policy Sensitivities

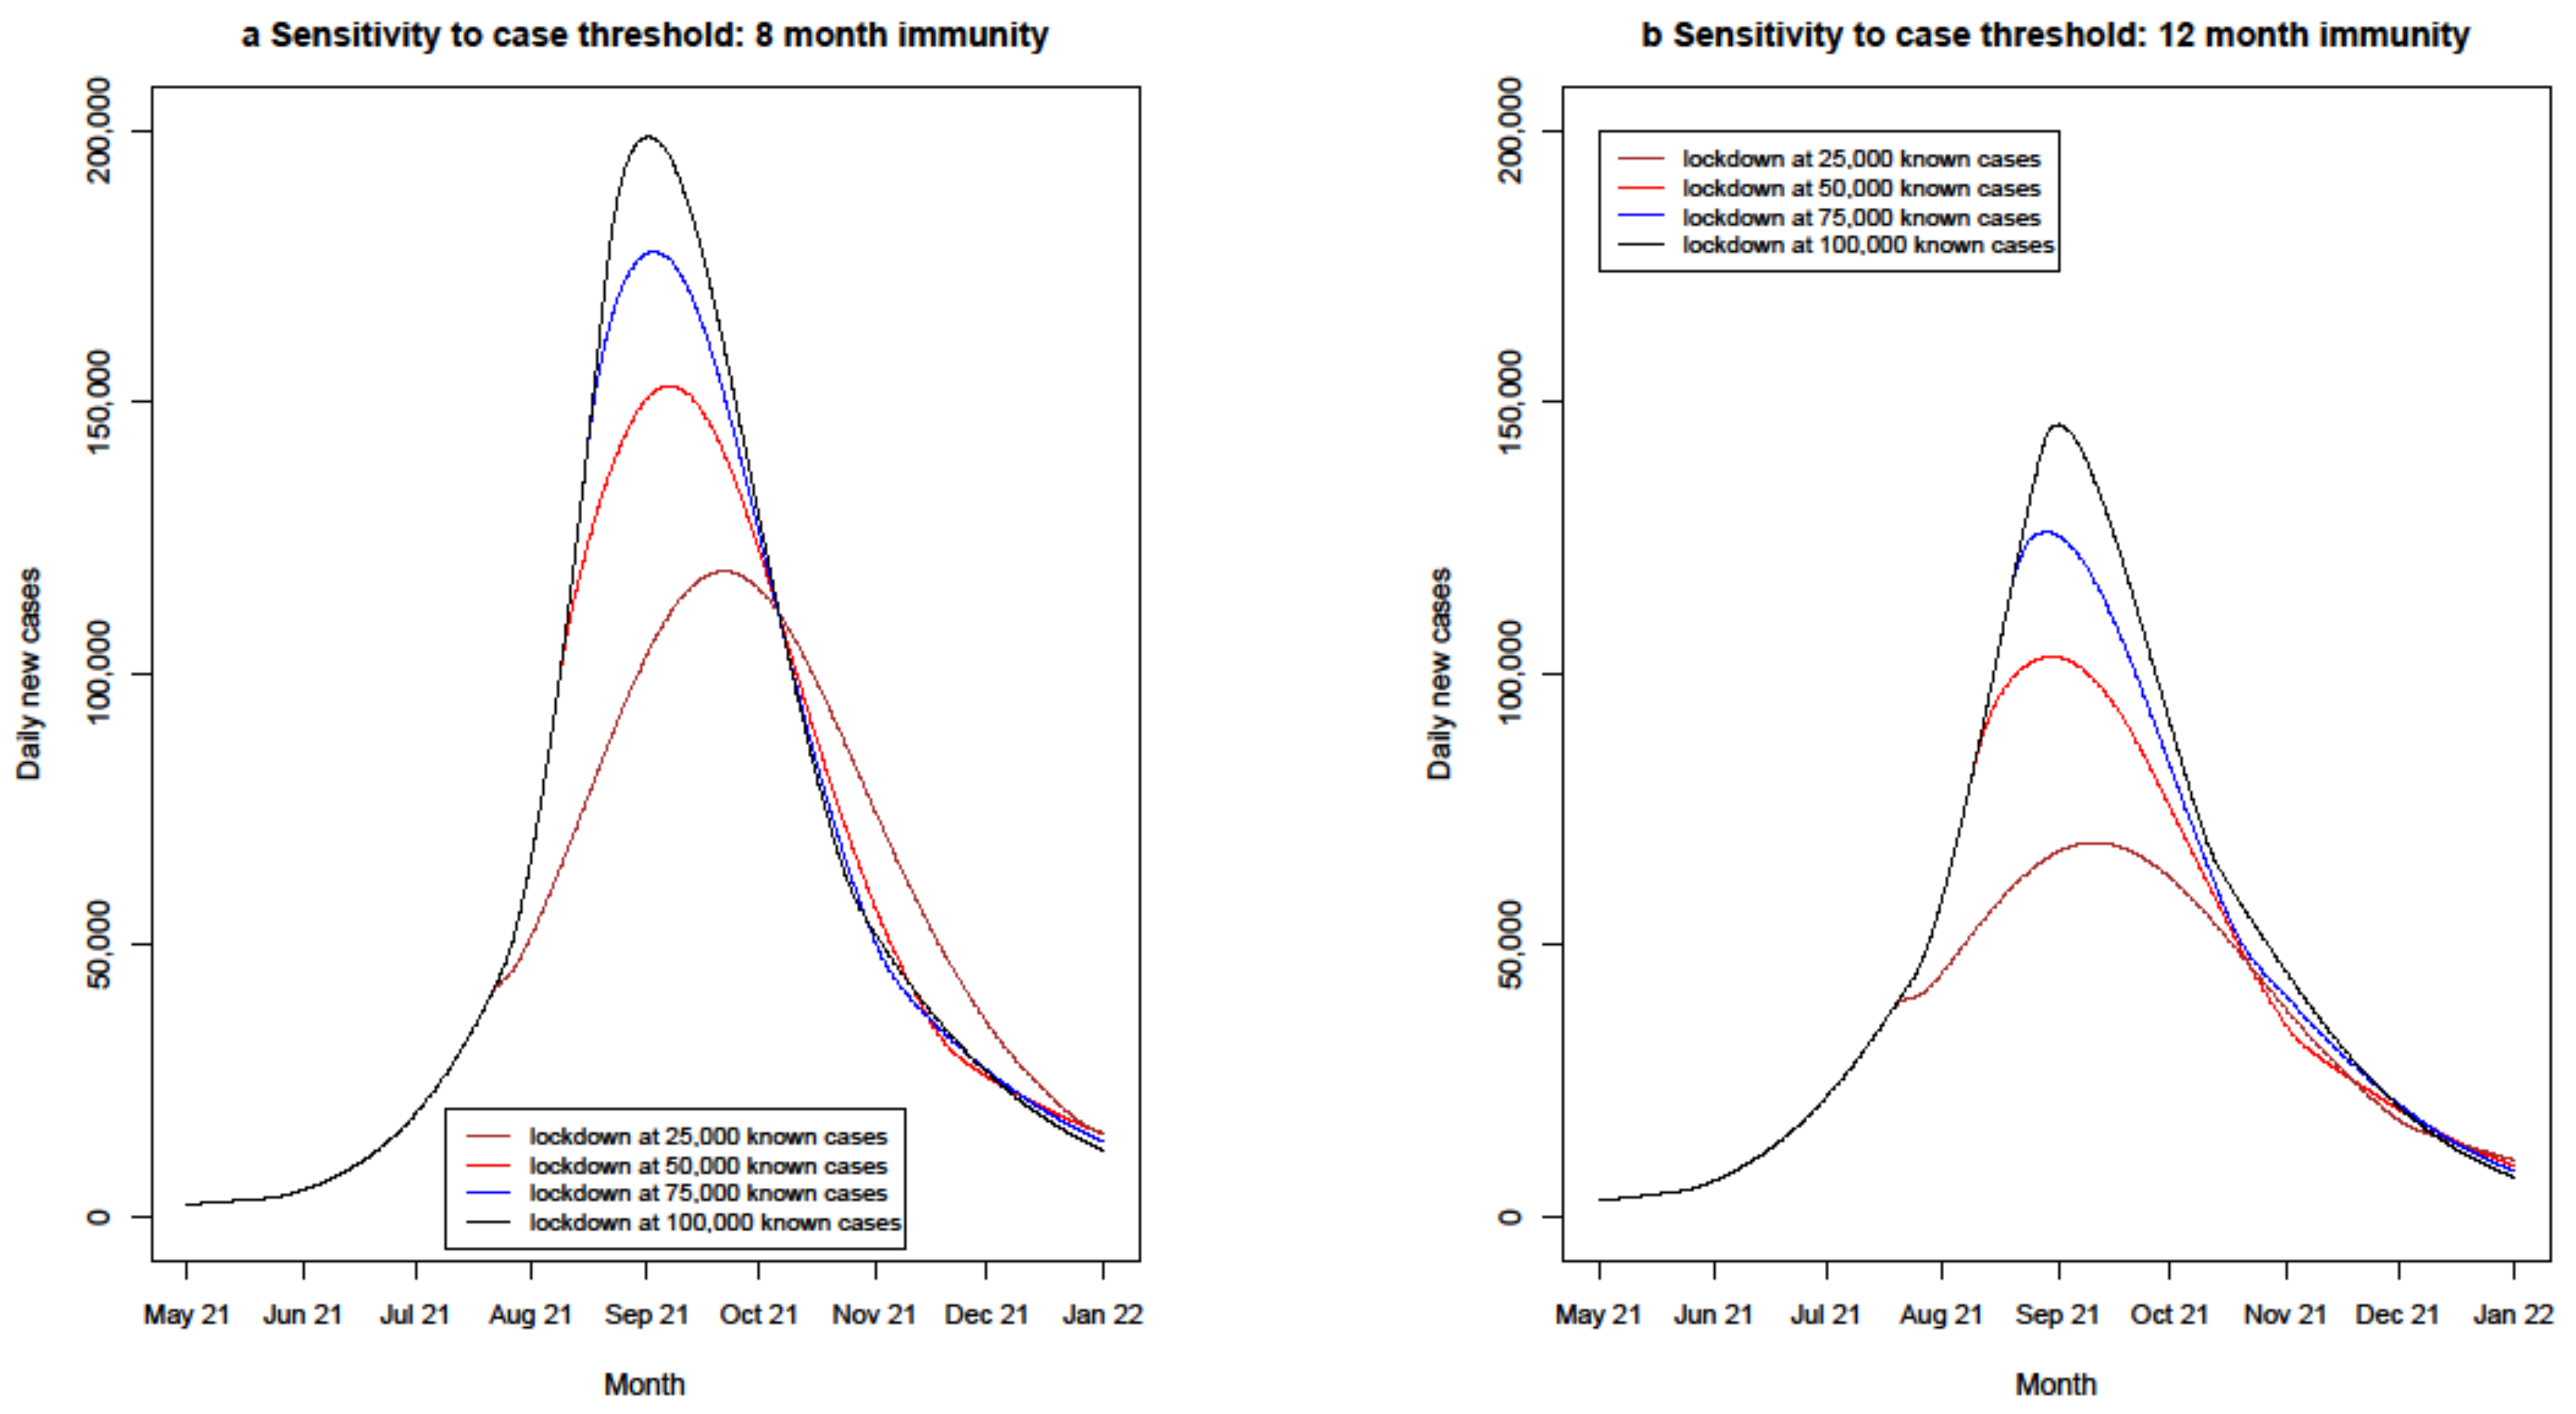
The scenarios shown in Table 8 were used to simulate the sensitivity of the lockdown policy to the length of time before initiating lockdown.
Figure 7 projects the results of varying the lockdown notice period between 3.5 and 21 days after known cases reach 50,000. Figure 7a shows that the 8-month immunity ‘base case’ with a 20% increase in lockdown percentage results in a shorter delay and a lower peak in cases. The highest peak is projected for the 21-day lead time. Figure 7b shows the same pattern for the 12-month immunity assumption, with maximum daily infections reaching 96,000 for a 3.5-day lead time and 136,000 for a 21-day lead time.
The scenarios shown in Table 9 were used to simulate the sensitivity of the lockdown policy to the case threshold before initiating lockdown.
Figure 8 projects the results of varying the daily known case threshold for initiating lockdown between 25,000 and 100,000, assuming a 7-day lead time as per the current UK Government policy. Figure 8a shows that, for the 8-month immunity ‘base case’, the lower the case threshold, the lower the peak of daily cases. In all scenarios, cases fall rapidly as the susceptible percentage reduces due to increasing population immunity from the large numbers of recovered infections and vaccinations. Figure 8b shows the same pattern for the 12-month immunity scenario with lower peaks because of the greater level of retained recovered population immunity.
The model was used to simulate extreme lockdown scenarios as shown in Table 10.
The extreme effects of a high threshold of 100,000 cases and a 21-day delay before lockdown initiation were projected in Figure 9a; for the 8-month immunity base case, the case threshold is reached in August 2021 and lockdown is initiated in early September 2021, continuing for 2 months with daily known cases peaking at 250,000. For the 12-month immunity scenario, a shorter lockdown starting in September is required, and daily cases peak at 160,000. Figure 9b projects the effect of a 40% lockdown increase rather than the 20% used in other scenarios and shows how, for the 8-month immunity base case, reduced transmission opportunity lowers daily cases from a peak of 107,000 to below the 50,000-case threshold, requiring another lockdown phase in late 2021 to reduce case numbers again. The 12-month immunity scenario only requires one lockdown to control case numbers as ongoing vaccinations continue to reduce the susceptible percentage.

4.2.6. Change in Susceptible Percentage

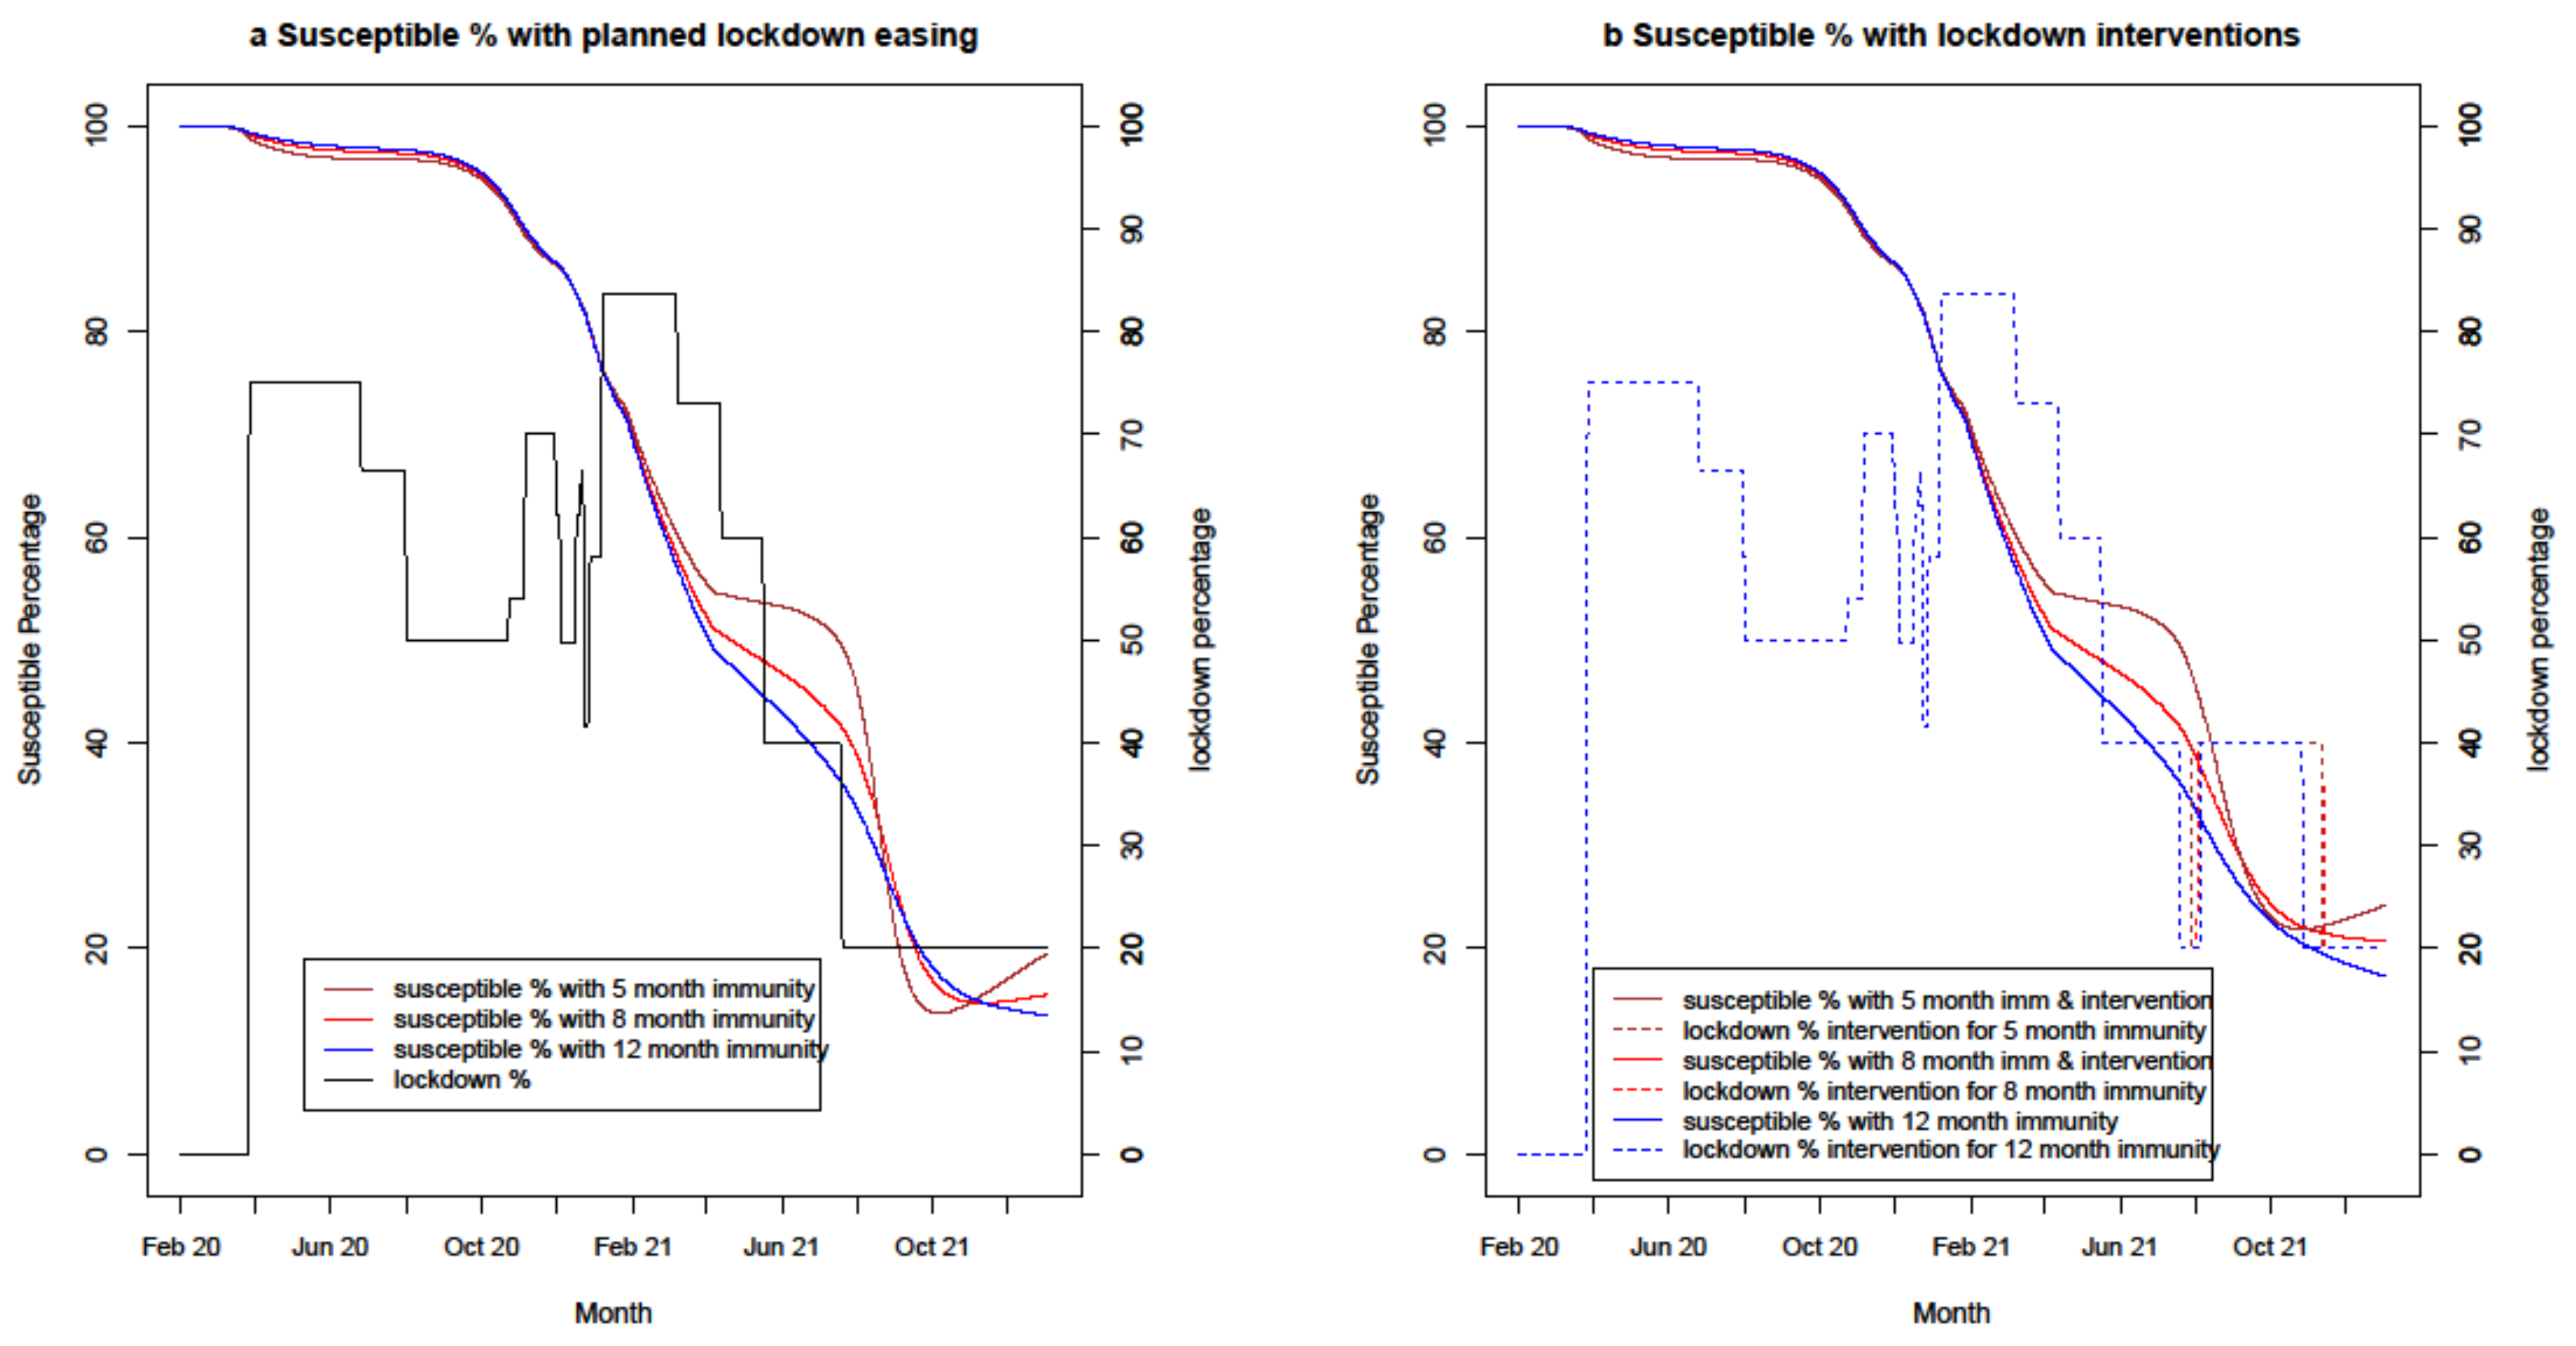
In February 2021, 100% of the UK population was susceptible to infection with COVID-19. The susceptible percentage dropped as people became immune either through infection or vaccination. The movement of the susceptible percentage is illustrated in Figure 10 for immunity length variation scenarios, with and without new lockdown interventions after June 2021, as shown in Table 11.
Figure 10 shows the susceptible percentage reducing as the pandemic progresses. The steeper downward slopes correlate with periods of higher infection rates during which more people acquire recovered immunity. In Figure 10a, for the 5-month immunity scenario, the susceptible percentage drops slowly through April to July 2021 as increasing numbers are vaccinated. It then falls steeply to 13% because the infection surge, which is seen in Figure 3, generates recovered immunity before increasing in September 2021 as this immunity erodes. The 8-month and 12-month immunity scenarios follow a similar pattern but with less pronounced slope changes.
Figure 10b shows the susceptible percentages for the three immunity scenarios with lockdown interventions implemented. For all scenarios, lockdowns as illustrated in Figure 6 are required to reduce daily known cases below 50,000. These have the effect of slowing the susceptible percentage reduction by reducing case numbers and hence generating less recovered immunity.

5. Discussion

5.1. Implications of Findings

The UK Government’s approach to the COVID-19 pandemic in the UK, though initially hesitant, turned around in early 2021 when strong lockdown measures were put in place and an ambitious vaccination programme was commenced. The UK’s aggressive pursuit of vaccination is paying off, with half the population fully vaccinated at the beginning of July 2021. Were it not for the emergence of the Delta variant, assuming that immunity gained from either infection or vaccination lasts at least 8 months, the UK would be assured that it could lift restrictions and keep COVID-19 case numbers at a low level throughout the remainder of 2021. However, sharply rising case numbers in July 2021 are changing the landscape, with health workers once again fearful of being overwhelmed by COVID-19 cases [48]. The vaccination programme has reduced both the transmission and severity of the disease, meaning that hospitalisation and death rates will be greatly reduced, but with half the population still unvaccinated or incompletely vaccinated, and the scenarios projecting hundreds of thousands of daily cases, daily deaths are likely to reach into the hundreds [36] without containment measures.
The most significant influencer of ongoing infection rates, other than the emergence of another more infectious variant, is likely to be the length of protection conferred by vaccinated and recovered immunity. Immunity length is a significant unknown, which will only become clearer as results from longitudinal studies on vaccinated and recovered individuals emerge. The modelling used by the UK Government’s SAGE advisory group [13] specifically excludes waning immunity and the future emergence of variants, so these are significant gaps. There are no tools to predict the profile of future variants but further research to understand immunity length, particularly vaccinated immunity, which has a more significant influence in the UK than recovered immunity, is critical for informing policy and for reducing the uncertainty surrounding the various scenarios.
As cases surge, the vaccinated sector of the population will be protected from serious illness and death but vaccination status in the UK is uneven, with lower uptake amongst disadvantaged groups and ethnic minorities, leaving these groups vulnerable. The unvaccinated population will only be effectively protected through herd immunity, which research indicates will be reached with a susceptible percentage of 30% or less [49,50]. The limits on the percentage of the population able to be vaccinated will become the main constraint to achieving herd immunity. About 22% of the UK population are not currently eligible for vaccination (21% under 18, 0.7% pregnant), which means that 90% of eligible adults need to be vaccinated to achieve a 70% total. With the highest infection prevalence in teenagers and 20–24-year-olds [47], extending vaccinations to children is a logical next step to increasing herd immunity, and further research and trials on the safety and efficacy of vaccines for children and pregnant women are required to inform policy. Continuing education and reassurance for the vaccine-hesitant sector of the population is also required to address resistance. It seems likely that for herd immunity to be maintained, regular booster doses of COVID-19 vaccinations will be needed; the practice of immunizing newly eligible people will be insufficient to control the spread of the virus.
Cases are likely to shift from known to unknown because of the reduction in infection severity post-vaccination. As nothing other than lockdown appears to work when there are many unknown cases, a capability which maintains or improves the proportion of known cases is important. The potential for more unknown cases, explored in Section 4.2.3, is a concern and strengthening policies which encourage routine testing mitigates against the growing unknown proportion, and thus the unseen burden of disease. The projections for known cases in Figure 3 and Figure 4 are based on the known proportion remaining at 50%, which is why they are so high in some scenarios.
The current Government policy of 7 day’s warning of a change in lockdown status seems a reasonable balance between people’s need for notice and the infection growth which takes place in those 7 days, although there is a case for reducing notice to curb growth. Any argument for a low lockdown case threshold to curb growth has been overtaken by events in July 2021, with over 50,000 daily cases being reported. The load on the health services will be a critical consideration in decisions about further restrictions; modelling that is outside the scope of this article.

5.2. Modelling Discussion

The UK Government’s SAGE advisory group uses three models from the Imperial College London, Warwick University and the London School of Medicine and Tropical Hygiene groups [13]. The assumptions used by the models are documented, but the public cannot easily see or understand the models or the process by which the results are obtained. This generates mistrust and skepticism, especially as the incorporation of new factors such as the emergence of the Delta variant cannot be done instantaneously.
This model, whilst it has more limitations than the larger models, has the advantage of being able to be displayed on one page, making it potentially more accessible and transparent. It is an aggregated model, with no split into age bands with their differing profiles and vulnerabilities. It does not account for urban/rural differences or for country differences within the UK. Many aspects of the simulation, for example, vaccine rollout ramp up and the emergence of the Alpha and Delta variants, are simplified. However, it is a useful tool for representing COVID-19 transmission in the UK and can be used to project the effects of policies and interventions across a range of uncertainties.

5.2.1. Uncertainty

The model is based on a set of significant assumptions based on evolving clinical research which suggests a range of scenarios. Of particular importance are:
  • length of recovered immunity;
  • vaccine efficacy in reducing transmission;
  • duration and relative infectiousness of asymptomatic and mildly symptomatic cases;
  • ongoing uncertainty on the proportion of unknown cases which continue to drive infections.
The strategies for dealing with uncertainty in COVID-19 modelling proposed by Wang/Flessa [51] have been followed for this modelling exercise. It is evident both from the results and the discussion that changes in key assumptions, including future lockdown percentages, can have significant impacts on the projections in the model. Changes in the vaccine mix may also change the model projections. Every month that the pandemic progresses, new research with a direct bearing on the model assumptions is produced, so there is an opportunity for ongoing refinement.

5.2.2. Confidence in the Results for Given Assumptions

An important decision in the modelling process is which values to fix as constants and which to determine through a ‘try for fit’ calibration process. If one attempts to vary all of the assumed values in the model, there are too many degrees of freedom to be able to obtain meaningful results. It is certainly possible to obtain similar results with different parameter values, in line with the concept of equifiniality, which demonstrates that different sets of parameters can lead to the same or similar results [52]. There is a balance between fixing assumptions to reduce the number of values in play, enabling a meaningful optimization process to be run, and choosing to fix assumptions which are not certain enough, introducing error into the model. The method used in this exercise, which relies on fixing values which have research backing and calibrating the other values against historical data through a curve-fitting exercise, has introduced a level of rigour to the process.

5.2.3. Comparison with Other Models

A significant difference between this model and many other models produced is the inclusion of loss of immunity. Most of the earlier COVID-19 models excluded loss of immunity, although Struben recognises it as a factor which will need to be considered as the pandemic evolves [53]. One other UK-specific exception is the ‘Testing and Tracking in the UK’ study from the Wellcome Foundation [54], which concludes that the emergence of a new wave of infection depends on the rate at which immunity is lost. This model supports this finding.
A number of studies investigate the difficult issue of true population infection rates for COVID-19 and the high proportion of unknown infections. The ongoing model comparison reporting from the ‘Our World in Data’ project [2] lists two well-known models from Professor Neil Ferguson’s team at the Imperial College London (ICL) and from the Institute for Health Metrics and Evaluation (IHME), which track the estimated total COVID-19 infections against reported infections for many countries. The ICL model shows, after the ‘first wave’, when testing was immature, total UK cases varied between four and six times the number of known cases, only reducing to roughly double the known cases in late March 2021. The IHME model is more optimistic, showing the total UK cases as no more than double the number of known cases after the first peak and showing no unknown cases in the UK in late March 2021. This model is more aligned with the ICL model, and we believe its findings to be more plausible on the basis that not all infections will be reported for various reasons including asymptomatic or mild infection. Backcasting studies also support estimates in line with the ICL model [55,56]. None of the models or studies project forwards, so forecasting the known proportions at the current level seems to be the only reasonable option despite the large peaks which are projected.

5.2.4. Generalisation

Finally, whilst this model was built for the UK, the only thing which makes it country-specific is the calibration of the parameters and the lockdown profile. It may not be suitable for countries with lower case rates, where factors such as the efficiency of contact tracing have more influence, but otherwise, it is structurally generic and could be adapted for other countries or regions. Whilst decisions in managing this pandemic cannot be based on modelling alone, the predictive power of dynamic modelling can serve as a powerful tool to inform policies and intervention decisions. Never has modelling been more important in the field of public health.

6. Conclusions

Whilst there continues to be considerable uncertainty surrounding the progression of the COVID-19 pandemic in the UK, this modelling exercise identifies the key factors generating this uncertainty and projects the results of lockdown changes under a variety of scenarios. UK policy makers set a reasonable course to enable the countries to exit from lockdown, but the infection surge resulting from the emergence of the Delta variant has given yet another challenge which can only be addressed by an ongoing focus on vaccination and potentially by further social restrictions.
The model, whilst by no means perfect, is useful for projection purposes, and its simplicity and transparency are meant to provide further insight to the modelling and analysis process to both policy makers and the general public. As with any model, the assumptions behind it are critical to its accuracy. New COVID-19 research is being published all the time, and the model can continue to be refined and updated as both the research and policy evolves and more historical data is produced.

Supplementary Materials

The following are available online at https://www.mdpi.com/article/10.3390/systems9030060/s1.

Author Contributions

This manuscript was created by C.B. and reviewed and enhanced by M.P. All authors have read and agreed to the published version of the manuscript.

Funding

This research received no external funding.

Institutional Review Board Statement

Not applicable.

Informed Consent Statement

Not applicable.

Data Availability Statement

All data used in this study can be found at www.ourworldindata.org or in indicated references.

Acknowledgments

The authors wish to acknowledge Robert Eberlein at isee systems for the original sample model which provided the starting point for this modelling activity. This research was partially financially supported by a private donation to the Millennium Institute. The donor had no role in study design, data collection and analysis, decision to publish, or preparation of the manuscript.

Conflicts of Interest

The authors declare no conflict of interest.

References

  1. Godlee, F.; Silberner, J. The BMJ interview: Anthony Fauci on covid-19. BMJ 2020, 370, m3703. [Google Scholar] [CrossRef]
  2. How Epidemiological Models of COVID-19 Help Us Estimate the True Number of Infections. Available online: https://ourworldindata.org/covid-models (accessed on 30 June 2021).
  3. Rahmandad, H.; Lim, T.Y.; Sterman, J. Behavioral dynamics of COVID-19: Estimating under-reporting, multiple waves, and adherence fatigue across 91 nations. medRxiv 2020. [Google Scholar] [CrossRef]
  4. Ward, H.; Cooke, G.; Atchison, C.; Whitaker, M.; Elliott, J.; Moshe, M. Spiral: Antibody prevalence for SARS-CoV-2 in England following first peak of the pandemic: REACT2 study in 100,000 adults. bioRxiv 2020. [Google Scholar] [CrossRef]
  5. COVID-19 Pandemic Planning Scenarios. Available online: https://www.cdc.gov/coronavirus/2019-ncov/hcp/planning-scenarios.html (accessed on 30 March 2021).
  6. We Scientists Said Lock Down. But UK Politicians Refused to Listen. Available online: https://www.theguardian.com/commentisfree/2020/apr/15/uk-government-coronavirus-science-who-advice (accessed on 30 March 2021).
  7. Hancock, M. An Update on the Coronavirus Vaccine, 2 December 2020. Available online: https://www.gov.uk/government/speeches/an-update-on-the-coronavirus-vaccine-2-december-2020 (accessed on 30 March 2021).
  8. Covid-19: Oxford-AstraZeneca Vaccine Approved for Use in UK. Available online: https://www.bbc.com/news/health-55280671 (accessed on 30 March 2021).
  9. COVID-19 Response—Spring 2021. Available online: https://www.gov.uk/government/publications/covid-19-response-spring-2021 (accessed on 30 March 2021).
  10. Imperial College COVID-19 Reports. Available online: https://mrc-ide.github.io/global-lmic-reports/ (accessed on 30 June 2021).
  11. Holmdahl, I.; Buckee, C. Wrong but Useful—What Covid-19 Epidemiologic Models Can and Cannot Tell Us. N. Engl. J. Med. 2020, 383, 303–305. [Google Scholar] [CrossRef]
  12. IHME COVID-19 Projections. Available online: https://covid19.healthdata.org/global?view=cumulative-deaths&tab=trend (accessed on 30 June 2021).
  13. SPI-M-O: Summary of Modelling on Scenarios for Easing Restrictions. Available online: https://assets.publishing.service.gov.uk/government/uploads/system/uploads/attachment_data/file/975909/S1182_SPI-M-O_Summary_of_modelling_of_easing_roadmap_step_2_restrictions.pdf (accessed on 30 April 2021).
  14. Cohen, J.I.; Burbelo, P.D. Reinfection with SARS-CoV-2: Implications for Vaccines. Clin. Infect. Dis. 2020, cia1866. [Google Scholar] [CrossRef]
  15. Dan, J.M.; Mateus, J.; Kato, Y.; Hastie, K.M.; Yu, E.D.; Faliti, C.E.; Grifoni, A.; Ramirez, S.I.; Haupt, S.; Fraizer, A.; et al. Immunological memory to SARS-CoV-2 assessed for up to eight months after infection. bioRxiv 2020. [Google Scholar] [CrossRef]
  16. Seow, J.; Graham, C.; Merrick, B.; Acors, S.; Steel, K.J.A.; Hemmings, O.; O’Bryne, A.; Kouphou, N.; Pickering, S.; Galao, R.P.; et al. Longitudinal evaluation and decline of antibody responses in SARS-CoV-2 infection. medRxiv 2020. [Google Scholar] [CrossRef]
  17. Wajnberg, A.; Amanat, F.; Firpo, A.; Altman, D.R.; Bailey, M.J.; Mansour, M.; McMahon, M.; Meade, P.; Mendu, D.R.; Muellers, K.; et al. SARS-CoV-2 infection induces robust, neutralizing antibody responses that are stable for at least three months. medRxiv 2020. [Google Scholar] [CrossRef]
  18. Mumoli, N.; Vitale, J.; Mazzone, A. Clinical immunity in discharged medical patients with COVID-19. Int. J. Infect. Dis. 2020, 99, 229–230. [Google Scholar] [CrossRef] [PubMed]
  19. Mahase, E. Covid-19: Past infection provides 83% protection for five months but may not stop transmission, study finds. BMJ 2021, 372, n124. [Google Scholar] [CrossRef]
  20. Pritchard, E.; Matthews, P.C.; Stoesser, N.; Eyre, D.W.; Gethings, O.; Vihta, K.-D.; Jones, J.; House, T.; VanSteenHouse, H.; Bell, I.; et al. Impact of vaccination on SARS-CoV-2 cases in the community: A population-based study using the UK’s COVID-19 Infection Survey. medRxiv 2021. [Google Scholar] [CrossRef]
  21. Hodgson, S.H.; Mansatta, K.; Mallett, G.; Harris, V.; Emary, K.R.W.; Pollard, A.J. What defines an efficacious COVID-19 vaccine? A review of the challenges assessing the clinical efficacy of vaccines against SARS-CoV-2. Lancet Infect. Dis. 2021, 21, e26–e35. [Google Scholar] [CrossRef]
  22. Rivett, L.; Sridhar, S.; Sparkes, D.; Routledge, M.; Jones, N.K.; Forrest, S.; Young, J.; Pereira-Dias, J.; Hamilton, W.L.; Ferris, M.; et al. Screening of healthcare workers for SARS-CoV-2 highlights the role of asymptomatic carriage in COVID-19 transmission. eLife 2020, 9, e58728. [Google Scholar] [CrossRef] [PubMed]
  23. Lee, S.; Meyler, P.; Mozel, M.; Tauh, T.; Merchant, R. Asymptomatic carriage and transmission of SARS-CoV-2: What do we know? Can. J. Anesth. 2020, 67, 1424–1430. [Google Scholar] [CrossRef]
  24. Altmann, D.M.; Douek, D.C.; Boyton, R.J. What policy makers need to know about COVID-19 protective immunity. Lancet 2020, 395, 1527–1529. [Google Scholar] [CrossRef]
  25. Johansson, M.A.; Quandelacy, T.M.; Kada, S.; Prasad, P.V.; Steele, M.; Brooks, J.T.; Slayton, R.B.; Biggerstaff, M.; Butler, J.C. SARS-CoV-2 Transmission from People without COVID-19 Symptoms. JAMA Netw. Open 2021, 4, e2035057. [Google Scholar] [CrossRef] [PubMed]
  26. Pollock, A.M.; Lancaster, J. Asymptomatic transmission of Covid-19. BMJ 2020, 371, m4851. [Google Scholar] [CrossRef]
  27. Byambasuren, O.; Cardona, M.; Bell, K.; Clark, J.; McLaws, M.-L.; Glasziou, P. Estimating the extent of asymptomatic COVID-19 and its potential for community transmission: Systematic review and meta-analysis. Off. J. Assoc. Med. Microbiol. Infect. Dis. Can. 2020, 5, 223–234. [Google Scholar] [CrossRef]
  28. Lau, H.; Khosrawipour, T.; Kocbach, P.; Ichii, H.; Bania, J.; Khosrawipour, V. Evaluating the massive underreporting and undertesting of COVID-19 cases in multiple global epicenters. Pulmonology 2021, 27, 110. [Google Scholar] [CrossRef] [PubMed]
  29. Kermack, W.; Mckendrick, A.G. A Contribution to the Mathematical Theory of Epidemics. Proc. R. Soc. A Math. Phys. Eng. Ser. 1927, 115, 700–721. [Google Scholar]
  30. Ward, H.; Graham, C.; Atchison, C.; Whitaker, M.; Elliot, J.; Moshe, M.; Brown, J.C.; Flower, B.; Daunt, A.; Ainslie, K.; et al. Declining prevalence of antibody positivity to SARS-CoV-2: A community study of 365,000 adults. bioRxiv 2020. [Google Scholar] [CrossRef]
  31. Volz, E.; Mishra, S.; Chand, M.; Barrett, J.; Johnson, R.; Geidelberg, L.; Hinsley, W.R.; Laydon, D.J.; Dabrera, G.; O’Toole, A.; et al. Transmission of SARS-CoV-2 Lineage B.1.1.7 in England: Insights from linking epidemiological and genetic data. medRxiv 2020. [Google Scholar] [CrossRef]
  32. Graham, M.S.; Sudre, C.H.; May, A.; Antonelli, M.; Murray, B.; Varsavsky, T.; Kläser, K.; Canas, L.S.; Molteni, E.; Modat, M.; et al. Changes in symptomatology, reinfection, and transmissibility associated with the SARS-CoV-2 variant B.1.1.7: An ecological study. Lancet Public Health 2021, 6, 335–380. [Google Scholar] [CrossRef]
  33. Moss, R.; Wood, J.; Brown, D.; Shearer, F.; Black, A.J.; Cheng, A.C.; McCaw, J.M.; McVernon, J. Modelling the impact of COVID-19 in Australia to inform transmission reducing measures and health system preparedness. medRxiv 2020. [Google Scholar] [CrossRef] [Green Version]
  34. Byrne, A.W.; McEvoy, D.; Collins, A.B.; Hunt, K.; Casey, M.; Barber, A.; Butler, F.; Griffin, J.; Lane, E.A.; McAloon, C.; et al. Inferred duration of infectious period of SARS-CoV-2: Rapid scoping review and analysis of available evidence for asymptomatic and symptomatic COVID-19 cases. BMJ Open 2020, 10, e039856. [Google Scholar] [CrossRef] [PubMed]
  35. UK Government. Joint Committee on Vaccination and Immunisation: Advice on Priority Groups for COVID-19 Vaccination, 30 December 2020. Available online: https://www.gov.uk/government/publications/priority-groups-for-coronavirus-covid-19-vaccination-advice-from-the-jcvi-30-december-2020/joint-committee-on-vaccination-and-immunisation-advice-on-priority-groups-for-covid-19-vaccination-30-december-2020 (accessed on 30 March 2021).
  36. Ritchie, H.; Ortiz-Ospina, E.; Beltekian, D.; Mathieu, E.; Hasell, J.; Macdonald, B.; Giattino, C.; Appel, C.; Rodés-Guirao, L.; Roser, M. Coronavirus Pandemic (COVID-19). Available online: https://ourworldindata.org/coronavirus (accessed on 12 July 2021).
  37. Robertson, E.; Reeve, K.S.; Niedzwiedz, C.L.; Moore, J.; Blake, M.; Green, M.; Katikireddi, S.V.; Benzeval, M.J. Predictors of COVID-19 vaccine hesitancy in the UK Household Longitudinal Study. Brain Behav. Immun. 2021, 94, 41–50. [Google Scholar] [CrossRef]
  38. Liu, Y.; Tang, J.W.; Lam, T.T.Y. Transmission dynamics of the COVID-19 epidemic in England. Int. J. Infect. Dis. 2021, 104, 132–138. [Google Scholar] [CrossRef]
  39. Noh, J.Y.; Yoon, J.G.; Seong, H.; Choi, W.S.; Sohn, J.W.; Cheong, H.J.; Kim, W.J.; Song, J.Y. Asymptomatic infection and atypical manifestations of COVID-19: Comparison of viral shedding duration. J. Infect. 2020, 81, 816–846. [Google Scholar] [CrossRef]
  40. Zhou, R.; Li, F.; Chen, F.; Liu, H.; Zheng, J.; Lei, C.; Wu, X. Viral dynamics in asymptomatic patients with COVID-19. Int. J. Infect. Dis. 2020, 96, 288–290. [Google Scholar] [CrossRef] [PubMed]
  41. Increased Household Transmission Of COVID-19 Cases Associated with SARS-Cov-2 Variant of Concern B.1.617.2: A National Case-Control Study. Available online: https://khub.net/documents/135939561/405676950/Increased+Household+Transmission+of+COVID-19+Cases+-+national+case+study.pdf/7f7764fb-ecb0-da31-77b3-b1a8ef7be9aa (accessed on 31 March 2021).
  42. Atalan, A. Is the lockdown important to prevent the COVID-9 pandemic? Effects on psychology, environment and economy-perspective. Ann. Med. Surg. 2020, 56, 38–42. [Google Scholar] [CrossRef] [PubMed]
  43. Prime Minister Sets Out Roadmap to Cautiously Ease Lockdown Restrictions. Available online: https://www.gov.uk/government/news/prime-minister-sets-out-roadmap-to-cautiously-ease-lockdown-restrictions (accessed on 30 April 2021).
  44. Wright, L.; Fancourt, D. Do predictors of adherence to pandemic guidelines change over time? A panel study of 21,000 UK adults during the COVID-19 pandemic. medRxiv 2020. [Google Scholar] [CrossRef]
  45. Sanche, S.; Lin, Y.T.; Xu, C.; Romero-Severson, E.; Hengartner, N.; Ke, R. High Contagiousness and Rapid Spread of Severe Acute Respiratory Syndrome Coronavirus 2. Emerg. Infect. Dis. 2020, 26, 1470–1477. [Google Scholar] [CrossRef]
  46. Subsidizing the Spread of COVID19: Evidence from the UK’s Eat-Out-to-Help-Out Scheme. Available online: https://ideas.repec.org/p/wrk/warwec/1310.html (accessed on 31 January 2021).
  47. Prime Minister Confirms Move to Step 4. Available online: https://www.gov.uk/government/news/prime-minister-confirms-move-to-step-4 (accessed on 12 July 2021).
  48. Rise in Covid Cases Will Put Intense Pressure on NHS, Bosses Warn. Available online: https://www.theguardian.com/world/2021/jul/12/rise-in-covid-cases-will-put-intense-pressure-on-nhs-bosses-warn (accessed on 14 July 2021).
  49. Britton, T.; Ball, F.; Trapman, P. A mathematical model reveals the influence of population heterogeneity on herd immunity to SARS-CoV-2. Science 2020, 369, 846–849. [Google Scholar] [CrossRef] [PubMed]
  50. Fontanet, A.; Cauchemez, S. COVID-19 herd immunity: Where are we? Nat. Rev. Immunol. 2020, 20, 583–584. [Google Scholar] [CrossRef]
  51. Wang, M.; Flessa, S. Modelling Covid-19 under uncertainty: What can we expect? Eur. J. Health Econ. 2020, 21, 665–668. [Google Scholar] [CrossRef] [PubMed]
  52. Beven, K. A manifesto for the equifinality thesis. J. Hydrol. 2006, 320, 18–36. [Google Scholar] [CrossRef] [Green Version]
  53. Struben, J. The coronavirus disease (COVID-19) pandemic: Simulation-based assessment of outbreak responses and postpeak strategies. Syst. Dyn. Rev. 2020, 36, 247–293. [Google Scholar] [CrossRef] [PubMed]
  54. Friston, K.J.; Parr, T.; Zeidman, P.; Razi, A.; Flandin, G.; Daunizeau, J.; Hulme, O.J.; Biling, A.J.; Litvak, J.; Price, C.J.; et al. Tracking and tracing in the UK: A dynamic causal modelling study. Wellcome Open Res. 2021, 5, 144. [Google Scholar] [CrossRef]
  55. Phipps, S.J.; Grafton, R.Q.; Kompas, T. Robust estimates of the true (population) infection rate for COVID-19: A backcasting approach. R. Soc. Open Sci. 2020, 7, 200909. [Google Scholar] [CrossRef]
  56. Böhning, D.; Rocchetti, I.; Maruotti, A.; Holling, H. Estimating the undetected infections in the Covid-19 outbreak by harnessing capture–recapture methods. Int. J. Infect. Dis. 2020, 97, 197–201. [Google Scholar] [CrossRef]
Figure 1. SEIR model of COVID-19 pandemic in UK.
Systems 09 00060 g001
Figure 2. Daily UK reported COVID-19 cases 1 February 2020 to 12 July 2021.
Systems 09 00060 g002
Figure 3. Daily UK COVID-19 cases projected to end 2021 with varying immunity lengths.
Systems 09 00060 g003
Figure 4. Daily known case projections with varying immunity protection.
Systems 09 00060 g004
Figure 5. Daily known and unknown UK COVID-19 cases in 2021 with varying known proportion assumptions.
Systems 09 00060 g005
Figure 6. Lockdown interventions when cases rise above 50,000.
Systems 09 00060 g006
Figure 7. Effect of varying time to initiate lockdown.
Systems 09 00060 g007
Figure 8. Effect of varying number of known cases required to initiate lockdown.
Systems 09 00060 g008
Figure 9. Extreme simulations for lockdowns.
Systems 09 00060 g009
Figure 10. Susceptible population percentage with differing immunity and interventions.
Systems 09 00060 g010
Table 1. Major parameter values used in model.
ParameterValueUnitSource
Incubation duration (non-infectious latent period)3.5Days[33]
Disease duration stage 1 unknown2Days[33,34]
Disease duration stage 2 known 8Days[33,34]
Disease duration stage 2 unknown 5Days[33,34]
Time from known disease till death11Days[34]
Vaccine rollout speed PB/AZ130,000/380,000Doses/day[35,36]
Vaccine protection against onwards transmission 21 days after dose 1 PB/AZ65% $-[20]
Vaccine protection against onwards transmission 7 days after dose 2 PB/AZ70% $-[20]
Length of immunity after vaccination or recovery8 $Months[15]
Maximum population immunity 70%-[37]
Average immunity protection post recovery70% $-[20]
Unknown infectiousness ratio *72% $-[5,26,27,38,39,40] and
model optimisation
Unconstrained infecting daily contact rate unknown0.56 $-model optimisation
Unconstrained infecting daily contact rate known0.14 $-model optimisation
Known proportion estimate February 202121% $-[2] and model optimisation
Relative infectivity after alpha variant identified1.32 $-[32] and model optimisation
Relative infectivity after delta variant identified2.0 $ [41]
* Starting point was the best estimate used by Center for Disease Control and Prevention based on multiple assumptions and conflicting research papers. $ Value used for base case of model.
Table 2. Dates of significant measures.
Event Date
First two UK COVID-19 cases confirmed1 February 2020
UK Government Coronavirus action plan3 March 2020
First COVID-19 death3 March 2020
Contact tracing abandoned12 March 2020
UK-wide lockdown effected26 March 2020
Prime Minister admitted to hospital with COVID-19 symptoms4 April 2020
COVID-19 alert levels system announced1 May 2020
Lockdown eased, workers return, outdoor exercise with another13 May 2020
Lockdown eased, non-essential shops reopen15 June 2020
Restaurants and pubs open4 July 2020
Restaurant ‘eat out to help out’ campaign3 August 2020
One of every three cases in 20–29-year-olds, fast growth in younger people7 September 2020
England—‘Rule of Six’ announced to curb social gatherings14 September 2020
England—three-tier alert framework implemented14 October 2020
Northern Ireland—4-week ‘circuit breaker’ lockdown starts16 October 2020
Wales—3-week ‘firebreak’ lockdown starts23 October 2020
Scotland—5-tier alert system starts2 November 2020
England—4-week national lockdown starts at new tier 45 November 2020
New COVID-19 strain (Alpha variant) B.1.1.7 detected in UK13 November 2020
England—4-week lockdown ends3 December 2020
PB immunisation rollout starts8 December 2020
London and Scotland, new tier 4 lockdown 20 December 2020
Christmas one day lockdown relaxation25 December 2020
AZ immunization rollout starts4 January 2021
England, Scotland—tier 5 lockdown to 22 February6 January 2021
England—lockdown extended to 8 March27 January 2021
Schools return8 March 2021
Non-essential retail, outdoor hospitality and attractions reopen12 April 2021
New COVID-19 strain (Delta variant) B.1.617.2 detected in UK15 April 2021
Indoor hospitality and sporting events with limited capacity reopen 17 May 2021
Planned England and Scotland ‘Freedom day’ 21 June deferred to 19 July14 June 2021
FUTURE CHANGES:
England—mandatory mask rules lifted, nightclubs reopen, full capacity events19 July 2021
Scotland—level zero, up to 10 people meet indoors, nightclubs remain closed19 July 2021
Table 3. Scenarios simulated in model.
ScenarioImmunity Length Post Vaccination and Post
Recovery
Protection from Infection Given by Recovered ImmunityVaccine Protection 3 Weeks after 1st DoseVaccine Transmission Protection 1 Week after 2nd DoseFuture Known Proportion of CasesLockdown Characteristics
Base Case8 months [15]70% [20]PB/AZ 65% [20]PB/AZ 70% [20]50%-
Recovered immunity protection variations8 months62%/70%/87% [15,16,17,19,20]PB/AZ 65%PB/AZ 70%50%-
Vaccine protection variations8 months70%PB/AZ 60%/65%/70% [20]PB/AZ 62%/70%/77% [20]50%-
Known proportion of cases variations8 months70% PB/AZ 65%PB/AZ 70%50%/37.5%/25%/12.5%-
Lockdown sensitivity variations8/12 months70%PB/AZ 65%PB/AZ 70%50%Delays from 3.5 to 21 days,
Case thresholds from 5000 to 25,000,
Lockdown increase from 25% to 50%
There is no published research data available for post-vaccination immunity length, so this was assumed to be the same as post-recovery immunity. The proportion of known COVID-19 cases may reduce due to lowered disease severity; the model was run using values of 0%, 25%, 50% and 75% reduction in the absence of published research.
Table 4. Varying immunity scenarios.
ScenarioImmunity Length Recovered Immunity Protection Vaccine Protection 3 Weeks after 1st DoseVaccine Protection 1 Week after 2nd DoseFuture Known Cases
Immunity length variations5/8/12 months70%PB/AZ 65%PB/AZ 70%50%
Table 5. Varying immunity effectiveness scenarios.
ScenarioImmunity LengthRecovered Immunity ProtectionVaccine Protection 3 Weeks after 1st DoseVaccine Protection 1 Week after 2nd DoseFuture Known Cases
Vaccine protection variations8 months70%PB/AZ 60%/65%/70%PB/AZ 62%/70%/77%50%
Recovered immunity protection variations8 months62%/70%/87%PB/AZ 65%PB/AZ 70%50%
Table 6. Varying known proportion scenarios.
ScenarioImmunity LengthRecovered Immunity ProtectionVaccine Protection 3 Weeks after 1st DoseVaccine Protection 1 Week after 2nd DoseFuture Known Cases
Known proportion variations8 months70%PB/AZ 65%PB/AZ 70%50%/37.5%/25%/12.5%
Table 7. Varying lockdown initiation scenarios.
ScenarioImmunity LengthRecovered Immunity ProtectionVaccine Protection 1st DoseVaccine Protection 2nd DoseFuture Known CasesLockdown Daily Case ThresholdLockdown%
Lockdown effects for varying immunity lengths5/8/12 months 70%PB/AZ 65%PB/AZ 70%7 days50,00020% addition
Table 8. Varying lockdown initiation delay scenarios.
ScenarioImmunity LengthRecovered Immunity ProtectionVaccine Protection 1st DoseVaccine Protection 2nd DoseDelay before LockdownLockdown Daily Case ThresholdLockdown%
Lockdown delay variations8 months70%PB/AZ 65%PB/AZ 70%3.5, 7, 10.5,
14, 17.5, 21 days
500025% addition
5 months70%PB/AZ 65%PB/AZ 70%3.5, 7, 10.5,
14, 17.5, 21 days
500025% addition
Table 9. Varying lockdown case threshold scenarios.
ScenarioImmunity LengthRecovered Immunity ProtectionVaccine Protection 1st DoseVaccine Protection 2nd DoseDelay before LockdownLockdown Daily Case ThresholdLockdown%
Lockdown case threshold variations8 months70%PB/AZ 65%PB/AZ 70%7 days25,000, 50,000, 75,000,
100,000
20% addition
12 months70%PB/AZ 65%PB/AZ 70%7 days25,000, 50,000, 75,000,
100,000
20% addition
Table 10. Testing extreme lockdown scenarios.
FigureScenarioImmunity Length Recovered Immunity ProtectionVaccine Protection 1st DoseVaccine Protection 2nd DoseDelay before LockdownLockdown Daily Case ThresholdLockdown%
9aLong delay & high case threshold8/12 months70%PB/AZ 65%PB/AZ 70%21 days100,00020% addition
9bSevere lockdown8/12 months70%PB/AZ 65%PB/AZ 70%7 days50,00040% addition
Table 11. Susceptible percentage illustrations.
FigureScenarioImmunity LengthRecovered Immunity ProtectionVaccine Protection 1st DoseVaccine Protection 2nd DoseDelay before LockdownLockdown Daily Case ThresholdLockdown%
10aImmunity variations5/8/12 months70%PB/AZ 65%PB/AZ 70%---
10bImmunity variations with lockdown intervention5/8/12 months70%PB/AZ 65%PB/AZ 70%7 days50,00020% addition
Publisher’s Note: MDPI stays neutral with regard to jurisdictional claims in published maps and institutional affiliations.