Article

A Possibilistic Approach for Aggregating Customer Opinions in Product Development

by
Md. Mamunur Rashid
1 and
AMM Sharif Ullah
2,*
1
Bangladesh Institute of Management, 4 Sobhanbag, Mirpur Road, Dhanmandi Dhaka-1207, Bangladesh
2
Kitami Institute of Technology, Koen-cho 165, Kitami, Hokkaido 090-8507, Japan
*
Author to whom correspondence should be addressed.
Systems 2016, 4(2), 17; https://doi.org/10.3390/systems4020017
Submission received: 10 December 2015 / Revised: 7 March 2016 / Accepted: 15 March 2016 / Published: 23 March 2016
(This article belongs to the Special Issue Product, Process, System Design Review Methods and Tools)

Abstract

:
One of the major tasks of product development is to collect the opinions of potential customers and to then find out the status of certain product features. The status of a product feature means whether or not it must, should, or could be included in the product, or even avoided. In doing so, a simple relative frequency-based computing approach is not sufficient. Rather, a logical computing approach is a better option. Based on this contemplation, this study describes a methodology to identify the status of a product feature in terms of must-be, should-be, or could-be categories, where the collected customer opinions are computed using a logical approach. Possibility distributions (i.e., fuzzy numbers) play a significant role in the logical computation. A Kano-model-based questionnaire is employed to collect the customer opinions. Through a case study, it is demonstrated that the proposed approach is effective in dealing with both the subjectivity and controversy that the customer opinions may exhibit. The results of this study are useful for making decisions in the early stage of a product development process in a lucid manner.

1. Introduction

Product development is a field of study where the activities underlying a product life cycle are studied in a concurrent manner [1,2,3]. The internal customers (personnel of the concerned organization) first determine the needs of the external customers (the real potential customers who will use the product for their own ends). At the same time, the internal customers suggest numerous solutions for satisfying the needs of the external customers. Therefore, a customer needs assessment and product solution identification have been two critical problems of product development and studied by numerous authors [4,5,6,7,8,9,10,11,12,13,14,15,16,17,18]. In certain cases, the issues of mass customization, growing and variable customer demands, and optimal mix of products have been emphasized in dealing with customer needs [4,5,6,7]. The issue of sustainability has also been integrated with the aforementioned activities [8,17]. Some authors have put an emphasis on the customer needs models, e.g., the Kano model [9], and other related issues, e.g., the issue of customer preferences aggregation [10,11,12,13,14,15,18], the issue of missing customer opinion simulation [16], and the issue of uncertainty quantification in customer needs assessment [11,12,13,14,15].
However, as mentioned, a product development process must start by elucidating the customer needs. The elucidated customer needs must assist the subsequent processes of product realization (design, manufacturing, and assembly). Usually, a selected segment of potential customers (hereinafter referred to as respondents) is asked to answer a set of questions. Afterward, a computational approach is applied for aggregating the respondents’ answers to identify which features of the product (or a family of products) are useful and to what extent they satisfy the customers’ needs. Since the personal taste and motivation of the respondents are not the same, a great deal of variability in the answers is found [16,18]. Sometimes, the answers of certain respondents are unavailable because the respondents did not answer on time or at all [13,16]. Sometimes, the answers do not make sense (i.e., controversial or questionable answers). Sometimes, the answers are less informative, i.e., the respondents just took a neutral position (less opinionative answers). Therefore, the frequency-based simple calculation may be misleading in aggregating the answers of the respondents. As an alternative, customer answers can logically be analyzed. This article aims to show how this can be done.
The remainder of this article is organized as follows: Section 2 describes the mathematical entities needed for the better understanding of the arguments used in this article. Section 3 describes the logical formulations by which the answers regarding customer needs are aggregated toward a decisive conclusion. Section 4 describes, and discusses the implications of, the results. Section 5 concludes this study.

2. Preliminaries

This section describes the mathematical entities needed to better understand the arguments used in this article.

2.1. State of a Product Feature

In this study, a product feature takes one of the following states: must-be, should-be, could-be, and unreliable. A must-be feature means that the feature must be included in the product. Similarly, a should-be feature means that the feature should be included in the product. A could-be feature means that the feature could be included in the product. Finally, an unreliable feature means that the feature entails controversial answers from the respondents. Therefore, the following set of states denoted as State = {must-be feature, should-be feature, could-be feature, unreliable feature} is considered in this study.

2.2. Numerical and Linguistic Truth-Value or Degree of Belief of a Feature

Let p(Fi,Sj) be a proposition of the form Fi is Sj where Fi is the i-th feature of a product and SjState. Let T be a process as follows:
p ( F i , S j ) T D o B ( F i , S j )
The process T defined in Equation (1) determines the Degree of Belief (DoB) of each proposition p(Fi,Sj), i = 1,2,…, j = 1,...,4, DoB(.) ∈ [0,1]. This means that each proposition p(Fi,Sj) has a truth-value (or DoB) in the interval [0,1], and the process denoted as T determines it.
The DoB of a compound proposition can be determined as follows:
p ( F i , ¬ S j ) 1 D o B ( F i , S j ) p ( F i , S j ) p ( F i , S k ) max ( D o B ( F i , S j ) , D o B ( F i , S k ) ) p ( F i , h S j ) D o B ( F i , S j )
In Equation (2), Sk is a state drawn from State, and h is a hedge called “more or less” or “somewhat.”
However, the truth-value or DoB of the above-mentioned propositions can be assigned either numerically or linguistically. The description is as follows.
Let Fi be sedan (a feature of a car), i.e., Fi = sedan. Using the states defined in State, the following four propositions can be considered: p1(sedan, must-be feature), p2(sedan, should-be feature), p3(sedan, could-be feature), and p4(sedan, unreliable feature). A numerical value that lies in the interval [0, 1] can be assigned to each proposition subjectively or following a computation approach as its truth-value or DoB. Let, for instance, DoBs of the propositions be DoB(sedan, must-be feature) = 0.2, DoB(sedan, should-be feature) = 0.7, DoB(sedan, could-be feature) = 0.95, and DoB(sedan, unreliable feature) = 0.05. Linguistically, DoB = 0.2 means that “it is quite false that sedan is a must-be feature of a car,” i.e., DoB = 0.2 refers to a linguistic truth-value “quite false.” Similarly, DoB = 0.7 means that “it is somewhat true that sedan is a should-be feature of a car,” i.e., DoB = 0.7 refers to a linguistic truth-value “somewhat true.” Similarly, DoB = 0.95 means that “it is mostly true that sedan is a could-be feature of a car,” i.e., DoB = 0.95 refers to a linguistic truth-value “mostly true.” Finally, DoB = 0.05 means that “it is mostly false that the opinions obtained on the car feature called sedan is unreliable,” i.e., DoB = 0.05 refers to a linguistic truth-value “mostly false.”
Thus, a crisp DoB, i.e., a numerical value in the interval [0, 1], can be interpreted in terms of a linguistic expression (e.g., mostly false, somewhat true, and alike), which is referred to as linguistic truth-value. This means that a linguistic truth-value of a crisp DoB is its linguistic interpretation or counterpart. The linguistic counterpart (L(c)) of a crisp DoB (c = DoB(Fi,.)) is given as
c = D o B ( F i , . )   max i = 1 , 2 , ( D o B ( L T i ( c ) ) ) L ( c )
Using a set of fuzzy numbers defined in the universe of discourse [0, 1], the linguistic truth-values LTi, i = 1, 2, ... can be defined. In this study, a set of seven linguistic truth-values are considered that are given by the membership functions (or DoBs) of the seven fuzzy numbers [16,19,20,21,22] labeled “mostly false (mf),” “quite false (qf),” “somewhat false (sf),” “neither true nor false (tf),” “somewhat true (st),” “quite true (qt),” and “mostly true (mt).” The membership functions are illustrated in Figure 1.
The definitions of the membership functions shown in Figure 1 are as follows:
D o B m f ( c ) = max ( 0 , min ( 1 , 0.1 c 0.1 0 ) )
D o B q f ( c ) = max ( 0 , min ( c 0 0.1 0 , 0.3 c 0.3 0.1 ) )
D o B s f ( c ) = max ( 0 , min ( c 0.1 0.3 0.1 , 0.5 c 0.5 0.3 ) )
D o B t f ( c ) = max ( 0 , min ( c 0.3 0.5 0.3 , 0.7 c 0.7 0.5 ) )
D o B s t ( c ) = max ( 0 , min ( c 0.5 0.7 0.5 , 0.9 c 0.9 0.7 ) )
D o B q t ( c ) = max ( 0 , min ( c 0.7 0.9 0.7 , 1 c 1 0.9 ) )
D o B m t ( c ) = max ( 0 , min ( 1 , c 0.9 1 0.9 ) )
In Equations (4)–(10), a numerical truth-value is denoted as c, i.e., c ∈ [0, 1]. Let the linguistic counterpart of c be L(c). If the condition underlying Equation (1) is applied, then the linguistic counterpart of c ∈ [0, 0.05] is mostly false (mf). Similarly, the linguistic counterpart of c ∈ (0.05, 0.2] is quite false (qf). The linguistic counterpart of c ∈ (0.2, 0.4] is somewhat false (sf). The linguistic counterpart of c ∈ (0.4, 0.6] is neither true nor false (tf). The linguistic counterpart of c ∈ (0.6, 0.8] is somewhat true (st). The linguistic counterpart of c ∈ (0.8, 0.95] is quite true (qt). Finally, the linguistic counterpart of c ∈ (0.95, 1] is mostly true (mt). A linguistic counterpart of c, as described above, has an expected (crisp) value denoted as E(L(c)) that is often calculated by the centroid method. The expected values of the linguistic true-values shown in Figure 1 are as follows: E(mf(c)) = 0.033, E(qf(c)) = 0.133, E(sf(c)) = 0.3, E(tf(c)) = 0.5, E(st(c)) = 0.7, E(qt(c)) = 0.867, and E(mt(c)) = 0.967, according to the centroid method.

3. Logical Aggregation Process
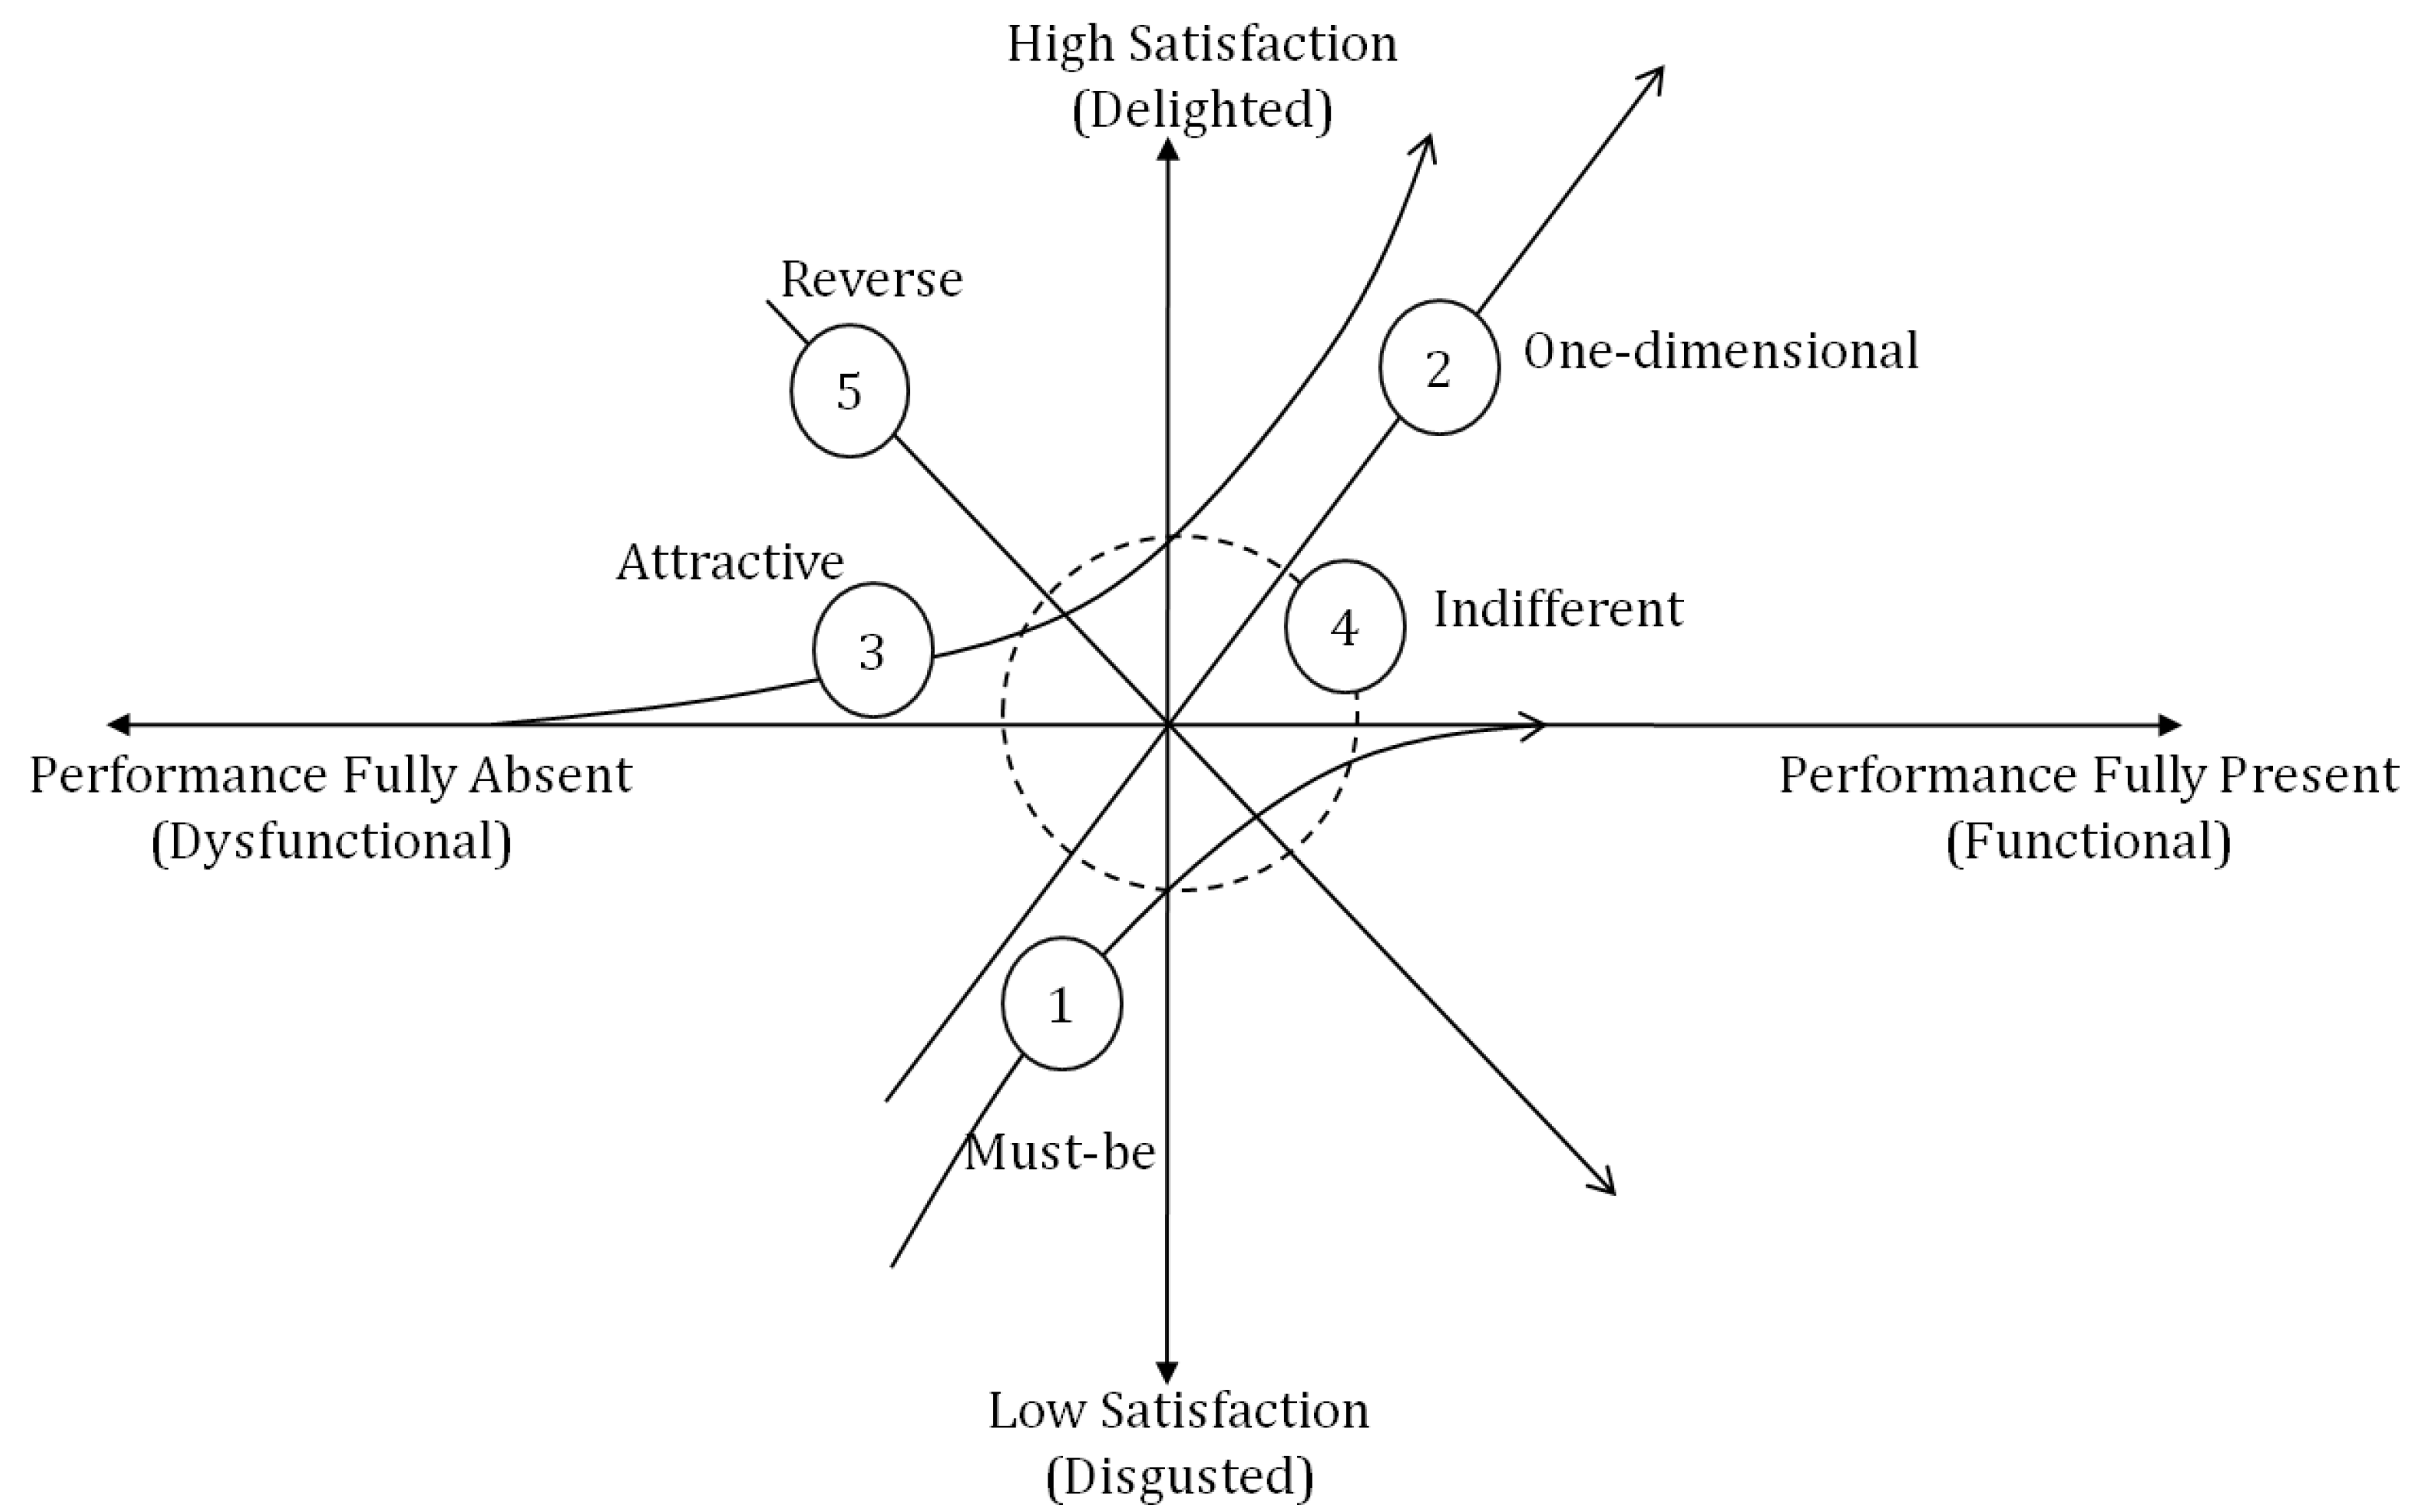
Based on the concept of possibility [19,20,21,22,23,24,25] and the formulations described in Section 2 and Section 3, this section describes the logical processes (i.e., T defined in Equation (1)) needed to aggregate the answers of the respondents. The goal is to determine the state of a product feature taking a state from State. The aggregation process relies on DoBs, as defined in Equation (1). The DoBs can also be processed by the formulations in Equations (2) and (3) and thereby the formulations in Equations (4)–(10). Since the answers of the respondents are obtained by using a definite customer needs model, the logical formulations must be consistent with an underlying customer needs model. This means that the logical aggregation processes are customer-needs-model dependent. In this study, the Kano model [9,16,18] is used to obtain the answers of the respondents. Therefore, the logical formulations for aggregating the Kano-model-based answers of the respondents are considered in this study.

3.1. The Kano Model

As mentioned, in this study to obtain customer opinion a customer needs model called the Kano model [9,16,18] is used. This subsection describes this model. It consists of both a classification scheme of customer needs and a matrix defining the relations among different types of customer needs. These two constituents of the Kano model are described in Figure 2 and Table 1.
As shown from Figure 2 and Table 1, the Kano model classifies a product feature Fi into one of the following types: Class = {One-dimensional (O), Attractive (A), Must-be (M), Indifferent (I), Reverse (R), Questionable (Q)}. As seen from Figure 2, a feature is considered Must-be if its absence produces absolute dissatisfaction, and its presence does not increase the satisfaction. A feature is considered One-dimensional if its fulfillment helps increase the satisfaction and vice versa. A feature is considered Attractive if it leads to a greater satisfaction but is not expected to be in the product. A feature is considered Indifferent if its presence or absence does not contribute to the customers’ satisfaction. A feature is considered Reverse if its presence causes dissatisfaction and vice versa [10,19,26]. To know whether Fi is one of the classes drawn from Class, a respondent needs to answer two questions. One of the questions deals with the scenario that refers to Fi being present in the product, and the other deals with the scenario that refers to Fi being not present in the product. The respondent needs to choose an answer drawn from Answer = {Like, Must-be, Neutral, Live-with, Dislike} for both questions [16,18]. The relationship between the two-answer and classification is listed in Table 1 [16,18]. Note the row and column in Table 1 marked by dark colors that refer to the answer called Neutral for both cases (Present and Not Present).

3.2. Probability-Possibility Transformation

There is a relationship between the concept of probability and possibility, and the degree of possibility can be interpreted in terms of probability and vice versa [19,20,21,22,23,24,25]. In this study, the concept of probability means a relative frequency-based probability. However, if we know the answers of the respondents, we know the relative frequencies of a feature Fi in terms of O, A, M, I, R, and Q. A relative frequency denoted as fr(Fi,Ck) of a feature Fi in terms of Ck ∈ {O, A, M, I, R, Q} is not the truth-value or DoB of the proposition “Fi is Ck”. It is possible to determine the DoB using the information of the relative frequency. To do this, the probability-possibility consistency principle can be used [19,20,21,22,23,24,25]. The probability-possibility consistency principle implies that the degree of possibility (or degree of belief) is always greater than or equal to the degree of probability, i.e., what is probable must be possible with a higher or equal degree of possibility, prob(.) ≤ π(.). The degree of possibility π(.) is, in fact, the Degree of Belief (DoB) or truth-value of a proposition [20,21,22]. The degree of probability, prob(.), is difficult to determine and in most real-life cases, the relative frequencies are taken as an estimation of the degree of probability. Based on this contemplation, the DoB of Ck is given as
D o B ( F i , C k ) = f r ( F i , C k ) max k = 1 , , 6 ( f r ( F i , C k ) )
In Equation (4), fr(Fi,Ck) denotes the relative frequency of the classification Ck for the feature Fi. Since max(fr(Fi,Ck) | ∀k = 1, …, 6) ≤ 1, DoB(Fi,Ck) ≥ fr(Fi,Ck) (≈prob(Fi,Ck)), i.e., the probability-possibility consistency principle holds if the Equation (4) is used. Other formulations of probability-possibility transformation are not considered in this study.

3.3. Logical Transformation

Using DoB(Fi,Ck), it is possible to find out the DoBs of the members of State (must be included, should be included, could be included, and unreliable). In doing so, it is important to understand the semantics of the classifications in Table 1 as follows:
As described above, if a feature is classified as One-dimensional (O) or Must-be (M) and it is not included in the product, then the customers are not satisfied. Therefore, that a feature “must be included” in the product means that it is “either O or M.” This leads to the following formulation:
F i i s a m u s t b e f e a t u r e ( F i i s O ) ( F i i s M ) D o B ( F i , m u s t b e f e a t u r e ) = max ( D o B ( F i , O ) , D o B ( F i , M ) )
On the other hand, if a feature is classified as Attractive (A), it is an unexpected but customer-satisfaction-enriching feature. Thus, it “should be included” in the product to increase the level of customer satisfaction. This yields the following formulation:
F i i s a s h o u l d b e f e a t u r e ( F i i s A ) D o B ( F i , s h o u l d b e f e a t u r e ) = D o B ( F i , A )
If a feature is classified as Indifferent (I), it is not helpful for increasing customer satisfaction. In addition, if the feature is Reverse (R), its inclusion in the product creates a great deal of dissatisfaction. This means that, if a feature is “not I or not R,” it could be included in the product. This yields the following formulation:
F i i s a c o u l d b e f e a t u r e ( F i i s ¬ I ) ( F i i s ¬ R ) D o B ( F i , c o u l d b e f e a t u r e ) = max ( ( 1 D o B ( F i , I ) ) , ( 1 D o B ( F i , R ) ) )
Lastly, if a feature is classified as Questionable (Q), then the answer does not make sense, i.e., the answer is unreliable. From this viewpoint, a feature is unreliable means that it is classified as Q. This yields the following formulation:
F i i s a u n r e l i a b l e f e a t u r e F i i s Q D o B ( F i , u n r e l i a b l e f e a t u r e ) = D o B ( F i , Q )

4. Results and Discussions
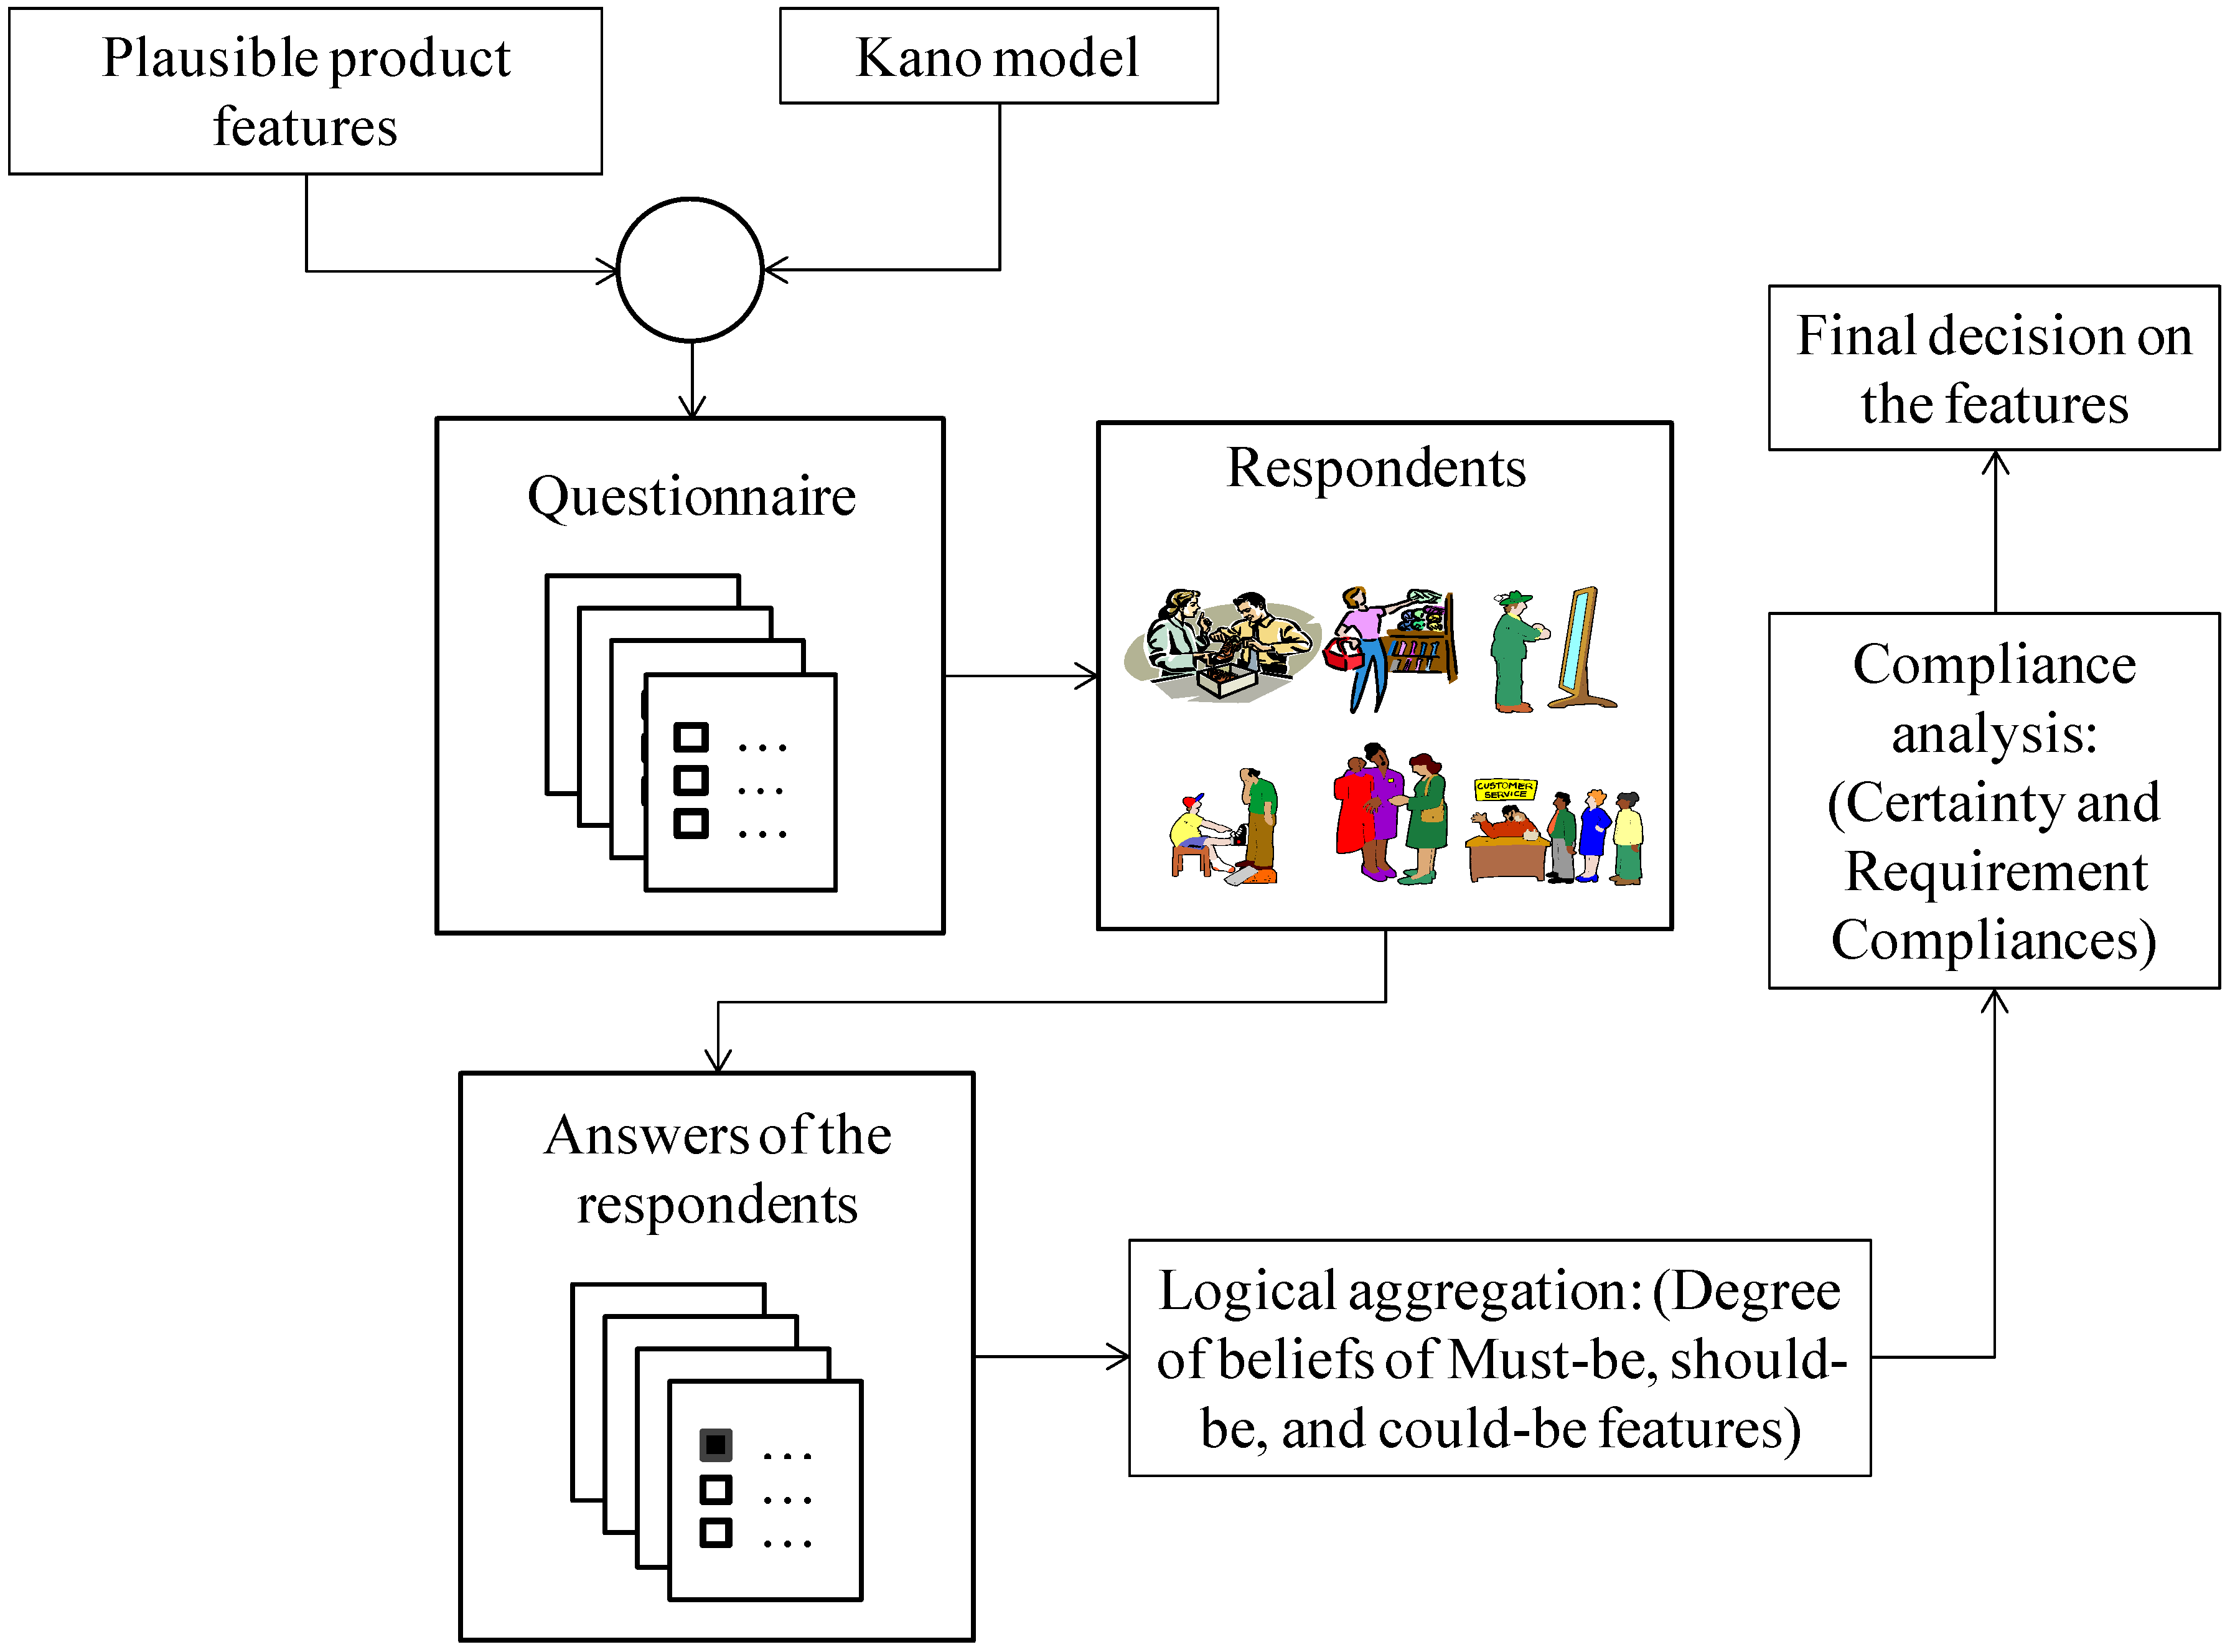
This section describes how the logical formulation described in the previous sections has been implemented to deal with the customer needs. For the implementation, a customer needs aggregation framework is considered, as illustrated in Figure 3.
As seen from Figure 3, seven steps underlie the aggregation process. The steps are described as follows.
Step 1
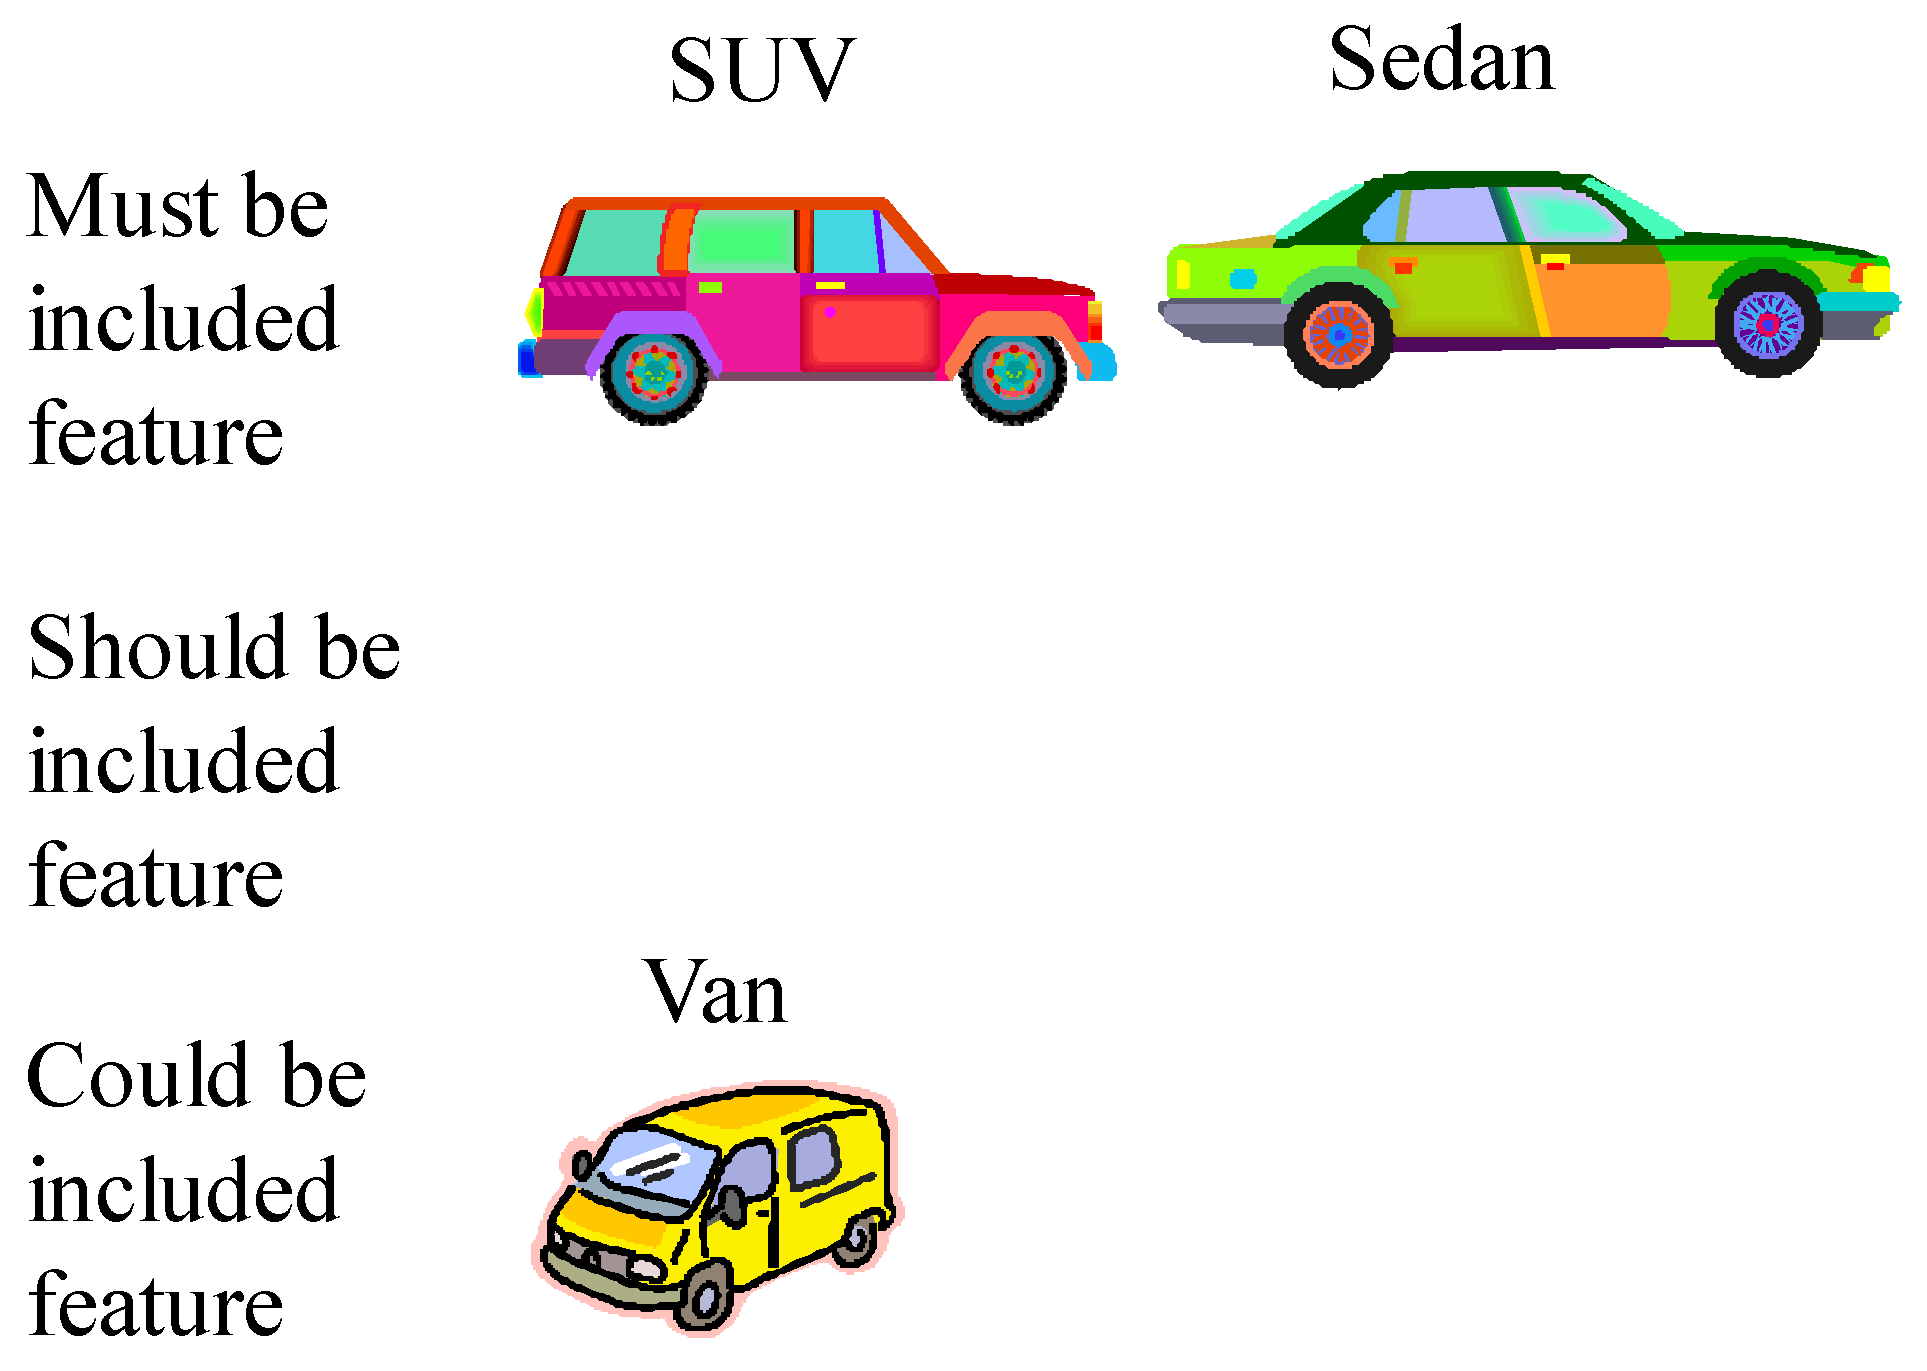
Considering plausible product features (e.g., the features called Sedan, SUV, and Van for a product called car) and a customer needs model (e.g., the Kano model)
Step 2
Developing a questionnaire
Step 3
Sending the developed questionnaire to certain respondents
Step 4
Collecting the respondents’ opinions based on the developed questionnaire
Step 5
Performing logical aggregation through the Degree of Belief (DoB) of all features in terms of must-be, should-be, and could-be features
Step 6
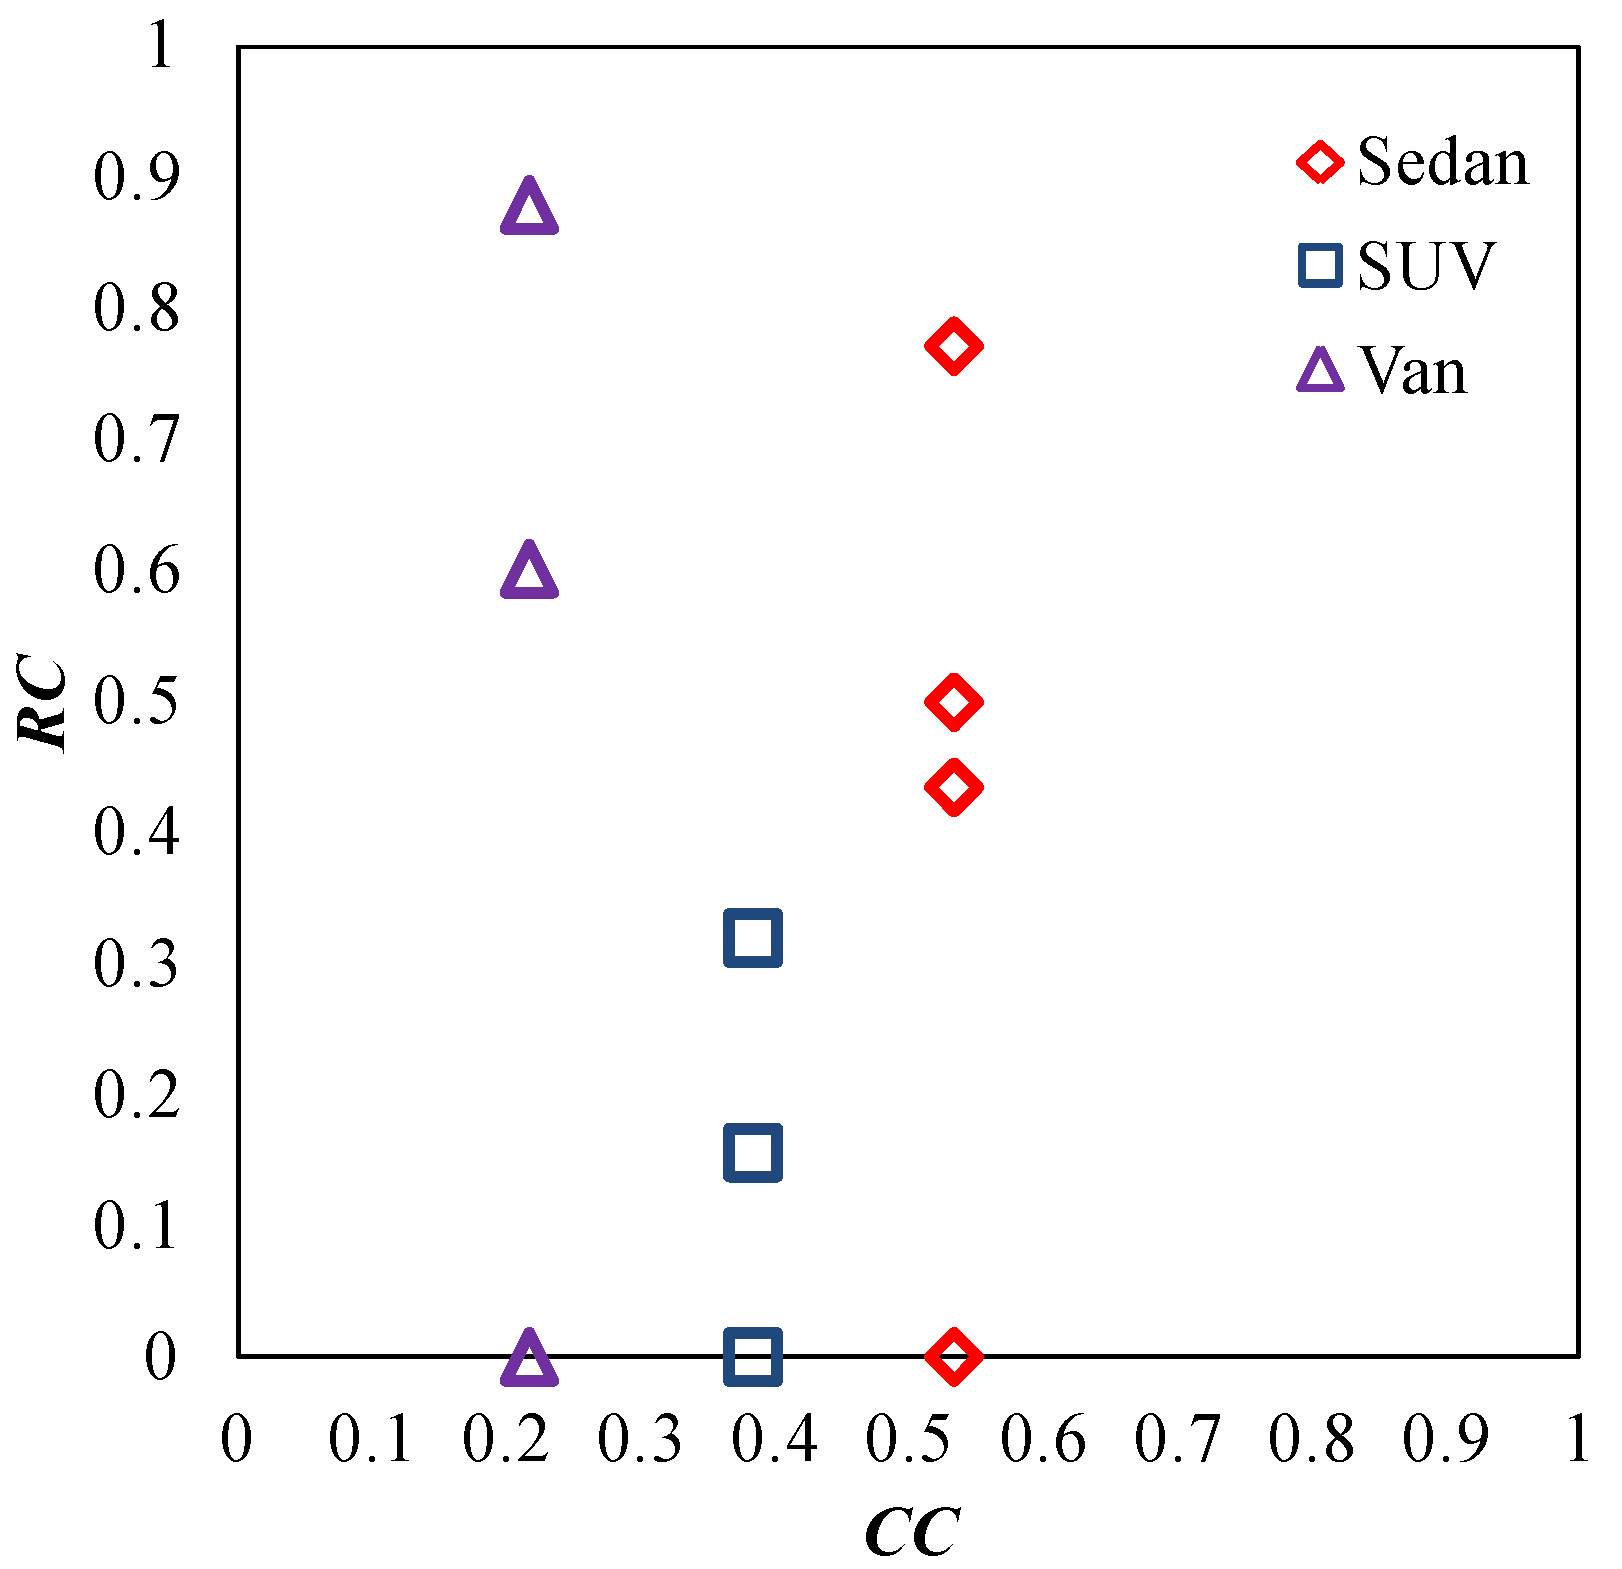
Ranking the features based on the compliance analysis using the quantity called certainty and requirement compliances denoted as CC and RC, respectively
Step 7
Making final decision on the features

4.1. Implementation

This subsection describes the results obtained by executing the aforementioned seven steps. The results obtained by executing Steps 1–5 are described first, which is followed by the descriptions of the results obtained by executing the Steps 6–7.

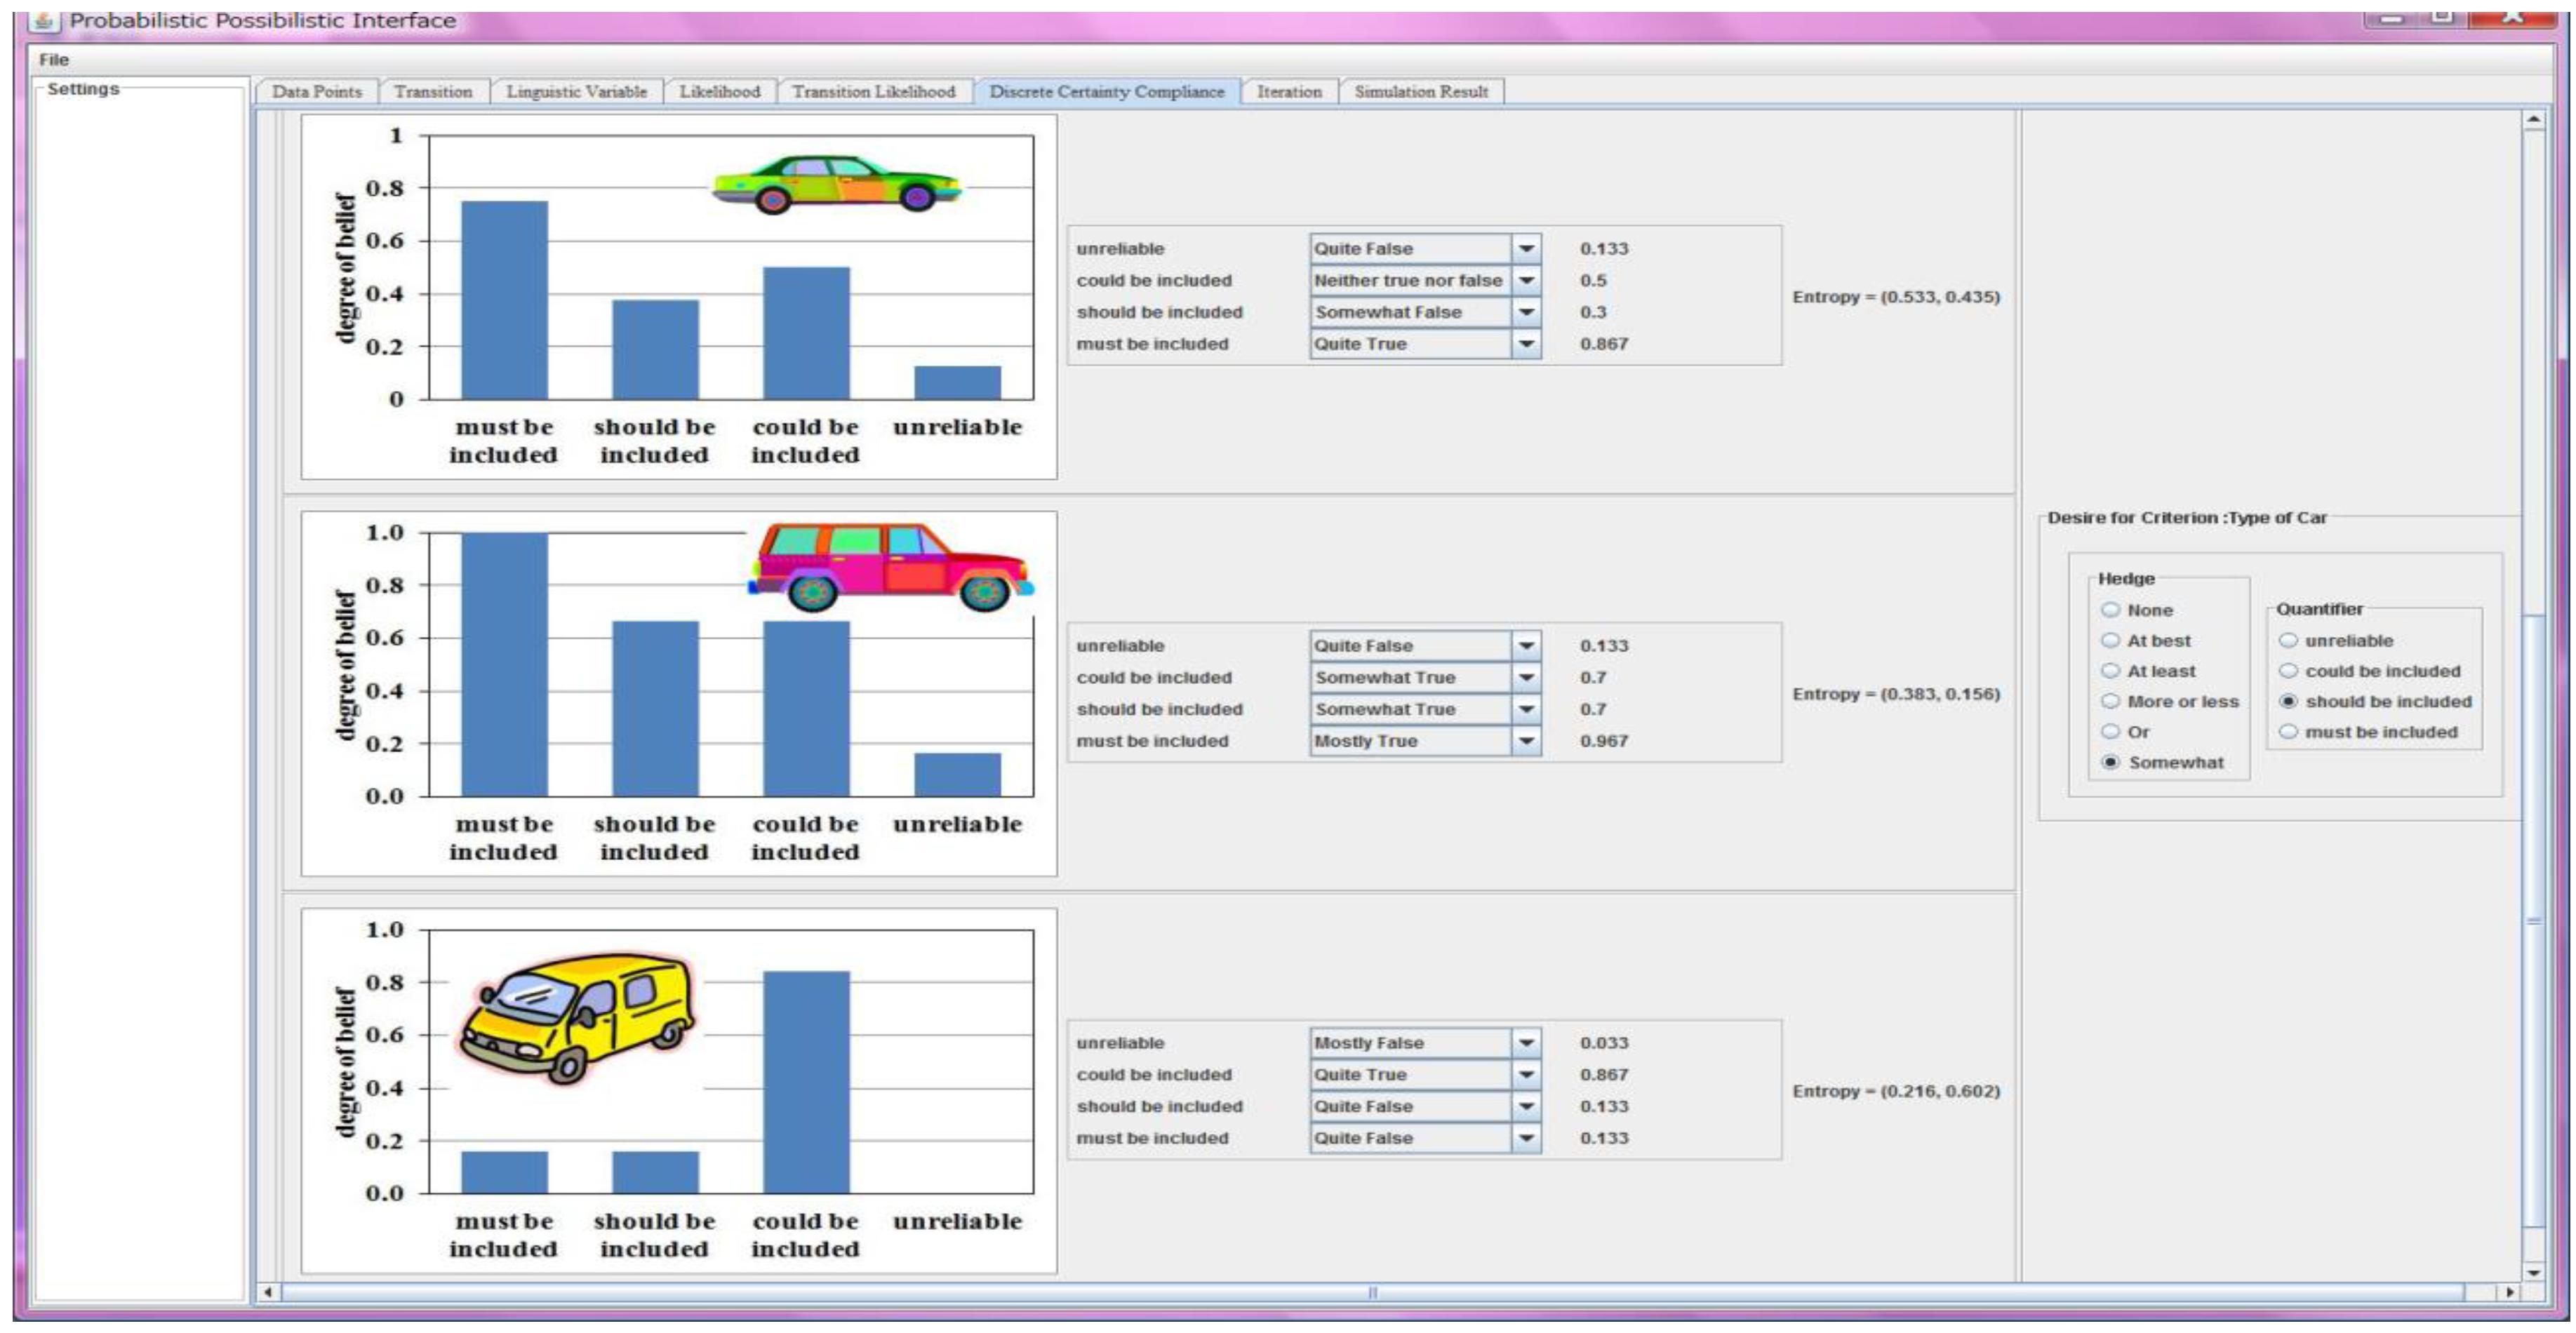
4.1.1. Execution of Steps 1–5

A total of 100 respondents were asked to answer a set of questions. The questions deal with different aspects of a small passenger vehicle. Certain questions were formatted using the present-not-present style of questioning as shown in Table 1.
The results related to three features, namely, Sedan, SUV, and Van, are reported in this article. Needless to say, the questions regarding these features were formulated using a present-not-present style of questioning, as shown in Table 1. The study was conducted in Bangladesh in the months of December 2011–March 2012. The answers of the 50 respondents selected at random out of 100 responded have been analyzed for this study. A plot in Figure 4 shows the relative frequencies of Sedan, SUV, and Van, i.e., the product features considered.
Consider first the relative frequencies of Sedan shown in Figure 4. Most of the respondents consider Sedan to be an indifferent (I) feature. This conclusion does not make sense because a large number of customers in Bangladesh prefer to use sedans and are quite satisfied with sedan-type vehicles. Consider the relative frequencies of SUV, as shown in Figure 4. Similar to the previous case, most of the respondents consider SUV to be an indifferent (I) feature. This conclusion also does not make any sense because numerous vehicle users prefer SUVs due to the suboptimal road conditions in Bangladesh. According to the relative frequencies shown in Figure 4, Van is a reverse feature, i.e., most of the respondents hate this type of vehicle. This conclusion is somewhat unrealistic because certain users prefer vans because it helps them travel with a large family—a common scenario in Bangladesh. Therefore, it is not appropriate to make a decision based on the relative frequency, as mentioned above.
The alternative is to use the logical process as described in the previous sections. To apply the logical process, first, the DoBs of Sedan, SUV, and Van were determined, as shown in Figure 5. To do this, the procedure defined in Equation (11) was used. Afterwards, the DoBs of the statuses (see State in Section 2) of the features Sedan, Van, and SUV were calculated, as shown in Figure 6, using the procedure defined in Equations (12)–(15). The DoBs shown in Figure 6 can be used to make a final decision by executing the steps 6–7, as described in the following subsection.

4.1.2. Execution of Steps 6–7

The final evaluation of the features called Sedan, SUV, and Van was done based on the concept of information content for the multi-valued logical situations (a situation similar to that of this study). The information content means here an ordered-pair (CC, RC), which has been found effective in quantifying the epistemic uncertainty in design [16,26,27,28]. The results are summarized in Table 2. The values of (CC, RC) listed in Table 2 underlie the following calculation process.
In this study, CC is called the certainty compliance that measures the variability in the DoBs of the members of State for a given feature (Sedan, SUV, or Van) and RC is called the requirement compliance that quantifies the degree of fulfillment of a given requirement. In particular, one of the following propositions (RE) sets the requirement: X is a must-be included feature, X is a should-be included feature, X is a could-be included feature, X is a somewhat should-be included feature, and X is a must-be or should-be included feature. The user interface of a system, presented elsewhere [26,27] and shown in Figure 7, is used to calculate the information content in terms of (CC, RC). In this system, the information content in terms of (CC, RC) is defined as follows.
C C ( F i ) = j = 1 4 I c ( D o B ( F i , S j ) ) 4    s o t h a t    I c = { D o B 0 0.5 0    D o B < 0.5 1 D o B 1 0.5    o t h e r e w i s e
R C ( F i ) = { 0 d > a 1 d < b a d a b o t h e r w i s e s o t h a t d = D o B ( R E ) a = max j = 1 4 ( D o B ( F i , S j ) ) b = min j = 1 4 ( D o B ( F i , S j ) )
As defined in Equations (16) and (17), the values of DoB(Fi,Sj) and DoB(RE) are needed for calculating the values of CC and RC for each feature Fj ∈ {Sedan, SUV, Van}. In doing so, the numerical degrees of beliefs shown in Figure 6 are first converted to their respective linguistic counterparts, as described in Section 2.2. The expected values of the respective linguistic truth-values based on the centriod method (E(.), see Section 2.2) are considered the degrees of belief of the respective features and used while executing Equations (16) and (17). Therefore, the DoBs corresponding to Equations (16) and (17) refer to the expected values of the linguistic counterparts of the DoB shown in Figure 6. For example, consider the feature called SUV. For SUV, the linguistic truth-value of must-be included is mostly true (mt) because its numerical truth-value is equal to 1 (Figure 6), which belongs to the linguistic truth-value called mostly true more than it belongs to other linguistic truth-values, as illustrated in Figure 1. Since the expected value of mostly true (mt) is E(mt) = 0.967 (based on the centriod method), this value is considered the degree DoB(Fi = SUV, Sj = must-be included) of SUV when it is a must-be included feature.
Recall Table 2, which lists the information content of the three features for different requirements (RE). The results listed in Table 2 are also plotted in Figure 8. As seen from Figure 8, the variability in the information content of SUV is low compared to those of Sedan and Van. Van exhibits low information content when it is considered could-be included feature. When the requirement is set to must-be included feature or should-be included feature, Sedan’s information content becomes low. The same nature is seen for the feature called SUV. As such, the customers in Bangladesh prefer SUV and Sedan more than they prefer Van. SUV and Sedan must be included in the passenger vehicle population. On the other hand, Van could be included in the passenger vehicle population but not as many as SUV and Sedan. This decision is schematically illustrated in Figure 9.
The above results imply that the presented logical aggregation process leads to a reliable conclusion and is thereby effective in making decisions in the early stages of the product development process.

5. Concluding Remarks

To deal with the intrinsic complexity of customer needs, the logical aggregation of customer opinions is a better choice compared to that of a relative frequency-based analysis. This faculty of thought is demonstrated to be true by logically aggregating the field data of customer needs collected from Bangladesh regarding small passenger vehicles. Here, the concept of possibility plays a vital role rather than the concept of probability. Thus, multi-valued logic or fuzzy logic plays an important role in the computation. For the sake of a clearer understanding, customer opinion data was obtained using a Kano-model-based questionnaire. One may reformulate the logical operations to define the categories (must-be, should-be, could-be, and unreliable) in accordance with the underlying customer needs model. Further studies can be carried out to customize the methodology presented in this study for other customer needs models.

Author Contributions

Md. Mamunur Rashid and AMM Sharif Ullah formulated the Introduction section. AMM Sharif Ullah formulated the Preliminaries section. Md. Mamunur Rashid and AMM Sharif Ullah formulated the Logical Aggregation section. Md. Mamunur Rashid formulated the Results and Discussions section. AMM Sharif Ullah wrote the paper.

Conflicts of Interest

The authors declare no conflict of interest.

References

  1. Dieter, G.E.; Schmidt, L.C. Engineering Design, 4th ed.; McGraw-Hill: New York, NY, USA, 2009. [Google Scholar]
  2. Kahn, K.B. The PDMA Handbook of New Product Development, 2nd ed.; Wiley: New York, NY, USA, 2004. [Google Scholar]
  3. Ming, X.G.; Yan, J.Q.; Lu, W.F.; Ma, D.Z. Technology Solutions for Collaborative Product Lifecycle Management Status Review and Future Trend. Concurr. Eng. 2005, 13, 311–319. [Google Scholar] [CrossRef]
  4. Jiao, J.; Zhang, L.; Pokharel, S. Process Platform Planning for Variety Coordination from Design to Production in Mass Customisation Manufacturing. IEEE Trans. Eng. Manag. 2007, 54, 112–129. [Google Scholar] [CrossRef]
  5. Jiao, J.; Helander, M. Development of an Electronic Configure-to-Order Platform for Customised Product Development. Comput. Ind. 2006, 57, 231–244. [Google Scholar] [CrossRef]
  6. Jiao, J.; Zhang, Y. Product Portfolio Planning with Customer-Engineering Interaction. IIE Trans. 2005, 37, 801–814. [Google Scholar] [CrossRef]
  7. Jin, J.; Ji, P.; Kwong, C.P. What makes consumers unsatisfied with your products. J. Eng. Appl. Artif. Intell. 2016, 47, 38–48. [Google Scholar] [CrossRef]
  8. Kong, F.; Ming, X.G.; Wang, L.; Wang, P.; Zuo, H.; He, L. An integrated modularity approach for green product development. Int. J. Environ. Technol. Manag. 2011, 14, 397–416. [Google Scholar] [CrossRef]
  9. Kano, N.; Seraku, N.; Takahashi, F.; Tsuji, S. Attractive quality and must-be quality. Hinshitsu 1984, 14, 39–48. (In Japanese) [Google Scholar]
  10. Meng, Q.L.; Jiang, X.; Bian, L.L. A Decision-Making Method for Improving Logistics Services Quality by Integrating Fuzzy Kano Model with Importance-Performance Analysis. J. Serv. Sci. Manag. 2015, 8, 322–331. [Google Scholar] [CrossRef]
  11. Meng, Q.L.; Jiang, X.; He, L.; Guo, X. Integrating Fuzzy Theory into Kano Model for Classification of Service Quality Elements: A Case Study of Machinery Industry in China. J. Ind. Eng. Manag. 2015, 8, 1661–1675. [Google Scholar]
  12. Rashid, M.M.; Tamaki, J.; Ullah, A.M.M.S.; Kubo, A. A Numerical Kano Model for Compliance Customer Needs with Product Development. Ind. Eng. Manag. Syst. Int. J. 2011, 10, 140–153. [Google Scholar] [CrossRef]
  13. Rashid, M.M.; Tamaki, J.; Ullah, A.M.M.S.; Kubo, A. A Virtual Customer Needs System for Product Development. In Proceedings of the 2010 Annual Meeting of Japan Society for Precision Engineering, Sapporo, Japan, 4 September 2010; pp. 53–54.
  14. Rashid, M.M.; Ullah, A.M.M.S.; Sarker, M.A.R.; Tamaki, J.; Kubo, A. Logical Aggregation of Customer Needs Assessment. In Proceedings of the Fifth International Symposium on Computational Intelligence and Industrial Applications (ISCIIA2012), Sapporo, Japan, 20–26 August 2012.
  15. Rashid, M.M.; Ullah, A.M.M.S.; Tamaki, J.; Sarker, M.A.R. Epistemic Uncertainty Study of the Conceptual Phase of Product Development by Multi-Valued Logic and Information Content. In Proceedings of the International Conference on Mechanical, Industrial and Materials Engineering 2013 (ICMIME2013), RUET, Rajshahi, Bangladesh, 1–3 November 2013.
  16. Ullah, A.M.M.S.; Tamaki, J. Analysis of Kano-Model-Based Customer Needs for Product Development. Syst. Eng. 2011, 14, 154–172. [Google Scholar] [CrossRef]
  17. Wang, P.; Ming, X.G.; Li, D.; Wu, Z.; Xu, Z.; Song, W. Achieving sustainability through product-service life cycle management. Int. J. Environ. Technol. Manag. 2011, 14, 516–530. [Google Scholar] [CrossRef]
  18. Xu, Q.; Jiao, R.J.; Yang, X.; Helander, M.; Khalid, H.M.; Opperud, A. An analytical Kano model for customer need analysis. Des. Stud. 2009, 30, 87–110. [Google Scholar] [CrossRef]
  19. Dubois, D.; Prade, H. Possibility Theory: An Approach to Computerized Processing of Uncertainty; Plenum Press: New York, NY, USA, 1988. [Google Scholar]
  20. Dubois, D.; Foulloy, L.; Mauris, G.; Prade, H. Probability-Possibility Transformations, Triangular Fuzzy Sets, and Probabilistic Inequalities. Reliab. Comput. 2004, 10, 273–294. [Google Scholar] [CrossRef]
  21. Ullah, A.M.M.S.; Shamsuzzaman, M. Fuzzy Monte Carlo Simulation using Point-Cloud-Based Probability-Possibility Transformation. Simulation 2013, 89, 860–875. [Google Scholar] [CrossRef]
  22. Zadeh, L.A. Fuzzy sets as a basis for a theory of possibility. Fuzzy Sets Syst. 1978, 1, 3–28. [Google Scholar] [CrossRef]
  23. Klir, G.J. On fuzzy-set interpretation of possibility theory. Fuzzy Sets Syst. 1999, 108, 263–273. [Google Scholar] [CrossRef]
  24. Mauris, G. Possibility distributions: A unified representation of usual direct-probability-based parameter estimation methods. Int. J. Approx. Reason. 2011, 52, 1232–1242. [Google Scholar] [CrossRef]
  25. Yamada, K. A Study on Probability-Possibility Transformation Methods Based on Evidence Theory. J. Jpn. Soc. Fuzzy Theory Syst. 2001, 13, 302–312. (In Japanese) [Google Scholar]
  26. Ullah, A.M.M.S.; Harib, K.H. An Intelligent Method for Selecting Optimal Materials and Its Application. Adv. Eng. Inform. 2008, 22, 473–483. [Google Scholar] [CrossRef]
  27. Ullah, A.M.M.S.; Harib, K.H.; Al-Awar, A. Minimizing Information Content of a Design using Compliance Analysis; SAE Technical Paper 2007-01-1209; SAE International: Warrendale, PA, USA, 2007. [Google Scholar]
  28. Ullah, A.M.M.S.; Rashid, M.M.; Tamaki, J. On Some Unique Features of C-K Theory of Design. CIRP J. Manuf. Sci. Technol. 2012, 5, 55–66. [Google Scholar] [CrossRef]
Figure 1. Linguistic truth-values.
Systems 04 00017 g001
Figure 2. The Kano model [16].
Systems 04 00017 g002
Figure 3. Customer needs aggregation framework.
Systems 04 00017 g003
Figure 4. Relative frequencies of the members of Class.
Systems 04 00017 g004
Figure 5. DoBs of the members of Class.
Systems 04 00017 g005
Figure 6. DoBs of the members of State.
Systems 04 00017 g006
Figure 7. Determining information content of the states.
Systems 04 00017 g007
Figure 8. Variability in the information content.
Systems 04 00017 g008
Figure 9. Relative positions of features.
Systems 04 00017 g009
Table 1. Classification of Fi based on present-not-present answers [16].
Present (↓)Not Present
LikeMust-beNeutralLive-withDislike
LikeQAAAO
Must-beRIIIM
NeutralRIIIM
Live-withRIIIM
DislikeRRRRQ
Table 2. Information content of the features.
Requirement (RE)X
SedanSUVVan
X must be included(0.533, 0)(0.383, 0)(0.216, 0.88)
X should be included(0.533, 0.772)(0.383, 0.32)(0.216, 0.88)
X could be included(0.533, 0.5)(0.383, 0.32)(0.216, 0)
X somewhat should be included(0.533, 0.435)(0.383, 0.156)(0.216, 0.602)
X must be or should be included(0.533, 0.0)(0.383, 0)(0.216, 0.88)
-(CC, RC)

