1. Introduction
As higher education policy has shifted from quantitative expansion toward quality improvement, differentiated development, and the systematic training of innovative talent, academic competitions have received greater institutional attention. In computer science, competition training often occurs outside the formal classroom, but it remains closely connected with knowledge application, algorithmic thinking, engineering practice, teamwork, and performance assessment. This article therefore treats competitions as institutionally organized, award-visible practices with possible co-curricular functions, rather than assuming that award records alone demonstrate curricular integration or learning outcomes.
From a systems perspective, the empirical question concerns both the number of awards won by universities and their distribution across institutions, competition categories, and years. The causal-loop framework separately identifies plausible relations among competition provision, institutional mobilization, mentoring, participation, reputation, and governance. Those relations are propositions for future process-based research; the present award data test only the observable distributional patterns.
The issue is particularly relevant in China because national excellence initiatives, competition for resources, and performance evaluation have shaped institutional stratification. Academic competitions are institutionally visible and may be used in programme development, publicity, assessment, or faculty incentives, but the present dataset does not observe the extent or form of such use within individual universities.
This article treats award records as measures of neither student learning nor internal organizational mechanisms. They provide a bounded basis for describing expansion, the distribution of recorded awards, inter-university inequality, positional persistence among continuing award-visible universities, and portfolio configurations. Feedback, reputation, resource allocation, mentoring, inclusion, and deliberate adaptation are retained only as untested propositions.
Previous studies provide the basis for this analysis but leave three gaps. First, research on co-curricular learning and student engagement explains the educational potential of competitions, but it rarely examines how competitions are converted into organizational performance signals. Second, systems-thinking research offers tools for analyzing feedback, boundaries, delays, and causal mapping, but these tools are seldom connected with long-term, large-scale co-curricular data. Third, studies of Chinese higher education stratification show the importance of resources and policy environments, but they rarely examine concrete co-curricular arenas.
Against this background, the study addresses three research questions. RQ1: How did the recorded scale and category distribution of Chinese university computer science competition awards change over time? RQ2: What forms of inter-university inequality are visible in the award records, how is that inequality decomposed under the selected provincial grouping, and how stable are the positions of universities active in adjacent years? RQ3: What descriptive portfolio configurations can be identified from recorded category breadth, outcome composition, concentration, growth, and scale?
This study makes three bounded contributions. It uses systems thinking to separate observed award structures from untested organizational mechanisms, and it combines longitudinal descriptive indicators, inequality decomposition, rank correlation, and clustering within an explicit evidence hierarchy. The analysis also shows that recorded expansion and category diversification coexisted with persistent inequality, positional stability among continuing award-visible universities, and heterogeneous portfolio configurations.
2. Literature Review and Theoretical Background
2.1. Co-Curricular Learning, Student Engagement, and Competition-Based Education
Co-curricular learning refers to educational activity outside the formal classroom that remains closely connected with programme objectives, curricular structures, and learning outcomes [
1,
2]. Compared with extracurricular activity in the broader sense, co-curricular practice gives greater attention to institutional design, embedded learning goals, process support, and outcome assessment. From this perspective, academic competitions may have educational value because they can stimulate competitive motivation and bring knowledge application, teamwork, project-based practice, and public evaluation into a quasi-institutionalized learning setting.
Research on student engagement further suggests that learning outcomes reflect interactions among student agency, institutional environment, support mechanisms, and evaluation structures, rather than individual effort alone [
3,
4,
5,
6]. Thus, when competitions are incorporated into departmental assessment, programme development, faculty mentoring, and student incentive systems, they are no longer merely voluntary student activities. They become part of the organizational environment of higher education.
Research on competition-based learning suggests that clear goals, immediate feedback, and rule-governed comparison can improve student engagement and performance [
7]. In computer science education, contest-like programming tasks and automated or gamified assessment environments have been used to extend computational-thinking and problem-solving experiences beyond the classroom [
8,
9]. At the same time, research from a social-comparison perspective indicates that competition may increase attention to rankings and external evaluation, which can crowd out process-oriented learning [
10]. The educational value of competitions therefore depends on how they are embedded in curricular alignment, mentoring support, formative feedback, and capability building.
2.2. Systems Thinking and Complex Adaptive Systems in Higher Education
Systems thinking attends to holistic functioning, relationships among components, system boundaries, feedback processes, temporal delays, nonlinear dynamics, and emergent properties [
11,
12]. In higher education research, educational processes and institutional organizations have been conceptualized as complex systems or complex adaptive systems [
13,
14,
15,
16]. From this perspective, learning practices, institutional governance, evaluative mechanisms, and equity-related outcomes arise from interactions among actors and institutional levels rather than from the linear accumulation of independent variables.
In system dynamics, causal loop diagrams are used to set system boundaries, specify mechanistic hypotheses, and organize relationships among structural variables [
17,
18,
19]. This study uses causal loop diagrams as a boundary object to structure theoretical reasoning and guide empirical operationalization. The approach is consistent with critical systems thinking and systems-methodology selection, which hold that method choice should fit both the problem situation and the available evidence [
20]. Here, the method is not used for calibrated system dynamic simulation or for quantitative estimation of causal effect magnitudes.
Here, systems thinking is used to set boundaries and distinguish observed structures from hypothesized processes. Potential governance levers may include access, mentoring, evaluation signals, shared platforms, and differentiated learning pathways, but their effects are not tested in this study. They are therefore discussed only as questions for governance and future research.
2.3. Stratification, Performance Governance, and Organizational Response in Chinese Higher Education
The development of Chinese higher education has long been shaped by national strategic excellence initiatives, hierarchical resource allocation, and institutional performance evaluation. From Project 211 and Project 985 to the ongoing Double First-Class Initiative, competitive resource distribution and institutional stratification have become prominent features of China’s higher education system [
21,
22,
23,
24,
25]. The officially released National College Student Competition Analysis Report [
26] also reflects the incorporation of undergraduate competitions into national assessment and analytical practices. As academic competitions have been incorporated into university operations, competition awards have gradually become part of institutional reputation building, quality assessment, and internal incentive governance.
From a multi-level governance perspective, the operation of academic competitions involves coordination among national policy authorities, industrial and institutional organizers, tertiary institutions, and university departments [
27]. Within this stratified and performance-oriented setting, repeated award signals may be associated with persistent institutional differences and award-centred evaluation. In this study, award-centrism is treated as an untested proposition concerning excessive reliance on the quantity and rank of competition awards as proxy indicators of educational quality. The present data do not observe such evaluation practices or establish that they displace process-based learning, inclusive student participation, or capacity development.
Universities may respond differently to external institutional environments and heterogeneous resource conditions [
28,
29,
30]. The present study does not observe internal strategic decision making. It therefore uses the narrower term competition-portfolio configuration for patterns in recorded awards across tracks; any interpretation of those configurations as deliberate organizational adaptation remains a hypothesis requiring longitudinal process evidence.
2.4. Positioning the Study Within Systems Thinking in Higher Education
Unlike studies that primarily examine students’ systems-thinking competence or classroom interventions, this article uses systems thinking as an analytical approach to higher education organization. The approach identifies system boundaries, feedback loops, signal flows, points of entry, and governance levers in co-curricular practice.
Prior research has examined systems thinking in higher education as a pedagogical approach [
31,
32], a tool for causal mapping [
33,
34], an approach to organizational improvement [
35], and a basis for assessing complex reasoning [
36]. Related research on competitive programming has used longitudinal ICPC records to examine participation trends and to construct retrospective contest datasets [
37,
38]. The present study takes a narrower organizational-analytic direction: longitudinal award indicators describe expansion, concentration, inequality, persistence, and portfolio configuration, while the causal-loop diagram organizes propositions that cannot be tested with award records alone.
3. Analytical Framework
3.1. Why a Systems-Thinking Approach Is Necessary
A systems-thinking approach is appropriate because the study examines patterns across years, institutions, competition categories, and governance levels rather than a single input–output relation. In Chinese higher education, national initiatives, evaluation, discipline competition, and internal incentives may interact, but those processes are not measured here. The empirical analysis is therefore descriptive and distributional; it does not attribute observed award patterns to faculty teams, resource reinvestment, reputation, or organizational capacity.
The broader problem context also extends beyond the forces observable in the award records. In Chinese higher education, political priorities, economic and regional conditions, technological change, institutional evaluation, and faculty and student participation decisions may interact in ways that affect competition provision, topic selection, mentoring arrangements, and recorded outcomes. These interactions may also generate unintended or emergent consequences. The present dataset cannot identify these processes or determine their effects. They are therefore treated as contextual features of the problem situation and as propositions for future research, rather than as empirically established mechanisms.
The empirical boundary comprises recorded awards in Chinese university computer science competitions. Four dimensions are examined: recorded expansion, distribution across competition categories, inter-university inequality and positional stability, and portfolio configuration. Resource reinvestment, mentoring, internal incentives, access, and learning outcomes fall outside this boundary and appear only as propositions in the conceptual framework.
3.2. Causal-Loop Representation and Empirical Operationalization
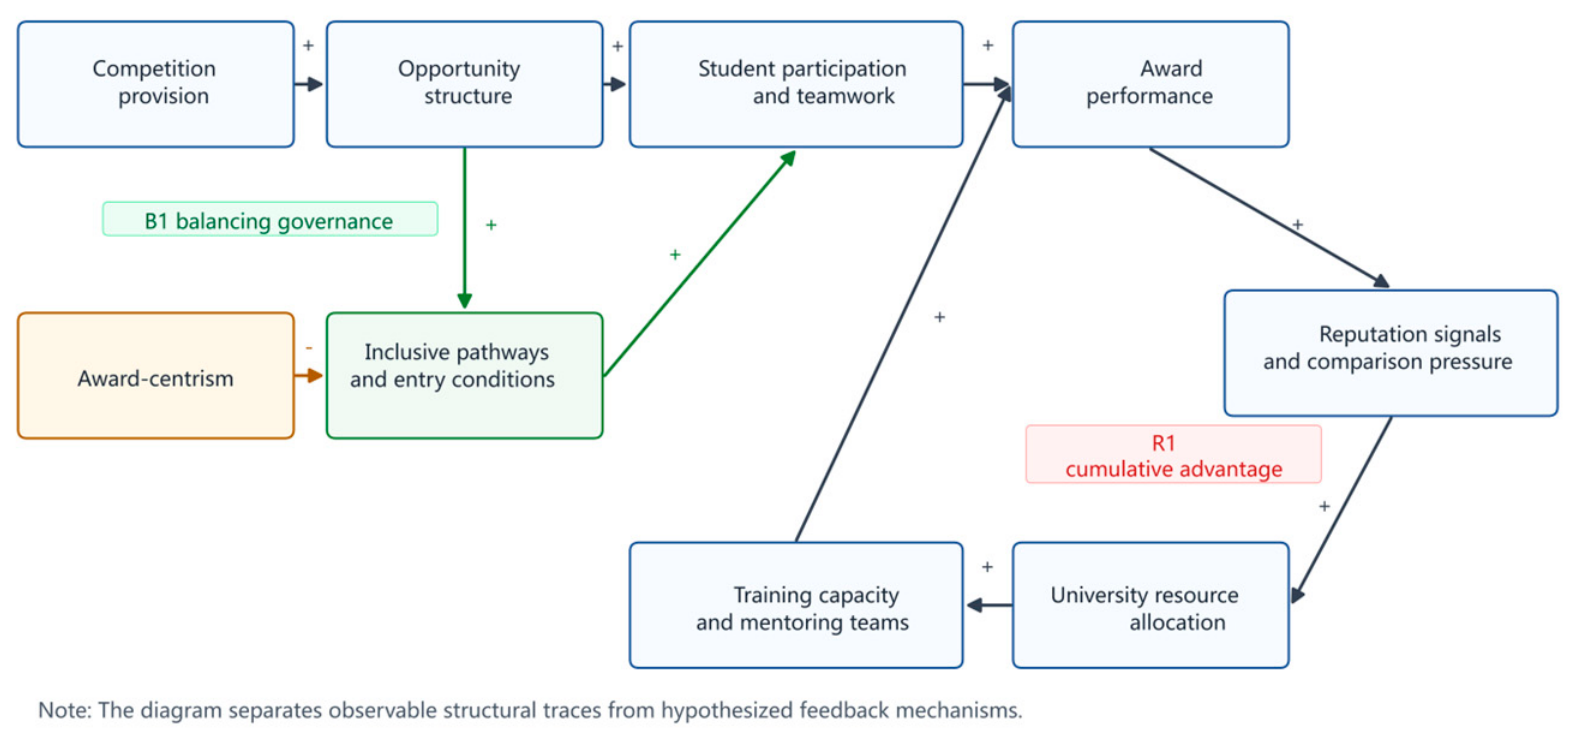
Figure 1 presents the proposed operation of the competition system and provides the conceptual basis for the empirical analysis. Its main purpose is to define the system boundary, identify key relationships, and clarify which structures can be observed in the data and which processes remain hypothesized feedback mechanisms requiring further validation. In this sense,
Figure 1 is not a parameterized system-dynamic simulation and is not used for causal effect identification.
The upper pathway in
Figure 1 shows the structural relations that are more readily observable in the competition system. Changes in the number of competitions, the diversity of tracks, and organizational support may affect the recorded distribution of awards across competition categories. In this study, competition provision refers mainly to the expansion of competition numbers, track types, and organizational support, whereas the empirical proxy previously described as opportunity structure is limited to the distribution of recorded awards across competition categories. This proxy cannot, by itself, measure non-awarded participation, access conditions, or student-level opportunity. As competition provision expands and track types diversify, award records may shift from concentration in a small number of dominant tracks to multi-track coexistence.
Because the data used in this study are derived mainly from award records, student participation and teamwork can be identified only indirectly through visible awarded participation. Non-awarded teams, ordinary participants, and the quality of teamwork are outside the scope of the current dataset. Accordingly, the discussion considers participation and collaboration only through recorded award patterns; it does not directly measure individual participation, teamwork, or learning processes.
The R1 loop on the right side of
Figure 1 represents a theoretical expectation that earlier visible performance could reinforce later advantage. Higher award performance may produce reputation signals and comparison pressure among universities, which could then affect resource investment, training organization, and the development of mentoring teams. However, the available data do not directly identify resource returns, organizational incentives, or the use of reputation signals. R1 is therefore proposition-generating and is not treated as a verified internal causal chain.
The B1 loop represents a governance proposition rather than an estimated intervention effect. It asks whether changes in competition design, entry conditions, and support arrangements could affect the distribution of recorded outcomes. The present data measure category concentration and portfolio configuration but do not observe participation thresholds, non-awarded students, support processes, or learning outcomes. These elements are retained only to define questions for future process-based research.
The empirical analysis separates three evidential levels. Direct observations are universities, competition categories, years, award tiers, and award records. Derived descriptive indicators are concentration, effective category diversity, Gini and Theil measures, rank correlations among continuing award-visible universities, and portfolio configurations. Reputation use, resource reinvestment, award-centrism, mentoring development, inclusive pathways, and intentional adaptation are untested mechanisms. No result in this article is treated as evidence that these mechanisms occurred.
Table 1 states the theoretical rationale, available indicator, and evidential boundary for each relation in
Figure 1.
Table 2 maps the conceptual framework to the descriptive analyses. This structure prevents award records from being interpreted as direct evidence of internal resource flows, student learning, institutional strategy, or causal feedback.
Table 2 maps the conceptual framework to measurable indicators: expansion to recorded scale; category distribution to concentration and diversity; stratification to inter-university award inequality and provincial decomposition; positional persistence to adjacent-year rank correlation among continuing award-visible universities; and portfolio configuration to descriptive clustering. These indicators do not identify internal resource allocation, strategy, access, or learning effects.
In the Results and Discussion, category distribution refers only to the distribution of recorded awards across competition categories. It does not represent the full distribution of participation opportunities, eligible institutions, non-awarded teams, award quotas, or student access.
4. Data and Methods
4.1. Data Sources, Sample Boundary, and Verification Materials
This study uses national award records from Chinese university computer science competitions for 2012 to 2025. The records were compiled from competition databases, annual ranking files, and public award lists. These materials support an audit of the dataset but do not reconstruct every historical award-list page or year-specific change in source coverage. The unit of observation is the university–competition category–year–award-tier record. Records were retained when the university, year, competition category, and award tier could be identified and harmonized.
The final cleaned sample contains 247,652 national award records from 2012 to 2025 with identifiable university, year, competition category, and award-tier information, covering 1200 universities and 37 comparable competition categories. The main analytical sample is restricted to complete annual data from 2012 to 2024, comprising 208,803 records, 1176 universities, and 30 competition categories. The 2025 data contain 38,849 records, 1107 universities, and 28 competition categories. Because annual updates may be incomplete, these data are used only for a provisional descriptive check of recent structural continuity and are excluded from the main trend estimates.
We cleaned the data in four steps. First, university names were standardized to harmonize abbreviations, former names, renamed institutions, and campus-based variants. Second, competition titles were harmonized by mapping annual subtitle changes, track labels, and organizer-specific naming variations to stable competition category names. Third, records with missing university names, missing competition names, unidentifiable award tiers, or exact duplication were removed. Fourth, award tiers were mapped to a unified classification scheme, and the share of high-level awards was retained as a relative quality indicator.
4.2. Variables and Measurement Methods
Indicators of system expansion include the annual total number of award records, the annual number of award-visible universities, competition concentration, and the effective number of competitions. Competition concentration is measured using the Herfindahl-Hirschman Index , where denotes the total number of competition categories included in year , and denotes the share of competition category in all award records in year . The effective number of competitions is calculated as the exponential form of Shannon entropy . A higher indicates that award records are more concentrated across competition categories, whereas a higher indicates a larger number of effective competition tracks.
Organizational stratification was measured using university award-record counts, the Gini coefficient, the Theil index and its provincial decomposition, and the top-10 concentration ratio. The Gini coefficient was calculated over positive award-visible university counts in the specified window. For university i with award count , mean award count μ, and N award-visible universities, the Theil index was calculated as . Provincial decomposition used , where , , and denote the award-visible university count, mean award count, and within-group Theil index for province g. Non-award-visible institutions were outside the denominator. The estimates therefore describe inequality within the award-visible sample rather than exclusion from the full higher-education population.
Rank persistence is measured using Spearman rank correlations for universities that are active in both adjacent years. This indicator captures positional stability among continuing participants rather than entry–exit dynamics in the full population of universities. The measure may therefore understate volatility among peripheral participants and overstate path dependence among universities that remain active throughout the period.
Portfolio configurations were identified through K-means clustering of five derived indicators: recorded category breadth, high-level-award share, largest-category dependence, active-year-standardized breadth, and cumulative award-record scale.
Table 3 summarizes the operational definitions of these five clustering variables. Active-year-standardized breadth was calculated as ln [1 + (the number of recorded parent competition categories divided by the number of active years)], cumulative scale was calculated as ln(1 + total award records), and all five inputs were standardized as z scores. The final clustering dataset contained 1176 award-visible universities. We compared candidate solutions from
k = 2 to
k = 8 using the within-cluster sum of squares, silhouette, Calinski–Harabasz, Davies–Bouldin, minimum-cluster share, and interpretability. The retained four-cluster solution is a descriptive typology, not evidence of deliberate strategy or longitudinal adaptation.
4.3. Robustness and Replicability Design
Three robustness checks are reported. First, excluding 2020 assessed sensitivity to an unusually volatile year. Second, removing the three largest parent competition categories assessed sensitivity to event composition. Third, clustering robustness was assessed across
k = 2 to
k = 8, across random seeds, and after removing cumulative scale. The numerical results are reported in
Section 5.4. Analyses requiring student enrolment, eligible-institution counts, non-awarded teams, standardized event quotas, or alternative weighted-award solutions were not performed because consistent denominators were unavailable.
The methods reflect the information available in the dataset. Because the data consist mainly of cross-year award outcome records, rather than inter-actor relational data, internal process data, or student-level longitudinal records, the study prioritizes structural measurement, decomposition analysis, and clustering identification instead of network modelling, system-dynamic simulation, or quasi-experimental causal identification. This choice avoids claims that exceed what the available data can support.
5. Results
5.1. Recorded Expansion and Category Distribution
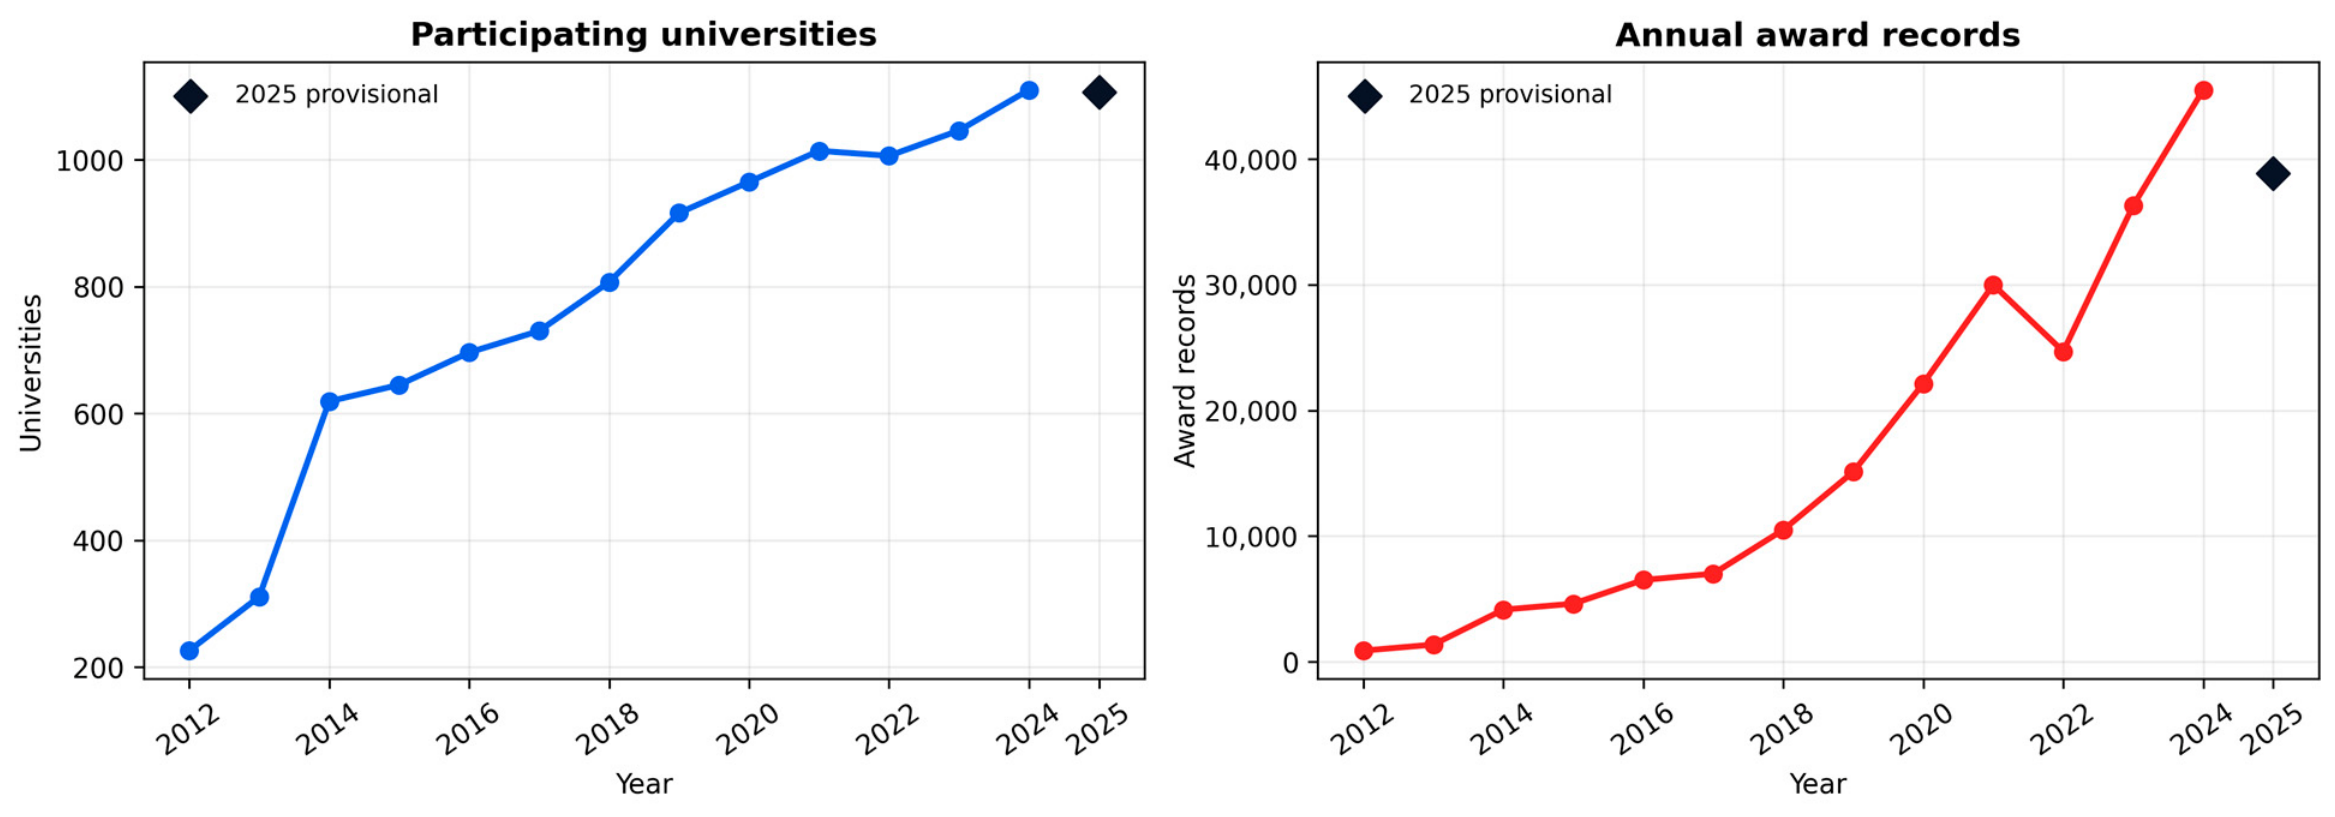
Over the study period, the recorded scale of Chinese university computer science competitions increased markedly. The number of award-visible institutions increased from 226 in 2012 to 1110 in 2024, while annual award records rose from fewer than 2000 to more than 40,000.
Figure 2 presents these annual trends, with the 2025 observations shown separately as a provisional continuity check. These changes show a large increase in recorded awards and the number of award-visible institutions. They should not, however, be read as direct evidence of deeper student participation, broader access, or stronger curricular integration, because award counts may also be affected by reporting coverage, competition format, award quotas, and prize-category expansion.
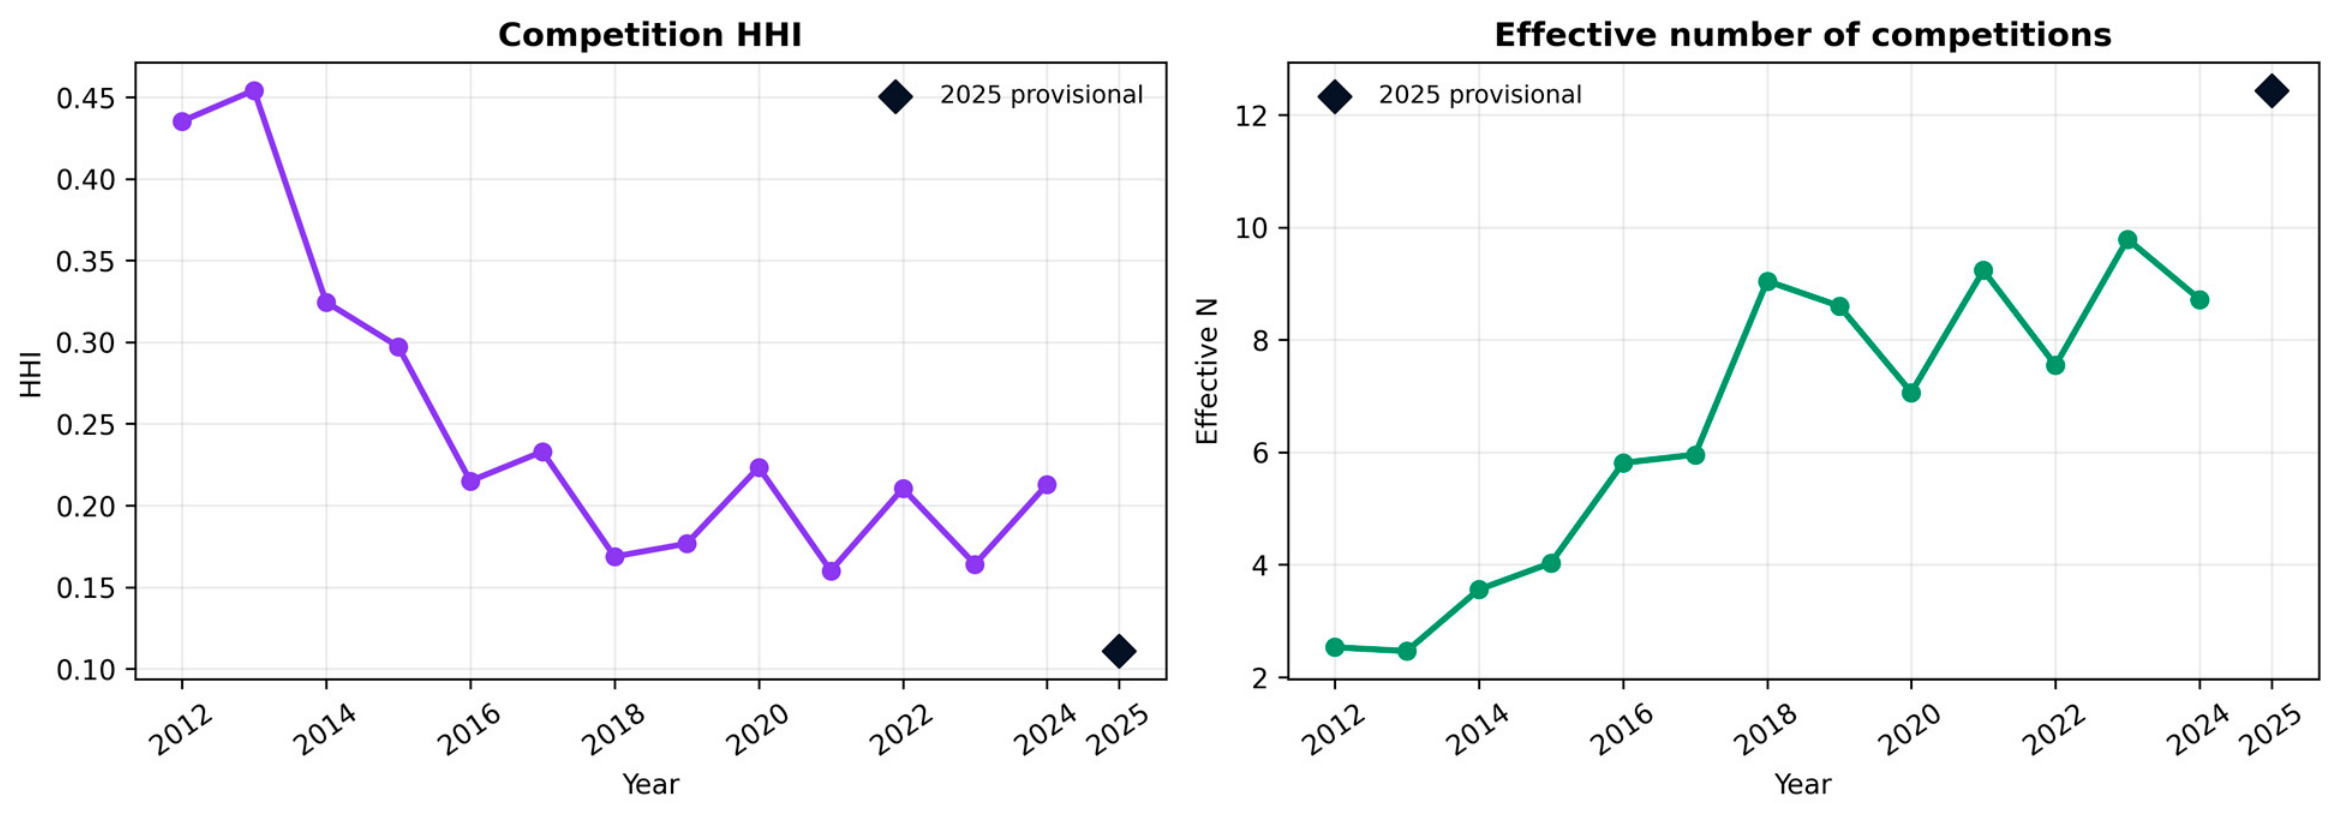
The distribution of recorded awards across competition categories also changed. The annual changes in competition concentration and effective category diversity are shown in
Figure 3. In 2012, the HHI was 0.435, indicating that records were concentrated in a small number of categories. Across the complete 2012–2024 series, the HHI declined overall despite year-to-year fluctuations. The provisional 2025 HHI was approximately 0.111. The effective number of recorded categories increased from 2.53 in 2012 to approximately 12.4 in the provisional 2025 data. These values describe diversification of recorded awards. They do not establish equivalent growth in participation opportunities or access.
Recorded growth reflected both the appearance of additional award-visible universities and increased award-record activity among previously visible institutions. These aggregates do not contain eligible-institution counts, student enrolment, non-awarded teams, or standardized event quotas. The analysis therefore cannot distinguish expanded access from award inflation, reporting changes, or changes in competition design.
5.2. Organizational Stratification in Competition Performance
To describe the overall distribution of university performance within the competition system, the study uses the Gini coefficient and the top-10 concentration ratio.
Table 4 summarizes the Gini coefficient and top-10 concentration ratio (CR10) for the selected time windows. The Gini coefficient remains above 0.62 across different time windows, indicating that inter-university performance differences are not episodic fluctuations but a persistent structural form of stratification.
The high Gini coefficient combined with a relatively moderate CR10 indicates a distribution with a small number of leading institutions and a long tail of universities. Inequality is therefore not produced solely by the absolute dominance of a tiny elite. It also reflects limited participation depth and low award counts among a large number of institutions.
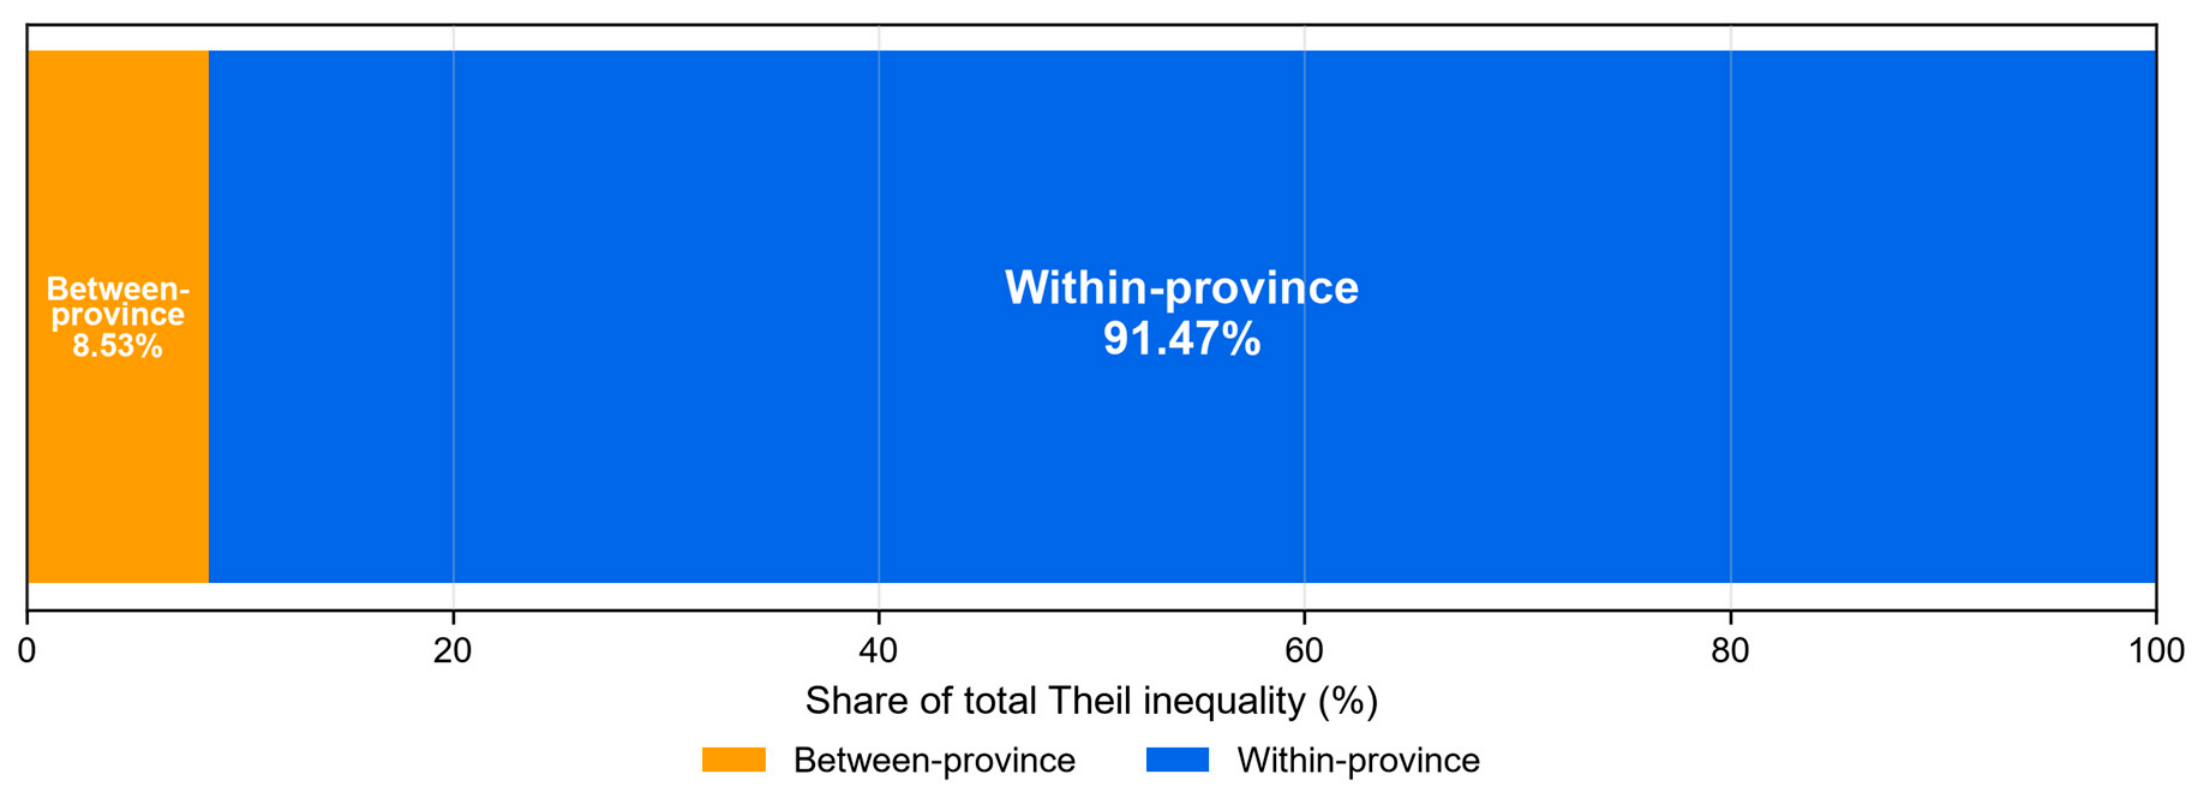
The Theil decomposition produced a total Theil index of 0.7217, with a between-province component of 0.0616 (8.53%) and a within-province component of 0.6601 (91.47%).
Figure 4 visualizes the decomposition into between-province and within-province components. Within the selected award-visible decomposition, inequality arose mainly from differences among universities within provinces rather than from differences in provincial means. This interpretation depends on the award-record denominator, province grouping, and exclusion of non-award-visible universities.
Within-province Theil values varied across the selected provinces. Among the values reported in
Table 5, the index ranged from 0.132 in Ningxia to 1.029 in Shanxi. Province-specific estimates may be unstable where few award-visible universities or records were available. We therefore use these values as descriptive context only and do not infer province-specific political, organizational, or causal mechanisms. The result is therefore limited to the aggregate decomposition under the stated denominator and grouping rules.
Table 6 reports the adjacent-year Spearman rank correlations for universities with recorded awards in both years.
Across the sample period, all 12 adjacent-year correlations from 2012 to 2013 to 2023–2024 remained relatively high, with an average of approximately 0.808. After 2016, most yearly correlations exceeded 0.80. This indicates positional stability among universities active in both adjacent years. Because entrants, exits, and intermittent participants are excluded from each adjacent-year correlation, the result refers to rank persistence among continuing award-visible institutions, not persistence in the entire university system.
The observed rank persistence is compatible with several explanations, including stable differences in university size, disciplinary specialization, regional development, student enrolment, source coverage, and persistent competition-selection effects. The present data cannot distinguish among these explanations or identify cumulative advantage as the underlying mechanism.
5.3. Competition-Portfolio Configurations
University award portfolios vary across institutions. The analysis therefore distinguishes descriptive participation histories, based on entry timing, active duration, cumulative output, and observed growth, from cross-sectional portfolio configurations derived by K-means from breadth, high-level-award share, largest-category dependence, active-year-standardized breadth growth, and cumulative scale. The four descriptive competition-portfolio configurations are summarized in
Table 7. Neither classification establishes intentional adaptation.
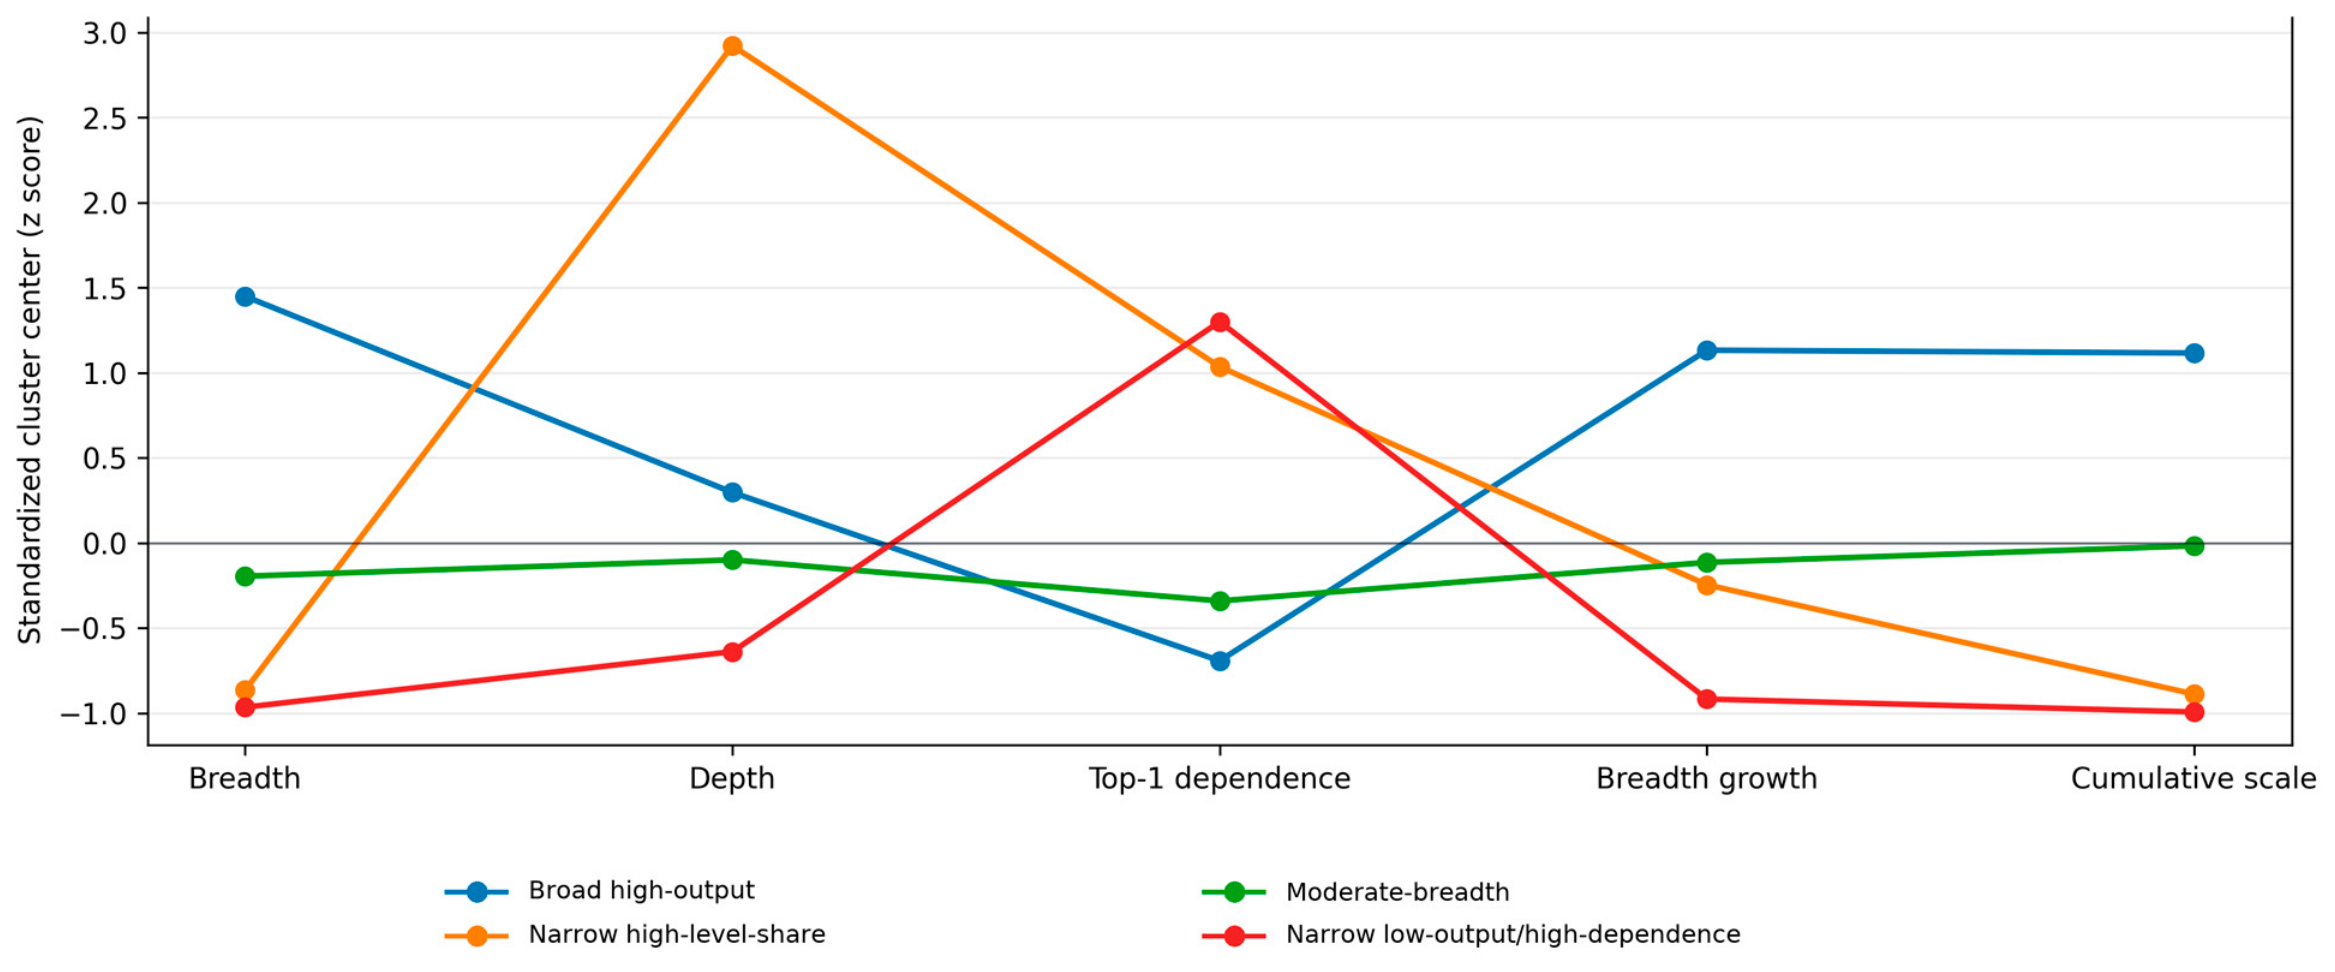
Figure 5 shows the standardized mean profiles of the five portfolio variables across the four descriptive configurations.
The four configurations describe differences only in the measured portfolio characteristics. Broad high-output configurations combine wider category coverage with larger recorded scale. Narrow high-level-share configurations cover fewer categories but have a larger high-level-award share. Moderate-breadth configurations occupy intermediate positions on breadth, concentration, and scale. Narrow low-output/high-dependence configurations have low recorded scale and high dependence on one category. These labels do not identify resources, costs, strategy, organizational capacity, or adaptation.
The configurations are not a hierarchy of institutional quality. They summarize heterogeneous patterns in the recorded award data. Their relationship with institutional strategy, student experience, mentoring, disciplinary size, or resource allocation cannot be determined without additional process and contextual evidence.
5.4. Robustness Checks
The reported checks supported the main descriptive conclusions within the available award-record data.
Table 8 summarizes the alternative specifications and their implications. Excluding 2020 changed the Gini coefficient from 0.6307 to 0.6301 and the HHI from 0.1760 to 0.1720. Removing the three largest parent competition categories reduced the HHI to 0.0966, while the Gini coefficient remained high at 0.6659. For clustering,
k = 4 had a silhouette value of 0.295. Random-seed stability was high, with a minimum adjusted Rand index of 0.892 and a mean of 0.995. Removing cumulative scale produced an adjusted Rand index of 0.666 relative to the main solution. These checks do not substitute for normalization by eligible institutions, participants, enrolment, or event-level award quotas.
Table 9 summarizes the empirical answers to the three research questions, together with their systems-thinking interpretations and evidence bases.
6. Discussion
6.1. Interpreting an Award-Visible University Competition System
Computer science competitions constitute a large and institutionally visible award system with potential co-curricular functions. The present evidence establishes the scale and distribution of recorded outcomes, not formal curricular integration, mentoring arrangements, assessment practices, student learning, or institutional use of award signals. Any educational interpretation is therefore conditional on evidence not available in the present dataset.
This distinction is relevant to systems-thinking research in higher education because multiple actors, institutional levels, feedback processes, and goals shape the organization of learning activities. The contribution of this study is to move the analysis of competition practices with potential co-curricular functions away from the linear question of whether they are effective and toward a systems question: which organizational conditions, feedback signals, and opportunity structures shape the learning environment.
Previous research on competition-based learning has mainly examined student motivation, engagement, problem solving, and the effects of competitive comparison [
7,
8,
9,
10]. The present study addresses a different analytical level. It does not evaluate student learning effects but examines how recorded competition awards are distributed across institutions, competition categories, and time. Its contribution is therefore organizational and distributional rather than an extension of student-level evidence on the educational effectiveness of competitions.
6.2. Expansion Does Not Automatically Produce Equality
The analysis shows that, although the competition system expanded rapidly, outcomes did not clearly become more equal. Inequality remained high over time, and the selected Theil decomposition showed that most measured inequality occurred among award-visible universities within provinces. Expanding system boundaries and increasing the number of tracks therefore did not necessarily produce more equal recorded outcomes. More precisely, the data support the claim that expansion did not automatically alleviate inequality; they do not, by themselves, show that expansion intensified inequality.
This study measures inter-university inequality in externalized competition performance, not inequality in individual students’ access to participation. Award records reveal organizational outcome structures, but they cannot directly capture each student’s opportunity, learning gain, or process experience.
The coexistence of recorded expansion and persistent inter-university inequality is broadly consistent with studies showing that the expansion and policy differentiation of Chinese higher education can coexist with institutionalized stratification and unequal production or access [
23,
24,
25]. The present results extend this comparison to the distribution of visible competition awards. However, award records do not measure the policy resources, enrolment structures, or institutional responses examined in those studies. The observed inequality and rank persistence are therefore compatible with several possible persistence mechanisms, but the present data do not distinguish among them.
6.3. Portfolio Heterogeneity
The four configurations show that award portfolios differ in recorded breadth, high-level-award share, largest-category dependence, growth, and scale. These differences are compatible with several explanations, including disciplinary size, event availability, selective reporting, persistent teams, resource constraints, or deliberate strategy. The present clustering cannot distinguish among these explanations and does not demonstrate organizational adaptation.
The configurations nevertheless identify empirical differences for further investigation by governance actors. Proposals concerning inclusive competition design, shared training, mentoring, or differentiated tracks remain normative possibilities. Their effects on learning or inequality require independent evaluation.
The observed portfolio configurations also resemble the broader institutional-differentiation literature, in which universities occupy heterogeneous organizational positions and may respond differently to external evaluation environments [
28,
29,
30]. The comparison is limited, however, because the present clusters are derived from cumulative award records rather than observed institutional decisions. They document differentiated award portfolios but do not establish strategic specialization, organizational capacity, or adaptation.
6.4. Contribution to Systems-Thinking Research in Higher Education
The study applies systems thinking to higher education within an explicit evidential boundary. The causal-loop diagram defines the system boundary and organizes propositions, while the empirical analysis remains limited to recorded expansion, category distribution, inequality, positional stability, and portfolio configuration. The transferable element proposed here is not the empirical cluster solution or the Chinese distributional pattern, but the analytical sequence of defining the system boundary, separating direct observations from derived indicators and untested mechanisms, and using longitudinal distributional measures to evaluate observable structural patterns. Whether this sequence is informative in another national, disciplinary, or competition context requires independent validation of data coverage, institutional meaning, and measurement validity.
Methodologically, the study connects systems representation and structural indicators with a cautious interpretation of governance; it does not attempt to establish a single linear causal chain. When researchers can observe only the externalized outcomes of a competition system with potential co-curricular functions, longitudinal structural indicators, recorded distribution measures, rank persistence, and portfolio configurations can still describe structural patterns relevant to feedback and stratification hypotheses. Without additional process data, however, they cannot verify the internal mechanisms of reputation use, resource reinvestment, mentoring development, or learning improvement.
6.5. Educational Interpretation: From Award Outcomes to Co-Curricular Learning Conditions
Because the empirical data consist of award records, the direct object of interpretation is the organizational structure of visible competition performance rather than individual student learning outcomes. Award data show which universities produced sustained visible outcomes in particular competition portfolios, but they do not show whether students developed deeper algorithmic understanding, engineering capability, teamwork, or interdisciplinary problem-solving ability.
Award counts alone do not establish the educational value of competitions as co-curricular activities. It depends on whether universities embed competitions within learning-supportive conditions. First, competition tasks should be connected to curricular objectives and disciplinary competencies so that students can transform classroom knowledge into problem modelling, solution design, iterative debugging, and public presentation. Second, faculty mentoring should not serve only pre-competition training and award targets; it should also provide process feedback, reflective assessment, and learning-pathway design. Third, teamwork should be organized as a learnable practice involving role allocation, code or artefact review, failure analysis, and cross-disciplinary communication. Fourth, competition outcomes should be connected to formative assessment so that award tiers are not simply equated with student ability or teaching quality.
These considerations define an agenda for research and governance; they are not effects demonstrated by the current data. Studies with participation, curriculum, mentoring, assessment, and learning-outcome evidence are needed before competitions can be evaluated as co-curricular learning environments or before specific interventions can be recommended as effective.
6.6. Governance Implications
Competition governance could examine distribution and access alongside recorded scale. This is a policy proposition, not an estimated intervention effect. The present findings justify monitoring category concentration and institutional inequality, but they do not show that particular track designs or entry arrangements will broaden access.
The aggregate Theil decomposition indicates that most measured inequality occurred within provinces under the selected award-visible denominator. This finding may motivate closer examination of within-province differences, but it does not identify their causes or demonstrate the effectiveness of faculty development, shared training platforms, or mentoring interventions.
Award-based evaluation may create governance risks when recorded outcomes are treated as equivalent to educational quality. The current analysis does not measure such evaluation practices. Participation quality, curricular embedding, formative assessment, and capability development should therefore be examined directly before related policy measures are evaluated.
7. Conclusions
Using national award records from Chinese university computer science competitions for 2012 to 2025, this study describes an award-visible system with potential co-curricular functions. The main analysis uses complete 2012–2024 data, while the 2025 records provide a provisional continuity check. Recorded awards and award-visible universities increased, and award records became less concentrated across competition categories. Inequality remained high within the award-visible sample. Under the selected provincial decomposition, 91.47% of measured inequality occurred within provinces. Adjacent-year correlations indicated positional stability among universities active in both years, and clustering identified four descriptive portfolio configurations.
The study combines systems representation with longitudinal descriptive analysis while maintaining an explicit evidential boundary. The causal-loop framework organizes propositions about feedback and governance, but the award data test only observable distributional patterns. The four portfolio configurations summarize recorded breadth, outcome composition, concentration, growth, and scale. They do not establish resource endowments, organizational strategy, or adaptation.
Several limitations affect the interpretation of these results. Source coverage and award-reporting practices may have changed over time, and the materials do not reconstruct every historical award-list page. Award counts may also reflect award inflation, variation in prize quotas, event design, category expansion, and reporting rules. The dataset excludes non-awarded participants, unsuccessful teams, eligible-institution denominators, institutional size, student enrolment, funding, disciplinary capacity, and internal institutional processes. Name harmonization may not capture every institutional merger, renaming, or multi-campus classification. Cumulative windows give longer exposure to early entrants, while adjacent-year correlations are subject to survivorship and composition bias because they exclude entrants and exits. Province-specific Theil values may be unstable for small groups, and K-means clusters are descriptive. The data cannot establish learning quality, access, mentoring, strategy, reputation, resource flows, or policy effects. Generalization beyond Chinese computer science competitions requires independent evidence.
Author Contributions
Conceptualization, H.H. and C.Z.; Methodology, H.H. and C.Z.; Software, H.H.; Validation, H.H.; Formal analysis, H.H.; Investigation, H.H.; Resources, C.Z.; Data curation, C.Z.; Writing—original draft, H.H.; Writing—review and editing, C.Z.; Visualization, C.Z.; Supervision, C.Z.; Project administration, C.Z.; Funding acquisition, C.Z. All authors have read and agreed to the published version of the manuscript.
Funding
This research was funded by Department of Education of Zhejiang Province (grant number: JGBA2024226) and 2024 Higher Education Scientific Research Planning Project of the China Association of Higher Education (grant number: 24GC0201).
Informed Consent Statement
Not applicable. This study uses university competition award records and aggregate structural indicators and does not involve interviews, experiments, or individual student tracking.
Data Availability Statement
The raw data analyzed in this study were provided by the competition organizer through the designated data platform under a data-use agreement. Owing to contractual restrictions, the raw data cannot be made publicly available. For research purposes, de-identified data may be obtained from the corresponding author upon reasonable request, subject to compliance with the original data-use agreement and, where required, approval from the data provider.
Acknowledgments
The authors would like to thank the editor and referees for their valuable comments and suggestions which helped us improve the results of this paper.
Conflicts of Interest
The authors declare no conflicts of interest.
References
- Abras, C.; Nailos, J.; Lauka, B.; Hoshaw, J.P.; Taylor, J.N. Defining co-curricular assessment and charting a path forward. Intersect. J. Intersect. Assess. Learn. 2022, 4, 1–12. [Google Scholar] [CrossRef] [Scilit]
- Bartkus, K.R.; Nemelka, B.; Nemelka, M.; Gardner, P. Clarifying the meaning of extracurricular activity: A literature review of definitions. Am. J. Bus. Educ. 2012, 5, 693–704. [Google Scholar] [CrossRef] [Scilit]
- Kahu, E.R.; Nelson, K. Student engagement in the educational interface: Understanding the mechanisms of student success. High. Educ. Res. Dev. 2018, 37, 58–71. [Google Scholar] [CrossRef] [Scilit]
- Trowler, V.; Allan, R.L.; Bryk, J.; Din, R.R. Pathways to student engagement: Beyond triggers and mechanisms at the engagement interface. High. Educ. 2022, 84, 761–777. [Google Scholar] [CrossRef] [Scilit]
- Tight, M. Student retention and engagement in higher education. J. Furth. High. Educ. 2020, 44, 689–704. [Google Scholar] [CrossRef] [Scilit]
- Oz, Y.; Boyaci, A. The role of student engagement in student outcomes in higher education: Implications from a developing country. Int. J. Educ. Res. 2021, 110, 101880. [Google Scholar] [CrossRef] [Scilit]
- Burguillo, J.C. Using game theory and competition-based learning to stimulate student motivation and performance. Comput. Educ. 2010, 55, 566–575. [Google Scholar] [CrossRef] [Scilit]
- Yuen, K.K.F.; Liu, D.Y.W.; Leong, H.V. Competitive programming in computational thinking and problem solving education. Comput. Appl. Eng. Educ. 2023, 31, 850–866. [Google Scholar] [CrossRef] [Scilit]
- Polito, G.; Temperini, M. A gamified web based system for computer programming learning. Comput. Educ. Artif. Intell. 2021, 2, 100029. [Google Scholar] [CrossRef] [Scilit]
- Garcia, S.M.; Tor, A.; Schiff, T.M. The psychology of competition: A social comparison perspective. Perspect. Psychol. Sci. 2013, 8, 634–650. [Google Scholar] [CrossRef] [Scilit] [PubMed]
- Arnold, R.D.; Wade, J.P. A definition of systems thinking: A systems approach. Procedia Comput. Sci. 2015, 44, 669–678. [Google Scholar] [CrossRef] [Scilit]
- Cabrera, D.; Colosi, L.; Lobdell, C. Systems thinking. Eval. Program Plan. 2008, 31, 299–310. [Google Scholar] [CrossRef] [Scilit] [PubMed]
- Jacobson, M.J.; Levin, J.A.; Kapur, M. Education as a complex system: Conceptual and methodological implications. Educ. Res. 2019, 48, 112–119. [Google Scholar] [CrossRef] [Scilit]
- Priyadarshini, P.; Abhilash, P.C. Rethinking of higher education institutions as complex adaptive systems for enabling sustainability governance. J. Clean. Prod. 2022, 359, 132083. [Google Scholar] [CrossRef] [Scilit]
- Coates, H.; Liu, L.; Shi, J. Evaluating complex higher education systems. Int. J. Chin. Educ. 2019, 8, 1–5. [Google Scholar] [CrossRef] [Scilit]
- Ueland, J.S.; Hinds, T.L.; Floyd, N.D. Equity at the edge of chaos: Applying complex adaptive systems theory to higher education. New Dir. Institutional Res. 2021, 2021, 121–138. [Google Scholar] [CrossRef] [Scilit]
- Sterman, J.D. All models are wrong: Reflections on becoming a systems scientist. Syst. Dyn. Rev. 2002, 18, 501–531. [Google Scholar] [CrossRef] [Scilit]
- Lane, D.C. The emergence and use of diagramming in system dynamics: A critical account. Syst. Res. Behav. Sci. 2008, 25, 3–23. [Google Scholar] [CrossRef] [Scilit]
- Rouwette, E.A.J.A.; Vennix, J.A.M.; van Mullekom, T. Group model building effectiveness: A review of assessment studies. Syst. Dyn. Rev. 2002, 18, 5–45. [Google Scholar] [CrossRef] [Scilit]
- Jackson, M.C. Critical Systems Thinking and the Management of Complexity; Wiley: Hoboken, NJ, USA, 2019. [Google Scholar]
- Lin, L.; Wang, S. China’s higher education policy change from 211 Project and 985 Project to the Double-first-class Plan: Applying Kingdon’s multiple streams framework. High. Educ. Policy 2022, 35, 808–832. [Google Scholar] [CrossRef] [Scilit]
- Jiang, L.; Zhang, Y.; Shen, Y. Governance reform of local university under the “Double World-Class” policy: Are there unintended but not unanticipated consequences? Asia Pac. Educ. Rev. 2024, 25, 1009–1020. [Google Scholar] [CrossRef] [Scilit]
- Shu, F.; Sugimoto, C.R.; Lariviere, V. The institutionalized stratification of the Chinese higher education system. Quant. Sci. Stud. 2021, 2, 327–334. [Google Scholar] [CrossRef] [Scilit]
- Ding, Y.; Wu, Y.; Yang, J.; Ye, X. The elite exclusion: Stratified access and production during the Chinese higher education expansion. High. Educ. 2021, 82, 323–347. [Google Scholar] [CrossRef] [Scilit] [PubMed]
- Song, J.; Chu, Z.; Xu, Y. Policy decoupling in strategic response to the Double World-Class Project: Evidence from elite universities in China. High. Educ. 2021, 82, 255–272. [Google Scholar] [CrossRef] [Scilit]
- Chinese Association of Higher Education Expert Working Group on University Competition Evaluation and Management System. 2023 National College Student Competition Analysis Report. Chinese Association of Higher Education, 2024. Available online: https://rank.moocollege.com (accessed on 15 July 2026).
- Tamtik, M.; Colorado, C. Multi-level governance framework and its applicability to education policy research: The Canadian perspective. Res. Educ. 2022, 114, 20–44. [Google Scholar] [CrossRef] [Scilit]
- Fumasoli, T.; Hladchenko, M. Strategic management in higher education: Conceptual insights, lessons learned, emerging challenges. Tert. Educ. Manag. 2023, 29, 331–339. [Google Scholar] [CrossRef] [Scilit]
- Stenvall-Virtanen, S. A dialectical perspective on an institutional change process in higher education. High. Educ. Policy 2024, 37, 800–829. [Google Scholar] [CrossRef] [Scilit]
- Geschwind, L.; Brostrom, A. To be or not to be a technical university: Organisational categories as reference points in higher education. High. Educ. 2022, 84, 121–139. [Google Scholar] [CrossRef] [Scilit]
- Elsawah, S.; Ho, A.T.L.; Ryan, M.J. Teaching systems thinking in higher education. INFORMS Trans. Educ. 2022, 22, 66–102. [Google Scholar] [CrossRef] [Scilit]
- Stefaniak, J.E.; Giacumo, L.A.; Mao, J.J.; Asino, T.I. A systems thinking perspective on learning design in higher education. J. Comput. High. Educ. 2025, 37, 657–678. [Google Scholar] [CrossRef] [Scilit]
- Sabel, J.L.; Zangori, L.; Parsley, K.M.; Sous, S.; Koontz, J. Investigating undergraduate students’ engagement in systems thinking and modeling using causal maps. Front. Educ. 2023, 8, 1159486. [Google Scholar] [CrossRef] [Scilit]
- Rubin, D.M.; Achari, S.; Richards, X.L.; Pantanowitz, A.; George, A. Systems thinking with causal loop diagrams in medical education: An exploratory study. Systems 2026, 14, 378. [Google Scholar] [CrossRef] [Scilit]
- Dunnion, J.; O’Donovan, B. Systems thinking and higher education: The Vanguard Method. Syst. Pract. Action Res. 2014, 27, 23–37. [Google Scholar] [CrossRef] [Scilit]
- Grohs, J.R.; Kirk, G.R.; Soledad, M.M.; Knight, D.B. Assessing systems thinking: A tool to measure complex reasoning through ill-structured problems. Think. Ski. Creat. 2018, 28, 110–130. [Google Scholar] [CrossRef] [Scilit]
- Blum, J.J. Competitive programming participation rates: An examination of trends in U.S. ICPC regional contests. Discov. Educ. 2023, 2, 11. [Google Scholar] [CrossRef] [Scilit] [PubMed]
- de Boer, R.H.; de Campos, C.P. A retrospective overview of International Collegiate Programming Contest data. Data Brief 2019, 25, 104382. [Google Scholar] [CrossRef] [Scilit] [PubMed]
Figure 1.
Proposition-generating causal-loop representation of the university competition system. Arrows and polarities denote hypothesized relations, not causal effects established by the award data. R1 is a cumulative-advantage proposition and B1 a governance proposition. The empirical analysis addresses only the observable distributional indicators identified in the figure.
Figure 1.
Proposition-generating causal-loop representation of the university competition system. Arrows and polarities denote hypothesized relations, not causal effects established by the award data. R1 is a cumulative-advantage proposition and B1 a governance proposition. The empirical analysis addresses only the observable distributional indicators identified in the figure.
Figure 2.
Annual numbers of recorded awards and award-visible universities from 2012 to 2024, The black diamonds denote the provisional 2025 values, which are shown separately as a continuity check. The counts represent recorded award outcomes rather than all participants, unsuccessful teams, or eligible institutions.
Figure 2.
Annual numbers of recorded awards and award-visible universities from 2012 to 2024, The black diamonds denote the provisional 2025 values, which are shown separately as a continuity check. The counts represent recorded award outcomes rather than all participants, unsuccessful teams, or eligible institutions.
Figure 3.
Annual HHI and effective number of categories calculated from the distribution of recorded awards across competition categories. A lower HHI and a higher effective number indicate greater diversification of recorded awards. The black diamonds denote the provisional 2025 values.
Figure 3.
Annual HHI and effective number of categories calculated from the distribution of recorded awards across competition categories. A lower HHI and a higher effective number indicate greater diversification of recorded awards. The black diamonds denote the provisional 2025 values.
Figure 4.
Theil decomposition of cumulative 2012–2024 award counts among 1176 award-visible universities. The total Theil index is 0.7217, comprising a between-province component of 0.0616 (8.53%) and a within-province component of 0.6601 (91.47%). Universities with zero recorded awards are outside the denominator.
Figure 4.
Theil decomposition of cumulative 2012–2024 award counts among 1176 award-visible universities. The total Theil index is 0.7217, comprising a between-province component of 0.0616 (8.53%) and a within-province component of 0.6601 (91.47%). Universities with zero recorded awards are outside the denominator.
Figure 5.
Standardized mean profiles of the five measured portfolio variables for the four descriptive configurations. Values are z scores, with positive and negative values indicating positions above and below the sample mean, respectively. The configurations describe recorded portfolios and do not imply institutional strategy or adaptation.
Figure 5.
Standardized mean profiles of the five measured portfolio variables for the four descriptive configurations. Values are z scores, with positive and negative values indicating positions above and below the sample mean, respectively. The configurations describe recorded portfolios and do not imply institutional strategy or adaptation.
Table 1.
Interpretation of the main causal edges in the causal-loop representation.
Table 1.
Interpretation of the main causal edges in the causal-loop representation.
| Causal Link | Polarity | Rationale | Empirical Proxy | Evidential Status/Boundary |
|---|
| External policy and competition provision -> recorded category distribution | + | Policy and organizers reshape available tracks. | Event-year award-record shares, HHI, and effective number of categories. | Descriptive proxy; access and pedagogical quality are not measured. |
| Competition provision -> awarded participation | + | Additional categories may create award-bearing routes. | Award-visible universities and award-record volumes. | Indirect proxy; non-awarded participation is unobserved. |
| Participation and teamwork -> award performance | + | Participation and preparation are necessary for visible outcomes. | University-competition-year-award-tier records. | Captures awarded teams only. |
| Award performance -> reputation signals and comparison pressure | + | Awards can become institutional signals. | Counts, high-level share, rank persistence. | Theoretically supported; reputation use is not directly observed. |
| Reputation signals -> university resource allocation | + | Visible performance may justify resources and attention. | Persistence and accumulation as indirect indicators. | Mechanism hypothesis requiring internal budget/personnel data. |
| Resource allocation -> training capacity and mentoring teams | + | Resources can strengthen training routines. | Cumulative scale and breadth as indirect indicators. | Internal capacity-building is not directly identified. |
| Training capacity -> subsequent award performance | + | Organized preparation is expected to improve performance. | Adjacent-year Spearman correlations. | Consistent with path dependence, not causal proof. |
| Award performance -> award-centrism | + | Awards may become over-emphasized as evaluation signals. | Concentration, persistence, governance interpretation. | Interpretive systems claim, not attitude measurement. |
| Award-centrism -> inclusive pathways | − | Excessive award focus may crowd out learning processes. | No direct proxy. | Governance risk requiring student/programme-level data. |
| Diversification of recorded categories -> award-centrism | − | Differentiated tracks may reduce dependence on narrow awards. | Declining HHI and rising effective number of recorded categories. | Conceptual relation; no institutional evaluation practices are observed. |
| Diversification of recorded categories -> inclusive pathways | + | Broader tracks support multiple missions and goals. | No direct proxy for inclusion; portfolio configurations describe recorded outcomes only. | Untested governance proposition requiring participant-level evidence. |
Table 2.
Mapping conceptual dimensions to descriptive indicators and evidential boundaries.
Table 2.
Mapping conceptual dimensions to descriptive indicators and evidential boundaries.
| Construct | Meaning | Indicators | Method | Boundary |
|---|
| Recorded expansion | Growth in recorded actors and outputs | Annual award records; award-visible universities | Trend analysis | Scale of recorded outcomes, not access or learning |
| Recorded category distribution | Concentration or diversification of award records | HHI; effective number of categories | Concentration and diversity analysis | Not participation opportunity or access |
| Inter-university inequality | Unequal recorded award outcomes | Gini; Theil; CR10 | Inequality measurement and decomposition | Award-visible universities only |
| Positional stability | Rank stability among continuing award-visible universities | Adjacent-year Spearman correlation | Rank-correlation analysis | Excludes entrants, exits, and intermittent participants |
| Portfolio configuration | Pattern of recorded outcomes across categories | Breadth, high-level share, largest-category dependence, growth, scale | K-means clustering | Descriptive; not intentional adaptation |
Table 3.
Variables used to identify competition-portfolio configurations.
Table 3.
Variables used to identify competition-portfolio configurations.
| Variable | Operational Definition | Theoretical Meaning | Interpretive Caution |
|---|
| Breadth | Number of categories with award records | Recorded category coverage | Affected by category availability and reporting |
| High-level-award share | High-level awards divided by the university’s recorded awards | Outcome composition | Not a direct measure of educational quality |
| Largest-category dependence | Share from the university’s largest recorded category | Portfolio concentration | Does not identify strategic choice |
| Active-year-standardized breadth | ln [1 + (number of recorded parent competition categories/number of active years)] | Recorded category breadth relative to active duration | Does not measure longitudinal growth and does not eliminate differences in entry timing or exposure |
| Cumulative scale | Total award records | Recorded output scale | Not capacity, investment, or learning quality |
Table 4.
Inter-university performance inequality across time windows. Inequality is calculated among award-visible universities; universities with zero recorded awards are outside the denominator.
Table 4.
Inter-university performance inequality across time windows. Inequality is calculated among award-visible universities; universities with zero recorded awards are outside the denominator.
| Time Window | Universities | Gini | CR10 |
|---|
| Main analysis, 2012–2024 | 1176 | 0.631 | 7.8% |
| Last five complete years, 2020–2024 | 1166 | 0.632 | 8.0% |
| 2024 only, complete-year endpoint | 1110 | 0.624 | 8.2% |
Table 5.
Selected within-province Theil values.
Table 5.
Selected within-province Theil values.
| Province | Within-Province Theil | Province | Within-Province Theil |
|---|
| Jiangsu | 0.571 | Jiangxi | 0.735 |
| Hubei | 0.620 | Anhui | 0.740 |
| Guangdong | 0.526 | Shanghai | 0.667 |
| Shandong | 0.694 | Heilongjiang | 0.891 |
| Sichuan | 0.713 | Chongqing | 0.809 |
| Beijing | 0.743 | Guangxi | 0.895 |
| Henan | 0.592 | Shanxi | 1.029 |
| Liaoning | 0.739 | Guizhou | 0.966 |
| Zhejiang | 0.590 | Ningxia | 0.132 |
| Shaanxi | 0.633 | Qinghai | 0.194 |
Table 6.
Adjacent-year rank persistence.
Table 6.
Adjacent-year rank persistence.
| Adjacent Years | Common Active Universities | Spearman |
|---|
| 2012–2013 | 195 | 0.699 |
| 2013–2014 | 292 | 0.677 |
| 2014–2015 | 539 | 0.761 |
| 2015–2016 | 577 | 0.785 |
| 2016–2017 | 623 | 0.808 |
| 2017–2018 | 676 | 0.812 |
| 2018–2019 | 766 | 0.846 |
| 2019–2020 | 860 | 0.865 |
| 2020–2021 | 921 | 0.850 |
| 2021–2022 | 948 | 0.865 |
| 2022–2023 | 968 | 0.835 |
| 2023–2024 | 1020 | 0.890 |
Table 7.
Descriptive competition-portfolio configurations.
Table 7.
Descriptive competition-portfolio configurations.
| Configuration | Sample Size | Avg. Events | High-Level Share | Top-1 Dependence | Records |
|---|
| Broad high-output | 282 (24.0%) | 16.3 | 9.9% | 0.42 | 499 |
| Narrow high-level-share | 77 (6.5%) | 3.4 | 26.2% | 0.72 | 48 |
| Moderate-breadth | 529 (45.0%) | 7.0 | 5.8% | 0.50 | 105 |
| Narrow low-output/high-dependence | 288 (24.5%) | 2.6 | 2.0% | 0.83 | 31 |
Table 8.
Summary of robustness and sensitivity checks for inequality, concentration, and clustering analyses.
Table 8.
Summary of robustness and sensitivity checks for inequality, concentration, and clustering analyses.
| Check | Alternative Specification | Implication |
|---|
| Temporal sensitivity | Exclude 2020 | Gini 0.6307 to 0.6301; HHI 0.1760 to 0.1720; no material change |
| Category-composition sensitivity | Remove the three largest parent competition categories | HHI fell to 0.0966; Gini remained high at 0.6659 |
| Clustering sensitivity | k = 2–8, random seeds, and removal of cumulative scale | k = 4 silhouette 0.295; seed ARI min 0.892 and mean 0.995; ARI without scale 0.666 |
Table 9.
Summary of research-question responses.
Table 9.
Summary of research-question responses.
| Research Question | Empirical Answer | Systems-Thinking Interpretation | Evidence Base |
|---|
| RQ1: Recorded expansion and category distribution | Award-visible universities increased from 226 in 2012 to 1110 in 2024, annual award records rose from fewer than 2000 to more than 40,000, and recorded category concentration declined. | The recorded award system expanded and diversified, but the data do not establish broader access or deeper participation. | Annual award records; award-visible universities; HHI; effective number of recorded categories. |
| RQ2: Organizational stratification and persistence | Inter-university inequality remained high, with Gini above 0.62. Theil decomposition shows that 91.47% of inequality came from within-province stratification, and adjacent-year Spearman correlations averaged about 0.808. | Recorded expansion coexisted with persistent inequality and rank stability among continuing award-visible universities, but the data do not identify the mechanisms responsible for these patterns. | Gini; CR10; Theil decomposition; adjacent-year Spearman rank persistence. |
| RQ3: Portfolio configurations | Four descriptive configurations were identified from recorded breadth, high-level-award share, largest-category dependence, active-year-standardized breadth, and cumulative scale. | The configurations summarize portfolio heterogeneity; they do not establish strategy, resources, or organizational adaptation. | K-means clustering of five recorded portfolio indicators. |
| Disclaimer/Publisher’s Note: The statements, opinions and data contained in all publications are solely those of the individual author(s) and contributor(s) and not of MDPI and/or the editor(s). MDPI and/or the editor(s) disclaim responsibility for any injury to people or property resulting from any ideas, methods, instructions or products referred to in the content. |