Article

The Innovation Spillover Effects of Forward-Looking Information Disclosure by Supply Chain Hub Firms: Based on the Moderating Role of Node Firms’ Information Absorptive Capacity

School of Economics and Management, Northeast Forestry University, Harbin 150040, China
*
Author to whom correspondence should be addressed.
Systems 2026, 14(7), 860; https://doi.org/10.3390/systems14070860
Submission received: 1 June 2026 / Revised: 13 July 2026 / Accepted: 16 July 2026 / Published: 19 July 2026
(This article belongs to the Section Supply Chain Management)

Abstract

The impact of chain-leading (hub) firms’ forward-looking information disclosure on supply chain collaborative innovation remains underexplored. Based on panel data of Chinese A-share manufacturing listed firms from 2014 to 2024, this study adopts large-scale textual analysis to construct a time-varying indicator measuring hub firms’ forward-looking disclosure, and systematically examines its innovation spillover effects and internal mechanisms. The results show that hub firms’ forward-looking disclosure is positively associated with a significant increase in the R&D investment intensity of supply-chain node firms. This spillover effect is negatively moderated by node firms’ information absorptive capacity, reflecting a typical information substitution effect. Heterogeneity tests further reveal that the spillover effect is more pronounced among node firms with larger scale, higher supply-chain network centrality, and stronger supply-chain relationship specificity (proxied by higher customer concentration). In addition, such innovation spillovers are positively associated with improved corporate financial performance, and this profit-conversion effect is more pronounced among high-leverage firms, which is consistent with an implicit endorsement mechanism that helps alleviate financing constraints. Combining empirical evidence with industrial governance practice, this paper expands the theoretical boundary of supply chain collaborative innovation and provides actionable recommendations for optimizing information disclosure rules and formulating differentiated industrial innovation policies.

1. Introduction

Enhancing the autonomy, controllability, and collaborative innovation capacity of supply chain systems has emerged as a central strategic priority in the restructuring of global value chains [1,2]. In recent years, the compounding effects of geopolitical tensions and technological decoupling have triggered recurrent disruptions—such as structural bottlenecks and functional frictions—across industrial networks, markedly escalating systemic risk exposure [3,4,5,6]. Against this backdrop, fostering inter-firm collaboration to elevate the supply chain’s holistic capacity for innovation has become a critical research frontier at the intersection of innovation economics, supply chain governance, and strategic management.
The extant literature confirms that supply chain hub firms leverage their technological, market, and resource advantages to generate significant knowledge spillovers through their innovative activities, thereby catalyzing collaborative innovation among upstream and downstream node firms [7,8,9]. However, the realization of such spillovers hinges critically on timely and high-fidelity information exchange among network participants [8].
In practice, information asymmetry across supply chains is both pervasive and structurally entrenched [10]. Vulnerable node firms, particularly small and medium-sized enterprises (SMEs), often lack reliable access to hub firms’ technological roadmaps and strategic priorities. Consequently, their R&D decision-making is plagued by heightened uncertainty, elevated trial-and-error costs, and persistent resource misallocation [11,12,13]. Prior evidence confirms that this asymmetry significantly constrains SMEs’ innovation inputs and exacerbates structural imbalances in resource allocation [12,14].
These practical challenges give rise to three interrelated theoretical questions: (1) Can the informational advantage of hub firms be institutionally leveraged through transparent, forward-looking disclosures to energize system-wide innovation? (2) How do such proactive disclosures enable boundary-spanning innovation spillovers? (3) What are the operational boundaries and associated economic consequences of these disclosure-driven spillovers?
To address these questions, this study contextualizes its empirical analysis within China, an emerging economy that provides an ideal setting. Recently, the Chinese government has implemented proactive industrial policies, such as the “Chain Leader System” (Lian-zhang Zhi), cultivating hub firms endowed with ecosystem-level leadership to facilitate collaborative breakthroughs across the supply chain. Driven by top-down directives to enhance supply chain resilience and the efficacy of national innovation systems, assessing whether hub firms can mitigate intra-chain information asymmetry through proactive, forward-looking disclosures has become pivotal [9,15].
Grounded in this empirical context, this study identifies three gaps in the existing literature. First, prior research has mainly examined how disclosure affects the disclosing firm itself or capital-market participants, while paying less attention to cross-organizational innovation externalities within supply chain networks. Second, supply chain innovation studies have emphasized transactional and technical information, but have rarely examined forward-looking “soft information” that conveys strategic intent and technology roadmaps. Third, existing studies have not fully integrated signaling theory and absorptive capacity theory to explain why such disclosures generate heterogeneous spillover effects among node firms.
To address these gaps, the central contribution of this study is to conceptualize hub firms’ forward-looking disclosure as a cross-organizational strategic signal that shapes node firms’ innovation investment. The other theoretical elements are positioned as supporting mechanisms and boundary conditions: signaling theory explains the transmission process, absorptive capacity explains heterogeneous signal responses, and network topology identifies the hub–node structure through which the spillover operates. Compared with the extant literature, this study offers four main contributions:
First, this study develops a cross-organizational strategic signal-transmission framework for supply chain networks. It clarifies the mechanism through which hub firms’ forward-looking disclosures operate as strategic signals that are scanned, decoded, and converted into innovation responses by supply-chain node firms. By integrating signaling theory with absorptive capacity theory, this study further identifies absorptive capacity as a boundary condition characterized by an information-substitution mechanism: node firms with weaker internal knowledge stocks rely more heavily on hub firms’ public strategic signals, whereas firms with richer private knowledge channels exhibit weaker marginal responses.
Second, this study advances the empirical measurement strategy used in supply chain research. It applies the PageRank algorithm to identify hub firms from the global transaction network, moving beyond identification based solely on firm size or direct trading links. It also constructs a text-based measure of hub firms’ forward-looking disclosure from MD&A sections, enabling a joint examination of network topology and strategic disclosure.
Third, this study reveals the multidimensional boundary conditions of the innovation spillover effect. Specifically, it shows that the effect is more pronounced among node firms with larger scale, higher relative network position, and stronger supply chain relationship specificity. These findings clarify the contextual dependence of hub firms’ forward-looking disclosure and provide a theoretical basis for differentiated supply chain innovation policies.
Finally, our analysis of economic consequences reveals that among node firms with high financial leverage—typically those facing severe financing constraints—the efficiency of translating innovation spillovers into financial performance is significantly higher. This finding is consistent with an “implicit endorsement” mechanism. Under this mechanism, credible forward-looking disclosures by hub firms mitigate lenders’ information asymmetry, ease credit rationing for financially constrained node firms, and accelerate the transformation of innovation into profitability.
Collectively, these insights provide practical guidance for designing inclusive collaborative innovation ecosystems and tailoring industrial policy interventions to firm-level heterogeneity. The remainder of this paper is structured as follows. Section 2 develops the theoretical hypotheses. Section 3 outlines the research design. Section 4 presents the empirical results. Section 5 reports heterogeneity and economic-consequence analyses. Section 6 discusses the findings and concludes with policy implications.

2. Theoretical Analysis and Research Hypotheses

2.1. Literature Review

2.1.1. Innovation Spillover Effects of Supply Chain Hub Firms

Regarding the innovation spillover effects of supply chain hub firms (commonly referred to as “chain leaders”), the extant literature widely acknowledges that their technological breakthroughs generate substantial positive externalities. At the macro level, these innovations reinforce the resilience and security of industrial and supply chains via value-coordinating networks [9,15]. At the micro level, innovation spillovers transmitted through supply chain networks—particularly via the sharing of structured “hard information” (e.g., technical specifications, quality standards, and delivery schedules)—reduce operational uncertainty and enhance responsiveness among node firms [10,16]. Historically, early studies in this domain predominantly focused on the transmission pathways of tangible resources or transactional order information. In recent years, however, scholarly attention has increasingly shifted toward “information and cognitive coordination” among supply chain node firms [17,18]. For instance, Liu [17] and Cen et al. [18] investigate how the transparency and reliability of hub firms’ information shape the innovation decisions and financing conditions of node firms. This conceptual pivot signals a broader recognition: mitigating cognitive biases and decision-making risks stemming from structurally embedded information asymmetry has become a central theoretical logic that underpins collaborative innovation in supply chains.
Nevertheless, extant research grounded in the “information and cognitive coordination” perspective remains largely confined to verifiable, retrospective “hard information”—such as audited financial statements and contractual transaction records—and typically adopts a bilateral supply-demand framework. It seldom engages with forward-looking information disclosure, which conveys strategic intent, technological roadmaps, and market outlooks as unstructured “soft information.” Crucially, unlike backward-looking financial data, forward-looking disclosures carry stronger anticipatory signaling value and prescriptive guidance functions for the strategic planning of node firms. Consequently, examining their innovation spillover effects—alongside the underlying mechanisms operating within complex, multi-tiered supply chain networks—represents a timely and theoretically consequential frontier in innovation and supply chain scholarship.

2.1.2. The Economic Impact of Enterprise Forward-Looking Information Disclosure

The classical voluntary disclosure theory posits that high-quality disclosure serves as a fundamental contractual mechanism to alleviate information asymmetry and reduce agency costs [19]. As a crucial channel for revealing management’s strategic intentions [20,21], forward-looking information disclosure has been empirically demonstrated to lower enterprises’ cost of equity capital and enhance the precision of earnings forecasts—a finding robustly supported across multiple studies [22,23,24]. Recent evidence also links voluntary disclosure to corporate innovation outcomes [25].
Within the Chinese institutional context, where corporate governance arrangements and disclosure practices have distinctive institutional features [26], the forward-looking content embedded in the Management’s Discussion and Analysis (MD&A) section of annual reports exhibits pronounced information governance efficacy. Specifically, it improves pricing efficiency and investment allocation by shaping market participants’ interpretation and forecasting behavior [27,28]. Recent frontier research further establishes that forward-looking MD&A disclosures improve the information environment by reducing market-level information frictions [29].

2.2. Theoretical Derivation and Hypothetical Construction

2.2.1. Forward-Looking Information Disclosure by Supply Chain Hub Firms and Innovation Spillover Effects

Signaling theory posits that mitigating information asymmetry is a foundational mechanism for enhancing coordination efficiency across supply chain systems [30,31,32,33]. Within complex, multi-tiered supply chains, protracted innovation cycles and deep uncertainty regarding technological trajectories and market evolution constrain node firms not only through internal resource limitations but also via acute external informational deficits. This structural information disadvantage—rooted in non-central or peripheral network positions—elevates the risk of strategic decision-making, thereby discouraging R&D investment or inducing path-dependent “follower” behavior among node firms.
The Management’s Discussion and Analysis (MD&A) section is a key channel through which listed firms communicate strategic intent. Classical signaling theory focuses on the sender’s motivation and incentive compatibility [30,31]. More recent work emphasizes the receiver’s environmental scanning, cognitive interpretation, and adaptive response [33,34,35]. In this study, hub firms’ forward-looking MD&A disclosures are treated as system-level strategic signals. They trigger a reception process among node firms: “signal scanning → cognitive decoding → strategic innovation response” [34].
Node firms do not passively absorb hub-firm disclosures. Instead, they conduct purposeful environmental scanning and assess each signal’s credibility and strategic fit [33,35,36]. Once decoded, high-quality signals promote innovation investment through three pathways:
(i)
Clarifying technological trajectories: By articulating explicit technology roadmaps and R&D priorities, hub firms reduce ambiguity regarding future technical directions. Node firms leverage these signals to calibrate their R&D portfolios—thereby minimizing the risk of misallocation due to erroneous technology-pathway selection.
(ii)
Reducing information acquisition costs: High-fidelity, publicly disclosed strategic intelligence substitutes for costly and fragmented market intelligence gathering across complex networks. This enables node firms to achieve efficient “signal scanning” at a low opportunity cost—directly lowering both information search expenditures and innovation trial-and-error expenses [10,16].
(iii)
Enabling relationship-specific asset investment: When forward-looking strategic plans demonstrate strong credibility and long-term commitment, they serve as implicit relational contracts—signaling reputational assurance and continuity of cooperation. Such signals mitigate the “hold-up” risk inherent in relationship-specific investments (e.g., co-developed tooling, customized production lines, or joint IP development), thereby encouraging node firms to commit dedicated resources toward collaborative innovation.
Furthermore, forward-looking disclosure operates through a financing constraint alleviation mechanism. The efficiency with which strategic signals translate into tangible innovation outputs critically depends on node firms’ access to external capital. Given the well-documented inhibitory effect of financing constraints on corporate R&D investment [14,37,38], high-quality forward-looking disclosure by hub firms enhances the financial capacity of node firms via two complementary pathways:
(i)
Mitigating information asymmetry and strengthening cross-organizational trust: Grounded in signaling theory, credible narrative and forward-looking disclosures serve as verifiable strategic signals that lower capital market participants’ risk perceptions—thereby significantly reducing firms’ debt financing costs [39]. Within supply chain networks, the hub firm’s forward-looking strategic roadmap not only signals its own operational stability but—through stakeholders’ “signal attribution” process—also functions as an implicit endorsement mechanism for its node firms’ future order visibility and revenue sustainability [39,40,41]. This cross-organizational credit spillover bridges the informational gap between financial institutions and smaller node firms, substantially improving their external financing conditions.
(ii)
Enabling relational financing and credit extension: Confronted with chronic collateral shortages, many node firms rely heavily on relational financing anchored in the credibility of hub firms [40]. The forward-looking “soft information” disclosed by hub firms—such as technology roadmaps, capacity expansion plans, and long-term procurement commitments—provides objective, forward-looking anchors for financial institutions to assess the systemic continuity and coordinated growth potential of the entire supply chain. Consequently, external funders develop more favorable interpretations of network-wide developmental coherence, leading to an enhanced provision of relationship-based credit facilities for node firms [33,41].
Synthesizing these mechanisms, the innovation-spillover pathway triggered by hub firms’ forward-looking disclosure follows a coherent causal sequence: (1) node firms scan and decode strategic signals; (2) decoded signals provide information navigation that reduces decision-making uncertainty; (3) concurrently, the signals alleviate financing constraints and mobilize financial support; and (4) this dual cognitive–financial reinforcement collectively elevates R&D investment and innovation output. Building on this theoretical logic, we propose:
Hypothesis 1.
Forward-looking information disclosure by hub firms positively influences the innovation investment of node firms—indicating a robust innovation spillover effect.

2.2.2. Moderating Role of Node Firms’ Absorptive Capacity

The innovation spillover effect generated by hub firms’ forward-looking information disclosure is inherently heterogeneous—its magnitude and direction critically depend on the recipient firm’s internal knowledge base and absorptive capacity. Classical absorptive capacity theory posits that a firm’s ability to recognize, assimilate, and apply external knowledge is fundamentally contingent upon its stock of pre-existing, domain-specific knowledge (“a priori knowledge”) [42]. Within complex supply chain networks, the depth and relevance of a node firm’s internal a priori knowledge determine both its reliance on and responsiveness to external strategic signals. Following established empirical practice, this study operationalizes absorptive capacity as the ratio of intangible assets to total assets—a commonly used proxy for knowledge-intensive resource endowment [43].
Although prior innovation-strategy research has emphasized complementarity between internal R&D and external knowledge acquisition [44], integrating absorptive capacity theory with signaling theory leads us to propose that the relationship between node firms’ internal knowledge stock and externally disclosed strategic signals is not complementary but substitutive in this setting—exhibiting a robust “information substitution effect” [45]. As documented in open innovation and strategic management literature, when firms possess high internal knowledge capacity, the marginal value of acquiring additional knowledge from any single external source diminishes; internal and external knowledge sources thus function as strategic substitutes rather than complements [45,46].
Specifically:
(i)
For node firms with low intangible asset ratios—and consequently limited a priori knowledge—they face acute informational deficits and technological blind spots. Lacking the independent capability to assess macro-level technology trajectories or market evolution, such firms treat the high-quality, forward-looking strategic plans disclosed in hub firms’ annual reports as a “scarce strategic compass.” Their extreme scarcity of internal information assets renders them highly sensitive to and dependent on such public signals; consequently, the “information navigation” value of these disclosures is maximized, significantly amplifying their R&D investment response [12,47].
(ii)
Conversely, for node firms with high intangible asset ratios—and thus deep technical expertise, mature R&D pipelines, and sophisticated market intelligence systems—the strategic signals disclosed by hub firms serve less as directional guidance and more as a “validation seal” or reference point. Their rich internal a priori knowledge enables them to internally replicate or substitute for key functions of external public signals (e.g., demand forecasting, technology feasibility assessment). As a result, the marginal impact of hub firms’ forward-looking disclosures on their innovation decisions exhibits diminishing returns [45].
Based on this theoretical reasoning, we hypothesize:
Hypothesis 2.
Node firms’ absorptive capacity negatively moderates the innovation spillover effect of hub firms’ forward-looking information disclosure. Specifically, the richer a firm’s internal knowledge stock, the weaker the marginal effect of such disclosure on its innovation investment.

3. Research Design

3.1. Data Sources and Sample Construction

To empirically test the innovation spillover effect of forward-looking information disclosure by supply chain hub firms, this study utilizes a panel dataset of China’s A-share-listed manufacturing enterprises spanning from 2014 to 2024. Core data concerning corporate technological innovation, supply chain transaction relationships, and forward-looking textual disclosures are obtained from the China Stock Market & Accounting Research (CSMAR) database.
To construct a robust and reliable panel dataset, this study implements the following data-processing procedures: First, we exclude enterprises with abnormal financial status (e.g., ST and *ST categories). Second, we eliminate observations with missing core variables. Third, based on actual supply-and-demand transaction flows, we construct a directed complex network and apply the PageRank algorithm to quantify each node’s centrality, thereby precisely identifying “hub firms” within the supply chain system and matching them to their corresponding information disclosure indicators. Finally, we apply a 1% Winsorization to both the upper and lower tails of all continuous variables to mitigate the interference of extreme outliers. Following these steps, a final unbalanced panel dataset comprising 3093 firm-year observations is obtained.

3.2. Definition and Measurement of Variables

3.2.1. Dependent Variable: Innovation Investment of Node Firms

Unlike existing research that often relies on absolute R&D expenditure, this study adopts the ratio of R&D investment to total assets at the end of the period (R&D asset ratio) as the core indicator to measure the innovation investment of node firms. Within supply chain networks, large enterprises inherently possess both high absolute R&D expenditures and high network centrality [14,48]. Directly using absolute R&D indicators makes the analysis highly susceptible to spurious correlations driven by the “scale effect.” By standardizing by asset size, our approach effectively strips away the systematic interference caused by sheer corporate volume. Consequently, it objectively captures the intensity with which a node firm’s internal resource allocation tilts toward innovation activities immediately after it receives and deciphers strategic signals from hub firms.

3.2.2. Independent Variable: Forward-Looking Information Disclosure of Hub Firms

To scientifically operationalize this core variable, the measurement process is divided into two sequential steps: “hub node identification” and “information disclosure feature extraction.”
Step 1: Identification of “Hub” Nodes Based on Complex Network Topology.
In a supply chain network, an enterprise’s systemic importance is determined not only by the absolute number of its direct trading partners but also by the relative network centrality of those partners. Therefore, utilizing detailed supplier and customer transaction data from the CSMAR database, we construct a global, directed “customer–enterprise–supplier” transaction topology. Drawing upon recent frontier methodologies in supply chain network measurement (Gofman et al., 2020) [48], we introduce the classic PageRank algorithm from social network analysis to quantify the systemic centrality of each node. A higher PageRank score indicates a superior capacity for resource absorption and information radiation within the global network. This study defines enterprises ranking in the top 10% of annual PageRank scores as “hub firms.” Subsequently, for each micro-sample node firm, we map and match the transaction partners identified as “hub firms” among its top five customers and top five suppliers.
Through this rigorous structural identification strategy, we unambiguously differentiate the functional identities of “hub firms” and “node firms” at both the theoretical and operational levels: Hub firms, anchored by exceptionally high network centrality, constitute the core engine for resource allocation and information radiation; conversely, node firms—often situated in relatively peripheral topological positions and grappling with elevated information asymmetry—act primarily as the receivers of external strategic signals and the responsive executioners of collaborative innovation.
Step 2: Extraction of Forward-Looking Information Features and Variable Construction.
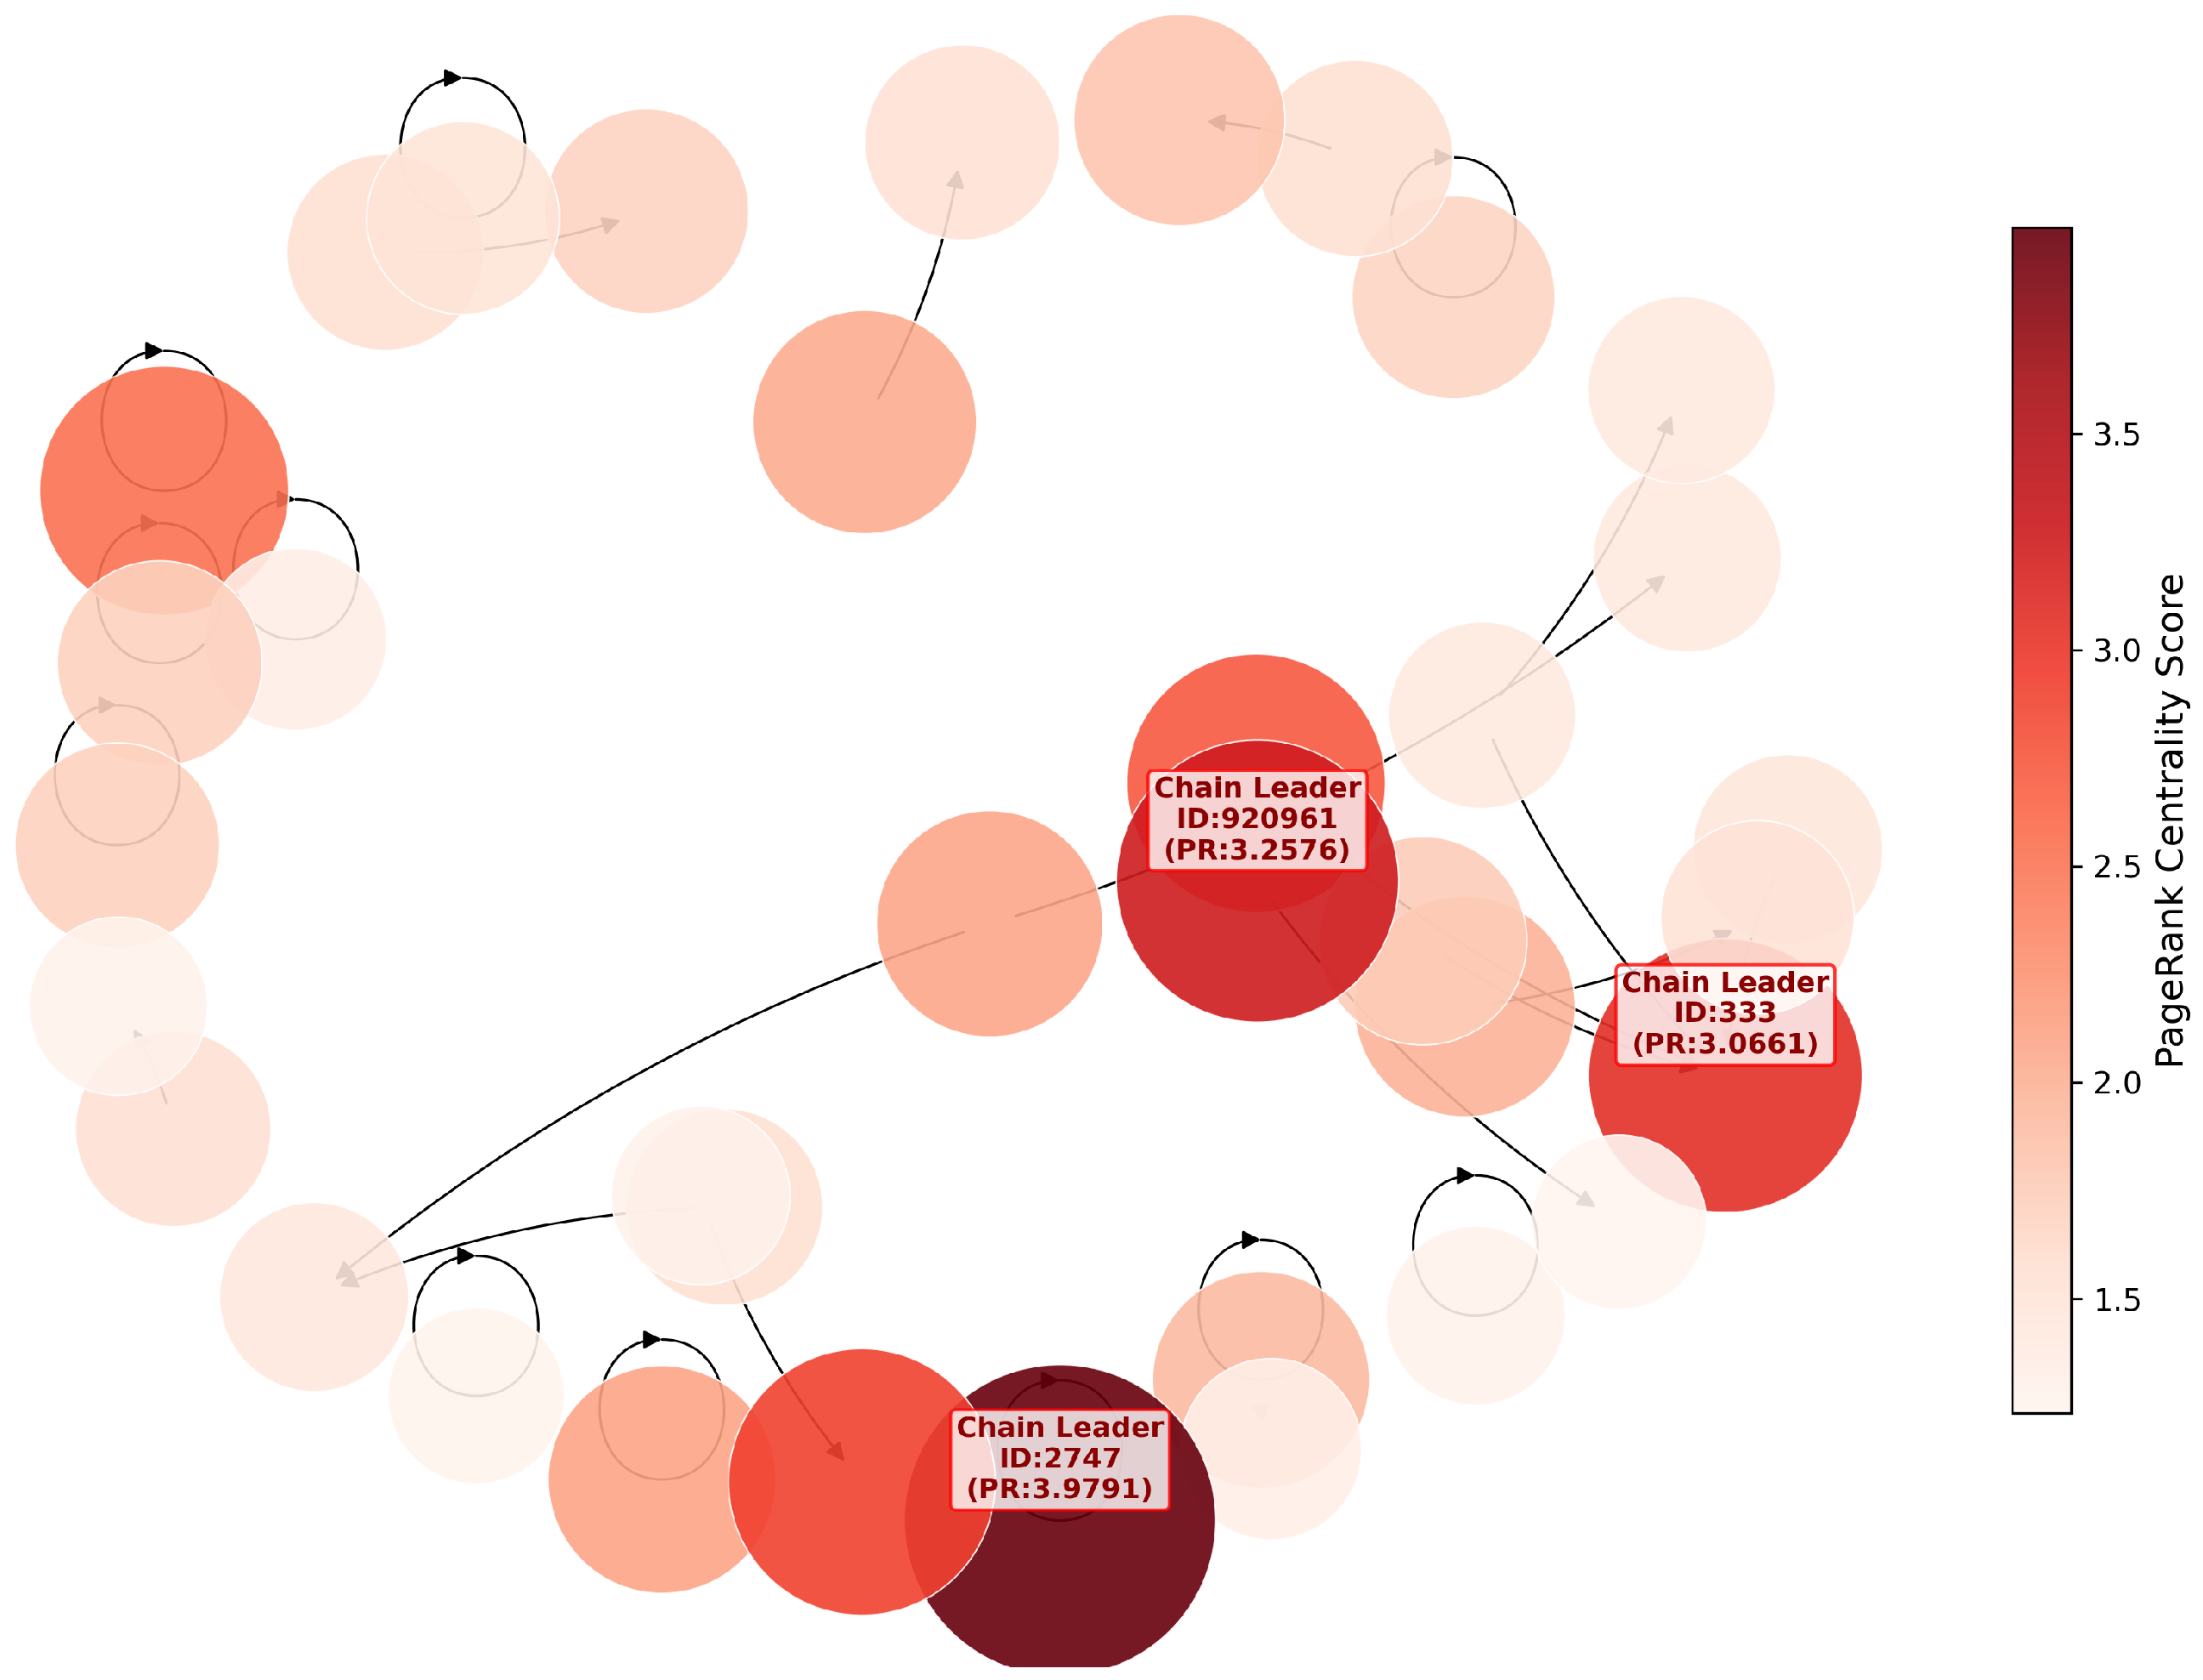
Using the CSMAR annual report text database, we conduct computational text analysis of the MD&A sections. We extract the frequency of explicit, time-oriented, forward-looking terminology—such as “will,” “expected,” “plan,” “anticipate,” and “outlook.” We then calculate the proportion of these terms relative to the total word count of the MD&A text and apply a full-sample Z-score standardization to eliminate dimensional variance. Building on the structural mapping from Step 1, we extract standardized forward-looking information scores for all “hub” transaction partners matched to a given focal node firm. Finally, we calculate the arithmetic mean of these scores to construct the core independent variable for this study, denoted as C L _ D i s c (Chain-Leader/Hub Disclosure). The PageRank-based network topology and hub-firm identification procedure are illustrated in Figure 1.

3.2.3. Moderating Variable: Information Absorptive Capacity of Node Firms

Classical absorptive capacity theory posits that a firm’s ability to decode and internalize external strategic signals is fundamentally contingent upon its accumulation of internal prior knowledge [42,49]. When confronted with highly specialized, inherently uncertain, forward-looking intelligence originating from hub firms, the efficacy of node firms’ strategic responses depends heavily on the depth of their pre-existing knowledge base.
In empirical research, intangible assets—encompassing patents, proprietary software, and non-patented technologies—serve as the premier objective proxy for a firm’s long-term knowledge stock [43,50]. The relative scale of intangible assets directly maps the complexity and information-processing efficacy of internal knowledge networks. Crucially, compared to traditional flow metrics—such as current R&D expenditure or the proportion of R&D personnel, which are highly susceptible to mechanical collinearity with the dependent variable (current innovation investment)—intangible assets function as a cumulative stock indicator. This approach not only provides a more objective reflection of the firm’s underlying cognitive decoding capabilities but also substantially mitigates endogeneity concerns.
Accordingly, this study adopts the ratio of intangible assets to total assets to operationalize the information absorptive capacity of node firms, where a higher ratio signifies a stronger baseline capacity to decode and transform strategic signals. Empirically, we partition the sample into high- and low-absorptive-capacity cohorts based on the annual median of this metric. This classification strategy helps reduce the noise generated by extreme values, allowing for an assessment of inter-group heterogeneous effects.

3.2.4. Control Variables

Drawing upon the established literature in information disclosure and innovation management, this study incorporates a comprehensive vector of firm-level characteristics that may systematically influence R&D decision-making as control variables. These include firm size ( S i z e ), profitability ( R O A ), adjusted leverage ratio ( L e v _ a d j ), firm age ( A g e ), Tobin’s Q ( T o b i n Q ), cash flow adequacy ( C F _ R a t e ), and operating revenue growth rate ( G r o w t h ).
Most notably, we explicitly introduce the node firm’s own network centrality (PageRank_std) as a crucial structural control variable. By holding the node firm’s structural position constant, we control for the potential confounding effect of its hierarchical status within the supply chain topology on its propensity to innovate. This allows the empirical model to more precisely capture the spillover effect derived from hub firms’ strategic disclosures, rather than the intrinsic resource advantages associated with the node firm’s own network position. Table 1 summarizes the definitions and measurements of the main variables.

3.3. Empirical Model

3.3.1. Benchmark Model

To empirically test the innovation spillover effect of hub firms’ forward-looking information disclosure on node firms’ R&D investment, we specify the following two-way fixed-effects panel regression model:
RD _ per _ TA i , t = β 0 + β 1 CL _ Disc i , t + k γ k Controls i , t + η j + δ t + ϵ i , t .
where subscript i denotes the focal node firm, t denotes the year, and j denotes the industry to which firm i belongs. The dependent variable, RD _ per _ TA i , t , captures the node firm’s innovation intensity, operationalized as the ratio of R&D expenditure to total assets at fiscal year-end. The core independent variable, CL _ Disc i , t , represents the standardized forward-looking information score aggregated from all hub-firm transaction partners topologically mapped to node firm i in year t. Controls i , t represents the comprehensive vector of firm-level control variables discussed above. η j and δ t denote industry and year fixed effects, respectively, and ϵ i , t is the idiosyncratic error term.
The coefficient β 1 is the parameter of primary theoretical interest. A statistically significant and positive estimate of β 1 would support Hypothesis 1, indicating that forward-looking strategic signals radiated by hub firms generate an innovation spillover effect on structurally linked node firms.
Furthermore, to address potential heteroskedasticity in micro-panel data and to ensure reliable statistical inference, we use heteroskedasticity-robust standard errors in all regression models, following recent best practices in applied micro-econometrics [51,52].

3.3.2. Moderating Effect Test Model

To test whether node firms’ information absorptive capacity moderates the innovation spillover effect, we extend regression model (1) by introducing a dummy interaction term. The interaction is constructed between the hub firm’s mean-centered forward-looking disclosure and the node firm’s high-absorptive-capacity indicator. The resulting specification is formulated as follows:
RD _ per _ TA i , t = β 0 + β 1   CL _ Disc _ c i , t + β 2   High _ Intang _ AC i , t + β 3 CL _ Disc _ c i , t × High _ Intang _ AC i , t + k γ k Controls i , t + η j + δ t + ϵ i , t .
In this model, High _ Intang _ AC i , t is a binary indicator equal to 1 if the node firm’s intangible asset ratio is above the annual median, and 0 otherwise. To reduce potential structural multicollinearity and improve the interpretability of the interaction term, the independent variable CL _ Disc i , t is mean-centered before constructing CL _ Disc _ c i , t . The interaction term is therefore specified as CL _ Disc _ c i , t × High _ Intang _ AC i , t .
The coefficient β 3 on the interaction term is the parameter of primary interest for testing Hypothesis 2. Consistent with the information-substitution hypothesis, we expect β 3 to be statistically significant and negative. A negative coefficient would indicate that node firms with higher absorptive capacity exhibit weaker marginal R&D responses to the strategic signals disclosed by hub firms.

4. Empirical Results and Analysis

4.1. Descriptive Statistics and Correlation Analysis

4.1.1. Descriptive Statistics

Table 2 presents the descriptive statistics for the final unbalanced panel of 3093 firm-year observations.
The dependent variable, node firm R&D intensity (RD_per_TA), exhibits a mean of 0.0337 and a standard deviation of 0.0271. These values indicate meaningful cross-sectional variation in innovation investment among Chinese manufacturing firms. The core explanatory variable, hub firm forward-looking disclosure (CL_Disc), is Z-score standardized before analysis; it has a mean of 0.1349 and a standard deviation of 0.9235. The moderating variable, information absorptive capacity (Intang_AC), operationalized as the intangible asset ratio, has a mean of 0.0404 and a standard deviation of 0.0278. This cross-enterprise heterogeneity in foundational knowledge endowments justifies the introduction of absorptive capacity as a boundary condition.

4.1.2. Correlation Analysis

Table 3 presents the Pearson correlation matrix for the principal variables employed in this study.
As indicated, the core explanatory variable (CL_Disc) and the dependent variable (RD_per_TA) exhibit a statistically significant positive correlation at the 1% level. This bivariate relationship provides preliminary descriptive support for Hypothesis 1, suggesting that forward-looking information disclosure by hub firms is positively associated with innovation investment by structurally embedded node firms.
Concurrently, CL_Disc and the moderating variable Intang_AC display a statistically significant negative correlation ( ρ = 0.062 , p < 0.01 ). This structural pattern is consistent with the theoretical premise of the “information substitution effect”—suggesting that node firms constrained by relatively scarce internal knowledge stocks are precisely those positioned in environments where external strategic signals are highly salient. From an econometric standpoint, this negative association also helps alleviate potential multicollinearity concerns when constructing the interaction term for the subsequent moderation analysis.
Furthermore, the correlation coefficients among all control variables remain relatively low (all | ρ | < 0.35 ). To assess potential multicollinearity, Variance Inflation Factor (VIF) diagnostics were conducted before regression. All VIF values range from 1.02 to 1.37, with a mean of 1.14, well below the conventional econometric threshold of 10. These diagnostics suggest that multicollinearity is unlikely to be a serious concern in the subsequent fixed-effects estimations.

4.2. Benchmark Regression Results

4.2.1. Main Effect Test

Table 4 reports the hierarchical regression results examining the main effect of hub firms’ forward-looking information disclosure (CL_Disc) on node firms’ R&D intensity (RD_per_TA).
To reduce omitted-variable bias, we adopt a stepwise inclusion strategy. Column (1) includes only CL_Disc, and Columns (2)–(4) sequentially add firm-level controls, year fixed effects, and industry fixed effects. The coefficient on CL_Disc remains positive and statistically significant across all specifications. In the fully specified model in Column (4), the coefficient is 0.0016 ( p < 0.01 ), supporting Hypothesis 1.
The effect is also economically meaningful. A one-standard-deviation increase in CL_Disc (0.9235) corresponds to an absolute increase of 0.00148 in RD_per_TA ( 0.0016 × 0.9235 ). Relative to the sample mean of 0.0337, this implies a 4.39% marginal increase in node-firm R&D intensity.

4.2.2. Moderating Effect Test

To test whether node firms’ information absorptive capacity—operationalized as the annual intangible asset ratio (Intang_AC)—moderates the innovation spillover effect, we use two approaches: subgroup analysis and full-sample dummy-interaction estimation.
First, we partition the dataset at the annual median of Intang_AC and estimate separate regressions for high- and low-Intang_AC subsamples. Second, we estimate a full-sample model with a dummy interaction term (CL_Disc_c × High_Intang_AC). High_Intang_AC equals 1 if the node firm’s intangible asset ratio exceeds the annual median and 0 otherwise. Table 5 reports the results.
Before estimation, the continuous explanatory variable used in the interaction term is mean-centered to reduce structural multicollinearity.
The results show meaningful heterogeneity across Intang_AC levels. The coefficient on CL_Disc_c is 0.0026 in the low-Intang_AC subgroup ( p < 0.01 ) and 0.0013 in the high-Intang_AC subgroup ( p < 0.1 ). The full-sample interaction term (CL_Disc_c × High_Intang_AC) is negative (−0.0019, p < 0.1 ), supporting Hypothesis 2.
This pattern is consistent with the information-substitution mechanism [45]. The marginal value of an external strategic signal depends on the receiver’s internal knowledge endowment [42,47,49].
Node firms with low Intang_AC—indicative of constrained internal R&D capabilities and limited access to private information—face heightened uncertainty in their innovation decisions. Consequently, public forward-looking disclosures by the hub firm serve as high-value navigational cues, eliciting stronger R&D responses [12,47].
By contrast, node firms with high Intang_AC possess more developed internal research infrastructure and proprietary information channels, which partially substitute for external signals—diluting the marginal impact of the hub firm’s forward-looking disclosure on their innovation investment [45].

4.3. Endogeneity and Robustness Tests

To address potential endogeneity concerns, we implement two complementary strategies. First, propensity score matching (PSM) mitigates sample-selection bias. After matching, the standardized mean differences for all covariates fall below 10%, and the core coefficient remains positive and significant at the 1% level (Column 1 of Table 6). Second, we estimate a lagged-variable specification to reduce reverse-causality concerns. The lagged coefficient is 0.0012 and significant at the 5% level (Column 2), indicating that hub-firm disclosure precedes subsequent node-firm innovation investment.
In addition, we conduct four robustness checks to assess the reliability of our baseline findings.
First, we apply winsorization at the 5% level—capping all continuous variables at their 5th and 95th percentiles—to mitigate the influence of extreme outliers (see Column 3); the core coefficient remains statistically significant at the 1% level.
Second, we exclude the 2020 observations to address potential confounding from the COVID-19 pandemic, which disrupted both macroeconomic conditions and supply-chain-level micro-decisions (see Column 4); the main result is preserved.
Third, to account for cross-provincial heterogeneity in institutional development and marketization depth, we augment the baseline two-way fixed-effects model with provincial fixed effects (see Column 5), thereby absorbing time-invariant regional institutional frictions; the core coefficient retains its 1% significance.
Fourth, we re-estimate the model using alternative centrality measures—degree and betweenness—in place of the personalized PageRank algorithm to identify the hub firm node. Across both specifications, the sign and statistical significance of the key coefficient remain unchanged.
All robustness models maintain an adjusted R 2 above 0.33, providing further support for the robustness of our benchmark estimates.

5. Further Analysis

5.1. Heterogeneity Analysis

The baseline analysis identifies the average spillover effect. We next examine whether this effect varies across theoretically relevant contexts. Guided by the signal-transmission mechanism, we analyze three dimensions: node-firm scale, relative network position, and supply chain relationship specificity. These tests are positioned as heterogeneity analyses that clarify the boundary conditions of the main spillover effect.

5.1.1. Node Firm Scale

Signal responsiveness depends not only on willingness to decode external information but also on material resources [12,53,54,55]. Medium- and large-sized firms usually have stronger financial buffers, R&D infrastructure, and strategic flexibility. These resources help them convert hub-firm signals into concrete R&D investment. Small firms, by contrast, often face tighter liquidity and lower tolerance for experimental failure.
We classify sample firms into small, medium, and large groups based on the tertiles of total assets (Table 7). The coefficient on CL_Disc_c is positive across all three groups, but it is stronger for medium- and large-sized firms. This result links firm size to the resource capacity required for signal transformation.

5.1.2. Relative Network Position of Supply-Chain Node Firms

To examine the role of core–edge positioning, we apply personalized PageRank (PPR). The matched hub firm is set as the restart node, so PPR captures a node firm’s proximity-weighted embeddedness with respect to that hub firm. This measure isolates dyadic relational embeddedness from broader network size or density effects.
We divide the sample into core-position and edge-position groups using the annual median of relative network centrality (Table 8). The coefficient on CL_Disc_c is 0.0023 and significant at the 1% level in the core-position group, but it is 0.0008 and insignificant in the edge-position group. Core-position firms therefore experience stronger innovation spillovers.
This asymmetry reflects relational binding and signal credibility. Core-position firms are more operationally interdependent with hub firms and have stronger incentives to monitor their strategic disclosures. Repeated cooperation also builds trust and tacit knowledge, making hub-firm signals more credible and easier to translate into R&D decisions.

5.1.3. Supply Chain Relationship Specificity

To examine how the depth of interfirm cooperation moderates the efficiency of strategic signal transmission, we investigate heterogeneity driven by the specificity of supply chain relationships. In network governance theory, sales concentration—measured as the share of operating income derived from the top five customers—is commonly used as a proxy for asset specificity and relational embeddedness [56]. We compute this ratio for each node firm and dichotomize the sample into “high-specificity” and “low-specificity” groups based on the annual median (see Table 9). To examine differential effects more formally, we further estimate a full-sample model that incorporates an interaction term between the core explanatory variable and a binary indicator of high specificity.
Table 9 shows a clear asymmetry. The coefficient on CL_Disc_c is 0.0041 and significant at the 1% level in the high-specificity group, but it is 0.0009 and insignificant in the low-specificity group. The full-sample interaction term is also positive and significant (0.0032, p < 0.01 ), indicating that relationship specificity strengthens the spillover effect.
This pattern reflects interest alignment and relational capital. Node firms with high customer concentration are more dependent on the hub firm and therefore have stronger incentives to respond to its strategic signals. Concentrated and repeated transactions also build trust, making forward-looking disclosures more credible and actionable. In contrast, firms with dispersed customer bases have weaker incentives to coordinate R&D around any single hub firm’s roadmap.

5.2. Economic Consequences: Innovation Spillovers, Profit Conversion, and the Moderating Role of Financial Leverage

Having established that hub firms’ forward-looking information disclosure is positively associated with node firms’ innovation investment, we now ask: Does this micro-level innovation input translate into tangible financial returns? To assess the economic consequences, we replace the baseline dependent variable with return on assets (ROA).
Column 1 of Table 10 shows that the coefficient on the core explanatory variable is 0.1810 and statistically significant at the 10% level, suggesting that hub firms’ forward-looking disclosure is positively associated with node firms’ financial performance.
We further examine whether capital structure moderates this conversion process. The sample is split at the annual median of the asset–liability ratio ( L e v ). Columns (2) and (3) show that the coefficient is 0.6007 ( p < 0.01 ) for high-leverage firms and −0.1073 ( p < 0.1 ) for low-leverage firms. This asymmetry suggests that leverage shapes the profit-conversion effect of innovation spillovers.
We interpret this result through two mechanisms. First, debt creates disciplining pressure by increasing repayment obligations and creditor monitoring. This pressure can reduce managerial slack and improve innovation execution. Second, hub-firm disclosure may operate as an interorganizational credibility signal for high-leverage node firms. It helps lenders evaluate future order visibility and revenue sustainability, thereby easing financing constraints. Low-leverage firms lack both the disciplining constraint and this credit-spillover benefit, which may increase the risk of inefficient innovation spending [38].

6. Discussion, Conclusions, and Implications

6.1. Discussion

Amid escalating external shocks and systemic risks confronting global supply chains, enhancing cross-organizational collaborative innovation has become central to sustaining supply chain resilience [3,4]. Yet, persistent information asymmetry within supply chain networks severely constrains node firms’ ability to respond strategically and allocate innovation resources efficiently [29]. To address this challenge, we empirically investigate how forward-looking information disclosure by hub firms functions as a credible strategic signal, bridging organizational boundaries and catalyzing coordinated innovation.
First, we find that hub firms’ forward-looking disclosures significantly increase node firms’ R&D investment intensity. This result corroborates Fan et al. (2025) [9], who document that “chain-leading firm” innovation drives upstream–downstream coordination, thereby affirming the strong positive externalities of core-firm strategic signals. Critically, while prior work on supply chain information coordination (e.g., Kulp et al., 2004 [16]; Li & Lin, 2006 [10]) has predominantly emphasized the sharing of traceable, operational “hard information” (e.g., inventory levels and order forecasts), our finding extends this literature. Specifically, we demonstrate that unstructured, forward-looking “soft information”—long studied in capital markets (Muslu et al., 2015 [29])—also serves as a powerful instrument of “information navigation” within real-economy supply chain networks, effectively reducing uncertainty surrounding technological trajectories for node firms.
Second, regarding moderating mechanisms, we identify a statistically significant negative moderating effect of node firms’ absorptive capacity on this innovation spillover. This pattern appears counterintuitive against the classical absorptive capacity framework (Cohen & Levinthal, 1990 [42]; Zahra & George, 2002 [49]), which posits that internal knowledge and external information are complementary. The resolution lies in the strategic context of supply chain governance: firms endowed with mature information-processing infrastructure and rich domain-specific knowledge possess high-quality private information channels, rendering externally disclosed “public signals” partially redundant. As such, their internal knowledge exerts an “information substitution effect” rather than a complementarity effect [45]. This aligns with Flor et al. (2018) [47], who find diminishing marginal returns to external knowledge search, suggesting that firms at an information disadvantage (i.e., those with lower absorptive capacity) exhibit greater sensitivity to, and reliance upon, public strategic signals from hub firms.
Third, heterogeneity analysis reveals that both larger firm size and higher supply chain relationship specificity strengthen the innovation spillover effect. This finding not only corroborates Dyer and Hatch’s (2006) [11] foundational argument that relationship-specific investments lower knowledge transfer barriers, but also supports Pellegrino and Savona’s (2017) [12] insight: small and micro enterprises, constrained by tight financial and cognitive resources, often fail to cross the critical resource threshold required to convert even high-quality strategic signals into substantive innovation investments.
Finally, our economic consequence assessment suggests that the conversion of innovation spillovers into financial performance (measured by ROA) is stronger among node firms with higher financial leverage. While the prior corporate finance literature (e.g., Atanassov, 2016 [38]) emphasizes debt’s potential to crowd out innovation via financial constraints, our supply-chain context yields a contrasting result. Here, high leverage operates through two reinforcing channels: first, it imposes disciplining governance constraints that mitigate agency frictions; second—and more critically—it enables relational financing. The credible forward-looking disclosures of hub firms serve as interorganizational “soft information” that alleviates lenders’ information asymmetry, thereby relaxing credit rationing for financially constrained node firms. This mechanism directly aligns with the relational lending framework of Petersen and Rajan (1994) [41] and Berger and Udell (2006) [40], which identifies soft information as a key instrument for mitigating credit market failures.
In summary, this study unpacks the “black box” of cross-organizational strategic signal transmission in supply chain networks by integrating signaling theory with absorptive capacity theory. It extends the theoretical frontiers of supply chain innovation research by establishing “soft information” disclosure as a potent coordination mechanism beyond traditional hard-data sharing. It also refines the classical absorptive capacity framework, demonstrating that its complementarity assumption holds primarily under information-scarce conditions, whereas substitution may dominate when internal knowledge infrastructure is mature. Finally, it provides actionable micro-empirical evidence for policymakers seeking to harness hub firms as institutional anchors to build resilient, inclusive, and innovation-driven supply chain ecosystems.

6.2. Research Conclusions

Using a sample of China’s A-share manufacturing listed firms from 2014 to 2024, this study integrates complex network analysis with large-scale text mining to empirically examine (i) the innovation spillover effect of hub firms’ forward-looking information disclosure on node firms; (ii) the moderating role of node firms’ absorptive capacity; and (iii) associated heterogeneity and economic consequences. Our findings yield four principal conclusions:
First, forward-looking disclosure by hub firms is positively associated with R&D investment among node firms, providing evidence of cross-organizational innovation spillovers. This effect operates through two complementary channels: “information navigation” and “financing constraint alleviation.” Specifically, hub firms’ strategic roadmaps reduce technological uncertainty for node firms by clarifying R&D directionality; simultaneously, such disclosures improve node firms’ external financing conditions by enhancing lender confidence and easing credit constraints during innovation implementation.
Second, node firms’ absorptive capacity exerts a statistically significant negative moderating effect on the spillover, revealing an “information substitution effect.” Firms with limited internal knowledge stocks rely heavily on hub firms’ public signals to orient themselves strategically (via “information navigation”). In contrast, firms endowed with mature R&D systems and deep domain expertise possess high-quality private information channels that partially substitute for—and thereby attenuate the marginal impact of—external public signals.
Third, heterogeneity analysis shows that firm-level and network-level attributes jointly shape this spillover effect. At the firm level, medium- and large-sized enterprises—leveraging greater resource endowments—exhibit stronger innovation responsiveness. At the network level, firms occupying core positions in the supply chain topology and exhibiting high relationship specificity (e.g., concentrated sales to the hub firm) demonstrate tighter technical alignment and higher coordination efficiency, yielding significantly stronger marginal spillovers in response to hub firms’ strategic signals.
Fourth, our economic consequence assessment reveals that forward-looking disclosure by hub firms not only stimulates innovation input but also meaningfully enhances micro-level financial performance (measured by ROA). Crucially, this profit-conversion process is moderated by capital structure: among high-leverage firms, debt’s disciplining effect synergizes with the hub firm’s “credibility signal,” amplifying the innovation-to-profit pathway; conversely, low-leverage firms—lacking both governance discipline and credibility spillovers—exhibit overinvestment tendencies, generating a short-term profitability drag. Collectively, these results affirm that high-quality disclosure by hub firms functions as an interorganizational “credit certification,” directly improving the operational quality and allocative efficiency of financially constrained node firms.

6.3. Implications

This study provides micro-empirical evidence to inform the design of policies that foster an inclusive, resilient, and innovation-driven industrial ecosystem under China’s “new development paradigm.” Drawing on our findings, we propose four targeted policy recommendations:
First, institutionalize the strategic information stewardship role of hub firms. Regulatory authorities should integrate the quality and credibility of forward-looking strategic disclosures—such as technology roadmaps and R&D investment plans—into the official information disclosure evaluation system and core credit rating frameworks for listed firms. This institutional design incentivizes hub firms to shift from value extraction (“maximizing isolated firm interests”) toward value co-creation (“sustaining supply chain network resilience”). Complementing regulation, policymakers may introduce a “High-Quality Disclosure Recognition Program”—a transparent, criteria-based allowlist—to publicly acknowledge and reward hub firms that proactively issue clear, actionable strategic signals. Such recognition reduces early-stage R&D uncertainty for supply-chain firms and elevates the efficiency of system-wide collaborative innovation.
Second, bridge the “cognitive gap” at the network periphery through public digital infrastructure. Empirical results show that edge-position firms—constrained by limited technical coordination capacity and weak absorptive infrastructure—face steep barriers in interpreting and acting upon hub firm signals. To address this, governments and industry associations should jointly develop a national Supply Chain Intelligence Platform. This platform would (i) algorithmically transform unstructured hub firm disclosures into standardized, sector-specific technology trend dashboards—lowering information decoding costs for downstream firms; and (ii) deliver targeted knowledge-transfer services (e.g., technical standard alignment, modular R&D toolkits) to SMEs and micro-firms with underdeveloped internal R&D systems—leveraging public signals to compensate for private knowledge deficits and strengthen inclusive network participation.
Third, implement tiered, context-sensitive support policies aligned with firm heterogeneity. Our analysis confirms that small and micro enterprises—constrained by scarce material resources and shallow relational ties—struggle to convert hub firm signals into scalable innovation independently. Furthermore, arm’s-length market transactions further dilute signal fidelity. Accordingly, policymakers should establish a dedicated “Supply Chain Collaborative Innovation Matching Fund” to subsidize early-stage R&D experimentation for SMEs embedded in micro-chains. Crucially, incentives must also target relationship deepening: tax credits or preferential procurement terms should encourage long-term, symbiotic upstream–downstream contracts—thereby reinforcing the relational capital and trust essential for reliable strategic signal transmission and execution.
Fourth, advance supply chain finance governance to accelerate the conversion of innovation into profit. Given the pivotal moderating role of financial leverage and credit constraints, financial institutions must move beyond firm-level risk assessment to adopt network-aware financing models. Specifically: (i) deploy digital infrastructure to enable cross-organizational credit spillover—extending the hub firm’s high creditworthiness to trusted node firms via verifiable transaction data and shared disclosure records; and (ii) refine credit-scoring algorithms by explicitly incorporating a firm’s “coordinated response propensity”—that is, its historical alignment with hub-firm strategic signals—as a potential proxy for future innovation execution capability. By treating credible interfirm coordination as a quantifiable credit asset, this approach supplements traditional collateral with “information-based credit,” directly alleviating capital bottlenecks during the critical R&D commercialization phase and strengthening the link between innovation investment and micro-level profitability.

6.4. Limitations and Future Research Directions

While this study provides a systematic theoretical and empirical examination of cross-organizational innovation spillovers in supply chain networks, several limitations—rooted in data constraints and methodological scope—warrant acknowledgment and suggest productive avenues for future work:
First, our analysis focuses on the vertical, dyadic spillover pathway (“hub firm → supply-chain node firm”), abstracting from the spatially embedded nature of real-world supply chains. Empirically, manufacturing supply chains exhibit pronounced regional clustering (e.g., industrial clusters in the Yangtze River Delta or Pearl River Delta), where geographic proximity enables tacit knowledge transfer, joint use of infrastructure, and localized learning externalities. Future research should integrate spatial econometric techniques—such as the Spatial Durbin Model—or network-based spatial autoregressive models to disentangle the relative contributions of vertical chain governance versus horizontal spatial spillovers within regional industrial ecosystems.
Second, although we employ several endogeneity mitigation strategies, including propensity score matching, lagged explanatory variables, and multi-dimensional fixed effects such as year, industry, and province fixed effects, unobserved heterogeneity linked to hub firm characteristics may still confound causal identification. To strengthen inference, future studies could exploit quasi-natural experiments—for instance, exogenous regulatory shocks to hub firm disclosure requirements (e.g., pilot mandatory ESG reporting mandates) or policy-induced supply chain reconfigurations (e.g., “dual circulation” localization incentives)—to isolate plausibly causal effects.
Third, our measurement of forward-looking disclosure relies primarily on lexical frequency-based indicators (e.g., counts of future-oriented verbs and strategic nouns). While robust and replicable, this approach captures the presence of the signal but not its quality. Advancing beyond surface-level quantification, future work can leverage fine-tuned large language models (LLMs) to assess textual dimensions such as semantic coherence, strategic specificity (e.g., granularity of technology targets), and sentiment valence—thereby enabling more nuanced, context-aware measurement of how signal credibility and actionability shape innovation responses by supply-chain node firms.


Author Contributions

Conceptualization, Y.H. and L.C.; methodology, Y.H.; software, Y.H.; validation, L.C., C.S. and K.N.; formal analysis, Y.H.; investigation, Y.H., C.S. and K.N.; resources, L.C.; data curation, Y.H.; writing—original draft preparation, Y.H.; writing—review and editing, L.C.; visualization, Y.H.; supervision, L.C.; project administration, L.C.; funding acquisition, L.C. All authors have read and agreed to the published version of the manuscript.

Funding

This research was funded by the National Social Science Fund of China, grant number 24BGL205; the National Natural Science Foundation of China, grant number 72302041; and the College Students’ Innovative Entrepreneurial Training Plan Program.

Institutional Review Board Statement

Not applicable.

Informed Consent Statement

Not applicable.

Data Availability Statement

The original data presented in this study are derived from the CSMAR (China Stock Market & Accounting Research) database. Further inquiries can be directed to the corresponding author.

Conflicts of Interest

The authors declare no conflicts of interest.

Abbreviations

The following abbreviations are used in the manuscript:
MD&AManagement’s Discussion and Analysis
R&DResearch and Development
SMEsSmall and Medium-sized Enterprises
ROAReturn on Assets
CSMARChina Stock Market & Accounting Research
PSMPropensity Score Matching

References

  1. Iftikhar, A.; Ali, I.; Zhan, Y.; Stevenson, M.; Tarba, S. Firms’ Strategic Responses to Rising Uncertainty amid Ongoing Geopolitical Tensions: The Synergistic Mediating Role of Network Capability and Innovation Ambidexterity. Transp. Res. Part E Logist. Transp. Rev. 2025, 199, 104146. [Google Scholar] [CrossRef]
  2. Bednarski, L.; Roscoe, S.; Blome, C.; Schleper, M. Geopolitical disruptions in global supply chains: A state-of-the-art literature review. Prod. Plan. Control 2025, 36, 536–562. [Google Scholar] [CrossRef]
  3. Gereffi, G. What does the COVID-19 pandemic teach us about global value chains? The case of medical supplies. J. Int. Bus. Policy 2020, 3, 287–301. [Google Scholar] [CrossRef]
  4. Craighead, C.; Ketchen, D.; Darby, J. Pandemics and Supply Chain Management Research: Toward a Theoretical Toolbox. Decis. Sci. 2020, 51, 838–866. [Google Scholar] [CrossRef] [PubMed]
  5. Chod, J.; Trichakis, N.; Tsoukalas, G. Supplier Diversification Under Buyer Risk. Manag. Sci. 2019, 65, 3150–3173. [Google Scholar] [CrossRef]
  6. Pandey, S.; Singh, R.; Gunasekaran, A. Supply chain risks in Industry 4.0 environment: Review and analysis framework. Prod. Plan. Control 2023, 34, 1275–1302. [Google Scholar] [CrossRef]
  7. Soosay, C.A.; Hyland, P.W.; Ferrer, M. Supply chain collaboration: Capabilities for continuous innovation. Supply Chain Manag. Int. J. 2008, 13, 160–169. [Google Scholar] [CrossRef]
  8. Wang, C.; Hu, Q. Knowledge sharing in supply chain networks: Effects of collaborative innovation activities and capability on innovation performance. Technovation 2020, 94–95, 102010. [Google Scholar] [CrossRef]
  9. Fan, H.; Zheng, Z.; Wu, T.; He, S. How Does Innovation by Chain Leader Enterprises Drive Innovation among Upstream and Downstream Firms. Econ. Perspect. 2025, 10, 18–36. (In Chinese) [Google Scholar]
  10. Li, S.; Lin, B. Assessing information sharing and information quality in supply chain management. Decis. Support Syst. 2006, 42, 1641–1656. [Google Scholar] [CrossRef]
  11. Dyer, J.; Hatch, N. Relation-specific capabilities and barriers to knowledge transfers: Creating advantage through network relationships. Strateg. Manag. J. 2006, 27, 701–719. [Google Scholar] [CrossRef]
  12. Pellegrino, G.; Savona, M. No money, no honey? Financial versus knowledge and demand constraints on innovation. Res. Policy 2017, 46, 510–521. [Google Scholar] [CrossRef]
  13. Ni, J.; Xu, Y.; Shi, J.; Li, J. Product Innovation in a Supply Chain with Information Asymmetry: Is More Private Information Always Worse? Eur. J. Oper. Res. 2024, 314, 229–240. [Google Scholar] [CrossRef]
  14. Hall, B.; Lerner, J. The Financing of R&D and Innovation. In Handbook of the Economics of Innovation; Hall, B., Rosenberg, N., Eds.; Elsevier: Amsterdam, The Netherlands, 2010; Volume 1, pp. 609–639. [Google Scholar] [CrossRef]
  15. Jian, G.; Deng, J. Hub Firm Driven M&A and Supply Chain Resilience. Mod. Financ. Econ. 2026, 46, 114–129. (In Chinese) [Google Scholar]
  16. Kulp, S.; Lee, H.; Ofek, E. Manufacturer Benefits from Information Integration with Retail Customers. Manag. Sci. 2004, 50, 431–444. [Google Scholar] [CrossRef]
  17. Liu, Y. Will Major Customers Push Suppliers to Improve Their Internal Information Quality? Eur. J. Financ. 2025, 31, 2040–2067. [Google Scholar] [CrossRef]
  18. Cen, L.; Dasgupta, S.; Sen, R. Discipline or Disruption? Stakeholder Relationships and the Effect of Takeover Threat. Manag. Sci. 2016, 62, 2820–2841. [Google Scholar] [CrossRef]
  19. Healy, P.; Palepu, K. Information Asymmetry, Corporate Disclosure, and the Capital Markets: A Review of the Empirical Disclosure Literature. J. Account. Econ. 2001, 31, 405–440. [Google Scholar] [CrossRef]
  20. Dye, R. Disclosure of Nonproprietary Information. J. Account. Res. 1985, 23, 123–145. [Google Scholar] [CrossRef]
  21. Verrecchia, R. Information quality and discretionary disclosure. J. Account. Econ. 1990, 12, 365–380. [Google Scholar] [CrossRef]
  22. Diamond, D.; Verrecchia, R. Disclosure, Liquidity, and the Cost of Capital. J. Financ. 1991, 46, 1325–1359. [Google Scholar] [CrossRef]
  23. Francis, J.; Nanda, D.; Olsson, P. Voluntary Disclosure, Earnings Quality, and Cost of Capital. J. Account. Res. 2008, 46, 53–99. [Google Scholar] [CrossRef]
  24. Athanasakou, V.; Hussainey, K. The perceived credibility of forward-looking performance disclosures. Account. Bus. Res. 2014, 44, 227–259. [Google Scholar] [CrossRef]
  25. Chen, S.S.; Huang, C.W.; Hwang, C.Y. Voluntary disclosure and corporate innovation. Rev. Quant. Financ. Account. 2022, 58, 1081–1115. [Google Scholar] [CrossRef]
  26. Jiang, F.; Kim, K. Corporate Governance in China: A Survey. Rev. Financ. 2020, 24, 733–772. [Google Scholar] [CrossRef]
  27. Li, Z.; Li, C.; Feng, X. Non-financial Information Disclosure and Pricing Efficiency in the Capital Market. Financ. Trade Econ. 2022, 43, 38–52. (In Chinese) [Google Scholar]
  28. Xue, Y.; Tian, G.; Li, X. Forward-looking Information Disclosure and Investment Efficiency: “Empty Talk” or “Real Action”. Secur. Mark. Her. 2022, 14–22. (In Chinese) [Google Scholar]
  29. Muslu, V.; Radhakrishnan, S.; Subramanyam, K.; Lim, D. Forward-Looking MD&A Disclosures and the Information Environment. Manag. Sci. 2015, 61, 931–948. [Google Scholar] [CrossRef]
  30. Spence, M. Job market signaling. Q. J. Econ. 1973, 87, 355–374. [Google Scholar] [CrossRef]
  31. Spence, M. Signaling in retrospect and the informational structure of markets. Am. Econ. Rev. 2002, 92, 434–459. [Google Scholar] [CrossRef]
  32. Connelly, B.; Certo, S.; Ireland, R.; Reutzel, C. Signaling Theory: A Review and Assessment. J. Manag. 2011, 37, 39–67. [Google Scholar] [CrossRef]
  33. Connelly, B.; Certo, S.; Reutzel, C.; DesJardine, M.; Zhou, Y. Signaling theory: State of the theory and its future. J. Manag. 2025, 51, 24–61. [Google Scholar] [CrossRef]
  34. Taj, S. Application of signaling theory in management research: Addressing major gaps in theory. Eur. Manag. J. 2016, 34, 338–348. [Google Scholar] [CrossRef]
  35. Mavlanova, T.; Benbunan-Fich, R.; Koufaris, M. Signaling theory and information asymmetry in online commerce. Inf. Manag. 2012, 49, 240–247. [Google Scholar] [CrossRef]
  36. Kirmani, A.; Rao, A. No pain, no gain: A critical review of the literature on signaling unobservable product quality. J. Mark. 2000, 64, 66–79. [Google Scholar] [CrossRef]
  37. Brown, J.; Fazzari, S.; Petersen, B. Financing Innovation and Growth: Cash Flow, External Equity, and the 1990s R&D Boom. J. Financ. 2009, 64, 151–185. [Google Scholar] [CrossRef]
  38. Atanassov, J. Arm’s Length Financing and Innovation: Evidence from Publicly Traded Firms. Manag. Sci. 2016, 62, 128–155. [Google Scholar] [CrossRef]
  39. Bonsall, S.; Miller, B. The Impact of Narrative Disclosure Readability on Bond Ratings and the Cost of Debt. Rev. Account. Stud. 2017, 22, 608–643. [Google Scholar] [CrossRef]
  40. Berger, A.; Udell, G. A more complete conceptual framework for SME finance. J. Bank. Financ. 2006, 30, 2945–2966. [Google Scholar] [CrossRef]
  41. Petersen, M.; Rajan, R. The Benefits of Lending Relationships: Evidence from Small Business Data. J. Financ. 1994, 49, 3–37. [Google Scholar] [CrossRef]
  42. Cohen, W.; Levinthal, D. Absorptive Capacity: A New Perspective on Learning and Innovation. Adm. Sci. Q. 1990, 35, 128–152. [Google Scholar] [CrossRef]
  43. Harris, R.; Moffat, J. Intangible assets, absorbing knowledge and its impact on firm performance: Theory, measurement and policy implications. Contemp. Soc. Sci. 2013, 8, 346–361. [Google Scholar] [CrossRef]
  44. Cassiman, B.; Veugelers, R. In search of complementarity in innovation strategy: Internal R&D and external knowledge acquisition. Manag. Sci. 2006, 52, 68–82. [Google Scholar] [CrossRef]
  45. Wang, T.; Yu, X.; Cui, N. The substitute effect of internal R&D and external knowledge acquisition in emerging markets: An attention-based investigation. Eur. J. Mark. 2020, 54, 1117–1146. [Google Scholar] [CrossRef]
  46. Grigoriou, K.; Rothaermel, F. Organizing for knowledge generation: Internal knowledge networks and the contingent effect of external knowledge sourcing. Strateg. Manag. J. 2017, 38, 395–414. [Google Scholar] [CrossRef]
  47. Flor, M.; Cooper, S.; Oltra, M. External Knowledge Search, Absorptive Capacity and Radical Innovation in High-Technology Firms. Eur. Manag. J. 2018, 36, 183–194. [Google Scholar] [CrossRef]
  48. Gofman, M.; Segal, G.; Wu, Y. Production Networks and Stock Returns: The Role of Vertical Creative Destruction. Rev. Financ. Stud. 2020, 33, 5856–5905. [Google Scholar] [CrossRef]
  49. Zahra, S.; George, G. Absorptive Capacity: A Review, Reconceptualization, and Extension. Acad. Manag. Rev. 2002, 27, 185–203. [Google Scholar] [CrossRef] [PubMed][Green Version]
  50. Xiao, R.; Wang, X.; Qian, L. Digital transformation, information dynamic capabilities and green innovation quality. Collect. Essays Financ. Econ. 2026, 42, 65–76. (In Chinese) [Google Scholar]
  51. Abadie, A.; Athey, S.; Imbens, G.; Wooldridge, J. When Should You Adjust Standard Errors for Clustering? Q. J. Econ. 2023, 138, 1–35. [Google Scholar] [CrossRef]
  52. Petersen, M. Estimating Standard Errors in Finance Panel Data Sets: Comparing Approaches. Rev. Financ. Stud. 2009, 22, 435–480. [Google Scholar] [CrossRef]
  53. Shimizu, K.; Hitt, M. Strategic flexibility: Organizational preparedness to reverse ineffective strategic decisions. Acad. Manag. Perspect. 2004, 18, 44–59. [Google Scholar] [CrossRef]
  54. Teece, D.; Pisano, G.; Shuen, A. Dynamic capabilities and strategic management. Strateg. Manag. J. 1997, 18, 509–533. [Google Scholar]
  55. Zhang, L.; Zhang, X.; Choi, S. Optimizing Slack Resource Allocation: An Economic Approach to Sustainable Competitive Advantage. SAGE Open 2025, 15, 21582440251313587. [Google Scholar] [CrossRef]
  56. Onofrei, G.; Nguyen, H.; Zhang, M.; Fynes, B. Building supply chain relational capital: The impact of supplier and customer leveraging on innovation performance. Bus. Strategy Environ. 2020, 29, 3422–3434. [Google Scholar] [CrossRef]
Figure 1. Supply Chain Network Topology and Chain-Leading Enterprise Identification via PageRank Algorithm. Notes: Nodes represent individual firms; directed links reflect actual supplier–customer transaction flows. Node size and color intensity (from light to dark red) are strictly proportional to each firm’s PageRank centrality score (PR). The largest, darkest-red node—exhibiting the highest PR—denotes a hub firm. Such firms possess a superior capacity to attract resources and to radiate strategic information across the network, thereby making them the primary hub-firm units for testing innovation spillover effects in this study.
Systems 14 00860 g001
Table 1. Definitions and measurements of main variables.
Variable TypeVariable NameSymbolMeasurement
Dependent VariableNode firm innovation investmentRD_per_TARatio of total R&D expenditure to total assets at the end of the period
Independent VariableHub firm forward-looking disclosureCL_DiscAverage proportion of forward-looking words of all corresponding hub firms
Moderating VariableNode firm information absorptive capacityIntang_ACRatio of net intangible assets to total assets at the end of the period
Control VariablesFirm sizeSizeNatural logarithm of total assets at the end of the period (in ten billions of RMB)
Network centralityPageRank_stdZ-score standardized PageRank score based on the global supply chain transaction network, measuring the firm’s overall status and influence in the network
ProfitabilityROARatio of net profit to total assets at the end of the period
Adjusted leverageLev_adjResiduals from regressing leverage (total liabilities divided by total assets) on firm size to orthogonally remove the scale effect
Firm ageAgeNatural logarithm of firm age plus one
Tobin’s QTobinQRatio of the firm’s market value to the replacement cost of assets
Cash flow ratioCF_RateRatio of net cash flow from operating activities to total assets at the end of the period
Revenue growthGrowthRatio of the change in operating revenue from the previous period to the previous period’s operating revenue
Table 2. Descriptive statistics.
VariablesNMeanSDMinMedianMax
RD_per_TA30930.03370.02710.00070.02810.1666
CL_Disc30930.13490.9235−1.80760.03902.7139
Intang_AC30930.04040.02780.00320.03430.1544
PageRank_std30930.07050.3127−0.2505−0.08631.0126
Size30930.89690.50730.12660.77032.6168
ROA30932.74205.5915−6.89040.513322.5884
Lev_adj3093−0.00180.0540−0.0551−0.01770.1905
Age30932.21420.94660.00002.48493.4012
TobinQ30931.71620.97310.89181.40126.7270
CF_Rate30930.05380.0669−0.13090.05210.2512
Growth30930.15130.3390−0.47610.09021.9990
Table 3. Pearson correlation matrix.
Variables(1)(2)(3)(4)(5)(6)(7)(8)(9)(10)(11)
(1) RD_per_TA1.000
(2) CL_Disc0.145 ***1.000
(3) Intang_AC−0.012−0.062 ***1.000
(4) PageRank_std−0.081 ***−0.065 ***0.068 ***1.000
(5) Size0.073 ***0.032 *0.0070.067 ***1.000
(6) ROA0.020−0.018−0.077 ***−0.093 ***−0.291 ***1.000
(7) Lev_adj−0.062 ***−0.019−0.070 ***−0.015−0.099 ***0.097 ***1.000
(8) Age−0.236 ***−0.150 ***0.0190.012−0.386 ***0.273 ***0.058 ***1.000
(9) TobinQ0.321 ***0.0220.0150.0230.242 ***−0.079 ***−0.085 ***−0.100 ***1.000
(10) CF_Rate0.010−0.056 ***0.022−0.0240.113 ***0.249 ***−0.102 ***0.071 ***0.147 ***1.000
(11) Growth0.165 ***−0.019−0.011−0.020−0.104 ***0.169 ***−0.022−0.069 ***0.156 ***0.059 ***1.000
Note: N = 3093 . *** p < 0.01 and * p < 0.1 .
Table 4. Main effect regression results.
Variables(1) Univariate(2) + Controls(3) + Year FE(4) + Industry FE
Hub Firm Disclosure (CL_Disc)0.0042 ***0.0031 ***0.0017 ***0.0016 ***
(9.1399)(7.0707)(3.5733)(3.4523)
Control Variables & Fixed Effects
Firm-level ControlsNoYesYesYes
Year FENoNoYesYes
Industry FENoNoNoYes
Diagnostics
Observations (N)3093309330933093
R-squared0.02100.17990.19760.3376
Note: Robust t-statistics (HC1-corrected) appear in parentheses. *** p < 0.01 .
Table 5. Moderation effect regression results.
Variables(1) High Intang_AC(2) Low Intang_AC(3) Full Sample Interaction
CL_Disc_c0.0013 *0.0026 ***0.0027 ***
(1.73)(3.68)(3.75)
High_Intang_AC 0.0006
(0.48)
CL_Disc_c × High_Intang_AC −0.0019 *
(−1.74)
ControlsYesYesYes
Year FEYesYesYes
Industry FEYesYesYes
Observations155215413093
R-squared0.34180.23320.2397
Note: Robust t-statistics (HC1-corrected) appear in parentheses. *** p < 0.01 and * p < 0.1 .
Table 6. Robustness test results.
Variables(1) PSM(2) Lagging(3) Winsor 5%(4) Excl. 2020(5) Province FE
CL_Disc_c0.0013 *** 0.0014 ***0.0015 ***0.0014 ***
(3.0119) (3.6853)(3.1226)(3.0090)
L.CL_Disc_c 0.0012 **
(2.1499)
ControlsYesYesYesYesYes
Industry FEYesYesYesYesYes
Year FEYesYesYesYesYes
Province FENoNoNoNoYes
Observations30722236309327633093
R-squared0.34200.35270.36680.33380.3793
Note: Heteroskedasticity-robust t-statistics corrected by HC1 appear in parentheses. *** p < 0.01 and ** p < 0.05 .
Table 7. Heterogeneity analysis by firm size.
Variables(1) Small(2) Medium(3) Large
C L _ D i s c _ c 0.0015 *0.0021 **0.0019 **
(1.7241)(2.4704)(2.5327)
ControlsYesYesYes
Industry FEYesYesYes
Year FEYesYesYes
Observations103210301031
R-squared0.35510.41570.3457
Note: Robust t-statistics (HC1-corrected for heteroskedasticity) are reported in parentheses. ** p < 0.05 and * p < 0.1 .
Table 8. Heterogeneity analysis by relative network position.
Variables(1) Core Position(2) Peripheral Position
C L _ D i s c _ c 0.0023 ***0.0008
(3.1317)(1.3447)
ControlsYesYes
Industry FEYesYes
Year FEYesYes
Observations14981595
R-squared0.34220.3584
Note: Robust t-statistics (HC1-corrected for heteroskedasticity) are reported in parentheses. *** p < 0.01 .
Table 9. Heterogeneity analysis by supply chain relationship specificity.
Variables(1) High Rel. Spec.(2) Low Rel. Spec.(3) Full Sample Interaction
CL_Disc_c0.0041 ***0.00090.0002
(4.66)(1.56)(0.30)
High_Rel_Spec 0.0013
(1.07)
CL_Disc_c × High_Rel_Spec 0.0032 ***
(2.93)
ControlsYesYesYes
Year FEYesYesYes
Industry FEYesYesYes
Observations154915443093
R-squared0.33800.23000.2410
Note: Robust t-statistics (HC1-corrected for heteroskedasticity) are reported in parentheses. *** p < 0.01 .
Table 10. Economic consequences and leverage moderation.
Variables(1) Full Sample(2) High Leverage(3) Low Leverage
C L _ D i s c _ c 0.1810 *0.6007 ***−0.1073 *
(1.9464)(3.2329)(−1.7283)
ControlsYesYesYes
Industry FEYesYesYes
Year FEYesYesYes
Observations309315541539
R-squared0.26970.29330.3747
Chow Test p-value 0.0104
Note: Robust t-statistics (HC1-corrected) appear in parentheses. *** p < 0.01 and * p < 0.1 .
Disclaimer/Publisher’s Note: The statements, opinions and data contained in all publications are solely those of the individual author(s) and contributor(s) and not of MDPI and/or the editor(s). MDPI and/or the editor(s) disclaim responsibility for any injury to people or property resulting from any ideas, methods, instructions or products referred to in the content.