Article

Cybersecurity Risk in Industrial Control Systems in Industry 4.0
1
Department of Electrical Engineering and Computer Science, College of Engineering and Computer Science, Florida Atlantic University, Boca Raton, FL 33431-0991, USA
2
Buckingham Business School, University of Buckingham, Buckingham MK18 1EG, UK
3
Department of Information Systems and Business Analytics, Ambassador Crawford College of Business and Entrepreneurship, Kent State University, Kent, OH 44242-0001, USA
*
Author to whom correspondence should be addressed.
Systems 2026, 14(7), 837; https://doi.org/10.3390/systems14070837
Submission received: 6 April 2026 / Revised: 20 June 2026 / Accepted: 30 June 2026 / Published: 13 July 2026

Abstract

Industrial control systems (ICSs) are the operational technology that monitors and directs physical processes across critical infrastructure. They sit at the core of Industry 4.0. Once these systems are connected to digital platforms and service chains, a flaw in one component is no longer confined to that component. Conventional practice still treats disclosed vulnerabilities as isolated events to be patched, which leaves an open question: does the way vulnerabilities accumulate across ICS infrastructure amount to systemic risk, a property of the system rather than of any single flaw? We examine this using the ICS-CERT Vulnerability Dataset, analysing 60,378 vulnerability-product records that cover 2327 unique Common Vulnerabilities and Exposures (CVE) entries, 416 vendors and 14,577 affected products from 2012 to 2020. We construct a System Risk Index (SRI) that aggregates vulnerabilities to the vendor-year level, weighted by severity and exploitability. An ordinary least squares (OLS) model with heteroscedasticity-robust standard errors explains vulnerability severity (R2 = 0.99). A second model explains system-level risk (R2 = 0.91). Vulnerability-type diversity, measured through the Common Weakness Enumeration (CWE) taxonomy, is the strongest driver of SRI (β = 1.25, p < 0.001), ahead of mean exploitability (β = 0.29, p < 0.001) and product breadth (β = 0.06, p = 0.001). Annual ICS disclosures rose from 115 in 2012 to 503 in 2019, an increase of 337 per cent. Risk is concentrated: the five largest vendors account for 33.3 per cent of disclosed CVEs and more than 60 per cent of the cumulative SRI, with one vendor carrying over twice the cumulative SRI of the next. Quantile regression confirms the severity findings at the median. The pattern indicates that digital transformation redistributes risk into a connected, vendor-level property of the infrastructure beneath product–service delivery. Oversight should therefore track the diversity and exploitability of a vendor’s vulnerabilities rather than severity alone, concentrating scrutiny on the small set of vendors that carry most of the systemic exposure.

1. Introduction

Industry 4.0 runs on connectivity. Sensors report to controllers; controllers exchange data with platforms; these platforms deliver services to customers who never see the industrial infrastructure beneath them. This connectivity is the foundation of modern product–service systems in manufacturing, energy, transport and healthcare. It is also, increasingly, a source of structural vulnerability. The conventional framing of risk in digital systems treats vulnerabilities as isolated events: a software flaw is discovered, a patch is issued and the flaw is closed. This framing works when systems are independent but becomes less effective in interconnected environments where dependencies shape outcomes. In Industry 4.0 environments, industrial control systems (ICSs) from a handful of major vendors are embedded in thousands of products, deployed across critical infrastructure sectors and through shared protocols and platforms [1,2]. Vulnerability in one component can propagate across dependent components in interconnected systems. Where the affected code is shared, that exposure extends across the products, deployments and service chains built on it [3,4].
This study examines whether the pattern of vulnerability accumulation in ICS infrastructure constitutes evidence of systemic risk, a system-level property that emerges from the structure of digital interdependence rather than from any single flaw. The argument draws on two bodies of scholarship. The first is the product–service systems (PSS) literature, which conceptualises value delivery as an integrated system of products, services and infrastructure [5,6]. The second is the emerging literature on digital risk in Industry 4.0, which recognises that cyber–physical integration creates new categories of exposure [7,8]. The distinction between event-level and system-level risk is not merely semantic. Event-level risk management responds to individual vulnerabilities as they are disclosed: assess severity, prioritise patching, close the gap. This is adequate where vulnerabilities are independent. In ICS environments they often are not, because shared firmware, communication protocols and software libraries couple the exposure of otherwise separate deployments [9,10]. A single vendor’s products may be deployed across hundreds of industrial sites, often sharing firmware, communication protocols and software libraries. A vulnerability in a shared component does not create one risk event. It creates a correlated exposure across every deployment that depends on that component. Eling and Wirfs [11] showed that cyber losses exhibit positive correlations across firms, a property incompatible with event-level risk models. Our analysis provides the infrastructure-level evidence for why this correlation exists.
The gap we address is both empirical and conceptual, as existing metrics such as the Common Vulnerability Scoring System (CVSS) do not capture structural risk across interconnected systems. The PSS literature treats risk abstractly, as a consideration in service design rather than an observable structural property. The cybersecurity literature treats vulnerabilities as events to be patched rather than patterns to be analysed at the system level. The Industry 4.0 literature documents the growth of connectivity in detail, yet relatively little of it follows the risk consequences of that connectivity through disclosed vulnerability data. Neither literature has examined the structure of vulnerability accumulation across ICS infrastructure using transactional data on actual disclosed flaws. This is the space we occupy. We ask three questions. First, what determines the severity of vulnerabilities disclosed in ICS infrastructure, and to what extent do cross-system dependencies contribute? Second, how has the volume and character of ICS vulnerabilities changed over the period of Industry 4.0 adoption? Third, how concentrated is systemic risk across vendors and what drives vendor-level risk accumulation? To answer these questions, we construct a System Risk Index (SRI) that aggregates vulnerability data at the vendor-year level, weighting by severity and exploitability. This index captures systemic exposure rather than the event-level incidence. We apply OLS regression, temporal analysis, concentration measurement and quantile regression to a dataset of 60,378 ICS vulnerability records. The contribution is threefold. We provide the first empirical characterisation of the vulnerability structure in the ICS infrastructure as a system-level phenomenon. We introduce the SRI as a replicable index for measuring systemic risk in connected industrial environments. And we connect these findings to the PSS and Industry 4.0 literatures, arguing that digital transformation restructures risk into an interconnected property of the infrastructure that underpins service delivery.
To formalise the empirical analysis, the study develops the following hypotheses:
H1. 
Vulnerability severity is primarily determined by exploitability and impact rather than system exposure.
H2. 
Systemic risk increases with vulnerability type diversity (CWE diversity).
H3. 
Exploitability contributes more strongly to systemic risk than product breadth.
H4. 
Systemic risk is concentrated among a small subset of vendors.
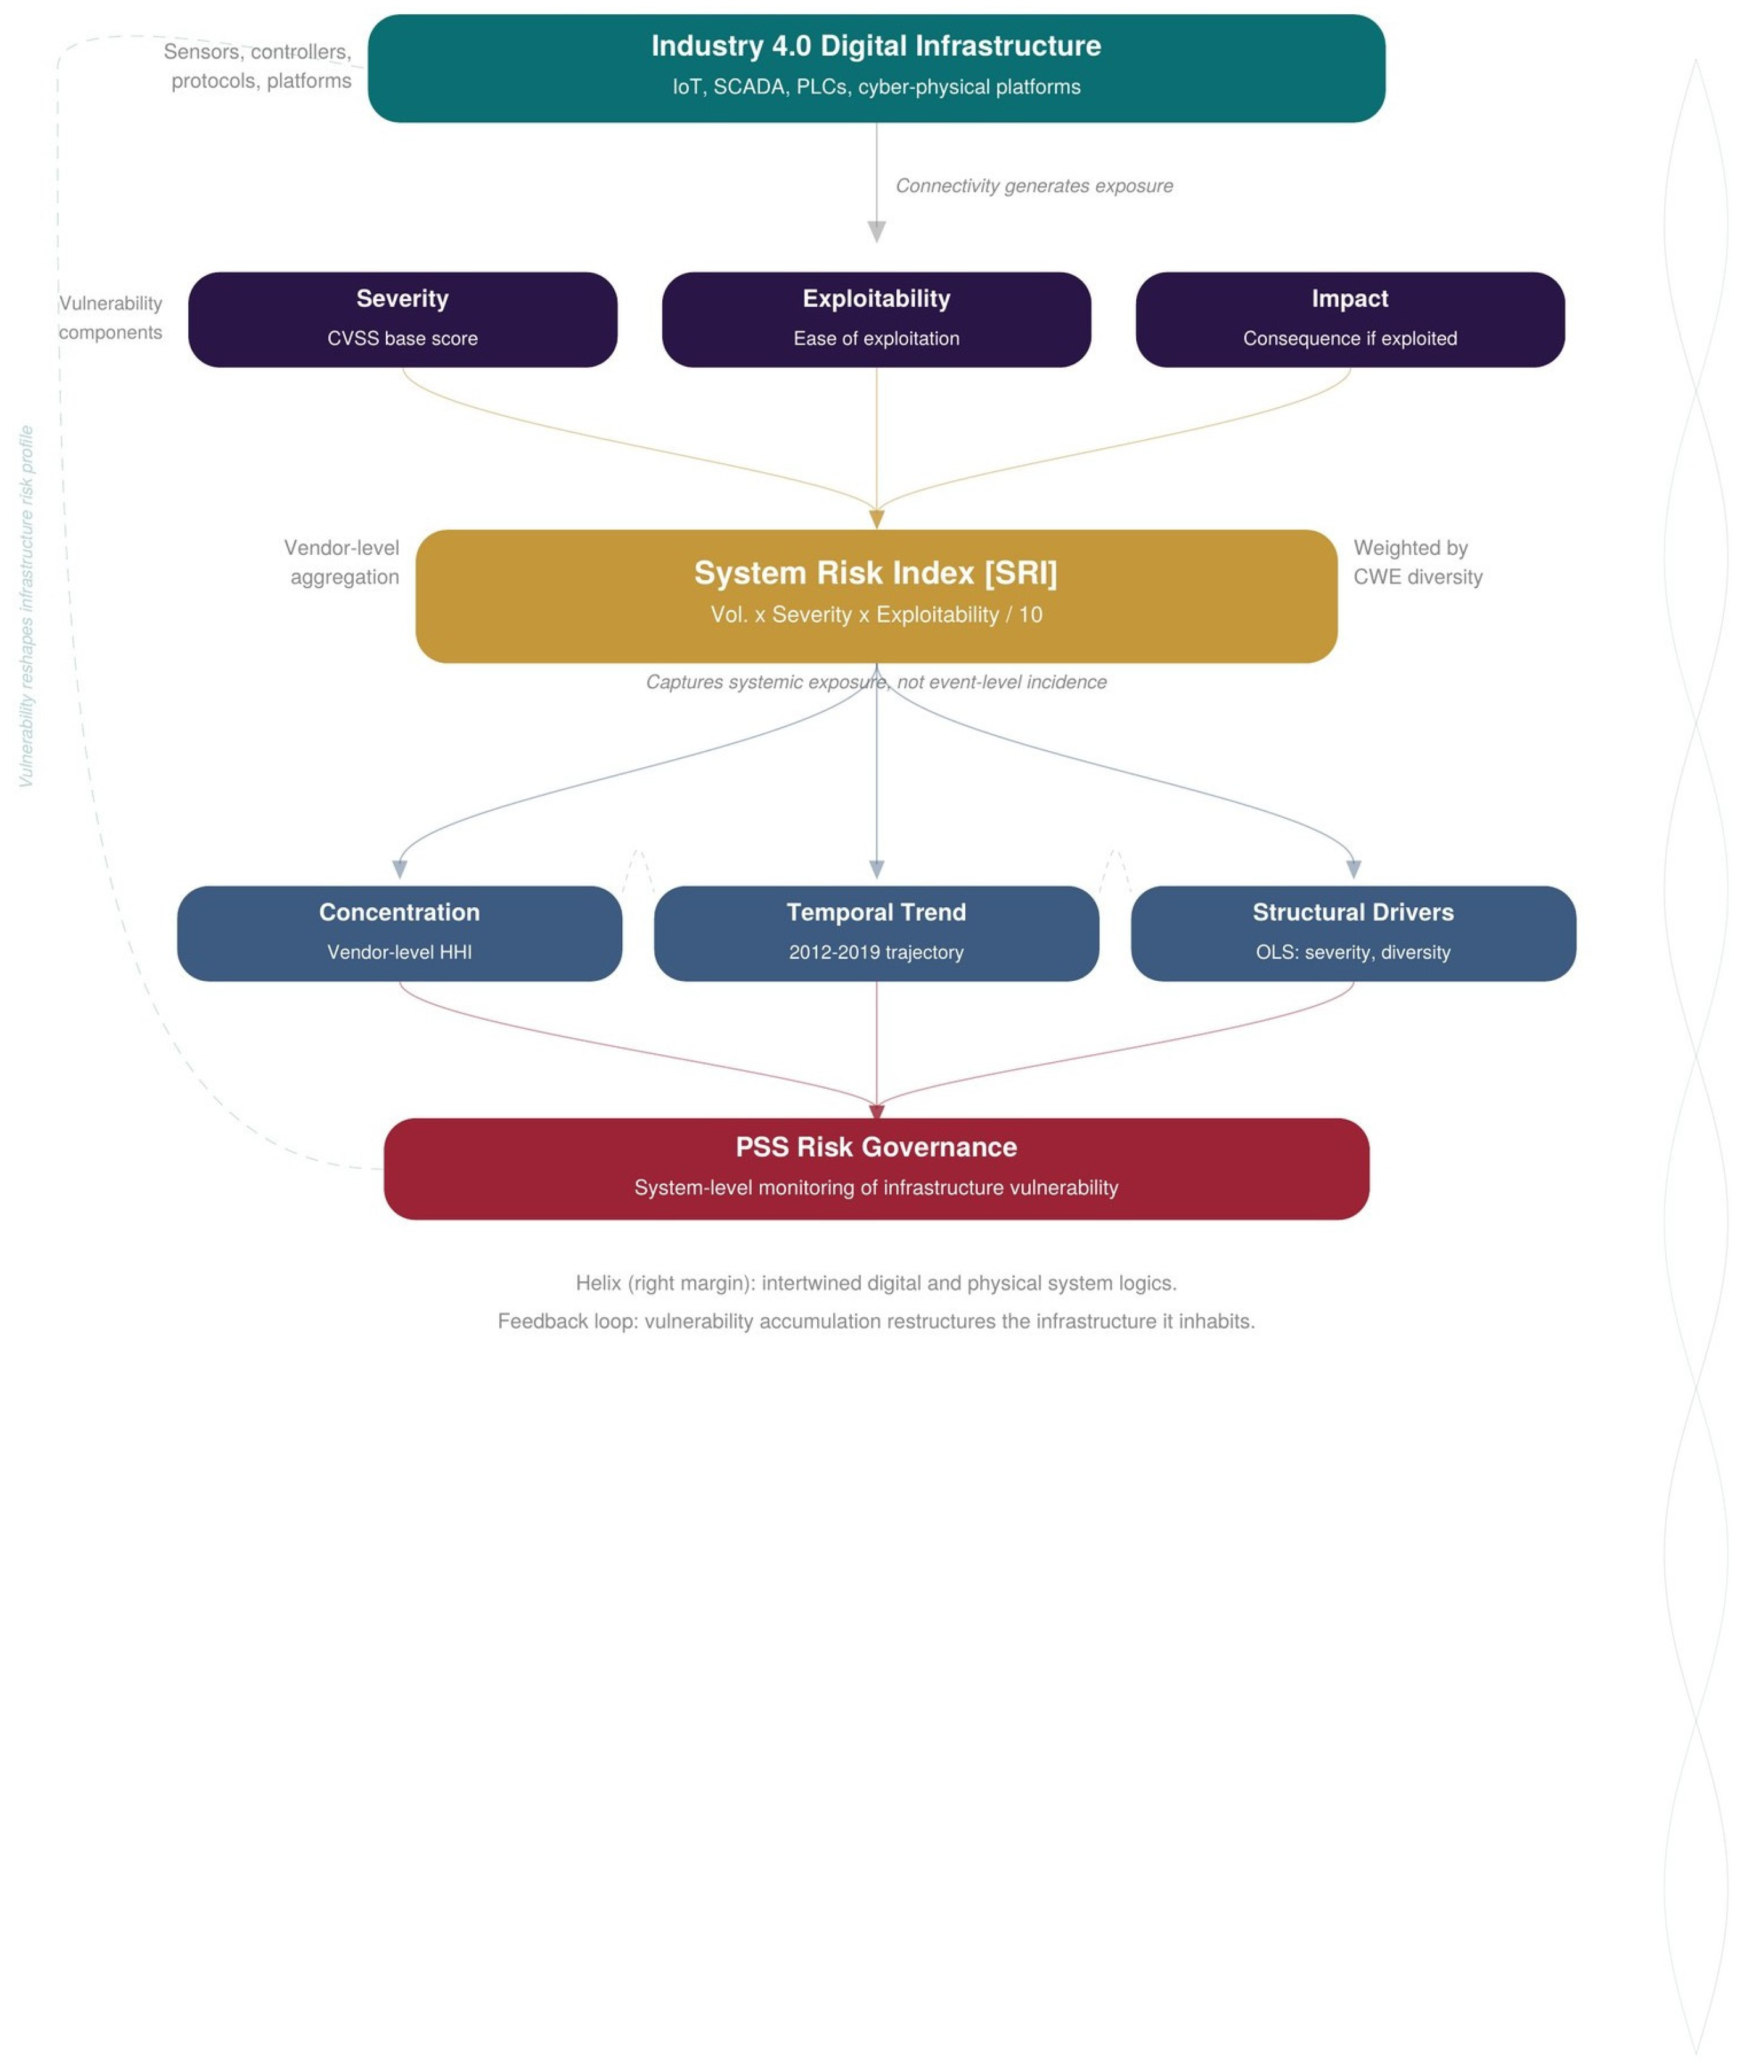
Figure 1 illustrates the conceptual relationship between digital infrastructure, vulnerability accumulation and systemic risk that underpins the theoretical framework developed in this study.

2. Related Works

2.1. Risk in Digitally Connected Systems

The study of risk in information systems has evolved from a technical vulnerability assessment toward the recognition of systemic interdependence. Cenfetelli et al. [12] identified technology-mediated risk as a distinct category shaped by the system architecture rather than individual component failure. More recent work has emphasised that digital interconnection creates cascading risk pathways. Urciuoli et al. [3] analysed supply chain cyber risk and found that interconnection amplifies exposure beyond what component-level assessment predicts.
Within the cybersecurity domain, Allodi and Massacci [13] demonstrated that vulnerability severity scores alone are poor predictors of actual exploitation, because exploitation depends on the system context in which a vulnerability sits, not just its technical characteristics. This finding is central to our argument: risk is a property of the system, not the flaw. Eling and Schnell [14] examined cyber risk from an insurance perspective and found that the correlated nature of digital vulnerabilities distinguishes cyber risk from traditional operational risk categories. Biener et al. [15] extended this analysis, finding that cyber risk exhibits fat-tailed loss distributions and high correlation across exposures, properties more typical of systemic financial risk than of conventional operational hazards. Böhme and Kataria [4] modelled internet-scale correlated failure and showed that interdependent systems exhibit risk-amplification effects absent in independent architectures. The organisational dimension of digital risk has attracted growing attention. Bharadwaj et al. [16] argued that the digital strategy is inseparable from the business strategy, implying that digital risk is not a technical silo but a strategic concern embedded in the organisation’s value architecture. Mithas and Rust [17] showed that information technology investments create performance interdependencies that propagate both gains and losses across organisational boundaries. Banker et al. [18] examined how technology-infrastructure decisions create path dependencies that constrain future risk-management options. These studies establish that digital risk has an organisational and strategic character that extends beyond technical vulnerability management.
In the information systems literature, Tanriverdi et al. [19] introduced the concept of digital risk management as a strategic capability, arguing that firms must manage risk at the system level rather than treating it as a collection of independent events. Xue et al. [20] examined information technology infrastructure governance and found that firms adjust the balance between decentralised and centralised decision-making as environmental uncertainty increases, highlighting the importance of governance structures in coordinating risk across complex digital environments. Kwon and Johnson [21] analysed health information breaches and demonstrated that breach risk clusters geographically and temporally, exhibiting contagion-like properties consistent with systemic rather than idiosyncratic risk. D’Arcy et al. [22] studied security behaviour in organisations and found that compliance-based approaches to risk management systematically underestimate exposure in interconnected environments. These studies establish, theoretically, that digital risk has structural properties. What remains is to demonstrate this empirically using data on actual vulnerability patterns in industrial infrastructure. This work is valuable for establishing, in theory, that digital risk has structural properties. Its limit is that the claim rests on models and case argument rather than disclosure data, which is the gap this paper addresses with measurement.

2.2. Industry 4.0 and Cyber-Physical Systems

Industry 4.0 describes the convergence of physical production systems with digital infrastructure through IoT, cloud computing and cyber–physical systems [1,23]. Frank et al. [2] identified four adoption layers, each generating new data flows and dependencies between production and service systems. Zheng et al. [24] reviewed Industry 4.0 manufacturing applications and found that advanced implementations require continuous data exchange between operational and informational technology layers. The convergence creates a distinctive risk profile. Amin et al. [25] analysed the security of cyber–physical systems in critical infrastructure and identified the coupling of digital and physical components as a fundamental source of vulnerability. Humayed et al. [26] reviewed cyber–physical system security and found that the attack surface expands with each integration point between digital controllers and physical processes. Knowles et al. [9] examined ICS security in the context of smart grid infrastructure and demonstrated that legacy industrial protocols were not designed for the connected environments in which they now operate. The ICS security landscape has been documented in practitioner and policy literature. Hemsley and Fisher [27] provided a historical analysis of ICS-targeted attacks and found an accelerating trend in both volume and sophistication. Stouffer et al. [28] published guidance on ICS security for the US National Institute of Standards and Technology, identifying the gap between IT security practices and the operational requirements of industrial systems. These studies establish the empirical context but do not analyse vulnerability patterns as system-level phenomena.
Dalenogare et al. [29] examined how Industry 4.0 technologies contribute to industrial performance and found that connectivity technologies, while enabling productivity gains, simultaneously create new operational dependencies. Sjödin et al. [30] identified smart factory implementation challenges and found that cybersecurity governance lags behind technological adoption. Kohtamäki et al. [31] argued that digital servitisation creates ecosystem-level dynamics that require governance frameworks beyond the individual firm. Müller et al. [32] surveyed German manufacturing firms and found that Industry 4.0 adoption follows uneven patterns, with connectivity advancing faster than the security governance needed to manage its risk implications. Tortorella and Fettermann [33] examined Industry 4.0 implementation and lean production, finding that integration complexity increases non-linearly with the number of connected subsystems. Lasi et al. [34] positioned Industry 4.0 as a convergence of embedded systems, smart factories and cyber-physical production, with each layer adding connectivity and, by extension, exposure. The specific risk characteristics of ICS environments have been examined from multiple angles. Green et al. [10] analysed SCADA system vulnerabilities and found that legacy protocols account for a disproportionate share of the attack surface. Samtani et al. [35] applied data analytics to dark web discussions of ICS exploits and found that threat actors actively target known ICS vulnerabilities, particularly those with high CVSS scores. Hassanzadeh et al. [36] proposed a framework for ICS risk assessment that incorporates the network topology, but did not examine how vulnerability patterns cluster at the vendor or system level. These findings suggest that the risk implications of Industry 4.0 extend beyond technical cybersecurity into the structure of industrial service systems. These contributions are useful for locating where exposure originates in connected production. They stop short of measuring how it accumulates across a vendor’s products, which is the structural question this study quantifies.

2.3. Product-Service Systems and System Complexity

The PSS literature conceptualises value delivery as an integrated system of products, services and supporting infrastructure [5,37]. Baines et al. [6] positioned servitisation as a strategic shift from product-centric to service-centric business models, requiring new capabilities in data management, customer engagement and operational governance. Reim et al. [38] reviewed PSS business model tactics and identified system complexity as a persistent challenge for firms pursuing advanced service offerings.
The connection between PSS and risk has been recognised conceptually but not examined empirically through vulnerability data. Lightfoot et al. [39] argued that advanced services require the provider to assume operational risk previously borne by the customer, a transfer that depends on the reliability of the digital infrastructure connecting product and service. Kowalkowski et al. [40] noted that servitisation increases interdependence between the provider and customer, creating bilateral exposure to system failures. Vendrell-Herrero et al. [41] examined how digitalisation and servitisation create supply chain interdependencies, while recent supply chain risk research shows that uncertainty and demand volatility require adaptive risk policies [42], but this stream has not extended the analysis to cybersecurity vulnerabilities. Parida et al. [43] reviewed digital business model innovation and identified security as an underexamined dimension of digital service design. Ardolino et al. [8] proposed a framework for digital service transformation that positions data analytics as an enabling capability but does not address the vulnerability implications of data-intensive service architectures. Suppatvech et al. [44] reviewed IoT-enabled servitisation and found that the technology creates new value propositions but also new failure modes tied to connectivity dependence. Martinez et al. [45] studied the journey to services in manufacturing firms and found that operational complexity increases non-linearly with service sophistication. Gebauer et al. [46] connected digital servitisation to platform-based business models and identified data governance as a critical gap. Tukker [47] originally classified PSS into eight types; the more digitally intensive types (use-oriented and result-oriented) depend most heavily on continuous infrastructure reliability and are therefore most exposed to systemic vulnerability. Rabetino et al. [48] structured the servitisation research landscape and identified risk management as a persistent underexplored dimension. Story et al. [49] examined advanced service capabilities across multiple actors and found that inter-organisational dependencies create shared risk pools that no single actor fully controls. Bustinza et al. [50] argued that the competitive advantage from servitisation depends on the value chain position, implying that vendors at critical infrastructure nodes carry disproportionate systemic importance. Paschou et al. [51] reviewed digital servitisation and identified security as an underresearched theme. Grubic [52] examined remote monitoring technology in servitised contexts and found that continuous connectivity, while essential for service delivery, creates persistent exposure to network-borne threats. Sklyar et al. [53] studied organisational transformation during digital servitisation and found that ecosystem-level coordination is needed not only for service delivery but for shared risk governance. Sjödin et al. [54] introduced agile co-creation processes for digital servitisation and noted that the speed of digital service innovation often outpaces the development of corresponding risk controls.
These studies collectively establish that PSS create complex, interconnected systems in which the reliability of digital infrastructure is a structural determinant of service quality. What is missing is an empirical analysis of how vulnerabilities accumulate and concentrate within this infrastructure and what this means for systemic risk in Industry 4.0 service ecosystems. The PSS literature is strong on why infrastructure reliability matters for service delivery, yet it treats vulnerability as an abstract design consideration rather than an observable pattern. Reading it against disclosure data is what links servitisation theory to measured risk.

2.4. Prior Work on the ICS-CERT Vulnerability Dataset

The ICS-CERT advisory record and closely related industrial vulnerability sources have been used before, though with different aims. Green et al. [10] examined how legacy supervisory control and data-acquisition (SCADA) protocols enlarge the attack surface of connected utilities. Samtani et al. [35] applied analytics to the dark-web discussion of ICS exploits and found that interest concentrates on high-severity flaws. Hassanzadeh et al. [36] documented reporting bias in water-sector incidents. Within industrial control environments, Samtani et al. [55] used text and data mining to identify internet-connected SCADA systems and assess their vulnerabilities; Zolanvari et al. [56] used machine learning to detect network vulnerabilities in industrial Internet of Things (IoT) deployments. These studies are valuable for predicting which individual vulnerabilities matter and for detecting them in operation. They stop at the level of the vulnerability or the network. None aggregates disclosure to the vendor to ask how risk concentrates across the firms whose products carry the infrastructure. That vendor-level reading of the same data is what this paper adds through the System Risk Index.

2.5. Research Gap

Three literatures converge on a shared insight: digital interdependence creates system-level risk properties that component-level analysis cannot capture. The cyber risk literature establishes this theoretically [14,15,21]. The Industry 4.0 literature identifies the infrastructure in which it materialises [2,29,32]. The PSS literature identifies the value systems it endangers [6,40,49]. No empirical study has characterised the structure of vulnerability accumulation across ICS infrastructure as a system-level phenomenon, connected this structure to PSS theory or provided a replicable index for measuring systemic risk in connected industrial environments. Ivanov et al. [57] examined supply chain disruption from a digital twin perspective but did not address cybersecurity vulnerabilities as a source of structural risk. Holmström et al. [58] reviewed digital manufacturing and identified security as a critical gap. Liao et al. [59] reviewed Industry 4.0 technologies and found that risk-assessment methods have not kept pace with the connectivity that they assess. These calls for empirical risk analysis in connected industrial systems remain unanswered. Earlier work approached the problem from the side of the individual flaw. Vulnerabilities are disclosed, scored and patched at that level, so exploit prediction there carries clear operational value. That focus is reasonable, yet it leaves the structural question unasked. When the same components recur across a vendor’s catalogue and across the sites that depend on them, exposure becomes correlated; a correlation of this kind is a property of the system rather than of the flaw [4,11]. Treating cross-component propagation as the object of study follows from this. It is the level at which systemic risk in connected industrial infrastructure forms; characterising it requires empirical evidence on how disclosed vulnerabilities distribute across products and vendors. This paper provides an answer and suggests that the framework can extend to other critical infrastructures such as smart grids and healthcare IoT.

3. Materials and Methods

3.1. Data

We use the ICS-CERT Vulnerability Dataset, a structured record of disclosed vulnerabilities in industrial control systems compiled from the US Cybersecurity and Infrastructure Security Agency’s ICS-CERT advisories and enriched with Common Vulnerabilities and Exposures (CVE) data, Common Platform Enumeration (CPE) product identifiers and Common Vulnerability Scoring System (CVSS) severity assessments. The raw dataset contains 60,378 vulnerability-product records covering 2327 unique CVEs across 416 vendors and 14,577 affected products. The observation period spans 2005 to 2020, with substantive disclosure volume beginning in 2012. Each record includes the following: CVE identifier (unique vulnerability reference), CPE vector (identifying the affected product and version), vendor name, CWE identifier (classifying the vulnerability type according to the Common Weakness Enumeration taxonomy), CVSS base score (overall severity from 0 to 10), CVSS exploitability sub-score (ease of exploitation), CVSS impact sub-score (consequences if exploited), severity category (low, medium, high, critical) and timestamps for creation and update. The one-to-many relationship between CVEs and CPE entries is analytically important. A single CVE, say a buffer overflow in a network stack, may appear in dozens or hundreds of CPE entries because the affected code is embedded in multiple products, firmware versions and hardware platforms from the same vendor (or, in some cases, multiple vendors using shared components). This fan-out structure is precisely what makes ICS vulnerability a system-level phenomenon: a single flaw propagates across the product architecture of its vendor and, through supply chain dependencies, potentially across multiple vendors. In our dataset, the median CVE affects 2 products but the 75th percentile reaches 7 and the maximum is 4890, indicating extreme right-skew in the propagation scope. The dataset is well suited to system-level risk analysis for three reasons. First, the one-to-many CVE–CPE relationship directly captures cross-system exposure. Second, the vendor and product identifiers enable concentration analysis at the ecosystem level. Third, the CVSS scoring system provides standardised measures of severity and exploitability that permit aggregation across heterogeneous systems. Table 1 lists the fields used in the analysis and the level at which each is recorded.
The relevance to PSS analysis requires explicit justification. ICS vendors do not merely sell products. They sell operational capability: a programmable logic controller (PLC) runs a production line; a supervisory control and data acquisition (SCADA) system manages a utility network; a human–machine interface (HMI) panel enables operator control of a chemical process. In each case, the customer depends on the continuous, reliable functioning of the ICS component for service delivery. When that component contains a vulnerability, the service that it underpins is at risk. The more products a vulnerability affects, the more service chains it endangers. This is why vulnerability data from ICS environments are not merely cybersecurity data. They are PSS reliability data, viewed through the lens of infrastructure weakness rather than operational performance. Suppatvech et al. [44] argued that the internet of things (IoT) enables new service models; our data reveal the structural risk that those models inherit from the infrastructure they depend on. The dataset also provides a natural experiment on the risk consequences of digital transformation. The 2012–2019 observation period captures the structural formation phase of Industry 4.0 adoption in manufacturing and critical infrastructure [29]. During this period, ICS connectivity expanded substantially, driven by IoT deployment, cloud integration and platform-based service delivery [2]. The vulnerability data trace the security consequences of this expansion in real time.

3.2. Preprocessing

We restrict the temporal analysis to 2012–2019, when the disclosure volume is sufficient for meaningful analysis (2005–2011 contributes only 9 unique CVEs; 2020 is incomplete). For CVE-level analysis, we deduplicate to one record per CVE, retaining CVSS v3 scores where available (91 per cent of records). For vendor-year analysis, we aggregate using CVSS v3 records only (n = 54,400), producing 444 vendor-year observations. We compute derived variables at both the CVE and vendor-year levels.

3.3. Variable Construction

The System Risk Index merits elaboration. It is designed to capture systemic rather than event-level risk. A vendor with one critical vulnerability scores lower than a vendor with ten medium vulnerabilities of moderate exploitability, because the latter represents a broader, more persistent surface of system-level exposure. The multiplicative structure means that the SRI increases with volume, severity and exploitability simultaneously. Division by 10 normalises the index to align with the CVSS scale, ensuring comparability while preserving proportional relationships. The index is bounded below by zero and has no theoretical upper bound, reflecting the open-ended nature of systemic risk accumulation. The design rationale draws on three considerations from the risk literature. First, Eling and Schnell [14] demonstrated that cyber risk exhibits correlation properties that distinguish it from idiosyncratic operational risk; the SRI’s multiplicative structure captures this by producing disproportionately high values when multiple risk dimensions are simultaneously elevated. Second, Biener et al. [15] found that cyber risk loss distributions are fat-tailed; SRI’s unbounded upper range accommodates this property rather than artificially truncating it. Third, the vendor-year aggregation level reflects the argument from Kohtamäki et al. [31] that digital servitisation creates ecosystem-level dynamics; the vendor, not the individual product, is the unit at which systemic risk concentrates because a vendor’s security practices, architectural decisions and patch governance affect all products simultaneously. An alternative construction using additive rather than multiplicative aggregation was considered and rejected. An additive SRI (volume + severity + exploitability) would allow high scores from a single elevated dimension, potentially identifying a vendor with many trivial vulnerabilities as systemically risky. The multiplicative form requires elevation across all three dimensions simultaneously, which better captures the intuition that systemic risk arises from the conjunction of volume, severity and ease of exploitation. Table 2 presents the variables used in the analysis, their analytical levels and their definitions.
We also construct two supplementary variables. Risk Density is the number of unique CVEs per vendor per year, capturing the temporal intensity of vulnerability disclosure. The Concentration Index is a Herfindahl–Hirschman Index (HHI) computed across vendors within each year, measuring how concentrated or dispersed the vulnerability landscape is. An HHI approaching 1.0 indicates that a single vendor dominates disclosure; lower values indicate a more distributed risk landscape.

3.4. Analytical Strategy

The analysis works at three levels, each drawn from the same 60,378 records. At the vulnerability level we deduplicate to one row per CVE and keep those carrying a Common Vulnerability Scoring System version 3 (CVSS v3) score, which gives 1678 vulnerabilities for the severity models. At the annual level, we count unique CVEs per year over 2012 to 2019, which gives eight observations for the trend model. At the vendor-year level, we aggregate the CVSS v3 records (n = 54,400) into 444 vendor-year units for the systemic-risk models. The estimation uses Python 3.11 with statsmodels 0.14 and pandas 2.1. The ordinary least squares models carry HC3 heteroscedasticity-robust standard errors; the robustness check uses quantile regression at the median.
Model 1 (decomposition specification): Severity Determinants (CVE level). OLS regression of the CVSS base score on exploitability score, impact score, ln(affected products) and ln(affected vendors), with HC3 robust standard errors. This model tests whether cross-system exposure contributes to vulnerability severity beyond what the technical scoring components explain. Because CVSS is constructed from exploitability and impact, this specification validates structure rather than implying causality.
Model 2: Temporal Analysis (Year level). Trend regression of annual CVE count based on the year, restricted to 2012–2019. This quantifies the growth trajectory of ICS vulnerability disclosure during the period of Industry 4.0 adoption.
Model 3: System Risk Determinants (Vendor-Year level). OLS regression of ln(SRI) on mean severity, mean exploitability, ln(product breadth) and ln(CWE diversity), with HC3 robust standard errors. This model identifies what drives systemic risk accumulation at the vendor level.
Model 4: Robustness. Quantile regression at the median for Model 1’s specification, testing whether severity determinants hold at the centre of the distribution where outlier influence is minimal.
Variance inflation factors for Model 1 predictors range from 1.02 to 1.10, confirming no multicollinearity concern.

4. Results

4.1. Descriptive Landscape

The descriptive statistics reveal several patterns worth noting before the formal models. The mean CVSS base score of 7.76 places the typical ICS vulnerability firmly in the “high severity” category. Sixty-seven per cent of CVEs are rated high and 25 per cent are rated critical. The median affected-products count of 2 obscures extreme right-skew: the 75th percentile reaches, and the maximum is 4890, indicating that some vulnerabilities propagate across thousands of products. The SRI distribution is heavily right-skewed (mean 10.28, median 3.82), reflecting the concentration of systemic risk in a small number of vendor-years. Siemens in 2019 recorded the highest SRI (346.04), driven by 136 disclosed vulnerabilities with a mean severity of 7.41. The top five vendors by cumulative SRI (Siemens, Schneider Electric, Advantech, Moxa, Rockwell Automation) account for the dominant share of systemic ICS risk. Table 3 presents the descriptive statistics for the CVE-level and vendor-year samples.

4.2. Severity Determinants (Model 1)

The severity model confirms that the CVSS base score is almost entirely determined by its two sub-components: exploitability (β = 0.95) and impact (β = 0.98). Cross-system exposure variables (affected products and vendors) do not independently predict severity. This is consistent with the CVSS construction; the CVSS scoring system is designed to be context-independent. The finding is nonetheless meaningful for our argument: severity is a property of the individual vulnerability, but risk is a property of the system in which it sits. Two vulnerabilities of identical severity create very different risk profiles depending on whether they affect one product or five thousand. Table 4 reports the regression results for the vulnerability-severity model and the system-risk model.
The SRI model tells a different and more important story. CWE diversity, the number of distinct vulnerability types a vendor discloses in a given year, is by far the strongest predictor (β = 1.25, p < 0.001). A vendor whose vulnerabilities span many distinct classes (buffer overflows, authentication failures, injection flaws, access control weaknesses) accumulates systemic risk much faster than one whose flaws are concentrated in a single category. This reflects the structural system behaviour where vulnerability diversity signals architectural fragility: diverse vulnerability types indicate exposure across multiple layers of the software architecture, reducing the effectiveness of targeted remediation. Mean exploitability contributes positively (β = 0.29, p < 0.001): vendors whose vulnerabilities are easier to exploit carry higher systemic risk. Mean severity also contributes (β = 0.09, p < 0.001) but more modestly. Product breadth has a small positive effect (β = 0.06, p = 0.001): vendors whose vulnerabilities affect more distinct products carry higher system risk, consistent with the cross-system propagation argument.

4.3. Temporal Trajectory (Model 2)

Annual ICS vulnerability disclosure grew from 115 unique CVEs in 2012 to 503 in 2019, a 337 per cent increase over seven years. The trend coefficient is 2.25 additional CVEs per year, though the relationship is not strictly linear (R2 = 0.18, p = 0.25 with only eight observations). The growth is concentrated in the 2016–2019 period, coinciding with accelerated Industry 4.0 adoption: the annual count roughly doubled from 191 (2016) to 419 (2017) and remained above 500 through 2018–2019. The temporal pattern is worth examining more closely. The 2012–2015 period shows moderate growth (115 to 228 CVEs), consistent with the early adoption phase of Industry 4.0 technologies when connectivity was expanding but the installed base of connected ICS remained relatively small. The step-change in 2017 (419 CVEs, more than double the 2016 figure) coincides with broader commercial deployment of IoT-enabled industrial platforms and the maturation of vulnerability research programmes focused on ICS. This suggests a compound effect: more connected systems generating more attack surface, and more researchers examining that surface. Mean severity shows a modest upward drift (+0.10 points per year), suggesting that newly disclosed vulnerabilities are not becoming less severe even as the disclosure volume increases. This finding runs counter to the optimistic interpretation that growing awareness and investment in ICS security should reduce the severity of remaining vulnerabilities over time. Samtani et al. [35] documented active interest in ICS exploits on underground forums; our temporal data are consistent with the view that the most consequential vulnerabilities are being discovered alongside, not instead of, less severe ones. The number of affected vendors per year grew from 31 (2012) to 160 (2017), indicating broadening exposure across the ICS vendor ecosystem. The expansion of the vendor base is itself a system-level phenomenon: as Industry 4.0 draws more specialised manufacturers into connected ecosystems [32], the population of vendors with disclosable vulnerabilities grows. By 2019, the vendor count had stabilised at 94, suggesting either a saturation of the connected vendor population or a shift in disclosure patterns.

4.4. Concentration

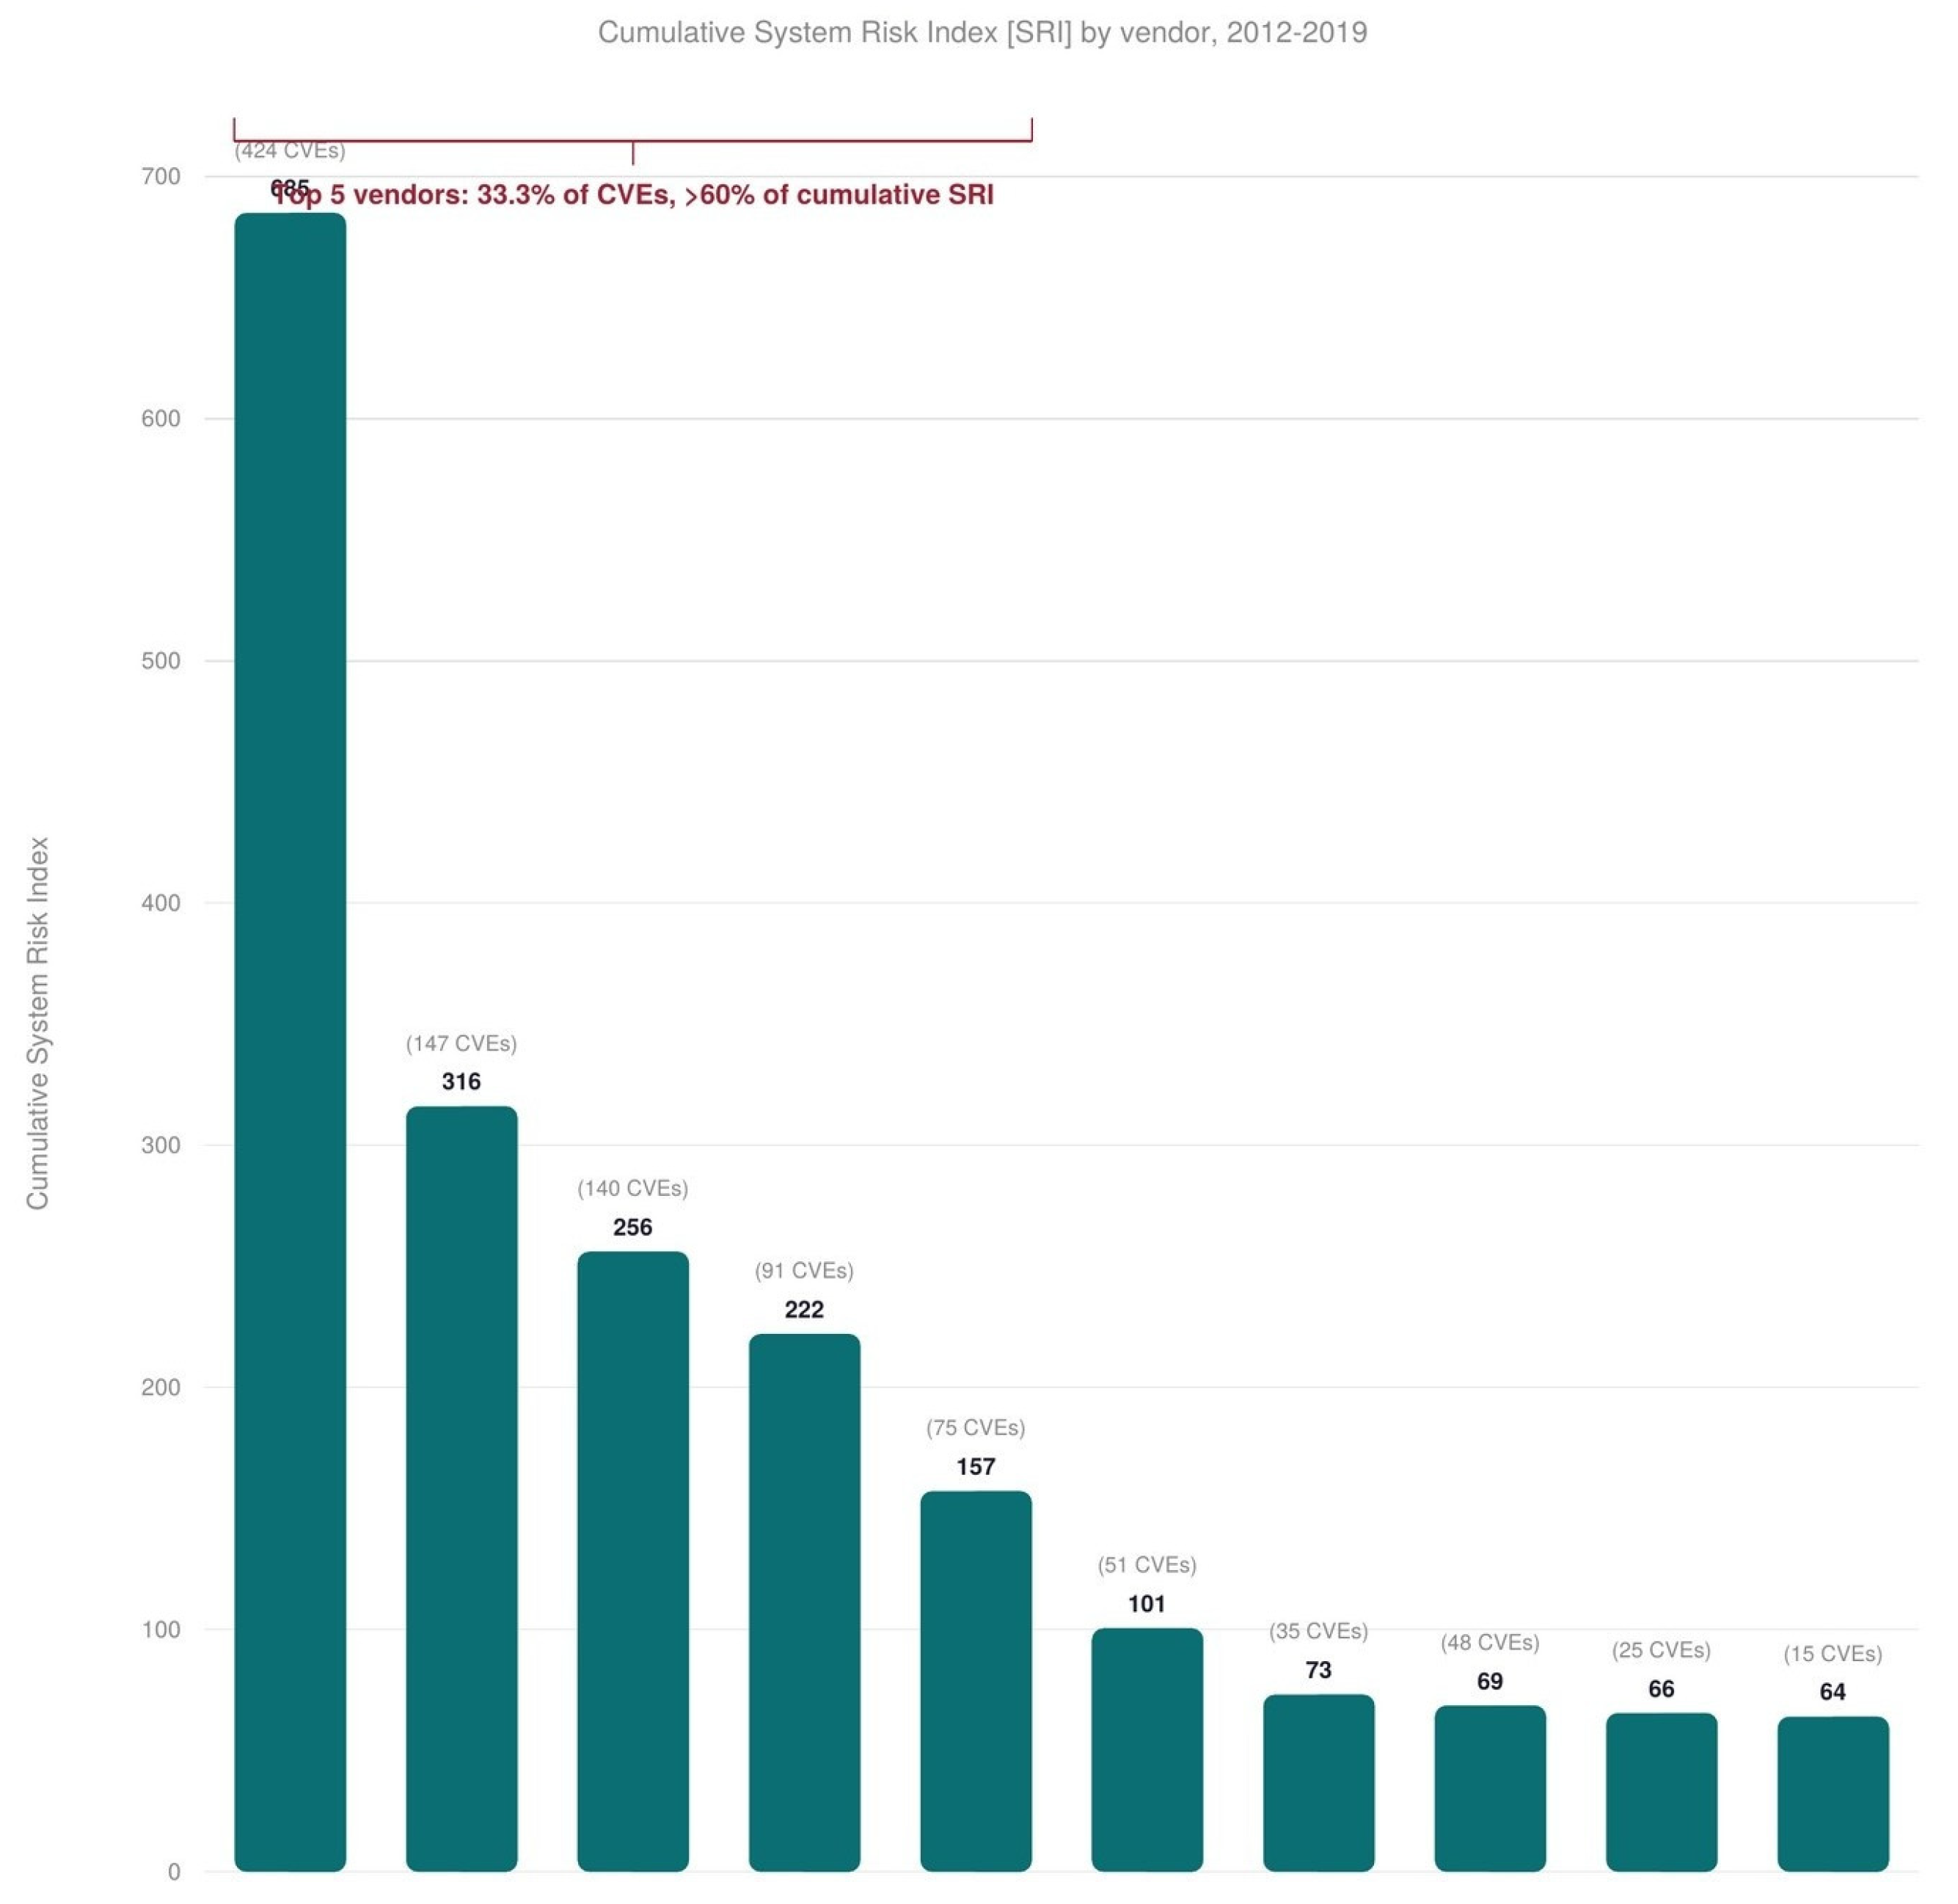
Vendor concentration analysis reveals that the top five vendors (Siemens, Schneider Electric, Advantech, Moxa, Rockwell Automation) account for 33.3 per cent of all disclosed CVEs. The top 10 vendors account for 41.5 percent. Based on the SRI measure, concentration is more pronounced: the top five vendors account for over 60 per cent of cumulative systemic risk.
Figure 2 illustrates the concentration of systemic risk across ICS vendors during the 2012 to 2019 study period.
The HHI for vendor concentration varies substantially across years. In the early period (2014), the HHI was very high (above 0.16), reflecting the dominance of Siemens in early ICS disclosures. By 2017, the HHI had fallen to 0.04, indicating a more dispersed vulnerability landscape as the number of affected vendors grew from 31 to 160. The HHI then rose again in 2019 (0.09) and 2020 (0.24), suggesting a reconcentration of disclosure activity. This U-shaped pattern has a structural interpretation: early ICS connectivity was dominated by a few major vendors; mid-period growth brought many smaller vendors into the connected ecosystem; recent maturation has seen vulnerability research refocus on the largest, most widely deployed platforms where systemic impact is greatest. The concentration finding has a direct PSS implication. These five vendors supply the industrial control infrastructure that underpins manufacturing, energy and transport service systems worldwide. Their vulnerability profiles are not independent risks to be managed in isolation. They are structural features of the infrastructure on which product-service delivery depends. When a service provider offers outcome-based contracts [7], the reliability of the underlying ICS infrastructure is a binding constraint on service quality. The fact that this infrastructure is concentrated in five vendors, each carrying substantial and growing SRI, creates a systemic fragility that neither individual vendor governance nor operator-level compliance can fully address. The distinction between the CVE share and SRI share is analytically important. Siemens accounts for 18 per cent of CVEs but a larger share of cumulative SRI, because its vulnerabilities span many distinct CWE classes and affect a broad product portfolio. This means that conventional metrics based on vulnerability counts understate Siemens’ systemic importance relative to metrics that incorporate severity, exploitability and architectural diversity. For risk-governance purposes, SRI-based assessment provides a more accurate picture of where systemic exposure concentrates.

4.5. Robustness (Model 4)

The quantile regression at the median confirms the OLS findings. Exploitability and impact sub-scores remain the dominant predictors, and cross-system exposure variables remain non-significant for individual severity. The consistency across OLS and quantile estimation confirms that the severity results are not driven by outliers. Table 5 reports the median quantile regression results used to assess the robustness of the vulnerability-severity model.

5. Discussion

5.1. Risk as System Structure

The central argument of this paper is that vulnerability patterns in ICS infrastructure constitute evidence of systemic risk: a property of the connected system rather than a collection of independent events. Three findings support this argument.
First, vulnerability severity is determined by technical characteristics of the individual flaw (Model 1), but systemic risk is determined by the structural context in which flaws accumulate (Model 3). The contrast between these two models is the empirical core of the paper. Severity is a property of the event. Risk is a property of the system. CWE diversity, the number of distinct vulnerability types, is the strongest predictor of vendor-level systemic risk. This means that vendors with architecturally diverse exposure, flaws distributed across authentication, memory management, input validation and access control, present a qualitatively different risk profile than vendors with a single recurrent weakness. The former indicates systemic architectural fragility. The latter indicates a specific and potentially addressable design problem. Second, the temporal trajectory shows that ICS vulnerability disclosure has grown by 337 per cent during the period of accelerated Industry 4.0 adoption. This is not merely an increase in reporting. The number of affected vendors grew fivefold (31 to 160), indicating that the expanding connectivity of Industry 4.0 is broadening the vulnerability surface across the industrial ecosystem. Hemsley and Fisher [27] documented the growth of ICS-targeted attacks; our data show the corresponding growth in the structural conditions that make such attacks feasible. Third, systemic risk is concentrated. The top five ICS vendors account for a third of all disclosed vulnerabilities and over 60 per cent of cumulative SRI. This concentration means that the risk profile of the Industry 4.0 infrastructure is shaped by the security practices of a small number of firms. A systemic failure in one of these vendors, or a coordinated exploitation of their shared vulnerability patterns, would propagate across thousands of industrial deployments globally. This is the defining characteristic of systemic risk: it cannot be managed by addressing individual events.
The concentration finding also has a temporal dimension that deserves attention. In the early years of our dataset (2012–2014), Siemens dominated ICS disclosure, accounting for a disproportionate share of both CVEs and SRI. By 2017–2019, the landscape had broadened: Schneider Electric, Advantech, Moxa and Rockwell Automation each contributed substantial disclosure volumes. This broadening might appear to reduce the concentration risk, but the SRI data tell a different story. Siemens’ cumulative SRI (685) remains more than double that of the next highest vendor (Schneider Electric, 316), and its 2019 peak of 136 disclosed vulnerabilities in a single year exceeds the entire career total of most smaller ICS vendors. The broadening of the vendor landscape has added new sources of risk without reducing the dominance of the largest players. This pattern mirrors what the financial systemic risk literature calls “too big to fail” dynamics [60]. A small number of institutions whose failure would propagate across the entire system command disproportionate importance for systemic governance. In the ICS context, the equivalent observation is that five vendors are “too embedded to fail”: their products are so widely deployed in critical infrastructure that a coordinated vulnerability exploitation would constitute an infrastructure-level event, not a vendor-level one. Anderson and Moore [61] argued that the economics of information security create perverse incentives where the party best positioned to reduce risk is not the party bearing the cost; the vendor concentration we document shows where those economics concentrate in ICS infrastructure.

5.2. Cross-Vendor Dependencies and Risk Propagation

The CVE-level data reveal an additional dimension of systemic risk that the vendor-year aggregation does not fully capture. While the median CVE affects only one vendor (median affected vendors = 1), the distribution has a long tail: 15.3 per cent of CVEs affect more than one vendor and the maximum reaches 35 vendors from a single vulnerability. These cross-vendor CVEs typically involve shared components, common libraries or widely adopted protocols. Cross-vendor vulnerabilities are qualitatively different from single-vendor flaws. A buffer overflow in a Siemens-specific firmware affects Siemens deployments. A vulnerability in an OpenSSL library embedded in products from Siemens, Schneider Electric, Moxa, Cisco and twenty other vendors affects deployments across the entire connected ecosystem simultaneously. The risk is not merely aggregated across vendors. It is correlated, because the same flaw exists in the same code running in the same way across thousands of independent deployments. This correlation structure has implications for how we interpret the SRI. The vendor-year aggregation treats each vendor’s SRI as independent, but cross-vendor CVEs introduce correlation between vendors’ risk profiles. A comprehensive system-level risk measure would need to account for this inter-vendor covariance, analogous to portfolio risk modelling in finance where correlated asset returns require covariance-adjusted risk measures rather than simple summation. Biener et al. [15] noted this property in the context of cyber risk insurability; our data provide the infrastructure-level evidence for why such correlation exists. The practical implication is significant. An organisation that diversifies its ICS suppliers across three vendors to reduce concentration risk may achieve less risk reduction than expected if those vendors share underlying components. The apparent diversification is undermined by latent correlation in the vulnerability structure. Identifying and mapping these shared dependencies is a priority for system-level risk governance, one that standard vulnerability databases do not currently support but that emerging supply chain transparency initiatives may eventually enable.

5.3. Implications for Product-Service Systems

The PSS literature recognises that servitisation transfers operational risk from the customer to provider [39] and that digital infrastructure is a structural determinant of service reliability [8]. Our findings add an empirical dimension to these insights.
When a manufacturer delivers an outcome-based service, such as guaranteed uptime for a production line, the service depends on the ICS infrastructure that controls that line [62]. If the ICS vendor’s products carry an SRI of 346 (Siemens, 2019), the service provider inherits a systemic risk exposure that they may not be monitoring. The risk is not that a specific vulnerability will be exploited. The risk is that the vendor’s product architecture has accumulated diverse weaknesses across multiple vulnerability classes, creating an exposure surface that targeted patching cannot fully address.
This creates an information asymmetry that the PSS literature has not adequately examined. The service provider promises an outcome. The customer evaluates that promise based on the provider’s operational track record. Neither party typically assesses the SRI of the underlying ICS vendor, because vulnerability data, while publicly available, are not routinely integrated into service design or supplier governance processes. Grubic [52] noted that remote monitoring technology is essential for advanced services but did not examine how the vulnerabilities in that monitoring technology feed back into service risk. Our data show that the feedback loop is substantial: the infrastructure that enables service delivery is simultaneously the infrastructure that concentrates systemic vulnerability.
This has three practical consequences. First, PSS providers should incorporate vendor-level systemic risk assessments, using SRI or equivalent indices, into their service design and supplier governance processes. Story et al. [49] argued that advanced service capabilities require multi-actor coordination; our contribution is to show that this coordination must extend to shared vulnerability governance, not just shared value creation. Second, the concentration of ICS risk in five vendors creates single-point-of-failure dynamics for entire service ecosystems. The diversification of ICS suppliers, where technically feasible, reduces systemic exposure. Third, the finding that CWE diversity is the strongest predictor of SRI suggests that security audit priorities should focus on the architectural breadth of exposure rather than the severity of individual flaws.
The finding also has implications for how we theorise the boundaries of product-service systems. Tukker [47] defined PSS as bundles of products, services and infrastructure. Our evidence suggests that the infrastructure component carries structural risk properties that the product and service components do not. A product can be redesigned. A service contract can be renegotiated. But the vulnerability profile of the ICS infrastructure on which both depend is a structural property of the vendor’s entire product architecture, accumulated over years and distributed across thousands of deployments. This asymmetry between the malleability of product-service design and the rigidity of infrastructure vulnerability is a dimension that PSS theory has not yet incorporated.

5.4. Digital Transformation Restructures Risk

The key theoretical claim is straightforward. Digital transformation does not just introduce risk. It restructures risk into an interconnected system-level property.
Before Industry 4.0, vulnerability in a Siemens PLC affected the specific installations running that PLC. The risk was local. In an Industry 4.0 environment, that PLC is connected to a SCADA system, which feeds a cloud platform, which delivers data to a service dashboard, which informs a customer-facing outcome guarantee. The vulnerability now sits in a chain of dependencies that spans production, data and service layers. The 337 per cent growth in ICS vulnerability volume and the fivefold increase in affected vendors are empirical traces of this structural transformation.
For the Industry 4.0 literature, this adds a risk dimension to the adoption frameworks of Frank et al. [2] and Zheng et al. [24]. Each layer of Industry 4.0 adoption, smart manufacturing, smart products and smart supply chains adds connectivity. Each addition of connectivity creates new vulnerability surfaces. The risk is not additive. It is multiplicative, because vulnerabilities in shared infrastructure propagate across all dependent layers simultaneously. Müller et al. [32] found that German manufacturers adopt connectivity technologies faster than they develop security governance; our data show the structural consequence of this gap.
The finding connects to broader debates about digital infrastructure governance. Bharadwaj et al. [16] argued that digital strategy should be treated as inseparable from the business strategy. Our evidence suggests that digital risk should be treated the same way: not as a technical concern delegated to IT departments, but as a structural property of the business system that shapes service reliability, competitive position and stakeholder exposure. Verhoef et al. [63] called for multidisciplinary approaches to digital transformation research; our integration of PSS theory with vulnerability analytics responds to this call.
For policymakers, the concentration findings carry specific weight. Critical infrastructure regulations in most jurisdictions focus on operators rather than vendors. Our data show that systemic risk is concentrated at the vendor level: five firms account for a third of all disclosed ICS vulnerabilities. Regulatory frameworks that address only operator-level compliance miss the structural source of systemic exposure. Knowles et al. [9] reached a similar conclusion from the operator perspective; our contribution is to quantify the vendor-level concentration that operator-level regulation cannot address.

5.5. Limitations

The dataset captures disclosed vulnerabilities, which are a subset of all vulnerabilities and subject to disclosure lag. Undisclosed or undetected flaws are not observed. This creates a conservative bias: actual systemic risk is likely higher than our measures suggest. The degree of underreporting is itself unevenly distributed. Large vendors with established vulnerability disclosure programmes (Siemens, Schneider Electric) are more likely to appear in the data than smaller vendors whose products may contain equivalent or worse flaws but lack formal disclosure mechanisms. Hassanzadeh et al. [36] noted a similar reporting bias in their review of water sector cybersecurity incidents. The practical effect is that our concentration findings may overstate the dominance of large vendors relative to a complete vulnerability census that included undisclosed flaws in smaller vendors’ products.
The CVSS scoring system has known limitations. It does not capture context-specific factors such as the criticality of the deployment environment, the availability of compensating controls or the likelihood of exploitation in practice. Allodi and Massacci [13] showed that CVSS scores are weak predictors of actual exploitation. Our SRI inherits this limitation: it measures structural exposure, not realised risk. A high-SRI vendor whose products are deployed behind robust network segmentation and monitoring may present lower actual risk than a low-SRI vendor whose products are deployed on flat, unmonitored networks. The SRI should therefore be interpreted as a measure of structural vulnerability potential rather than a prediction of incidents.
The SRI is a composite index constructed from observable data; alternative weighting schemes could produce different results. The equal weighting of volume, severity and exploitability in the multiplicative formula is a simplifying assumption. It is possible that exploitability should carry greater weight than severity, on the grounds that an easily exploitable medium-severity vulnerability presents more practical risk than a difficult-to-exploit critical one. Future work could explore empirically derived weights using exploitation data from threat intelligence feeds. Samtani et al. [35] provide a methodological precedent for linking vulnerability characteristics to observed exploitation activity.
The temporal analysis covers only eight years with meaningful data (2012–2019), limiting the statistical power of trend regressions. The year-level analysis has only eight observations, insufficient for robust time-series inference. We report the trend descriptively rather than drawing strong causal conclusions. Longer time series, as ICS vulnerability disclosure continues to mature, will permit more rigorous temporal modelling.
The concentration analysis treats vendors as independent, but supply chain relationships between vendors (shared components, OEM arrangements, common libraries) may create additional interdependencies not captured in our data. Urciuoli et al. [3] noted that supply chain cyber risk propagates through supplier relationships; a vulnerability in a widely used third-party library (such as an OpenSSL flaw) would appear in our data as separate CVEs for each vendor whose products embed that library, understating the correlated nature of the underlying exposure. Analysing the shared component layer beneath vendor-level aggregation is a priority for future work.
Future research could extend this analysis in several directions. Linking vulnerability disclosure to patch response times would enable an assessment of vendor-level remediation velocity. Longitudinal panel analysis at the vendor level could track whether SRI trajectories predict subsequent exploitation events. Qualitative case studies of high-SRI vendors could illuminate the organisational and architectural factors that drive systemic vulnerability accumulation. Cross-sector comparisons, examining whether ICS vulnerability patterns differ between energy, manufacturing, transport and healthcare deployments, would test the generalisability of our findings beyond the aggregate ICS landscape.

6. Conclusions

6.1. Findings

ICS vulnerability disclosure grew 337 per cent from 2012 to 2019. Mean severity remains high (7.76 on a 10-point scale). Systemic risk, as measured based on the SRI, is concentrated in five vendors that supply the infrastructure underpinning global Industry 4.0 service systems. CWE diversity, the breadth of distinct vulnerability types, is the strongest predictor of vendor-level systemic risk (β = 1.25, p < 0.001).

6.2. Theoretical Contribution

The paper demonstrates empirically that digital transformation restructures risk from event-level incidence into system-level structure. This complements the PSS literature’s conceptual treatment of operational risk transfer [39,40] with quantitative evidence from the infrastructure layer. It extends the Industry 4.0 literature’s adoption frameworks [1,2] by showing that each layer of digital integration creates structural vulnerability, not just operational capability.
For the systems science community, the contribution lies in demonstrating that vulnerability accumulation exhibits system-level properties, concentration, temporal acceleration and architectural diversity, which are not reducible to the properties of individual flaws. This is precisely the kind of emergent system behaviour that the Systems journal exists to examine. The individual vulnerability is the micro-level event. The SRI captures the meso-level structure. The concentration in five vendors represents the macro-level systemic risk profile. Each level requires its own analytical tools and governance mechanisms.
The finding that CWE diversity is the strongest predictor of SRI (β = 1.25) has a specific theoretical implication. It means that the most systemically important dimension of vendor-level risk is architectural rather than technical. A vendor whose vulnerabilities are distributed across authentication, memory safety, input validation, cryptographic and access control classes has a qualitatively different risk profile than one whose flaws are concentrated in a single category. The former indicates that security weaknesses are distributed across the vendor’s entire design philosophy. The latter suggests a specific and potentially correctable design problem. This architectural interpretation of systemic risk connects our findings to the broader literature on system complexity [33,64] and to the PSS literature’s recognition that system-level behaviour cannot be predicted from component-level properties alone [6].

6.3. Methodological Contribution

The System Risk Index provides a replicable tool for measuring vendor-level systemic risk in any ICS environment with CVSS-scored vulnerability data. Its three components, volume, severity and exploitability, are available in standard vulnerability databases maintained by National Institutes of Standards and Technology (NIST), MITRE and Industrial Control Systems Cyber Emergency Response Team (ICS-CERT). The vendor-year aggregation enables longitudinal tracking and cross-vendor comparison without requiring proprietary data or specialist security instrumentation.
The construct fills a gap in the risk-measurement literature. Existing approaches to ICS risk assessment typically operate at one of two levels: the individual vulnerability (CVSS scoring) or the organisational deployment (risk assessment frameworks such as NIST 800-82). The SRI occupies the intermediate level of the vendor product architecture, capturing systemic properties that neither vulnerability-level nor deployment-level measures address. A CVSS score tells you how bad a single flaw is. A deployment-level assessment tells you how exposed a specific installation is. The SRI tells you how much structural risk a vendor’s entire product line carries, which is the dimension that matters for PSS governance and critical infrastructure policy.
The index can be computed retrospectively from existing data. Any organisation with access to the National Vulnerability Database can calculate SRI for its ICS vendors, track trends over time and benchmark against the vendor-year distributions reported in this paper. This accessibility is deliberate: a systemic risk measure that requires proprietary inputs or specialist expertise will not be adopted at the scale needed to influence industry practice. Samtani et al. [35] noted that ICS vulnerability data are increasingly accessible through structured databases; the SRI converts that raw data into a governance-relevant metric.

6.4. Practical Implications

For managers of Industry 4.0 service systems, assess the SRI of your ICS vendors, not just the severity of individual patches. Tronvoll et al. [65] argued that digital servitisation transforms entire value networks; our evidence shows that the risk dimension of this transformation is measurable and concentrated. A vendor governance framework that incorporates SRI alongside traditional performance metrics would enable more informed supplier selection and contract design. For vendor governance, prioritise CWE diversity reduction over severity-based triage. A vendor with twenty medium-severity vulnerabilities spanning ten distinct classes presents a worse structural risk profile than one with five critical vulnerabilities of the same class. The first case indicates architectural fragility; the second indicates a specific, addressable problem. Eloranta and Turunen [66] noted that platform-based service models create new governance challenges; our SRI provides a concrete metric for one dimension of that governance. For operational teams, the temporal trajectory shows that the volume of ICS vulnerabilities is growing faster than most organisations’ patching capacity. Between 2016 and 2019, the annual disclosure rate exceeded 400 CVEs. Hasselblatt et al. [67] found that IoT capability development in manufacturing lags behind technological deployment; the vulnerability data confirm this gap. Organisations that cannot patch 400+ ICS vulnerabilities per year, which is most organisations, need risk-stratified triage that prioritises SRI-weighted vendor exposure over raw severity scores. For policymakers, the concentration of ICS systemic risk in five vendors represents a critical infrastructure dependency that sector-specific regulation should address. Current regulatory frameworks in most jurisdictions [2] focus on operator compliance rather than vendor-level risk governance. Our data show that systemic risk concentrates at the vendor level, not the operator level. Regulatory instruments that impose security architecture requirements, vulnerability disclosure standards and SRI-equivalent reporting obligations on ICS vendors would address the structural source of risk rather than its downstream manifestation. Verhoef et al. [63] called for governance frameworks adapted to digital transformation; our contribution specifies what such a framework should measure in the ICS domain. Managers should prioritise assessing vulnerability diversity (CWE distribution) alongside severity when evaluating vendors.

6.5. System-Level Implication

The digital infrastructure of Industry 4.0 is both the enabler and the vulnerability surface of modern product–service systems. Managing it requires moving from event-level incident response to system-level risk governance. The data to do this already exist in standard vulnerability databases. What has been missing is the analytical frame. This paper provides one.
The shift from event-level to system-level thinking changes what organisations measure, what they prioritise and whom they hold accountable. Event-level thinking asks how severe is this vulnerability, and how quickly can we patch it? System-level thinking asks how much structural risk does this vendor’s product architecture carry, how concentrated is our dependence on that vendor and how correlated is our exposure with other organisations in our sector? The SRI and the concentration analysis presented here provide concrete tools for answering those questions. The vulnerability data are publicly available. The analytical methods are standard. The remaining challenge is institutional: persuading organisations, regulators and vendors that systemic risk governance is not a luxury but a structural requirement of connected industrial systems.

Author Contributions

Conceptualisation, I.E. (Imo Enang) and I.J.A.; methodology, I.E. (Imo Enang) and I.J.A.; formal analysis, I.E. (Imo Enang); data curation, I.E. (Imo Enang); writing—original draft preparation, I.E. (Imo Enang); writing—review and editing, I.E. (Iniobong Enang) and I.J.A.; visualisation, I.E. (Imo Enang); supervision, I.J.A. All authors have read and agreed to the published version of the manuscript.

Funding

This research received no external funding.

Institutional Review Board Statement

Not applicable.

Informed Consent Statement

Not applicable.

Data Availability Statement

The ICS-CERT Vulnerability Dataset used in this study is publicly available through the US Cybersecurity and Infrastructure Security Agency’s advisory database and the National Vulnerability Database maintained by NIST: https://github.com/UoB-RITICS/cpsiotsec2020-dataset/blob/master/cpsiot2020-cpe_listing.csv (accessed on 5 April 2026).

Conflicts of Interest

The authors declare no conflicts of interest.

References

  1. Xu, L.D.; Xu, E.L.; Li, L. Industry 4.0: State of the art and future trends. Int. J. Prod. Res. 2018, 56, 2941–2962. [Google Scholar] [CrossRef] [Scilit]
  2. Frank, A.G.; Dalenogare, L.S.; Ayala, N.F. Industry 4.0 technologies: Implementation patterns in manufacturing companies. Int. J. Prod. Econ. 2019, 210, 15–26. [Google Scholar] [CrossRef] [Scilit]
  3. Urciuoli, L.; Männistö, T.; Hintsa, J.; Khan, T. Supply chain cyber security—Potential threats. Inf. Secur. 2013, 29, 51–68. [Google Scholar] [CrossRef] [Scilit]
  4. Böhme, R.; Kataria, G. Models and measures for correlation in cyber-insurance. In Proceedings of the Workshop on the Economics of Information Security, Cambridge, UK, 26–28 June 2006. [Google Scholar]
  5. Tukker, A. Product services for a resource-efficient and circular economy—A review. J. Clean. Prod. 2015, 97, 76–91. [Google Scholar] [CrossRef] [Scilit]
  6. Baines, T.; Bigdeli, A.Z.; Bustinza, O.F.; Shi, V.G.; Baldwin, J.; Ridgway, K. Servitization: Revisiting the state-of-the-art and research priorities. Int. J. Oper. Prod. Manag. 2017, 37, 256–278. [Google Scholar] [CrossRef] [Scilit]
  7. Coreynen, W.; Matthyssens, P.; Van Bockhaven, W. Boosting servitization through digitization: Pathways and dynamic resource configurations for manufacturers. Ind. Mark. Manag. 2017, 60, 42–53. [Google Scholar] [CrossRef] [Scilit]
  8. Ardolino, M.; Rapaccini, M.; Saccani, N.; Gaiardelli, P.; Crespi, G.; Ruggeri, C. The role of digital technologies for the service transformation of industrial companies. Int. J. Prod. Res. 2018, 56, 2116–2132. [Google Scholar] [CrossRef] [Scilit]
  9. Knowles, W.; Prince, D.; Hutchison, D.; Disso, J.F.P.; Jones, K. A survey of cyber security management in industrial control systems. Int. J. Crit. Infrastruct. Prot. 2015, 9, 52–80. [Google Scholar] [CrossRef] [Scilit]
  10. Green, B.; Krotofil, M.; Abbasi, A. On the significance of process comprehension for conducting targeted ICS attacks. In Proceedings of the ACM Workshop on Cyber-Physical Systems Security and Privacy, Dallas, TX, USA, 3 November 2017; pp. 5–6. [Google Scholar]
  11. Eling, M.; Wirfs, J. What are the actual costs of cyber risk events? Eur. J. Oper. Res. 2019, 22, 1109–1119. [Google Scholar] [CrossRef] [Scilit]
  12. Cenfetelli, R.T.; Benbasat, I.; Al-Natour, S. Addressing the what and how of online services: Positioning supporting-services functionality and service quality for business-to-consumer success. Inf. Syst. Res. 2008, 19, 161–181. [Google Scholar] [CrossRef] [Scilit]
  13. Allodi, L.; Massacci, F. Security events and vulnerability data for cybersecurity risk estimation. Risk Anal. 2017, 37, 1606–1627. [Google Scholar] [CrossRef] [Scilit] [PubMed]
  14. Eling, M.; Schnell, W. What do we know about cyber risk and cyber risk insurance? J. Risk Financ. 2016, 17, 474–491. [Google Scholar] [CrossRef] [Scilit]
  15. Biener, C.; Eling, M.; Wirfs, J.H. Insurability of cyber risk: An empirical analysis. Geneva Pap. Risk Insur. Issues Pract. 2015, 40, 131–158. [Google Scholar] [CrossRef] [Scilit]
  16. Bharadwaj, A.; El Sawy, O.A.; Pavlou, P.A.; Venkatraman, N. Digital business strategy: Toward a next generation of insights. MIS Q. 2013, 37, 471–482. [Google Scholar] [CrossRef] [Scilit]
  17. Mithas, S.; Rust, R.T. How information technology strategy and investments influence firm performance: Conjecture and empirical evidence. MIS Q. 2016, 40, 223–245. [Google Scholar] [CrossRef] [Scilit]
  18. Banker, R.D.; Hu, N.; Pavlou, P.A.; Luftman, J. CIO reporting structure, strategic positioning, and firm performance. MIS Q. 2011, 35, 487–504. [Google Scholar] [CrossRef] [Scilit]
  19. Tanriverdi, H.; Rai, A.; Venkatraman, N. Research commentary: Reframing the dominant quests of information systems strategy research for complex adaptive business systems. Inf. Syst. Res. 2010, 21, 822–834. [Google Scholar] [CrossRef] [Scilit]
  20. Xue, L.; Ray, G.; Gu, B. Environmental uncertainty and IT infrastructure governance: A curvilinear relationship. Inf. Syst. Res. 2011, 22, 389–399. [Google Scholar] [CrossRef] [Scilit]
  21. Kwon, J.; Johnson, M.E. Proactive versus reactive security investments in the healthcare sector. MIS Q. 2014, 38, 451–471. [Google Scholar] [CrossRef] [Scilit]
  22. D’Arcy, J.; Herath, T.; Shoss, M.K. Understanding employee responses to stressful information security requirements: A coping perspective. J. Manag. Inf. Syst. 2014, 31, 285–318. [Google Scholar] [CrossRef] [Scilit]
  23. Kagermann, H.; Wahlster, W.; Helbig, J. Recommendations for Implementing the Strategic Initiative Industrie 4.0; National Academy of Science and Engineering: Frankfurt, Germany, 2013. [Google Scholar]
  24. Zheng, T.; Ardolino, M.; Bacchetti, A.; Perona, M. The applications of Industry 4.0 technologies in manufacturing context: A systematic literature review. Int. J. Prod. Res. 2021, 59, 1922–1954. [Google Scholar] [CrossRef] [Scilit]
  25. Amin, S.; Litrico, X.; Sastry, S.S.; Bayen, A.M. Cyber security of water SCADA systems—Part I: Analysis and experimentation of stealthy deception attacks. IEEE Trans. Control Syst. Technol. 2013, 21, 1963–1970. [Google Scholar] [CrossRef] [Scilit]
  26. Humayed, A.; Lin, J.; Li, F.; Luo, B. Cyber-physical systems security: A survey. IEEE Internet Things J. 2017, 4, 1802–1831. [Google Scholar] [CrossRef] [Scilit]
  27. Hemsley, K.E.; Fisher, R.E. History of Industrial Control System Cyber Incidents; INLCON-18-44411; Idaho National Laboratory: Idaho Falls, ID, USA, 2018.
  28. Stouffer, K.; Lightman, S.; Pillitteri, V.; Abrams, M.; Hahn, A. Guide to Industrial Control Systems Security; NIST SP 800-82 Rev. 2; National Institute of Standards and Technology: Gaithersburg, MD, USA, 2015.
  29. Dalenogare, L.S.; Benitez, G.B.; Ayala, N.F.; Frank, A.G. The expected contribution of Industry 4.0 technologies for industrial performance. Int. J. Prod. Econ. 2018, 204, 383–394. [Google Scholar] [CrossRef] [Scilit]
  30. Sjödin, D.; Parida, V.; Leksell, M.; Petrovic, A. Smart factory implementation and process innovation. Res.-Technol. Manag. 2018, 61, 22–31. [Google Scholar] [CrossRef] [Scilit]
  31. Kohtamäki, M.; Parida, V.; Oghazi, P.; Gebauer, H.; Baines, T. Digital servitization business models in ecosystems: A theory of the firm. J. Bus. Res. 2019, 104, 380–392. [Google Scholar] [CrossRef] [Scilit]
  32. Müller, J.M.; Kiel, D.; Voigt, K.I. What drives the implementation of Industry 4.0? The Role of Opportunities and Challenges in the Context of Sustainability. Sustainability 2018, 10, 247. [Google Scholar] [CrossRef] [Scilit]
  33. Tortorella, G.L.; Fettermann, D. Implementation of Industry 4.0 and lean production in Brazilian manufacturing companies. Int. J. Prod. Res. 2018, 56, 2975–2987. [Google Scholar] [CrossRef] [Scilit]
  34. Lasi, H.; Fettke, P.; Kemper, H.G.; Feld, T.; Hoffmann, M. Industry 4.0. Bus. Inf. Syst. Eng. 2014, 6, 239–242. [Google Scholar] [CrossRef] [Scilit]
  35. Samtani, S.; Yu, S.; Zhu, H.; Chen, H. Identifying SCADA vulnerabilities using passive and active vulnerability assessment techniques. In Proceedings of the IEEE Intelligence and Security Informatics, Miami, FL, USA, 8–10 November 2018; pp. 25–30. [Google Scholar]
  36. Hassanzadeh, A.; Rasekh, A.; Galelli, S.; Aber, M.; Ostfeld, A.; Banks, M.K.; Taormina, R. A review of cybersecurity incidents in the water sector. J. Environ. Eng. 2020, 146, 03120003. [Google Scholar] [CrossRef] [Scilit]
  37. Mont, O. Clarifying the concept of product-service system. J. Clean. Prod. 2002, 10, 237–245. [Google Scholar] [CrossRef] [Scilit]
  38. Reim, W.; Parida, V.; Örtqvist, D. Product-service systems business models and tactics: A systematic literature review. J. Clean. Prod. 2015, 97, 61–75. [Google Scholar] [CrossRef] [Scilit]
  39. Lightfoot, H.; Baines, T.; Smart, P. The servitization of manufacturing: A systematic literature review of interdependent trends. Int. J. Oper. Prod. Manag. 2013, 33, 1408–1434. [Google Scholar] [CrossRef] [Scilit]
  40. Kowalkowski, C.; Gebauer, H.; Kamp, B.; Parry, G. Servitization and deservitization: Overview, concepts, and definitions. Ind. Mark. Manag. 2017, 60, 4–10. [Google Scholar] [CrossRef] [Scilit]
  41. Vendrell-Herrero, F.; Bustinza, O.F.; Parry, G.; Georgantzis, N. Servitization, digitization and supply chain interdependency. Ind. Mark. Manag. 2017, 60, 69–81. [Google Scholar] [CrossRef] [Scilit]
  42. Xu, L. An assessment of randomized inventory policy in supply chains under multimodal demand distribution. J. Model. Manag. 2026, 21, 1352–1376. [Google Scholar] [CrossRef] [Scilit]
  43. Parida, V.; Sjödin, D.R.; Reim, W. Reviewing literature on digitalization, business model innovation, and sustainable industry: Past achievements and future promises. Sustainability 2019, 11, 391. [Google Scholar] [CrossRef] [Scilit]
  44. Suppatvech, C.; Godsell, J.; Day, S. The roles of internet of things technology in enabling servitized business models: A systematic literature review. Ind. Mark. Manag. 2019, 82, 70–86. [Google Scholar] [CrossRef] [Scilit]
  45. Martinez, V.; Neely, A.; Velu, C.; Ber, S.; Bisessar, D. Exploring the journey to services. Int. J. Prod. Econ. 2017, 192, 66–80. [Google Scholar] [CrossRef] [Scilit]
  46. Gebauer, H.; Paiola, M.; Saccani, N.; Rapaccini, M. Digital servitization: Crossing the perspectives of digitization and servitization. Ind. Mark. Manag. 2021, 93, 382–388. [Google Scholar] [CrossRef] [Scilit]
  47. Tukker, A. Eight types of product-service system: Eight ways to sustainability? Experiences from SusProNet. Bus. Strategy Environ. 2004, 13, 246–260. [Google Scholar] [CrossRef] [Scilit]
  48. Rabetino, R.; Harmsen, W.; Kohtamäki, M.; Sihvonen, J. Structuring servitization-related research. Int. J. Oper. Prod. Manag. 2018, 38, 350–371. [Google Scholar] [CrossRef] [Scilit]
  49. Story, V.M.; Raddats, C.; Burton, J.; Zolkiewski, J.; Baines, T. Capabilities for advanced services: A multi-actor perspective. Ind. Mark. Manag. 2017, 60, 54–68. [Google Scholar] [CrossRef] [Scilit]
  50. Bustinza, O.F.; Bigdeli, A.Z.; Baines, T.; Elliot, C. Servitization and competitive advantage: The importance of organizational structure and value chain position. Res.-Technol. Manag. 2015, 58, 53–60. [Google Scholar] [CrossRef] [Scilit]
  51. Paschou, T.; Rapaccini, M.; Adrodegari, F.; Saccani, N. Digital servitization in manufacturing: A systematic literature review and research agenda. Ind. Mark. Manag. 2020, 89, 278–292. [Google Scholar] [CrossRef] [Scilit]
  52. Grubic, T. Remote monitoring technology and servitization: Exploring the relationship. Comput. Ind. 2018, 100, 148–158. [Google Scholar] [CrossRef] [Scilit]
  53. Sklyar, A.; Kowalkowski, C.; Tronvoll, B.; Sörhammar, D. Organizing for digital servitization: A service ecosystem perspective. J. Bus. Res. 2019, 104, 450–460. [Google Scholar] [CrossRef] [Scilit]
  54. Sjödin, D.; Parida, V.; Kohtamäki, M.; Wincent, J. An agile co-creation process for digital servitization: A micro-service innovation approach. J. Bus. Res. 2020, 112, 478–491. [Google Scholar] [CrossRef] [Scilit]
  55. Samtani, S.; Yu, S.; Zhu, H.; Patton, M.; Matherly, J.; Chen, H. Identifying SCADA systems and their vulnerabilities on the Internet of Things: A text-mining approach. IEEE Intell. Syst. 2018, 33, 63–73. [Google Scholar] [CrossRef] [Scilit]
  56. Zolanvari, M.; Teixeira, M.A.; Gupta, L.; Khan, K.M.; Jain, R. Machine learning-based network vulnerability analysis of industrial internet of things. IEEE Internet Things J. 2019, 6, 6822–6834. [Google Scholar] [CrossRef] [Scilit]
  57. Ivanov, D.; Dolgui, A.; Sokolov, B. The impact of digital technology and Industry 4.0 on the ripple effect and supply chain risk analytics. Int. J. Prod. Res. 2019, 57, 829–846. [Google Scholar] [CrossRef] [Scilit]
  58. Holmström, J.; Holweg, M.; Lawson, B.; Pil, F.K.; Wagner, S.M. The digitalization of operations and supply chain management: Theoretical and methodological implications. J. Oper. Manag. 2019, 65, 28–34. [Google Scholar] [CrossRef] [Scilit]
  59. Liao, Y.; Deschamps, F.; Loures, E.F.R.; Ramos, L.F.P. Past, present and future of Industry 4.0: A systematic literature review and research agenda proposal. Int. J. Prod. Res. 2017, 55, 3609–3629. [Google Scholar] [CrossRef] [Scilit]
  60. Acharya, V.V.; Pedersen, L.H.; Philippon, T.; Richardson, M. Measuring systemic risk. Rev. Financ. Stud. 2017, 30, 2–47. [Google Scholar] [CrossRef] [Scilit]
  61. Anderson, R.; Moore, T. The economics of information security. Science 2006, 314, 610–613. [Google Scholar] [CrossRef] [Scilit] [PubMed]
  62. Ng, I.C.L.; Ding, D.X.; Yip, N. Outcome-based contracts as a new business model: The role of partnership and value-driven relational assets. Ind. Mark. Manag. 2013, 42, 730–743. [Google Scholar] [CrossRef] [Scilit]
  63. Verhoef, P.C.; Broekhuizen, T.; Bart, Y.; Bhattacharya, A.; Dong, J.Q.; Fabian, N.; Haenlein, M. Digital transformation: A multidisciplinary reflection and research agenda. J. Bus. Res. 2021, 122, 889–901. [Google Scholar] [CrossRef] [Scilit]
  64. Perrow, C. Normal Accidents: Living with High-Risk Technologies, Updated ed.; Princeton University Press: Princeton, NJ, USA, 2011. [Google Scholar]
  65. Tronvoll, B.; Sklyar, A.; Sörhammar, D.; Kowalkowski, C. Transformational shifts through digital servitization. Ind. Mark. Manag. 2020, 89, 293–305. [Google Scholar] [CrossRef] [Scilit]
  66. Eloranta, V.; Turunen, T. Platforms in service-driven manufacturing: Leveraging complexity by connecting, sharing, and integrating. Ind. Mark. Manag. 2016, 55, 178–186. [Google Scholar] [CrossRef] [Scilit]
  67. Hasselblatt, M.; Huikkola, T.; Kohtamäki, M.; Nickell, D. Modeling manufacturer’s capabilities for the Internet of Things. J. Bus. Ind. Mark. 2018, 33, 822–836. [Google Scholar] [CrossRef] [Scilit]
Figure 1. Conceptual model: digital infrastructure, vulnerability accumulation and systemic risk. Arrows show the direction of influence, from shared digital infrastructure through accumulating vulnerabilities to concentrated systemic risk.
Systems 14 00837 g001
Figure 2. Systemic risk concentration across ICS vendors (2012–2019).
Systems 14 00837 g002
Table 1. Data fields in the ICS-CERT vulnerability dataset.
FieldLevelDescription
CVE identifierVulnerabilityUnique Common Vulnerabilities and Exposures (CVE) reference for each disclosed flaw.
CPE vectorProductCommon Platform Enumeration (CPE) string identifying the affected product configuration.
VendorProductOrganisation that supplies the affected product.
CWE categoryVulnerabilityCommon Weakness Enumeration (CWE) class describing the type of flaw.
CVSS base scoreVulnerabilityCommon Vulnerability Scoring System version 3 (CVSS v3) base severity on a 0 to 10 scale.
CVSS exploitability sub-scoreVulnerabilityComponent of the score reflecting how readily the flaw can be exploited.
CVSS impact sub-scoreVulnerabilityComponent of the score reflecting the consequence of successful exploitation.
Severity categoryVulnerabilityOrdinal band (low, medium, high, critical) derived from the base score.
Affected productsVulnerabilityNumber of distinct products linked to the vulnerability.
Affected vendorsVulnerabilityNumber of distinct vendors linked to the vulnerability.
Publication yearRecordYear the advisory was published, used for the temporal analysis over 2012 to 2019.
Table 2. Variable definitions.
VariableLevelDefinition
CVSS Base ScoreCVEOverall severity rating (0–10)
combining exploitability and impact
Exploitability ScoreCVESub-score measuring ease of
exploitation (0–3.9 for CVSS v3)
Impact ScoreCVESub-score measuring consequences if
exploited (0–6.0)
Affected ProductsCVECount of unique CPE entries per CVE;
captures cross-system exposure
Affected VendorsCVECount of unique vendors affected per
CVE; captures supply chain breadth
Vulnerability CountVendor-YearNumber of unique CVEs disclosed for
a vendor in a given year
Mean SeverityVendor-YearAverage CVSS base score across a
vendor’s annual disclosures
Mean ExploitabilityVendor-YearAverage exploitability sub-score across annual disclosures
Product BreadthVendor-YearCount of unique products affected
across annual disclosures
CWE DiversityVendor-YearCount of unique vulnerability types
(CWE classes) disclosed annually
System Risk IndexVendor-Year(Vuln Count × Mean Severity × Mean
Exploitability)/10
Table 3. Descriptive statistics.
Panel A: CVE Level (n = 1678 with CVSS v3 scores)
VariableMeanSDMinQ1MedianQ3Max
CVSS Base
Score
7.761.592.506.637.808.8010.00
Exploitability
Score
3.000.990.302.202.803.903.90
Impact Score4.661.431.403.605.505.906.00
Affected
Products
23.2171.811274890
Affected
Vendors
1.151.12111135
Panel B: Vendor-Year Level (n = 444)
VariableMeanSDMinQ1MedianQ3Max
Vulnerability
Count
4.368.981124136
Mean Severity7.601.343.106.637.558.6010.00
Mean
Exploitability
2.900.880.452.202.913.903.90
Product
Breadth
30.9261.4112105371
CWE
Diversity
3.214.51112349
System Risk
Index
10.2822.820.241.823.829.58346.04
Table 4. Regression results.
Panel A: Model 1, OLS: CVSS Base Score (CVE level, n = 1678)
βRobust SEzp
Constant0.3750.02614.56<0.001
Exploitability Score0.9470.004234.88<0.001
Impact Score0.9780.003326.09<0.001
ln(Affected Products)−0.0030.003−0.810.418
ln(Affected Vendors)−0.0200.018−1.130.260
R2 = 0.989Adj. R2 = 0.989F = 42,180
Panel B: Model 3, OLS: ln(System Risk Index) (Vendor-Year level, n = 444)
βRobust SEzp
Constant−1.2750.065−19.66<0.001
Mean Severity0.0900.00910.01<0.001
Mean Exploitability0.2880.01816.12<0.001
ln(Product Breadth)0.0560.0173.200.001
ln(CWE Diversity)1.2500.02550.39<0.001
R2 = 0.911Adj. R2 = 0.911F = 1856
Table 5. Quantile regression (median): CVSS base score (n = 1678).
βSETp
Constant0.1860.00374.14<0.001
Exploitability Score0.9520.0002317.7<0.001
Impact Score1.0000.0003500.1<0.001
ln(Affected Products)0.0000.0000.001.000
ln(Affected Vendors)0.0000.0020.001.000
Pseudo R2 = 0.944 N = 1678
Disclaimer/Publisher’s Note: The statements, opinions and data contained in all publications are solely those of the individual author(s) and contributor(s) and not of MDPI and/or the editor(s). MDPI and/or the editor(s) disclaim responsibility for any injury to people or property resulting from any ideas, methods, instructions or products referred to in the content.