Article

Regulation and Empowerment: How Does the Digitalization of Tax Administration Affect Entrepreneurial Entry?

by
Meng Zhang
1,
Tongxin Wu
2 and
Xin Zheng
1,*
1
School of Business, Sun Yat-Sen University, Guangzhou 510275, China
2
School of Management, Hefei University of Technology, Hefei 230009, China
*
Author to whom correspondence should be addressed.
Systems 2026, 14(7), 834; https://doi.org/10.3390/systems14070834
Submission received: 13 March 2026 / Revised: 3 May 2026 / Accepted: 15 May 2026 / Published: 13 July 2026
(This article belongs to the Section Systems Practice in Social Science)

Abstract

The digitalization of tax administration (DTA) represents a transformative institutional reform; however, its influence on regional entrepreneurship remains both theoretically ambiguous and empirically understudied. Drawing on institutional theory, we examine whether and how DTA is associated with regional entrepreneurial entry by reshaping entrepreneurial resource allocation. Using China’s “Golden Tax Project III” reform as a quasi-natural experiment, we apply a staggered difference-in-differences approach to a panel of 282 cities from 2009 to 2022. The results show that the implementation of GTP III is associated with higher levels of entrepreneurial entry. Mechanism analyses provide evidence consistent with two primary channels: the agglomeration of technological talent and improved access to financial resources. Furthermore, the enabling effects of DTA are more pronounced in regions with more developed digital infrastructure, stronger administrative capacity, and higher institutional quality. These findings extend the literature by linking tax digitalization to regional entrepreneurial entry and by clarifying the mechanisms and boundary conditions under which its effects vary.

1. Introduction

The digitalization of tax administration (DTA), defined as the integration of advanced digital technologies such as big data, cloud computing, and artificial intelligence into tax collection, compliance, and enforcement, has become a prominent feature of modern fiscal governance. Across both developed and developing economies, governments have increasingly adopted digital tax tools to strengthen monitoring capacity, improve administrative coordination, and modernize revenue collection systems. OECD [1] reports that around 75% of tax administrations have adopted a comprehensive data management strategy, while national tax systems still differ substantially in structure and competitiveness [2]. These developments reflect the broader rise in data-driven public finance, in which DTA is expected to enhance information transparency, administrative efficiency, and enforcement effectiveness.
Although DTA has become a global policy trend, its design and implementation vary widely across countries and regions. Some jurisdictions have established real-time e-invoicing and integrated digital platforms, whereas others still rely on fragmented or semi-manual models due to infrastructural and administrative constraints. For example, Singapore’s “Seamless Tax” system links tax data with registries and banks, reducing business-incorporation time to about ten minutes and achieving a 98% online-filing rate, supporting its high venture density [3]. By contrast, Kenya’s Electronic Tax Invoice Management System, modeled in part on Brazil’s e-invoicing, has faced infrastructural and administrative bottlenecks, limiting SME adoption and raising entry barriers [4]. These differences suggest that DTA is not a one-size-fits-all technological remedy, nor does it produce uniform results. Its effects may depend on how digital tax tools interact with the pre-existing institutional and infrastructural conditions and are therefore context-dependent.
While a growing body of research, especially studies exploiting China’s Golden Tax Project III (GTP III), has examined the effects of DTA, the literature remains predominantly focused on firm-level consequences, with relatively little attention paid to regional-level consequences. Existing studies find that DTA can enhance corporate fiscal transparency, broaden firms’ access to external financing, and increase firm-level investment efficiency and innovation output [5,6,7]. Other studies find less favorable effects, showing that DTA increases firms’ audit expenses [8] and reduces efficiency wages [9], which may distort resource allocation and partially offset firms’ benefits.
More recently, scholars have begun to explore regional consequences of GTP III, including its effects on local government debt [10], green development [11], and fiscal revenue [12]. However, its impact on entrepreneurial entry remains underexplored. Compared with incumbent firms, potential entrants are typically more sensitive to changes in regulatory visibility, access to finance, and compliance costs [13]. Accordingly, entrepreneurial entry provides an especially informative lens through which to evaluate the broader institutional impact of tax digitalization.
How does digitally empowered tax administration impact regional entrepreneurial entry? Does it stimulate new business formation or suppress it? Existing studies offer preliminary insights but do not provide a systematic explanation for understanding how DTA influences entrepreneurial entry. On the one hand, digital tax enforcement may increase compliance costs through real-time data reporting requirements, mandatory e-invoicing, and more frequent audits—factors that may discourage entrepreneurship, particularly for resource-constrained startups [14]. On the other hand, it has the enabling potential to foster a supportive environment characterized by transparent rules and effective governance, which may reduce entry barriers to formal entry and boost business confidence [15]. These competing impacts can be conceptualized as the cost escalation effect and the institutional optimization effect. While prior research has mentioned these effects in isolation, they have not been systematically examined within a unified framework. In addition, identifying the boundary conditions under which enabling or constraining effects prevail remains an open empirical question.
To reconcile the tension between DTA’s constraining and enabling effects on entrepreneurship, this article investigates whether, how, and under what conditions DTA is associated with entrepreneurial entry at the regional level. Institutional arrangements in China have been shown to shape economic outcomes through structured policy interventions [16]. China’s Golden Tax Project III (GTP III) is among the most comprehensive DTA reforms in a developing economy. Unlike less centralized and more discretionary tax regimes (e.g., Lithuania’s elective quarterly VAT filing or India’s incremental GST adjustments), GTP III features stringent enforcement, full administrative coverage, and deep technological integration. These features reduce policy confounders and provide a suitable setting for examining the relationship between DTA and regional entrepreneurial entry within a staggered DID framework. Exploiting the staggered rollout of GTP III as a quasi-natural experiment across 282 Chinese prefecture-level cities from 2009 to 2022, we adopt a staggered difference-in-differences design and provide credible evidence that DTA is associated with higher entrepreneurial entry.
Our analysis yields three contributions. First, we extend the literature on digital tax reforms from firm-level outcomes to regional entrepreneurial entry. We show that the effects of DTA are context-dependent. Rather than emphasizing either enabling or constraining effects in isolation [10,17], we document how both forces may coexist and vary across settings.
Second, we identify institutional conditions under which the positive association between DTA and entrepreneurial entry is more pronounced. We find that the effects are more pronounced in regions with stronger digital infrastructure, higher administrative capacity, and higher institutional quality. These findings highlight the importance of institutional complementarities and are consistent with the ecosystem perspective that emphasizes interdependence and boundary conditions [18].
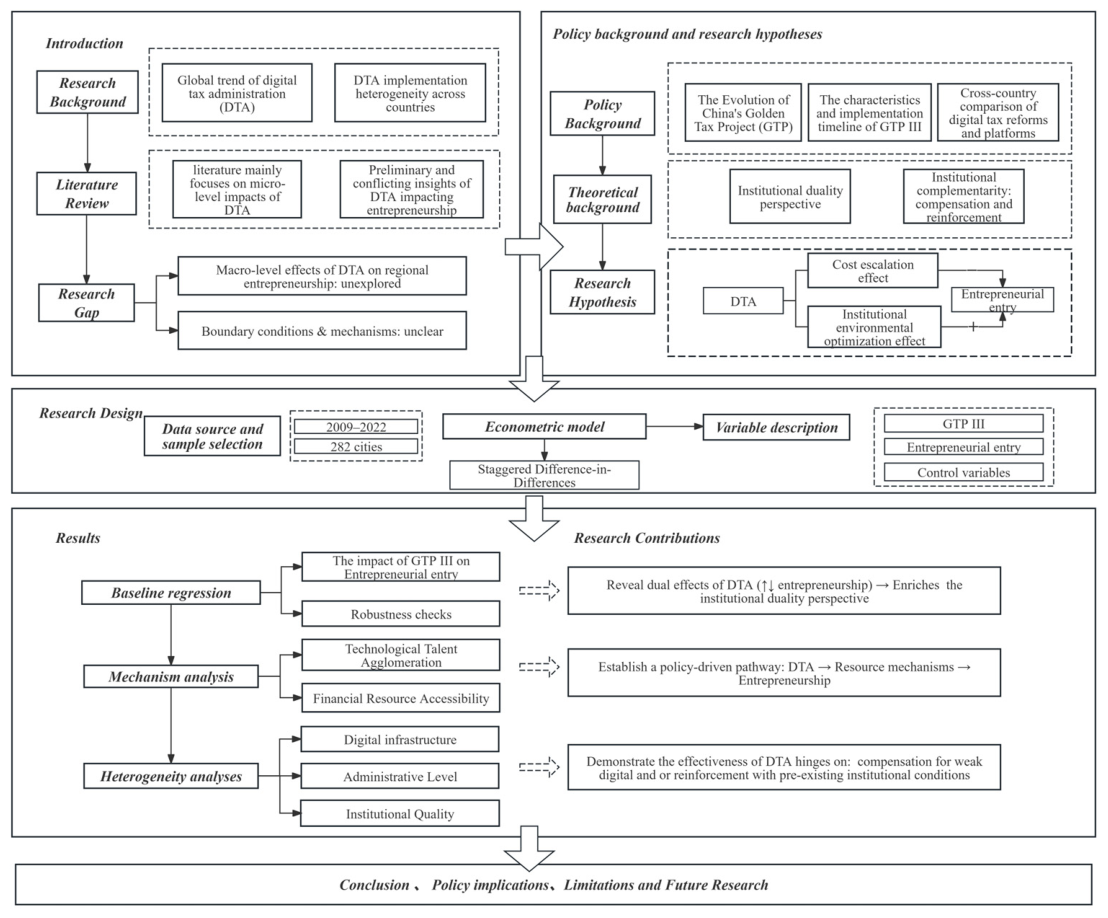
Third, we provide evidence on two primary mechanisms through which DTA promotes entrepreneurial entry: the agglomeration of technological talent and improved access to financial resources. Within entrepreneurial ecosystems, human capital and financial resources constitute two of the core components [19,20]. These mechanisms capture how digital tax reforms may reshape regional resource conditions that are central to entrepreneurial entry. The integrated research framework is illustrated in Figure 1.

2. Institutional Background and Research Hypothesis

2.1. Institutional Background

The Golden Tax Project (GTP), approved by the State Council, is a key e-government reform to digitize China’s tax administration. The reform has four phases (GTP I–IV), of which the first three are completed. Phases I (1994) and II (2001) focused on VAT regulation through invoice management. Phase I introduced a manual anti-fraud system for cross-verifying invoices, while Phase II extended monitoring across the VAT cycle—from invoice issuance and verification to filing, auditing, and inspection. Together, they laid the groundwork for VAT compliance but remained narrowly invoice-based.
Phase III (2013) marked a shift from “Invoice-based Tax Control” to “Data-driven Governance”, enhancing automation and real-time monitoring (see Table 1). GTP III involved establishing “one platform, two levels of processing, three coverages, and four systems”. (1) “One platform” is a unified infrastructure with centralized hardware and software, improving efficiency and reducing evasion. (2) “Two levels” centralize data collection and analysis across national and local authorities, reducing fragmentation and oversight gaps. (3) “Three coverages” include all tax categories, all stages (declaration to enforcement), and both state and local bureaus, strengthening source control. (4) “Four systems” cover invoice management, tax administration, external information, and decision support. Together, these created a professionalized digital governance chain and solid data foundation.
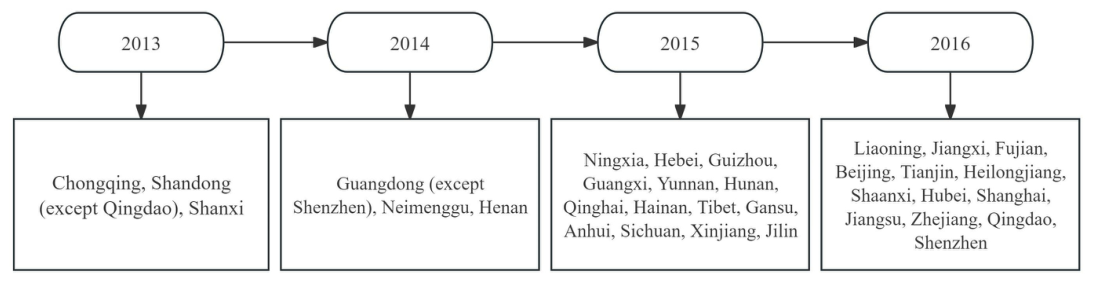
To reduce systemic risk, the rollout of GTP III was staged: pilot implementation in 2013, expansion in 2014, and coverage of an additional 14 provinces in 2015. By the end of 2016, GTP III had been administratively rolled out across all mainland provinces (Figure 2). Importantly, the phased implementation was orchestrated by central authorities rather than determined by local characteristics or preferences, as documented in the “GTP III Project Management Measures” [21]. The selection of pilot cities in the initial phase reflected geographic and developmental diversity, spanning eastern, central, and western China, and including areas with varying levels of economic development and administrative capacity. The diverse selection of pilot cities makes it less likely that the rollout sequence was influenced by local factors, thereby reinforcing the assumption of exogeneity necessary for empirical design. Therefore, the phased rollout of GTP III provides plausibly exogenous variation in treatment timing, exhibiting the features of a quasi-natural experiment. This contrasts with systems like the U.S. Modernized e-File and South Korea’s Taxpayer Information Management System, which lack staggered rollouts and comprehensive coverage. Relative to cross-country experiences of digital tax reforms, GTP III provides a distinctive empirical setting for examining digital tax administration. Table 2 presents the comparative overview.

2.2. Research Hypothesis

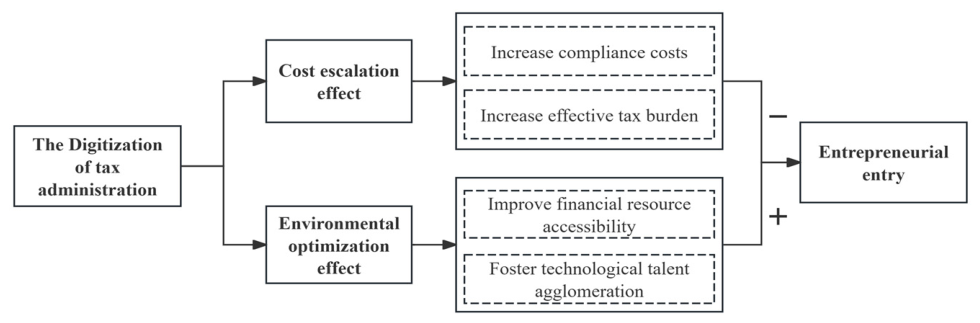
Although DTA has received growing attention, its implications for entrepreneurship remain underexplored. Drawing on institutional theory and the entrepreneurial ecosystem literature, we view firm entry as shaped by the dynamic interaction of resource flows (e.g., human and financial capital) and institutional environments. In this context, digital tax administration can be understood as a policy shock that alters these underlying conditions [22,23]. We develop a conceptual framework (see Figure 3) to organize how DTA triggers two competing mechanisms, and to establish a clear linkage between theoretical channels and empirical identification [24]. On the one hand, enhanced enforcement and reporting requirements may increase compliance costs and administrative burdens, potentially discouraging entry. On the other hand, by enhancing regulatory transparency and strengthening the integration of taxation and financial information, it facilitates resource flows and reduces entry frictions. Ultimately, the effect on regional entrepreneurial entry is the net outcome of these opposing systemic mechanisms, which motivates our competing hypotheses and empirical tests.

2.2.1. The Constraining Face of DTA: Cost Escalation Effect and Entrepreneurial Entry Suppression

Institutional theory holds that regulatory institutions shape market participation through coercive constraints [25]. Viewing regional entrepreneurship as an interconnected ecosystem, we posit that DTA, as a digitally augmented regulatory institution, acts as a constraining force that limits access to resources within the ecosystem, thereby raising business costs and suppressing entrepreneurial entry. Specifically, DTA imposes standardized and technology-driven tax administration that increases two types of costs: (i) compliance costs and (ii) effective tax burden. By lowering expected returns, particularly for resource-constrained entrants, these higher costs may discourage firm formation.
First, DTA reduces entrepreneurship by raising compliance costs and market entry barriers. Compliance costs are non-tax expenses required to meet regulation, such as time, technology, and labor [26]. Startups, lacking mature financial systems, face adaptive challenges in meeting DTA’s elevated data reporting standards. Ensuring reliable financial data requires investment in data systems, increasing compliance expenditures for entrants [27]. DTA also demands significant managerial attention and labor resources for timely tax reporting, adding administrative costs. These heightened compliance requirements raise the costs of market entry across the region and may deter entrepreneurial entry [28].
Additionally, DTA may suppress entrepreneurship by raising the effective tax burden and reducing expected net returns. The effective tax burden refers to the direct tax costs borne by businesses, reflecting the gap between statutory obligations and actual tax liabilities [29]. The discrepancy between statutory and effective tax burdens often stems from widespread tax-avoidance behavior [30]. By using digital tools such as big data and blockchain, DTA strengthens tax supervision, reduces irregularities and information asymmetries, and limits firms’ discretion in under-reporting income. Consequently, tax avoidance opportunities for startups are substantially reduced, raising their effective tax burden. These higher burdens erode startup margins and undermine new business formation, ultimately dampening regional entrepreneurial dynamics. Based on this, we propose Hypothesis 1a:
Hypothesis 1a. 
The digitalization of tax administration can inhibit entrepreneurial entry.

2.2.2. The Enabling Face of DTA: Institutional Optimization Effect and Entrepreneurial Entry Promotion

Institutional theory posits that institutions define “rules of the game” in society. Startups are highly sensitive to their environments, strategically selecting operational contexts that significantly shape their organizational behavior and performance [31,32]. Within a regional ecosystem, regulatory and policy shifts often catalyze regional entrepreneurial development. As a major institutional reform, DTA leverages digital technologies to strengthen market supervision, standardize tax enforcement, and limit subjective discretion. This transparency-enhancing role serves as an institutional optimization, reducing information asymmetries and fostering a more predictable institutional environment [33]. In our framework, this improved transparency is regarded as an institutional precondition rather than a standalone mechanism. It facilitates the operation of resource-allocation channels through which DTA may influence firm entry. Specifically, DTA may affect entrepreneurial entry through two observable pathways: (i) improving financial access via tax-finance integration and (ii) fostering technological talent agglomeration. Together, these pathways improve the availability and coordination of key resources relevant to entrepreneurial entry.
First, DTA indirectly stimulates entrepreneurial entry by improving access to external finance through tax-finance data integration. By breaking down information silos between administrative and financial subsystems through “bank–tax interaction” [34], DTA enables lenders to securely access verified tax data. This cross-domain data sharing enhances the transparency of information flows and drastically reduces the information asymmetries that traditionally constrain small-business financing. Consequently, financial institutions can more accurately assess creditworthiness and extend credit to startups, optimizing the overall efficiency of regional resource allocation [35]. Improved access to financial resources is essential for new business formation and regional entrepreneurship [36]. By alleviating financing constraints, DTA may ease access to external funding, thereby lowering barriers to entry. This mechanism suggests that improved financing conditions can facilitate firm entry.
Second, DTA may indirectly enhance entrepreneurial entry by fostering technological talent agglomeration. DTA raises skill requirements in tax authorities—particularly in data analysis and digital systems management, and stimulates broader regional demand for digital talent in accounting, compliance, and fin-tech [37]. This demand extends beyond the public sector, prompting private firms to invest in workforce development and attract high-skill professionals. As digitally skilled workers such as data analysts and system architects cluster within a region, coordination costs fall, interdisciplinary collaboration becomes easier, and knowledge spillovers increase, thereby fostering new venture formation [38]. Thus, DTA-induced talent agglomeration supports regional entrepreneurial entry. Based on this, we propose Hypothesis 1b:
Hypothesis 1b. 
The digitalization of tax administration can enhance entrepreneurial entry.

3. Research Design

3.1. Econometric Model

We use the staggered rollout of GTP III to examine the impact of DTA on entrepreneurial entry. We adopt a staggered DID design, exploiting variation in GTP III rollout across cities and time. The baseline specification is as follows:
E n t i t   =   α 0   +   α 1 G T P i t   +   α 2 C o n t r o l s i t   +   γ i   +   λ t   +   μ i t
where E n t i t indicates the entrepreneurial entry. The subscripts i and t denote city and year, respectively. G T P i t denotes GTP III. C o n t r o l s i t is a vector of city-level control variables. γ i   and λ t   represent city and year fixed effects.   μ i t   is the error term. The coefficient α 1 represents the effect of DTA on entrepreneurial entry.

3.2. Variable Description

3.2.1. Dependent Variable

The dependent variable is entrepreneurial entry (Ent), measured as newly registered enterprises per 100 residents in each city. To avoid bias from firm-size differences and missing labor data, we employ a population-normalized measure following Liu et al. [39]. This ratio captures new firms per 100 residents in each city. This normalization improves cross-city comparability and aligns with established measures of entrepreneurial vitality [40].

3.2.2. Independent Variable

The independent variable, GTP, indicates the implementation of GTP III, defined as a dummy equal to 1 if GTP III is implemented, 0 otherwise. Following Meng and Zhang [41], we apply a mid-year coding rule: rollouts in the first half of a calendar year are coded as treated from that year, whereas rollouts in the second half are coded as treated from the following year. Under this rule, the administrative rollout of GTP III during 2013–2016 maps onto five empirical treatment-year cohorts, G2013, G2014, …, G2017, used in our event-study and CSDID analyses. The G2017 cohort therefore refers to late-2016 administrative rollouts coded as treated from 2017 rather than to a separate post-2016 rollout.

3.2.3. Control Variables

To mitigate omitted-variable bias, we include city-level controls following prior studies [42,43]. Controls capture economic development, fiscal policy, and openness: log per capita GDP (Ln AGDP), fiscal spending to GDP ratio (Gov), science and technology spending ratio (Tech), education expenditure ratio (Edu), and foreign direct investment to GDP (FDI). Table 3 summarizes variable definitions.

3.3. Data Source and Sample Selection

Data on newly registered firms are obtained from the State Administration for Industry and Commerce (SAIC), covering firm-level information such as city, establishment date, and operational status. Implementation timelines for GTP III across cities are manually compiled from provincial tax bureaus’ official websites and related notices. Additional city-level data are drawn from the China Urban Statistical Yearbook.
The balanced panel covers 282 prefecture-level and above cities from 2009 to 2022. To maintain sample consistency, missing observations in city-level variables drawn from the China Urban Statistical Yearbook are handled using a sequential procedure that includes within-city linear interpolation, adjacent-year filling, and, where necessary, city-level mean substitution. Before imputation, the missing rates for the main control variables are generally low, with LnAGDP, Gov, Tech, and Edu below 5%, and FDI has a missing rate below 10% of the sample. In addition, to reduce the influence of extreme observations, we winsorize the following variables at the 1st and 99th percentiles: Ent, LnAGDP, Gov, Tech, Edu, and FDI. After these procedures, the final sample contains 3948 observations.

4. Results

4.1. Descriptive Statistics

Table 4 reports descriptive statistics for key variables. Entrepreneurial entry has a mean of 1.167 (min 0.09, max 5.57), indicating substantial cross-city variation. The mean of GTP is 0.502, indicating that 50.2% of city-years fall in the post-treatment period. Control variables show reasonable variation, supporting regression analysis.

4.2. Benchmark Regression Results

Table 5 reports the core regression results on the impact of DTA on entrepreneurial entry. Column (1) excludes controls and fixed effects; column (2) adds city fixed effects; column (3) includes year fixed effects; column (4) presents the full model with controls. Across all specifications, the coefficient on GTP III is positive and statistically significant at least at the 5% level, indicating a positive association between DTA and formal firm registration. Specifically, the implementation of GTP III is associated with an increase of approximately 0.0678 new venture establishments per 100 residents in a city, supporting Hypothesis 1b.
Among the control variables, Ln AGDP is significantly negative, suggesting that, conditional on other city characteristics, cities with higher per capita income may not necessarily exhibit stronger entrepreneurial entry when entrepreneurship is measured by newly established firms per 100 residents. Gov enters with a significantly negative coefficient, which is consistent with the view that a larger fiscal expenditure share is associated with government-led resource allocation and public-sector dominance, thereby crowding out private entrepreneurial incentives. By contrast, Tech is significantly positive, indicating that targeted science and technology expenditure is conducive to entrepreneurial entry, likely because it improves local innovation infrastructure, supports technology transfer, and lowers barriers to new business formation. Edu is statistically insignificant in the full specification, suggesting that education expenditure may not translate immediately into observable short-run entrepreneurial entry within our sample period. FDI is significantly negative, which may reflect that foreign capital inflows intensify product market competition and raise entry barriers for resource-constrained local startups, although this relationship may vary across contexts.

4.3. Parallel Trend Test

The quasi-experimental interpretation of a multi-period DID design relies on the parallel trends assumption, i.e., in the absence of the policy, treatment and control groups would have followed similar trends. Following Ferrara et al. [44], we implement an event study with leads and lags relative to the GTP III implementation year. Specifically, we estimate the following model:
E n t i t   =   α 0   + k 1 α k G T P k , i t   +   β C o n t r o l s i t   +   γ i   +   λ t   +   μ i t
where G T P k , i t represents a set of dummy variables indicating the number of years k before and after the GTP III implementation, with k   =   0 denoting the year of implementation and k   =   1 serving as the omitted baseline category.
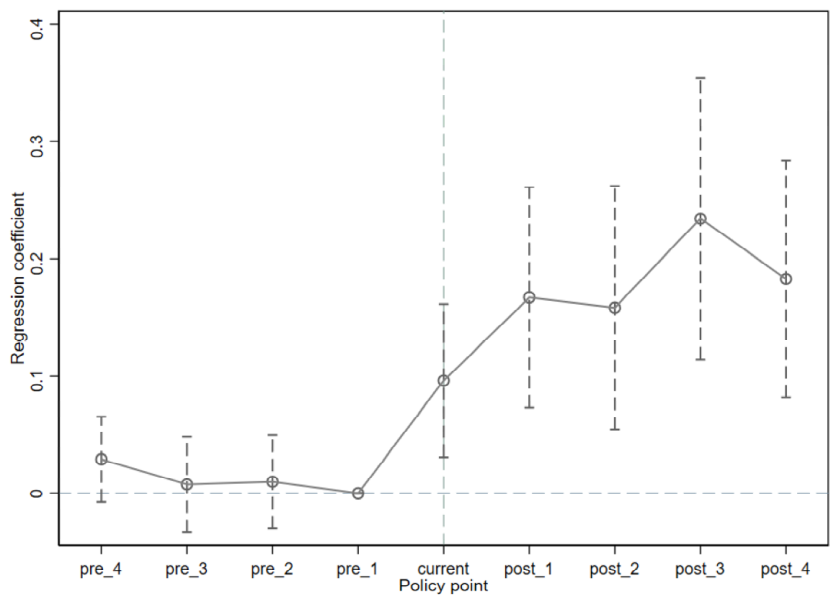
Figure 4 plots dynamic treatment effects, with time relative to the policy year (pre_4 to post_4) on the x-axis and coefficients on the y-axis. The solid line shows point estimates, with dashed bars for 95% confidence intervals. Pre-treatment coefficients (pre_4 to pre_2) are not significant, supporting parallel trends. Post-treatment effects are significantly positive and persistent, indicating increased entrepreneurial entry after GTP III.

4.4. Addressing Heterogeneous Treatment Effects

4.4.1. Goodman-Bacon Decomposition

The Goodman-Bacon decomposition shows that, in the absence of never-treated units, the TWFE estimator is composed of both early-versus-late treated comparisons and later-versus-earlier treated comparisons. In our sample, approximately 71.4% of the total weight comes from the former, while about 28.6% comes from the latter, in which already-treated units serve as controls for later-treated units. This suggests that although the benchmark TWFE estimate is still mainly driven by relatively clean comparisons, it is not free from contamination by treatment-effect heterogeneity. Therefore, the Bacon decomposition provides a useful diagnostic and further motivates our use of more robust staggered DID estimators.

4.4.2. CSDID Estimation

Table 6 column (2) reports the aggregated ATT estimated with the Callaway and Sant’Anna [45] doubly robust estimator. The coefficient on GTP III is 0.065 and statistically significant at the 1% level, indicating that the digitalization of tax administration increases new-firm density by approximately 0.065 new ventures per 100 residents in treated cities relative to not-yet-treated counterparts. Two observations are worth noting. First, the CSDID point estimate is quantitatively smaller than the TWFE benchmark of 0.0678, a reduction consistent with the Bacon decomposition evidence in Section 4.4.1: in the absence of never-treated units, the TWFE estimator places substantial weight on “forbidden comparisons” that use already-treated cohorts as controls for later-treated cohorts, which under heterogeneous treatment effects can inflate the estimated coefficient [46]. The CSDID estimator avoids this contamination by restricting identification to clean not-yet-treated comparisons and properly aggregating cohort-specific ATTs. Second, despite the smaller magnitude, the conclusion is robust: DTA promotes regional entrepreneurial entry, and the effect survives the more demanding identification standard imposed by modern staggered-DID estimators.
To further address the concern that within-province correlation in treatment timing may bias inference, we re-estimate the CSDID specification using both province-level clustering and two-way clustering by city and year for standard errors. As reported in Supplementary Materials Table S2, the ATT estimates remain positive and statistically significant under both clustering schemes, indicating that our results are not sensitive to alternative assumptions about the error correlation structure. In particular, the estimates remain robust when clustering at the province level, which is especially important given the staggered provincial rollout of GTP III and the potential within-province correlation in treatment timing. The results are also robust to two-way clustering by city and year, which accounts for both serial correlation within cities and common shocks across years. Taken together, these findings suggest that the CSDID estimates are robust to alternative and more demanding inference procedures.

4.4.3. Event Study Under CSDID

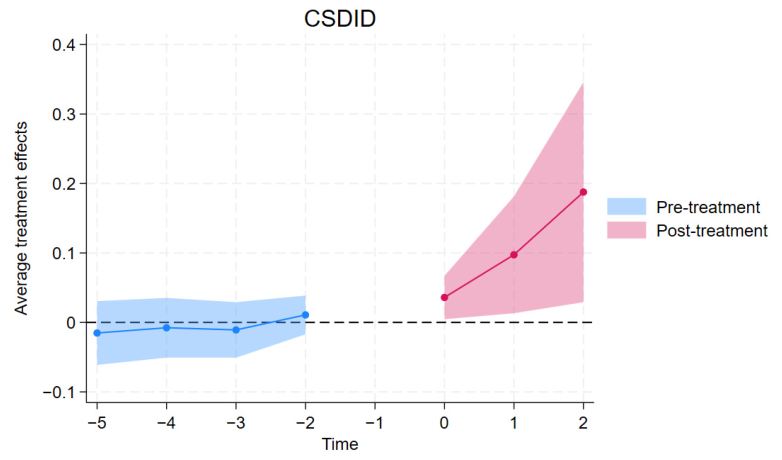
The event-study window is restricted to [−4, +2], with t = −1 normalized as the reference period. As the GTP III reform achieved universal coverage by 2016, the pool of not-yet-treated control units shrinks rapidly at longer horizons beyond +2. As explained in Section 3.2, although the administrative rollout of GTP III was completed by 2016, units rolled out in the second half of 2016 are coded as first treated in 2017 under the mid-year treatment coding rule. Consequently, at horizons beyond +2, the event-study estimates would rely disproportionately on the late-coded G2017 cohort and a small number of cohort-time comparisons. We therefore truncate the event window in the CSDID estimation [45] to ensure credible identification. The resulting CSDID event-study estimates are reported in Figure 5: pre-treatment coefficients are statistically indistinguishable from zero, supporting the parallel-trends assumption, while post-treatment effects are positive and grow over the [0, +2] horizon, consistent with the baseline evidence of a positive association between DTA and regional entrepreneurial entry.

4.5. Robustness Checks

4.5.1. Placebo Tests

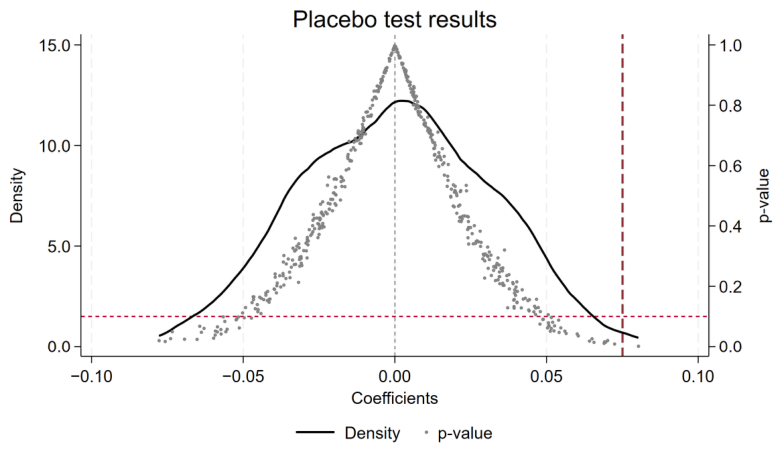
To verify that our estimates are not driven by random shocks or misspecification, we conduct a placebo test by randomly assigning GTP III years across cities. This process is repeated 500 times, preserving sample structure [47]. Figure 6 shows placebo coefficients are normally distributed around zero and distinct from the true effect. Most p-values exceed 0.1, indicating no significant placebo effect. This supports the robustness of our baseline results.

4.5.2. Addressing Sample Selection Bias

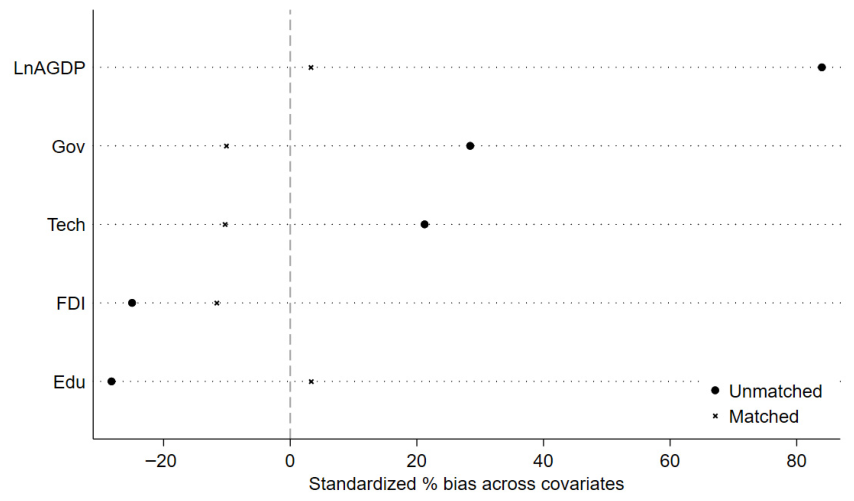
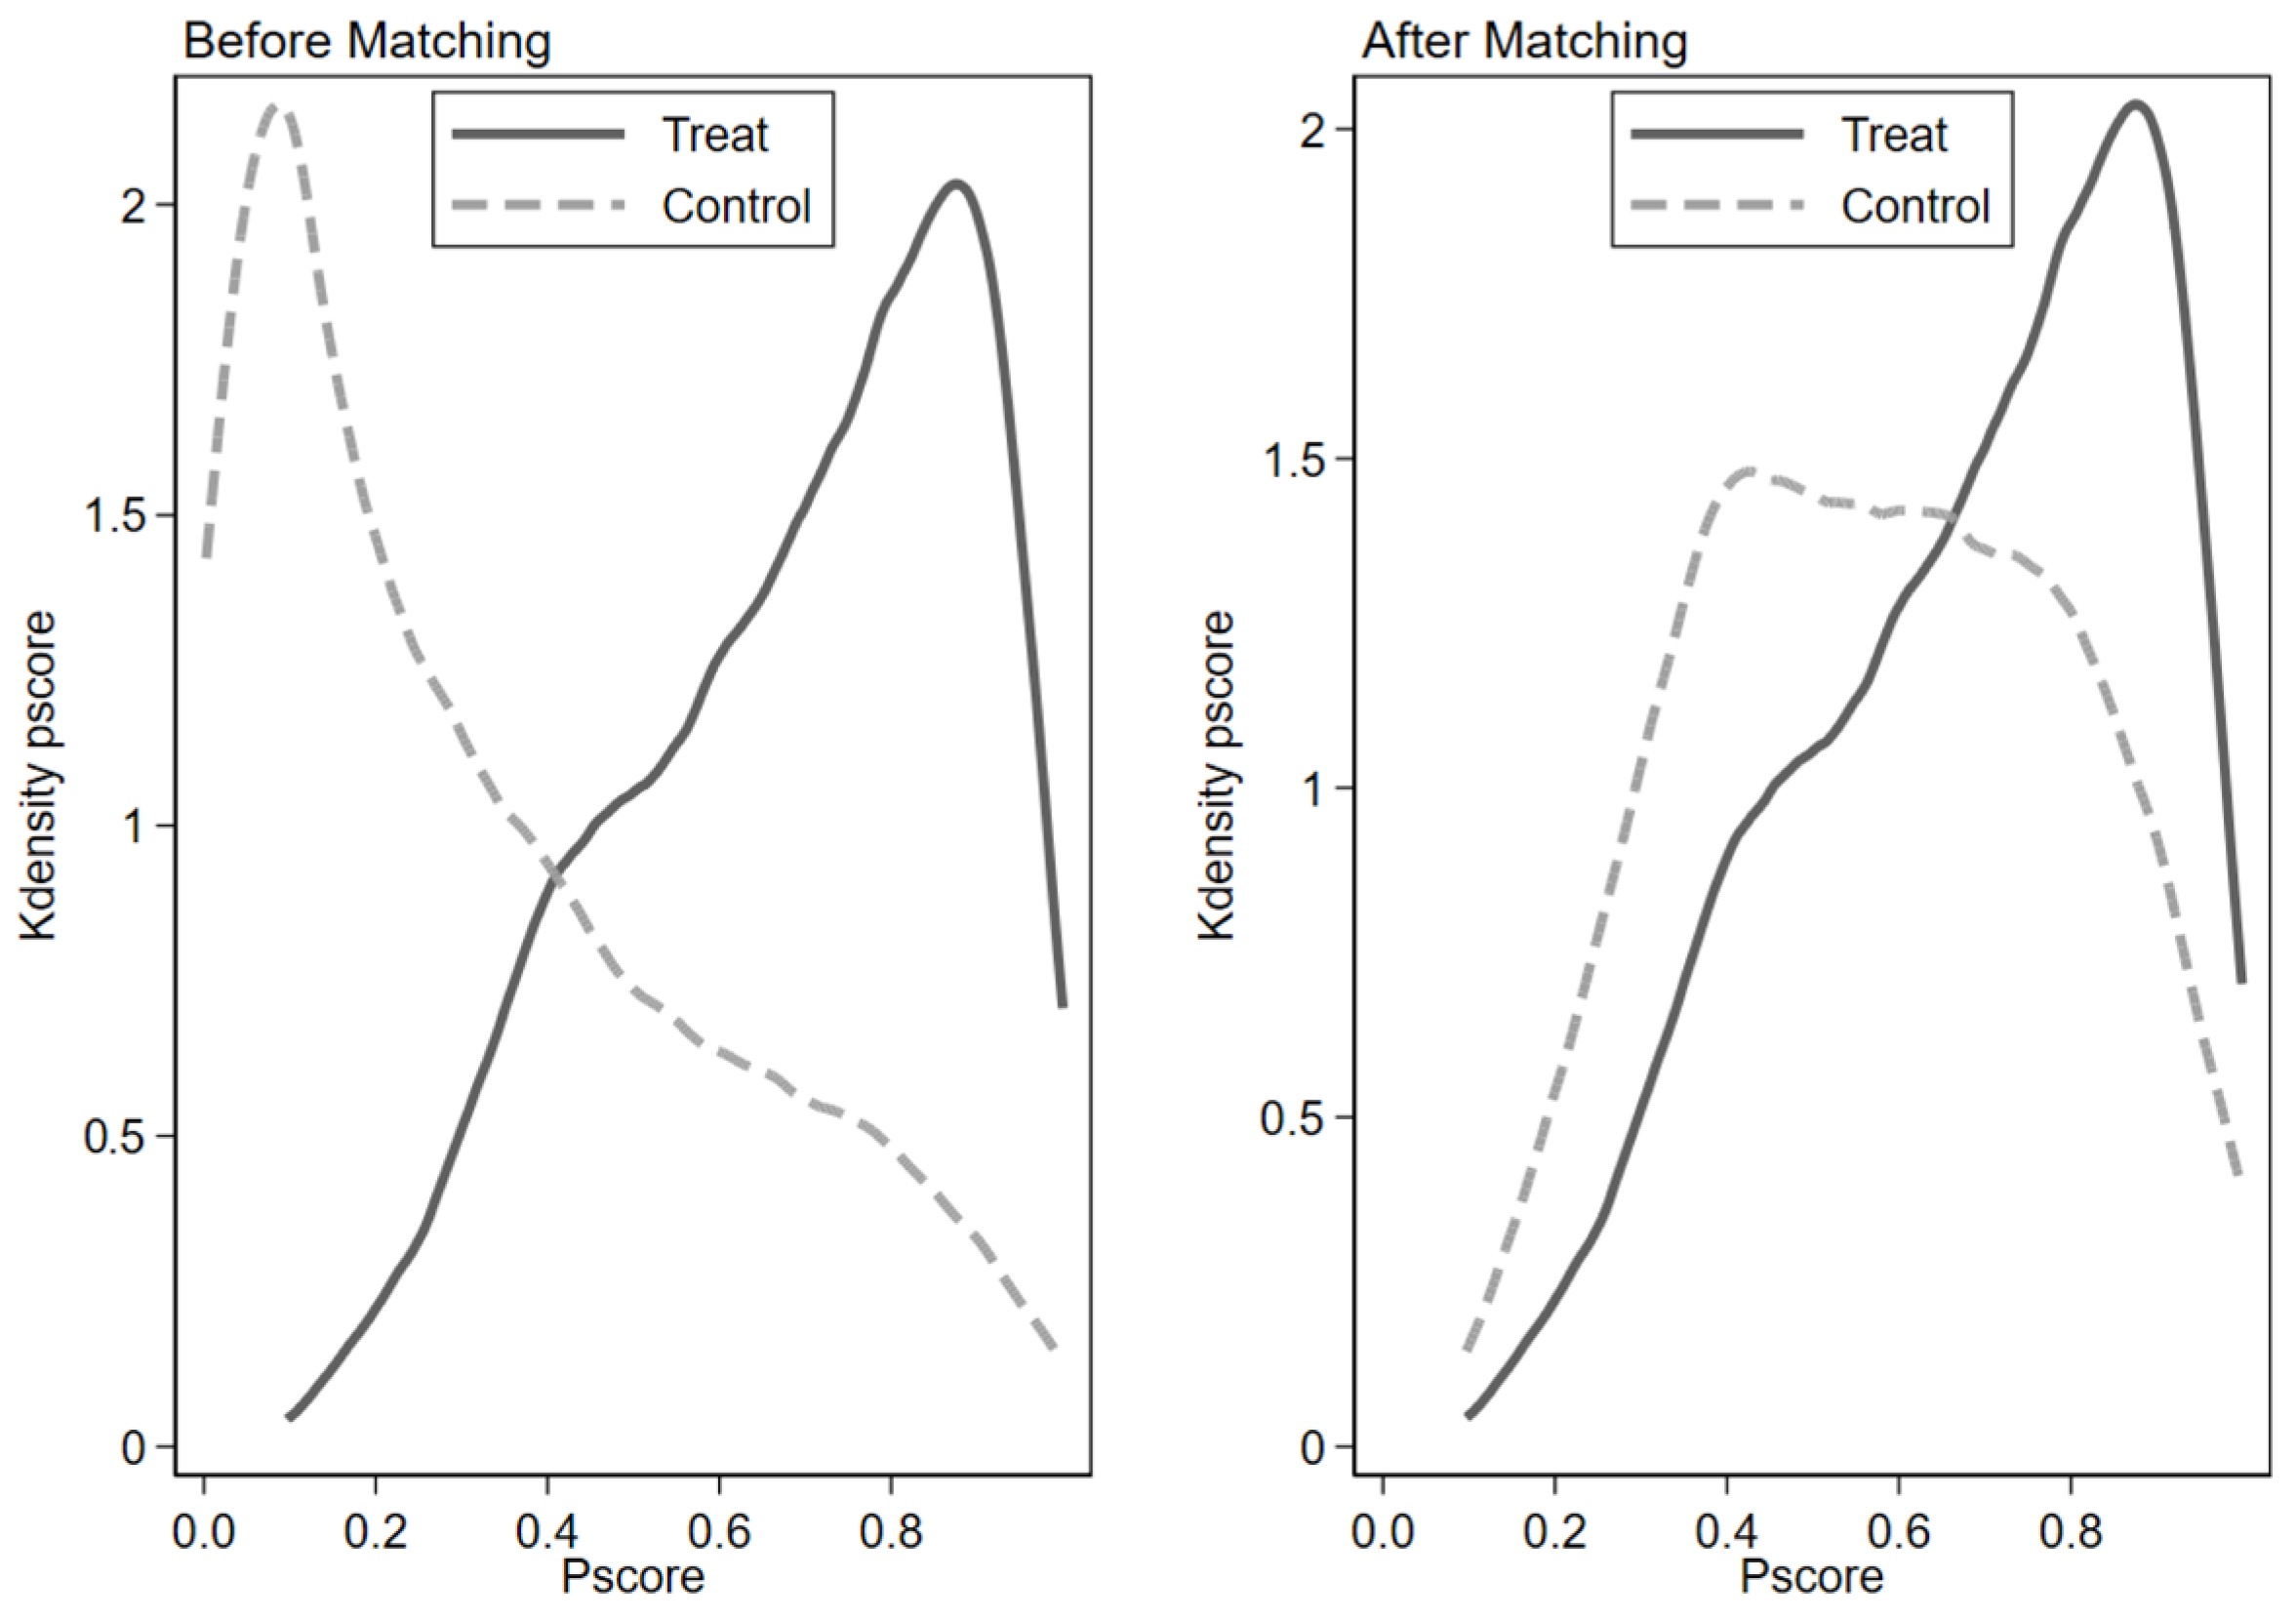
To mitigate selection bias from the non-random implementation of GTP III, we employ a PSM-DID approach. Following Fan et al. [48], we implement 1:1 nearest-neighbor matching with a caliper of 0.01. The balancing results (Figure 7) indicate that the matched treated and control groups are comparable in observed characteristics, as standardized biases are substantially reduced after matching. Kernel density plots (Figure 8) indicate improved propensity score overlap after matching. Column (1) of Table 7 shows GTP III significantly enhanced formal firm registration in pilot cities, consistent with baseline results. These results suggest that the baseline finding is not driven by observable pre-treatment differences between treated and comparison cities.

4.5.3. Controlling for Concurrent Policy Impacts

To account for the potential confounding effects of overlapping policy initiatives, we control for the National Information Benefiting the People (IBP) and Smart City Pilot (SCP) programs, both shown to affect entrepreneurial entry through digital infrastructure and business environment [49,50]. We construct two dummies for city participation in these pilots as controls. Columns (2)–(3) of Table 7 report results with these policy controls. The coefficient for GTP remains positive and statistically significant at the 5% level in Column (2) and at the 1% level in Column (3). These findings are consistent with the baseline estimates and further support the robustness of our main conclusion.

4.5.4. Using Alternative Measure of Entrepreneurial Entry

We follow Y. Li et al. [51] and use the growth rate of newly registered firms as an alternative measure of regional entrepreneurial entry. The specific calculation formula is as follows:
E n t   g r o w t h i t   =   ( N e w   F i r m s i t N e w   F i r m s i t 1 N e w   F i r m s i t 1 )
We re-estimate the baseline model with this alternative measure. Column (4) of Table 7 shows GTP III maintains a significantly positive effect on entrepreneurial growth at the 1% level, providing additional support for a positive association between GTP III and entrepreneurial growth. This reinforces the robustness of our findings.

4.5.5. Excluding Municipalities Samples

To avoid selection bias from unique administrative structures, we exclude the four direct-controlled municipalities (Beijing, Shanghai, Tianjin, Chongqing). Re-estimating the model with the remaining 278 cities (Table 7, column 5), GTP III’s effect remains significantly positive at the 5% level. The results persist in a more representative sample, confirming the robustness of our findings.

4.5.6. Sensitivity to Winsorization Thresholds

To assess whether our results are sensitive to the handling of extreme observations, we re-estimate the baseline model using a more aggressive winsorization threshold of 2%/98%, compared to the 1%/99% threshold used in the main specification. As shown in Column (6) of Table 7, the coefficient on GTP III remains positive and significant at the 5% level, with a magnitude close to the baseline estimate. The signs and significance patterns of all control variables are also consistent with the baseline specification. These results suggest that the main finding is not driven by the specific handling of outliers or by a small number of imputed control-variable observations.

5. Further Analysis

5.1. Mechanism Analysis

DTA may improve tax-related transparency and reduce administrative arbitrariness, thereby creating the institutional conditions under which resource-allocation channels can operate more effectively. Building on this institutional precondition, we focus on two empirically testable channels: technological talent agglomeration and financial resource accessibility, both critical for entrepreneurship. Following the literature on mechanism analysis [52,53,54], we investigate whether DTA influences these mediators and, in turn, entrepreneurial entry. Specifically, we estimate the following models:
M e d i a t o r i t   =   β 0   +   β 1 G T P i t   +   β 2 C o n t r o l s i t   +   γ i   +   λ t   +   μ i t
E n t i t = δ 0 + δ 1 G T P i t + δ 2 M e d i a t o r i t + δ 3 C o n t r o l s i t + γ i +   λ t + μ i t
where the M e d i a t o r i t , including T a l e n t and F i n a n c e , and other variables are defined as in Equation (1). T a l e n t is measured as the proportion of employees in the information transmission, computer services, and software industry (in tens of thousands) relative to the total number of employees in the city at year-end [55]. F i n a n c e is measured as per capita financial resources, calculated as the sum of year-end loan and deposit balances of financial institutions divided by the registered population, expressed in 10,000 yuan per person [56].
Column (1) of Table 8 shows that the GTP III coefficient is significantly positive, indicating that DTA is associated with increased technological talent agglomeration, consistent with the interpretation that digital transformation raises demand for digitally skilled labor. In Column (2), Talent enters positively and significantly in the entrepreneurship regression, suggesting that cities with a higher concentration of digital and technology-related human capital tend to exhibit stronger entrepreneurial entry. This finding aligns with prior research showing that the inflow of digital talent reduces recruitment and training costs [57] and supports the formation of entrepreneurial ecosystems [58]. These findings suggest that DTA may promote entrepreneurial entry through fostering technological talent agglomeration.
Column (3) of Table 8 shows the GTP III coefficient is significantly positive at the 5% level, suggesting improved financial resource accessibility. In Column (4), Finance is positively and significantly associated with entrepreneurial entry at the 1% level, suggesting that greater financial resource accessibility supports new firm creation. Prior research shows efficient financial systems ease financing constraints, particularly in innovative startups [60]. Digital finance and lending, by reducing information asymmetry, transaction costs, and credit access barriers, expand funding opportunities and enhance entrepreneurial incentives [61]. Taken together, these results suggest that DTA can facilitate entrepreneurship by activating local financial resource flows—one of the core components of regional entrepreneurial ecosystems—and thereby strengthening the ecosystem’s capacity to support new venture creation.
To further assess the mediation effects, we conduct bias-corrected bootstrap inference with 1000 replications. The estimated indirect effect through Talent is statistically significant at the 5% level, with a bias-corrected 95% confidence interval of [0.0003, 0.0137]. Likewise, the indirect effect through Finance is estimated at 0.021 and remains significant at the 5% level (BC 95% CI: [0.004, 0.040]). These results provide additional evidence that DTA is associated with regional entrepreneurial entry through both channels.

5.2. Heterogeneity Analyses

While the baseline analysis indicates a net positive effect of DTA on regional entrepreneurial entry, this effect varies across local contexts. As previously theorized, DTA can foster entrepreneurship through institutional optimization but also constrains it via higher compliance costs and tax burdens. The balance of these opposing forces depends on local adaptive capacity and the efficiency with which governance conditions translate into access to key resources and effective policy implementation. To explore this heterogeneity, we focus on three attributes: digital infrastructure, administrative level, and institutional quality. These three dimensions represent a layered structure of conditions under which DTA operates. Digital infrastructure provides the technological foundation for reform adoption; administrative level reflects governance capacity, which determines the effectiveness of policy implementation; and institutional quality ensures that the resulting improvements in information transparency and governance translate into genuine entrepreneurial incentives. Together, they capture the technological, administrative, and institutional conditions under which DTA’s net effect on entrepreneurship varies.

5.2.1. Digital Infrastructure

Digital infrastructure reflects a city’s digital readiness and information-processing capacity, which may condition how effectively digital policies such as DTA can be implemented and absorbed. We construct a dummy variable DI, coded as 1 for cities whose pre-treatment digital infrastructure level is above the sample median, and 0 otherwise. Following Yang et al. [62], digital infrastructure is proxied by broadband users per 100 persons. Column (1) of Table 9 reports the interaction between GTP and DI. The interaction term GTP_DI is significantly positive at the 1% level, implying that the effect of DTA on entrepreneurial entry is significantly stronger in regions with more developed digital infrastructure.
This pattern is consistent with the theoretical logic developed earlier. DTA’s enabling mechanisms—real-time data integration, bank–tax interoperability, and digital credit assessment—require a functioning digital substrate to operate effectively. In regions with more developed digital infrastructure, firms and financial institutions can engage with the digital tax system at lower cost, the talent agglomeration channel operates with greater efficiency, and the bank–tax data linkage translates more readily into improved credit access for new entrants. In regions with weaker digital infrastructure, the same reform encounters binding absorptive constraints. The compliance demands of GTP III—mandatory e-invoicing, real-time reporting, and digital record-keeping—impose adjustment costs on resource-constrained entrants, yet the enabling mechanisms through which these costs might be offset cannot fully activate without the necessary technological scaffolding. Taken together, these results suggest that digital infrastructure serves as an important complementary condition under which the effects of DTA on entrepreneurial entry are stronger, while the association is weaker in regions with less developed infrastructure.

5.2.2. Administrative Level

Administrative level captures differences in local governance capacity and enforcement consistency, which shape implementation efficiency and the degree of discretion in policy execution. We construct a binary variable AL coded as 1 for provincial capitals, sub-provincial cities, and directly administered municipalities, and 0 for other prefecture-level cities. Column (2) of Table 9 reports a strongly positive and significant interaction term GTP_AL. The result suggests that the positive association between DTA and entrepreneurial entry is stronger in cities with higher administrative capacity.
This pattern reflects institutional complementarity between administrative capacity and digital governance reform. High-administrative-level cities possess more developed government infrastructure, more mature inter-agency data-sharing platforms, and deeper integration between tax administration and financial systems, enabling GTP III’s bank–tax interoperability features to function as intended. Their stronger enforcement capacity also means that the transparency gains from DTA are more credible and verifiable, reducing entrepreneurial uncertainty more effectively [63]. Furthermore, high-capacity governments are better positioned to provide complementary services—such as compliance training, phased implementation support, and coordination with financial institutions—that amplify DTA’s enabling effects while mitigating adjustment costs for new entrants. In contrast, lower-administrative-level cities face implementation gaps: even when GTP III is formally adopted, the institutional infrastructure required to realize its resource-allocation benefits may remain underdeveloped, leaving the compliance cost channel dominant. These results suggest that administrative capacity is not merely a background condition but an active amplifier of digital institutional reform, and that strengthening local governance capacity could amplify the entrepreneurial entry benefits associated with DTA.

5.2.3. Institutional Quality

Institutional quality captures the maturity of the legal and contractual environment in which entrepreneurial entry takes place. Institutional quality determines whether the resulting improvements in tax transparency and information sharing can be translated into credible, enforceable economic outcomes for entrants [64]. We proxy institutional quality by an index of the legal environment and intermediary institution development, drawn from the Wang et al. [65] marketization index framework. Following Ren et al. [66], we construct an indicator Legal, coded as 1 for cities above the sample median of the legal-environment sub-index in the pre-treatment period and 0 otherwise. Column (3) of Table 9 reports the result. The interaction term GTP_Legal is positive and statistically significant at the 1% level. The results indicate that the positive association between DTA and entrepreneurial entry is more pronounced in cities with higher institutional quality.
This pattern is consistent with the logic that the value of digital tax administration depends on the enforceability of the information it generates. A well-functioning legal environment provides the institutional infrastructure required for cross-agency data sharing to be credible and legally operable, enhancing the reliability of bank–tax interactions and tax-based credit assessment. Where property rights are clearly defined and contracts are credibly enforced, DTA-induced reductions in information asymmetry translate more readily into expanded credit access and reduced financing constraints for new entrants; intermediary institutions such as accounting, auditing, and legal services further lower the fixed compliance costs of engaging with the digital tax system. In contrast, in regions with weaker legal environments, even accurate and transparent tax information cannot be reliably converted into enforceable contracts or credit relationships, so the information benefits of DTA dissipate while its compliance costs continue to bind. In sum, institutional quality may serve as an important complementary condition under which the effects of DTA on entrepreneurial entry are stronger.

6. Conclusions and Policy Implications

6.1. Conclusions

This research examines how DTA shapes regional entrepreneurial entry, advancing understanding of growth externalities from public sector digital transformation. Using a staggered DID design on 282 Chinese prefecture-level cities from 2009 to 2022, we derive three insights. First, we provide quasi-experimental evidence consistent with a positive relationship between DTA and regional entrepreneurial entry. The estimates suggest that the implications of digital tax reforms may extend beyond firm-level compliance to broader regional entrepreneurial dynamics [67,68]. Our findings indicate that DTA entails co-existing forces: it can increase compliance costs and administrative burdens, while also improving governance effectiveness and the broader institutional environment, with a net positive effect on entrepreneurship entry. This helps complement prior work that has often examined digital tax enforcement through a narrower set of implications [17]. In other words, rather than simply increasing costs, DTA can also strengthen the institutional conditions that support new business formation.
Second, our findings highlight the boundary-dependent nature of digital institutional reforms. Rather than generating uniform effects across regions, DTA’s impact on entrepreneurial entry is conditional on pre-existing institutional capacity. Specifically, digital infrastructure provides the technological foundation for the reform to operate, administrative capacity determines the effectiveness of its implementation, and institutional quality, which is captured by the strength of the local legal environment and intermediary institutions, ensures that the resulting gains in tax transparency and information sharing are translated into new entrants.
Third, the mechanism analysis provides evidence consistent with the view that DTA supports entrepreneurial entry through talent concentration and improved financing. Overall, we provide new evidence on whether, how, and under what conditions DTA influences entrepreneurial entry. Our findings show that digital tax reforms can simultaneously intensify compliance burdens and strengthen governance effectiveness, and that their net effect on new business formation varies with pre-existing institutional and infrastructural conditions.

6.2. Policy Implications

Our findings offer policy implications for policymakers and entrepreneurs. First, policymakers should evaluate digital tax reforms not solely by fiscal outcomes but also by their broader effects on business formation. This requires incorporating entrepreneurship-related indicators into the performance assessment of digital governance reforms, and establishing coordination between tax authorities and business environment agencies to monitor and amplify the entrepreneurial externalities of tax digitalization.
Second, governments should invest in the two resource channels through which DTA operates. On the talent side, digital tax reform should be paired with targeted workforce development programs in digital accounting, data analytics, and compliance technology. On the finance side, policymakers should deepen bank–tax data integration by establishing standardized data-sharing protocols that enable financial institutions to use verified tax records for credit assessment of new and small businesses, thereby converting digital compliance into improved financing access for entrepreneurs.
Third, the heterogeneity results call for differentiated implementation strategies rather than uniform deployment, organized around the three layers of enabling conditions identified in our analysis. At the technological layer, regions with underdeveloped digital infrastructure may benefit from a sequenced approach in which broadband expansion and digital platform development precede or accompany regulatory digitalization, so that compliance costs do not come to dominate before the enabling mechanisms can activate. At the administrative layer, cities with weaker governance capacity need complementary investments in compliance training, phased transition support, and local bank–tax coordination mechanisms to translate formal adoption into effective implementation. At the institutional layer, policymakers should prioritize strengthening the legal environment, including contract enforceability, and the development of intermediary institutions such as accounting, auditing, and legal services.
Finally, entrepreneurs should treat digital tax compliance as a strategic investment rather than a pure regulatory cost. In regions where institutional preconditions are met, verified tax records generated through GTP III can serve as credible signals of operational transparency, improving access to bank–tax integrated financing products and enhancing creditworthiness with financial institutions. New ventures that proactively invest in digital accounting systems and compliance capacity can convert regulatory requirements into competitive advantages, particularly in securing external financing during the early stages of business development.

6.3. Limitations and Future Research

While this study explores the heterogeneous effects and mechanisms of digital tax administration on regional entrepreneurial entry, several limitations remain. First, we focus on GTP III as a representative tax digitalization reform. Future research could extend the analysis to subsequent policy phases or other digital governance initiatives to capture the evolving effects of tax administration modernization. Second, this study focuses on the quantity of entrepreneurship, measured by new firm registrations. Although this indicator is widely used as a proxy for entrepreneurial activity [40,69], it does not directly capture differences in quality, innovativeness, survival, or productivity of new ventures. Future research could examine whether digital tax reform affects the composition and persistence of entrepreneurial entry, for example by distinguishing between technology-intensive and low-barrier startups or by tracking post-entry outcomes. Third, due to data limitations, we are unable to directly measure changes in tax-related transparency at the city level. Our empirical analysis therefore focuses on two observable channels: technological talent agglomeration and financial resource accessibility. Accordingly, the mechanism analysis is best interpreted as evidence on these resource-allocation pathways, rather than as a direct test of the transparency channel. Future research could develop more direct measures of tax-related transparency to better understand how it shapes the effectiveness of digital tax reform.

Supplementary Materials

The following supporting information can be downloaded at: https://www.mdpi.com/article/10.3390/systems14070834/s1, Table S1: GTP III rollout information across prefecture-level cities; Table S2: CSDID ATT under Alternative Clustering Schemes.

Author Contributions

Conceptualization, X.Z.; methodology, M.Z. and T.W.; formal analysis, M.Z. and T.W.; investigation, M.Z. and T.W.; data curation, M.Z. and T.W.; writing—original draft preparation, T.W.; writing—review and editing, M.Z., T.W. and X.Z.; validation, M.Z. and X.Z.; funding acquisition, X.Z.; project administration, M.Z. and X.Z.; supervision, X.Z. All authors have read and agreed to the published version of the manuscript.

Funding

This article was supported by the National Natural Science Foundation of China (NSFC) [Grant No. 72174217].

Data Availability Statement

The data that support the findings of this article are available from the corresponding author upon reasonable request.

Conflicts of Interest

No potential conflict of interest was reported by the authors.

References

  1. OECD. Tax Administration Digitalisation and Digital Transformation Initiatives; OECD Publishing: Paris, France, 2025. [Google Scholar] [CrossRef]
  2. Mengden, A. International Tax Competitiveness Index 2024; Tax Foundation: Washington, DC, USA, 2024; Available online: https://taxfoundation.org/research/all/global/2024-international-tax-competitiveness-index (accessed on 10 January 2026).
  3. Shakil, M.H.; Tasnia, M. Artificial intelligence and tax administration in Asia and the Pacific. In Taxation in the Digital Economy; Routledge: London, UK, 2022; pp. 45–55. [Google Scholar] [CrossRef]
  4. Ratemo, M.N.; Muna, W.K. Discretion and implementation of tax reforms at the Kenya Revenue Authority in Kajiado County. Rev. J. Soc. Sci. Humanit. 2024, 5, 696–707. [Google Scholar] [CrossRef]
  5. Guo, Y.; Wang, J.; Wang, H.; Zhang, F. The impact of big data tax collection and management on inefficient investment of enterprises—A quasi-natural experiment based on the golden tax project III. Int. Rev. Econ. Financ. 2024, 92, 678–689. [Google Scholar] [CrossRef]
  6. Xu, C.; Bai, T.; Zhou, C.; Huang, S. Digital tax administration and enterprise innovation: Evidence from the Golden Tax Project III in China. Res. Int. Bus. Financ. 2025, 77, 102829. [Google Scholar] [CrossRef]
  7. Zhang, Y.; Liu, H.; Li, S.; Xing, C. Digital tax enforcement and R&D manipulation: A quasi-natural experiment based on the “Golden Tax-III” project. Foreign Econ. Manag. 2023, 45, 3–16. [Google Scholar] [CrossRef]
  8. Li, Z.; Zhu, J. The impact of “Golden Tax-III” tax collection and management on the audit fees of listed companies. Foreign Econ. Manag. 2022, 44, 105–118. [Google Scholar] [CrossRef]
  9. Jiang, X.; Huang, R.; Wang, C. Tax enforcement and efficiency wages: Evidence from China’s Golden Tax Project III. Financ. Res. Lett. 2023, 58, 104454. [Google Scholar] [CrossRef]
  10. Cheng, Q.; Chen, B.; Luo, J. The impact of digital tax administration on local government debt: Based on the revision of the tax collection and administration law. Financ. Res. Lett. 2024, 67, 105938. [Google Scholar] [CrossRef]
  11. Lv, X.; Wu, Z. The green effect of digital transformation: The impact of digital transformation in fiscal and taxation on regional green development. Econ. Anal. Policy 2024, 81, 787–800. [Google Scholar] [CrossRef]
  12. Wang, S.; Li, H.; Zhang, Y. The impact of big data tax administration on local fiscal revenue: New evidence from the “Golden Tax Project Phase III”. Econ. Anal. Policy 2025, 86, 1409–1426. [Google Scholar] [CrossRef]
  13. Braunerhjelm, P.; Eklund, J.E.; Thulin, P. Taxes, the tax administrative burden and the entrepreneurial life cycle. Small Bus. Econ. 2021, 56, 681–694. [Google Scholar] [CrossRef]
  14. Huong, P.H.C. The Effect of Tax Administrative Burden on Entrepreneurship: The Case of the Asia-Pacific Countries. Hue Univ. J. Sci. Econ. Dev. 2021, 130, 83–102. [Google Scholar] [CrossRef]
  15. Pratama, H. Taxes and Entrepreneurship: Impact on New Business Creation. Gold. Ratio Tax. Stud. 2023, 3, 34–44. [Google Scholar] [CrossRef]
  16. Cheng, J.; Jiang, Y. How can carbon markets drive the development of renewable energy sector? Data Sci. Financ. Econ. 2024, 4, 249–269. [Google Scholar] [CrossRef]
  17. Gorshkova, N.V.; Ksenda, V.M.; Grigorenko, I.V. The impact of digital technologies of tax administration on increasing the inclusiveness and sustainability of economic development. In New Technology for Inclusive and Sustainable Growth: Perception, Challenges and Opportunities; Springer: Singapore; Berlin/Heidelberg, Germany, 2022; pp. 223–234. [Google Scholar] [CrossRef]
  18. Wu, H.; Chang, M.; Su, Y.; Xu, X.; Jiang, C. Digital Economy, Government Innovation Preferences, and Regional Innovation Capacity: Analysis Using PVAR Model. Systems 2025, 13, 382. [Google Scholar] [CrossRef]
  19. Li, X.; Chen, Z.; Chen, Y. The Impact of Digital Talent Inflow on the Co-Agglomeration of the Digital Economy Industry and Manufacturing. Systems 2024, 12, 317. [Google Scholar] [CrossRef]
  20. Tony, M. The role of financial institutions in promoting entrepreneurship and economic growth. J. Bus. Leadersh. Manag. 2023, 1, 17–25. [Google Scholar] [CrossRef]
  21. State Taxation Administration. Administrative Measures for the Golden Tax Project III (Trial) [Government Policy Document]. 2009. Available online: http://www.gov.cn/gongbao/content/2010/content_1605431.htm (accessed on 10 January 2026). (In Chinese)
  22. Powell, K.S.; Lim, E. All or nothing: International coalitions responding to competing pressures in challenges to IP rights. J. Int. Manag. 2022, 28, 100925. [Google Scholar] [CrossRef]
  23. Stavrou, E.; Parry, E.; Gooderham, P.; Morley, M.; Lazarova, M. Institutional duality and human resource management practice in foreign subsidiaries of multinationals. Hum. Resour. Manag. J. 2023, 33, 69–94. [Google Scholar] [CrossRef]
  24. Li, Z.; Chen, Z.; Huang, Z. Modelling the data-generating mechanism of China’s commodity market by identifying hidden information flow regimes. Financ. Innov. 2026, 12, 28. [Google Scholar] [CrossRef]
  25. North, D.C. The new institutional economics and development. Econ. Hist. 1993, 9309002, 1–8. [Google Scholar]
  26. Eichfelder, S.; Vaillancourt, F. Tax compliance costs: A review of cost burdens and cost structures. Hacienda Publica Esp. 2014, 210, 111–148. [Google Scholar] [CrossRef]
  27. Saptono, P.B.; Hodžić, S.; Khozen, I.; Mahmud, G.; Pratiwi, I.; Purwanto, D.; Aditama, M.A.; Haq, N.; Khodijah, S. Quality of E-Tax System and Tax Compliance Intention: The Mediating Role of User Satisfaction. Informatics 2023, 10, 22. [Google Scholar] [CrossRef]
  28. Lucas, D.S.; Fuller, C.S.; Packard, M.D. Made to be broken? A theory of regulatory governance and rule-breaking entrepreneurial action. J. Bus. Ventur. 2022, 37, 106250. [Google Scholar] [CrossRef]
  29. Jacobs, O.H. Measurement and development of the effective tax burden of companies–An overview and international comparison. Intertax 2000, 28, 334–351. [Google Scholar] [CrossRef] [PubMed]
  30. Kovermann, J.; Velte, P. The impact of corporate governance on corporate tax avoidance—A literature review. J. Int. Account. Audit. Tax. 2019, 36, 100270. [Google Scholar] [CrossRef]
  31. Chowdhury, F.; Audretsch, D.B.; Belitski, M. Institutions and entrepreneurship quality. Entrep. Theory Pract. 2019, 43, 51–81. [Google Scholar] [CrossRef]
  32. Zaman, S.; Arshad, M.; Sultana, N.; Saleem, S. The effect of family business exposure on individuals’ entrepreneurial intentions: An institutional theory perspective. J. Fam. Bus. Manag. 2021, 11, 368–385. [Google Scholar] [CrossRef]
  33. Bilan, I.; Apostoaie, C.-M. Tax policy, corruption, and formal business entry: Cross-country evidence from emerging economies. Econ. Change Restruct. 2025, 58, 26. [Google Scholar] [CrossRef]
  34. Luo, P.; Song, D.; Chen, B. Investment and financing for SMEs with bank-tax interaction and public-private partnerships. Int. Rev. Econ. Financ. 2020, 65, 163–172. [Google Scholar] [CrossRef]
  35. Jin, X.; Ke, Y.; Chen, X. Credit pricing for financing of small and micro enterprises under government credit enhancement: Leverage effect or credit constraint effect. J. Bus. Res. 2022, 138, 185–192. [Google Scholar] [CrossRef]
  36. Charfeddine, L.; Zaouali, S. The effects of financial inclusion and the business environment in spurring the creation of early-stage firms and supporting established firms. J. Bus. Res. 2022, 143, 1–15. [Google Scholar] [CrossRef]
  37. Bentley, D. Digital tax administration: Transforming the workforce to deliver. eJTR 2020, 18, 353. [Google Scholar]
  38. Hsieh, C.T.; Hurst, E.; Jones, C.I.; Klenow, P.J. The allocation of talent and us economic growth. Econometrica 2019, 87, 1439–1474. [Google Scholar] [CrossRef]
  39. Liu, Y.; Li, W.; Wen, Y. Broadband infrastructure and urban entrepreneurial activity—Evidence from a quasi-natural experiment in China. Appl. Econ. 2025, 1–15. [Google Scholar] [CrossRef]
  40. Liu, Z.; Wu, H.; Wu, J. Location-based tax incentives and entrepreneurial activities: Evidence from Western Regional Development Strategy in China. Small Bus. Econ. 2019, 52, 729–742. [Google Scholar] [CrossRef]
  41. Meng, L.; Zhang, Y. Impact of Tax Administration on ESG Performance—A Quasi-Natural Experiment Based on China’s Golden Tax Project III. Sustainability 2023, 15, 10946. [Google Scholar] [CrossRef]
  42. Qian, Y.; Xi, X. Evaluating the Policy Effect of the “Broadband China” Strategy—From the Perspective of Urban Entrepreneurship Vitality. J. Knowl. Econ. 2025, 16, 10993–11019. [Google Scholar] [CrossRef]
  43. Xiong, J.; Huang, L.; Yang, Z.; Wang, X. The impact of local government debt on entrepreneurship: Evidence from a quasi-natural experiment of local debt governance reform. Int. Rev. Econ. Financ. 2024, 93, 501–519. [Google Scholar] [CrossRef]
  44. Ferrara, E.L.; Chong, A.; Duryea, S. Soap operas and fertility: Evidence from Brazil. Am. Econ. J. Appl. Econ. 2012, 4, 1–31. [Google Scholar] [CrossRef]
  45. Callaway, B.; Sant’Anna, P.H.C. Difference-in-differences with multiple time periods. J. Econom. 2021, 225, 200–230. [Google Scholar] [CrossRef]
  46. Goodman-Bacon, A. Difference-in-differences with variation in treatment timing. J. Econom. 2021, 225, 254–277. [Google Scholar] [CrossRef]
  47. Yang, X.; Li, Z.; Qiu, Z.; Wang, J.; Liu, B. ESG performance and corporate technology innovation: Evidence from China. Technol. Forecast. Soc. Change 2024, 206, 123520. [Google Scholar] [CrossRef]
  48. Fan, H.; Wang, Y.; Gao, J.; Peng, Z.; Coyte, P.C. The effect of a long-term care insurance program on subjective well-being of older adults with a disability: Quasi-experimental evidence from China. J. Appl. Gerontol. 2023, 42, 438–446. [Google Scholar] [CrossRef] [PubMed]
  49. Li, C.; Zhang, X.; Dong, X.; Yan, Q.; Zeng, L.; Wang, Z. The impact of smart cities on entrepreneurial activity: Evidence from a quasi-natural experiment in China. Resour. Policy 2023, 81, 103333. [Google Scholar] [CrossRef]
  50. Meng, C.; Wang, L.; Lin, Y. Digital governance and carbon emission reduction: Evidence from “National Pilot Policy of Information Benefiting the People” in China. J. Environ. Manag. 2024, 368, 122179. [Google Scholar] [CrossRef] [PubMed]
  51. Li, Y.; Zhang, J.; Lyu, Y. Does telecommunications infrastructure promote entrepreneurship in developing countries? Evidence from a quasi-natural experiment in China. Struct. Change Econ. Dyn. 2023, 66, 106–119. [Google Scholar] [CrossRef]
  52. Baron, R.M.; Kenny, D.A. The moderator–mediator variable distinction in social psychological research: Conceptual, strategic, and statistical considerations. J. Personal. Soc. Psychol. 1986, 51, 1173–1182. [Google Scholar] [CrossRef] [PubMed]
  53. Imai, K.; Keele, L.; Yamamoto, T. Identification, inference and sensitivity analysis for causal mediation effects. Stat. Sci. 2010, 25, 51–71. [Google Scholar] [CrossRef]
  54. Acharya, A.; Blackwell, M.; Sen, M. Explaining causal findings without bias: Detecting and assessing direct effects. Am. Political Sci. Rev. 2016, 110, 512–529. [Google Scholar] [CrossRef]
  55. Huang, X.; Zhang, S.; Zhang, J.; Yang, K. Research on the impact of digital economy on Regional Green Technology Innovation: Moderating effect of digital talent Aggregation. Environ. Sci. Pollut. Res. 2023, 30, 74409–74425. [Google Scholar] [CrossRef] [PubMed]
  56. Luo, Q.; Hu, H.; Feng, D.; He, X. How does broadband infrastructure promote entrepreneurship in China: Evidence from a quasi-natural experiment. Telecommun. Policy 2022, 46, 102440. [Google Scholar] [CrossRef]
  57. Li, X.; Yang, G.; Shao, T.; Yang, D.; Liu, Z. Does digital infrastructure promote individual entrepreneurship? Evidence from a quasi-natural experiment on the “Broadband China” strategy. Technol. Forecast. Soc. Change 2024, 206, 123555. [Google Scholar] [CrossRef]
  58. Shi, J.-l.; Lai, W.-h. Incentive factors of talent agglomeration: A case of high-tech innovation in China. Int. J. Innov. Sci. 2019, 11, 561–582. [Google Scholar] [CrossRef]
  59. Sun, L.; Abraham, S. Estimating dynamic treatment effects in event studies with heterogeneous treatment effects. J. Econom. 2021, 225, 175–199. [Google Scholar] [CrossRef]
  60. Jha, C.K.; Bhuyan, R. Do financial reforms promote entrepreneurship? Financ. Res. Lett. 2020, 34, 101272. [Google Scholar] [CrossRef]
  61. Cole, R.A.; Sokolyk, T. Debt financing, survival, and growth of start-up firms. J. Corp. Financ. 2018, 50, 609–625. [Google Scholar] [CrossRef]
  62. Yang, L.; Lu, H.; Li, M. Does mobile broadband use promote smallholder entrepreneurship? Evidence from rural China. Appl. Econ. 2023, 55, 5750–5767. [Google Scholar] [CrossRef]
  63. Diaz Tautiva, J.A.; Salvaj Carrera, E.; Vásquez-Lavín, F.; Ponce Oliva, R.D. Understanding the role of institutions and economic context on entrepreneurial value creation choice. Oecon. Copernic. 2023, 14, 405–447. [Google Scholar] [CrossRef]
  64. Callon, M. Revisiting marketization: From interface-markets to market-agencements. Consum. Mark. Cult. 2016, 19, 17–37. [Google Scholar] [CrossRef]
  65. Wang, X.; Fan, G.; Yu, J. Marketization Index of China’s Provinces: NERI Report 2016; Social Sciences Academic Press: Beijing, China, 2017. [Google Scholar]
  66. Ren, H.; Li, M.; Liu, Y.; Tang, D. Research on the green innovation promoted by environmental vertical management reform: Evidence from green patents of Chinese listed companies. Appl. Econ. 2024, 56, 7169–7185. [Google Scholar] [CrossRef]
  67. Jin, Z.; Huang, C. Tax enforcement and corporate donations: Evidence from Chinese ‘Golden Tax Phase III’. China J. Account. Stud. 2021, 9, 526–548. [Google Scholar] [CrossRef]
  68. Zhang, W.; Tian, Z.; Chen, Z. The Golden Tax Project III and green innovation: Evidence from heavily polluting enterprises in China. Environ. Sci. Pollut. Res. 2023, 30, 49618–49631. [Google Scholar] [CrossRef] [PubMed]
  69. Klapper, L.; Laeven, L.; Rajan, R. Entry regulation as a barrier to entrepreneurship. J. Financ. Econ. 2006, 82, 591–629. [Google Scholar] [CrossRef]
Figure 1. The research framework.
Systems 14 00834 g001
Figure 2. GTP III rollout dates across regions.
Systems 14 00834 g002
Figure 3. Theoretical framework.
Systems 14 00834 g003
Figure 4. Dynamic effects of DTA on entrepreneurial entry. Note: The solid line connects point estimates (circles) for each period. Dashed bars represent 95% confidence intervals. The horizontal dashed line indicates zero.
Systems 14 00834 g004
Figure 5. CSDID Event Study. Note: This figure presents the event-study estimates based on the Callaway and Sant’Anna (CSDID) estimator with the doubly robust inverse-probability-weighted (DR-IPW) specification, taking not-yet-treated cities as the control group. The horizontal axis denotes event time relative to GTP III adoption, with t = 0 indicating the first year of treatment. The period t = −1 is omitted as the reference period; the leftmost estimate (t = −5) is a binned endpoint aggregating all earlier pre-treatment periods. The vertical axis reports the estimated average treatment effects on the treated (ATT(g,t)), aggregated by event time. Blue markers and the shaded band denote pre-treatment estimates; red markers and the shaded band denote post-treatment estimates. Shaded areas represent 95% confidence intervals based on standard errors clustered at the city level. The dashed horizontal line indicates zero.
Systems 14 00834 g005
Figure 6. Placebo test results. Note: Vertical axis: p-values; horizontal axis: coefficients. The curve shows the kernel density. Grey hollow dots mark p-values for each coefficient. The vertical grey dashed line indicates zero. The vertical dark red dashed line indicates the actual estimated coefficient. The horizontal red dashed line indicates the 10% significance threshold.
Systems 14 00834 g006
Figure 7. Standardized bias plot.
Systems 14 00834 g007
Figure 8. Kernel density plot of propensity scores.
Systems 14 00834 g008
Table 1. Golden Tax Project evolution.
PhaseExecution TimeCore TechKey Control FocusImpact
Phase I1994–2000Manual data entryAnti-fraud control of VAT invoicesImproved invoice legitimacy; Laid the groundwork for digital tax enforcement
Phase II2001–2013Invoice cross-verificationComprehensive VAT invoice verification and monitoring; “Three-flow matching” *Expanded tax coverage; Strengthened tax administration
Phase III2013–PresentBig data, unified platforms,
Cloud infrastructure
Data integration, Full-cycle tax transparency and governanceDeepened digital adaptation, transparency, and compliance demands
Note: * Three-flow matching = goods, funds, and invoices must align.
Table 2. Digital tax reforms and platforms: cross-country comparison.
CountryTax SystemImplementation TimeKey Features
USAModernized e-File (MeF)2004Automated tax matching, digital filing
UKMaking Tax Digital (MTD)2019 (VAT); 2024 (Income Tax)Digital record-keeping, digital filing
NorwayAlt inn i ett (Altinn)2003; upgraded 2008Pre-filled forms, one-stop service
Singapore IRAS myTax Portal
(IRAS e-Tax)
2008Pre-filled Tax Forms, SingPass Integration
South KoreaTaxpayer Information Management System (TIMS)2009Real-time data integration
LithuaniaElectronic Declaration (EDS)2015EU-compliant, corporate tax reforms
IndiaGoods and Services Tax Network (GSTN)2017Unified Pan-India Tax Compliance
KenyaElectronic Tax Invoice Management System (eTIMS)2023Automated Tax Compliance
Table 3. Variable measurements.
Variable Variable Measurement
EntNumber of new venture establishments per 100 residents in different cities.
GTPDummy variable coded as 1 when a city has rolled out the Golden Tax Project III in a specific year, and 0 in all other instances.
Ln AGDPNatural logarithm of GDP per capita.
GovRatio of government public expenditure to GDP.
TechRatio of science and technology spending in public budget outlays.
EduRatio of education spending in total public budget outlays.
FDIRatio of actually utilized foreign capital relative to GDP.
Table 4. Descriptive statistics of variables.
VariablesNMeanS.D.MinMax
Ent39481.16720.9580.095.57
GTP39480.50230.5000.001.00
Ln AGDP394810.69060.6138.4312.01
Gov39480.19600.0970.060.59
Tech39480.01650.0150.000.08
Edu39480.17680.0390.090.29
FDI39480.01640.0170.000.09
Table 5. Regression results of GTP III on entrepreneurial entry.
(1)(2)(3)(4)
EntEntEntEnt
GTP0.8655 ***0.8671 ***0.0618 **0.0678 **
(0.0345)(0.0346)(0.0283)(0.0282)
Ln AGDP −0.2078 *
(0.1089)
Gov −1.9316 ***
(0.4333)
Tech 13.2392 ***
(2.9255)
Edu −0.4334
(0.7510)
FDI −3.6630 **
(1.4722)
Cons0.7324 ***0.7316 ***1.1361 ***3.6512 ***
(0.0328)(0.0174)(0.0142)(1.2353)
City FENoYesYesYes
Year FENoNoYesYes
N3948394839483948
R20.4300.71320.76430.7782
Note: Robust standard errors (clustered at the city level) are reported in parentheses. * p < 0.1, ** p < 0.05, *** p < 0.01.
Table 6. Comparison of TWFE and Callaway–Sant’Anna (CSDID) Estimates.
(1) TWFE(2) CSDID
EntEnt
GTP0.0678 **0.065 ***
(0.0282)(0.024)
ControlsYesYes (baseline)
City FEYesYes
Year FEYesYes
N39482256
Note: Column (1) replicates Table 5 column (4). Column (2) reports the Callaway and Sant’Anna [45] aggregated ATT using doubly robust inverse probability weighting (DR-IPW), with not-yet-treated units as controls. Covariates in the CSDID specification are fixed at their pre-treatment (g − 1) values. Standard errors clustered at the city level in parentheses. *** p < 0.01, ** p < 0.05.
Table 7. Robustness test results.
PSM-DIDAdd Concurrent Policy ControlsUsing Alternative
Dependent Variable
Excluding Municipality SamplesAlternative Winsorization
(1)
Ent
(2)
Ent
(3)
Ent
(4)
Ent growth
(5)
Ent
(6)
Ent
GTP0.1129 ***0.0673 **0.0759 ***0.0630 ***0.0729 **0.0554 **
(0.040)(0.0282)(0.0287)(0.0217)(0.0284)(0.0266)
SCP 0.0120
(0.0482)
IBP 0.2761 ***
(0.0746)
Ln AGDP0.1196−0.2040 *−0.12030.0349−0.1992 *−0.1670 *
(0.143)(0.1073)(0.1067)(0.0257)(0.1078)(0.0976)
Gov−0.2885−1.8787 ***−1.5879 ***−0.2639 **−1.8996 ***−1.9468 ***
(0.527)(0.4346)(0.4292)(0.1142)(0.4399)(0.4106)
Tech12.4210 ***13.2196 ***12.5975 ***2.2917 ***13.4473 ***10.5460 ***
(3.534)(2.9141)(2.8393)(0.6278)(2.9186)(2.2586)
Edu0.3681−0.4373−0.4128−0.5119 **−0.3828−0.5290
(0.953)(0.7224)(0.7125)(0.2084)(0.7269)(0.6506)
FDI−3.4458 *−3.6866 **−3.5769 **−0.6765 **−3.6110 **−3.1213 **
(2.004)(1.4707)(1.4524)(0.3003)(1.5179)(1.3568)
Cons−0.17943.5992 ***2.6065 **−0.17343.5331 ***3.2510 ***
(1.656)(1.2101)(1.2198)(0.2964)(1.2159)(1.1027)
City FEYesYesYesYesYesYes
Year FEYesYesYesYesYesYes
N263339483948379438923948
R20.8290.77860.78230.03110.77840.7949
Note: Robust standard errors (clustered at the city level) are reported in parentheses. * p < 0.1, ** p < 0.05, *** p < 0.01.
Table 8. Mechanism analysis results.
(1)(2)(3)(4)
TalentEntFinanceEnt
GTP0.0009 **0.0636 **0.7576 **0.0457 *
(0.0004)(0.0295)(0.3190)(0.0267)
Talent 5.6695 **
(2.5010)
Finance 0.0283 ***
(0.0028)
Ln AGDP−0.0050 ***−0.1656−9.8355 ***0.0749
(0.0015)(0.1079)(1.6721)(0.0850)
Gov−0.0016−1.7408 ***−29.8957 ***−1.0360 ***
(0.0057)(0.4292)(8.1020)(0.3256)
Tech0.1485 **12.7240 ***186.9522 ***7.9296 ***
(0.0573)(2.9156)(50.3177)(2.6251)
Edu0.0113−0.85249.1237−0.7002
(0.0121)(0.7127)(14.5763)(0.5603)
FDI−0.0388−3.9058 **−85.0732 ***−1.2614
(0.0330)(1.5236)(27.6600)(1.1793)
Cons0.0638 ***3.1697 ***123.4405 ***0.1042
(0.0167)(1.2197)(19.3251)(0.9599)
City FEYesYesYesYes
Year FEYesYesYesYes
N3794379439483948
R20.71290.78090.91270.8087
Note: Robust standard errors (clustered at the city level) are reported in parentheses. * p < 0.1, ** p < 0.05, *** p < 0.01. We also examined whether a Sun and Abraham [59]-style staggered-adoption estimator could be implemented for the mechanism analysis. However, given the structure and support of the mechanism variables, this approach is not feasible in our setting. We therefore report TWFE-based mechanism regressions and interpret them as supplementary evidence on potential channels.
Table 9. Results of heterogeneity analyses.
(1)(2)(3)
EntEntEnt
GTP−0.1566 ***−0.0126−0.0045
(0.0398)(0.0355)(0.0443)
GTP_DI0.4289 ***
(0.0572)
GTP_AL 0.6070 ***
(0.1213)
GTP_Legal 0.2354 ***
(0.0816)
LnAGDP0.0548−0.1024−0.1599
(0.1014)(0.1062)(0.1240)
Gov−1.3069 ***−1.4891 ***−1.8965 ***
(0.4086)(0.3887)(0.5350)
Tech11.6944 ***10.9709 ***11.8995 ***
(2.7619)(2.9975)(3.0045)
Edu−0.4774−0.7487−0.2570
(0.6918)(0.6675)(0.8612)
FDI−1.8348−2.7270 *−2.8269 *
(1.4137)(1.5229)(1.6404)
Cons0.73252.5186 **3.2640 **
(1.1419)(1.2018)(1.3973)
City FEYesYesYes
Year FEYesYesYes
N394839483280
R20.80590.80580.8027
Note: Robust standard errors (clustered at the city level) are reported in parentheses. * p < 0.1, ** p < 0.05, *** p < 0.01. The main effects of all heterogeneity dummies are absorbed by city fixed effects because they are time-invariant, and therefore are not reported.
Disclaimer/Publisher’s Note: The statements, opinions and data contained in all publications are solely those of the individual author(s) and contributor(s) and not of MDPI and/or the editor(s). MDPI and/or the editor(s) disclaim responsibility for any injury to people or property resulting from any ideas, methods, instructions or products referred to in the content.