2. Literature Review
In recent decades, the literature has evidenced greater importance on the interdependence between corporate governance and environmental factors, facilitating the crystallisation of the fundamental concept of corporate environmental governance. This concept is intrinsically linked to the systemic risks generated by climate change, a phenomenon that has led to increased vigilance on both government authorities and stakeholders.
Although academic discourse proposes a multitude of definitions, there is consensus on the role of environmental governance as a structural pillar of sustainability. This transcends the simple execution of the company’s activities, fundamentally targeting its organisation and strategic orientation. Given the composite nature of the concept, a separate analysis of the two constituent elements, corporate governance and sustainability, is imperative.
Corporate governance is defined as the set of organisational mechanisms, rules, and responsibilities, involving a complex process of distributing control and resources among key actors, such as the board of directors, management, and other stakeholders with significant roles in corporate decisions in terms of funding or development strategies. The fundamental goal is to align their interests to mitigate potential tensions and divergences [
1]. A robust corporate governance system ensures the efficient allocation of resources and the optimisation of strategic decision-making, thereby stimulating the company’s performance and competitiveness.
The environmental and sustainability dimension refers to a set of rules and behaviours aimed at minimising the negative externalities of economic activity on ecosystems and society. This dimension is materialised through the implementation of products, processes, and policies aimed at energy efficiency, waste reduction, the use of renewable resources, and the adoption of environmental management systems [
1].
In summary, environmental corporate governance is an integrated system of rules, practices, and processes designed to operationalise and ensure the fulfilment of the sustainability commitments made by the organisation.
Sustainability became a priority on the agenda of international bodies and governments for over three decades. The conceptual origins of this approach can be found in the Brundtland Report from 1987, being subsequently institutionalised by the United Nations Framework Convention on Climate Change (UNFCCC), which laid the foundation for inter-state and corporate collaboration [
2]. This initiative was followed by the Kyoto Protocol (1997), a landmark that set binding emission-reduction targets for industrialised countries [
3].
In response to these imperatives, the European Union operationalised the EU ETS (Emissions Trading System), a market mechanism to control emissions and allow for the trading of certificates that grant the right to emit a limited amount of greenhouse gases.
The Paris Agreement (2015) was a turning point in global climate governance. It set the goal of limiting global warming to a maximum of 2 °C and introduced voluntary and transparent reporting mechanisms [
4]. At the same time, trading mechanisms were strengthened by the Carbon Border Adjustment Mechanism (CBAM), an instrument designed to discourage “carbon leakage” to jurisdictions with more lax regulations.
Since 2016, companies have progressively integrated environmental, social, and governance (ESG) factors, highlighting the necessity for corporate transparency. This trend has been regulated by the EU Taxonomy, which standardises the reporting and classification of sustainable economic activities. The strategic framework was finalised in 2019 with the European Green Deal, which set out the EU’s roadmap to climate neutrality. The global momentum was boosted in 2020 by the United States’ re-entry into the Paris Agreement, and in 2021, the financial sector aligned itself with these goals through the Net Zero Asset Owner Alliance, strengthening the intrinsic link between investment decisions and sustainability.
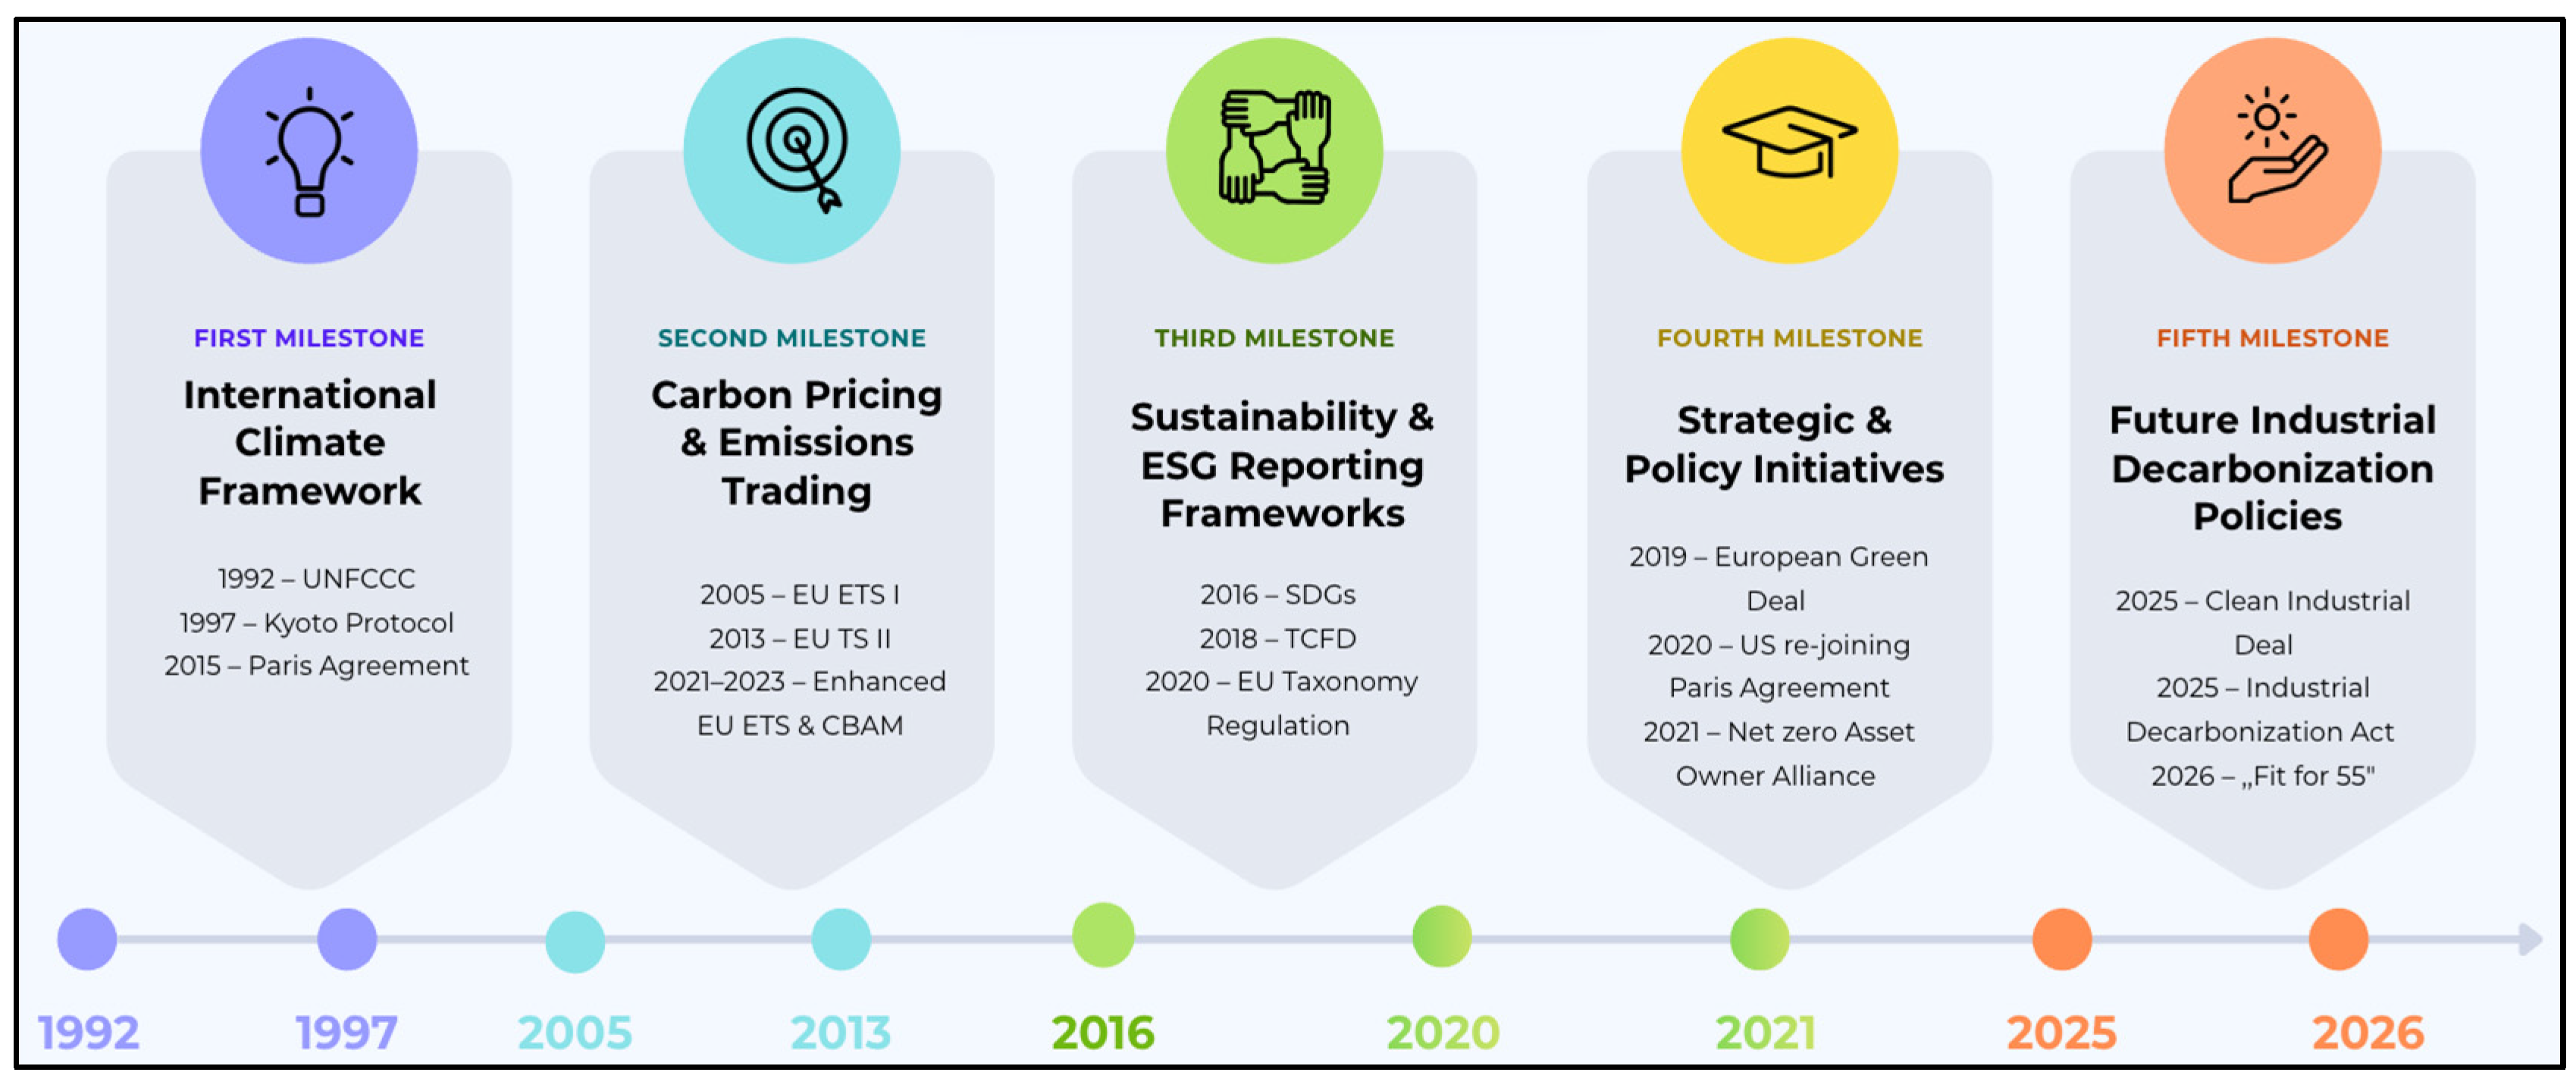
The recent medium-term outlook (2023–2025) anticipates the maturity of global industrial decarbonisation policies, as presented in
Figure 1. This includes the full implementation of ESG regulations and new initiatives, such as the Clean Industrial Deal, which primarily targets heavy economic sectors and the energy industry. These measures complement the “Fit for 55” legislative package, through which the European Union is making a firm commitment to reducing greenhouse gas emissions by at least 55% by 2030.
To mitigate environmental degradation, governments are adopting two distinctive approaches: on the one hand, they are stimulating the transition to green energy sources by granting state subsidies to polluting industries, and on the other hand, they are imposing strict regulations on sectors such as mining and oil. In this context, sector-specific characteristics have a decisive influence on ESG (Environmental, Social, and Governance) performance. Companies exploiting renewable energies tend to perform better, thanks to their low carbon footprint, while organisations operating in the extractive industry are perceived as highly susceptible to risks, being subject to major pressure from stakeholders and a more rigid legislative framework.
Given this risk exposure, it is imperative to identify and implement a robust governance framework that integrates environmental and social practices, with an emphasis on transparency and accountability in managing environmental risks, especially for companies in the oil and gas sector [
5]. At the same time, energy sector players need to strengthen their relationship with stakeholders to operationalise cost-effective environmental practices. These measures can not only optimise financial and social outcomes but also contribute to strengthening corporate reputation, facilitating access to capital, and reducing carbon-related costs.
A central issue addressed in the literature concerns the methodology employed to assess the existence and effectiveness of corporate environmental governance. In this regard, research highlights various relevant indicators. The main assessment tool is through ESG scores, which aggregate environmental (E), social (S), and governance (G) factors. These indicators provide an overview of a company’s commitment to sustainability, social responsibility, and organisational ethics, allowing these dimensions to be correlated with financial performance.
A reference example is the methodology used by Thomson Reuters (currently Refinitiv/LSEG ESG Scores), which calculates this score annually using a specific weighting of the three pillars: 34% for environmental indicators, 35.5% for social indicators, and 30.5% for governance indicators [
6]. As a result, companies that publish ESG reports and achieve high scores are perceived by the market as having a low risk profile and superior investment attractiveness [
7], validating their status as socially responsible investments.
Although the integration of ESG factors into corporate governance was a fundamental step towards achieving the UN’s 17 Sustainable Development Goals (SDGs) by 2030, transparency and disclosure of ESG scores are the essential vector for effective alignment with sustainability goals [
8].
The literature highlights a complex bidirectional relationship between performance and transparency. On the one hand, it analyses the impact of corporate social performance on the degree of disclosure, and on the other hand, how transparency influences organisational performance. In this context, research validates two distinct theoretical perspectives. The first one related to voluntary disclosure theory, which confirms a positive correlation between ESG disclosure and environmental performance, where high-performing companies tend to be more transparent. The second perspective is legitimacy theory, which suggests a possible negative relationship, arguing that disclosure is often a compliance reaction to regulatory and legal pressures, regardless of actual performance [
9]. Awareness of the importance of sustainability has generated significant pressure to expand reporting beyond financial aspects. The main determinants of non-financial disclosure include maximising the market value of the firm, accessing financial benefits, responding to investor and societal demands, and achieving a sustainable competitive advantage [
8].
The strategic decision regarding the transparency of sustainability actions is intrinsically linked to the composition and characteristics of the board of directors (BoD). Empirical studies confirm a strong interconnection between the profile of BoD members, with reference to cultural aspects, educational level, gender, and the quality of ESG reporting, including environmental, social, and governance metrics. For example, studies using Hofstede’s cultural dimensions demonstrate that companies in countries characterised by low power distance have superior environmental performance and a greater predisposition towards Corporate Social Responsibility (CSR) transparency [
9]. At the same time, individualistic cultures favour corporate social performance, while collectivist cultures are more oriented towards the process of information disclosure. The gender composition of the BoD has a decisive influence on social performance and governance decisions. The presence of women in management structures is associated with a focus on cooperation, prioritising organisational goals, and protecting corporate reputation, to the detriment of immediate personal gains [
10]. Research confirms that gender diversity on boards enhances ESG performance, provided that female members have legitimate status on the board. At the same time, structural balance is essential; a female majority can, paradoxically, mitigate the positive effect on the relationship between female committee leadership and ESG performance [
10]. In conclusion, the architecture of the Board of Directors is inextricably linked to decision-making strategy, risk management, and the promotion of ESG practices [
8]. Furthermore, the literature emphasises the importance of female presence not only at the board level, but also in committees specialising in ESG issues or in key departments (governance, finance, human resources). This strategic distribution correlates positively with the likelihood of voluntary disclosure and contributes to better stakeholder satisfaction [
11].
Sustainability has become an important factor in strategic decisions for all companies in all economic sectors, especially in the energy sector. Differences between companies, the structure of management committees, and the strategies adopted have a significant impact on ESG performance, and in this regard, corporate governance must target sustainability commitments together with governments that can either penalise or incentivise companies through their decisions.
Large polluter companies, especially those in the oil and mining sectors, must take responsibility for sustainable governance [
12], and in the absence of external pressure, they no longer have the motivation to carry out and implement actions aimed at protecting the environment. In this sense, governments play the role of “two hands” in environmental governance: a punitive hand that imposes pollution or environmental taxes, and a “supportive hand” that offers incentives to companies that meet environmental standards [
12].
The literature analyses the impact of sanctions and subsidies, concluding that they are heterogeneous instruments with distinct effects on the relationship between sustainability and performance. He et al. [
12] highlight a notable paradox: environmental sanctions significantly stimulate companies’ green investments, acting as an internal constraint on capital allocation. In contrast, environmental subsidies often fail to translate into effective environmental governance and have little impact on corporate investment. The main cause identified is the lack of rigorous government mechanisms to monitor and evaluate the use of these funds, which leads to the allocation of substantial resources without generating the expected environmental effects. To balance economic development with environmental protection, Ying and Jin [
13] propose a taxonomy of environmental regulations, identifying three major categories: command-and-control environmental regulation, achieved through administrative sanctions imposed on polluting companies; market-based environmental regulation, which reduces environmental pollution mainly by adjusting taxes and financial subsidies; and voluntary participatory environmental regulation, based on self-regulation by businesses. Although strict regulations can generate additional production costs in the short term, reducing productive capacity, they have the potential to stimulate energy efficiency and the adoption of green technologies in the long term. This phenomenon favours attracting foreign investment and the ecological transformation of industries, demonstrating that, in the energy sector, compliance with environmental standards can coexist with economic performance through the adoption of rigorous internal policies. The indicators used to measure corporate environmental governance serve as an essential metric for analysing the correlation between sustainability and performance, validating existing theoretical foundations. A high ESG score, transparency in reporting, and alignment with national and international regulations confirm stakeholder theory, emphasising that sound environmental governance directly contributes to improving the overall performance of the enterprise. At the same time, from the perspective of legitimacy theory, companies that assume environmental responsibilities, demonstrated by verifiable indicators, validate their status in the eyes of society and investors. This legitimacy facilitates access to favourable resources, including tax incentives, increases competitiveness, and strengthens corporate reputation. This mechanism is also applicable in heavy industries. A recent study [
14] on the mining sector demonstrates that the greening of polluting industries is achievable through the convergence of three factors: the implementation of effective environmental management methods, increased subsidies and preferential loans, and the acceleration of the transition to new energy sources. These cumulative conditions allow for profitability to be achieved while actively committing to environmental protection.
The literature offers a multidimensional perspective on the relationship between environmental corporate governance and organisational performance. Although the dominant premise validates the hypothesis of a positive impact on financial performance and environmental responsibility, there are also divergent theoretical positions.
From the geographical point of view, the largest share of research studies refers to Asia, emphasising a context justified by strict government imperatives against a backdrop of industrialisation with a major impact on the environment. Thematically, the research is structured around two main axes: analysing the impact of governance on performance (financial and environmental) and evaluating moderating factors, such as state intervention, board architecture, sector specificity, and transparency standards in reporting.
The first thematic axis identified in the literature investigates the causal relationship between corporate environmental governance (CEG) and financial performance. A landmark study in this regard is that conducted by Chin et al. [
15], proposing a comparative analysis between two economies with distinct governance profiles: Japan (mature) and China (emerging). The research examines how environmental commitments translate into profitability. The methodology of this study is distinguished by the use of non-standard methods of quantifying environmental governance, including indicators such as emission prevention practices, transparency of sustainability reports, and CSR strategies, as opposed to conventional approaches focused strictly on CO
2 emissions. The impact of these strategies on profitability was assessed using established financial indicators, and results reveal a dichotomy. For Japan, they confirm a positive correlation and a bidirectional relationship: the adoption of robust environmental governance generates superior financial performance, and financially successful companies demonstrate increased sustainability. Accordingly, environmental protection becomes a real competitive advantage, with the market rewarding environmentally friendly behaviour. In the case of China, a “CSR paradox” is observed, with short-term relationships evidenced as weak or non-existent: the costs of implementing extensive social responsibility strategies tend to outweigh the immediate economic benefits, suggesting an initial negative correlation.
Previous studies’ limitations [
15], particularly the omission of the impact of post-COVID policies and external institutional pressures, are addressed by Yassin et al. [
16]. They propose a model in which environmental performance acts as a mediator between corporate governance and financial success, extending the analysis to emerging economies in the East, focusing on several highly polluting sectors (manufacturing, extractive, and chemical). The conceptual model integrates three pillars: corporate governance (measured by board independence and shareholder structure), environmental performance (a composite index based on the Global Indicators Report), and innovation (R&D expenditure and employee training). The conclusions prove that strong governance positively influences returns on assets and share price, with innovation serving as a channel between. For companies in emerging economies, investment in research and development is not much of a cost but more of a critical enabler for monetising environmental responsibility.
Although the studies mentioned above offer a broad macroeconomic or sectoral perspective, Tang et al. [
17] refine the analysis by focusing exclusively on highly polluting companies, addressing a specific gap in the literature. The authors’ central objective is to investigate the synergistic effect of environmental protection spending and green technology innovation on financial performance (measured by return on assets). The econometric model uses independent variables such as environmental expenditures and innovation (patents/green R&D investments), controlling for company size, capital structure, and organisational maturity. Results highlight critical nuances and show that strict environmental protection expenditures have a significant negative effect on current financial performance, with compliance costs eroding immediate profits. Furthermore, innovation in green technologies has a significant positive effect, partially validating Porter’s hypothesis that innovation induces operational efficiency, and the synergistic effect is validated, confirming that combining environmental spending with innovation mitigates the negative impact of compliance costs. The main conclusion converges towards the idea that technology and innovation are decisive contextual factors that strengthen the relationship between environmental governance and financial performance. The strategic recommendation drawn from this study [
17] is that companies should move from the simple compliance policy to proactive strategies, preventing pollution through innovation.
The second thematic axis identified in the literature investigates the direct correlation between companies’ environmental governance mechanisms and their climate output or environmental performance. The preferred theoretical basis for explaining this relationship is the Resource-Based View, often consolidated by Agency Theory. These conceptual frameworks provide the necessary perspective to understand how internal resources and capabilities, integrated into rigorous environmental management, contribute to achieving a sustainable competitive advantage and optimising environmental performance. A landmark study that addresses this issue from a nuanced perspective was conducted by Irshad et al. [
18], whose research proposes a scenario-based analysis, with the aim of observing differentiated governance mechanisms depending on the pre-existing level of environmental performance (low versus high). The study focuses on companies in the USA, operating in both highly polluting industries and sectors with low impact, including energy, utilities, manufacturing, and pharmaceuticals. From the methodological point of view, the rigour of the research is ensured by the generalised method of moments, an essential econometric tool for mitigating endogeneity problems and ensuring the robustness of the results. Environmental performance was quantified using ESG scores extracted from the Thomson Reuters database. The methodological innovation consists of compiling the BAHES (Best Available High Environmental Sustainability) scenario. This scenario isolates companies that record a positive deviation of the weighted average environmental score from the global sample average. Therefore, these organisations are classified as having a high level of sustainability, positioning themselves above the benchmark. Corporate governance has been integrated in the form of a complex composite index, which aggregates dimensions such as protection of shareholder rights, effectiveness and activity of the board of directors, architecture of specialised committees, board structure, transparency of financial reporting, and strategic integration of non-financial objectives. The empirical results obtained confirm the hypothesis that the effectiveness of corporate governance is not uniform but varies significantly depending on the sustainability scenarios analysed. For companies with low environmental performance (intensive polluters), governance acts predominantly under external pressure. In this context, the independence of management committees becomes a critical factor, with governance functioning as a coercive or punitive mechanism designed to ensure minimum compliance with the required standards. For companies with high environmental performance, success is conditioned by the allocation of strategic resources, innovation capacity, and management diversity. A distinctive element highlighted is the role of the environmental committee. The study confirms that the existence and activity of this committee have a positive impact in all the scenarios analysed, but the magnitude of the impact is greatest in companies that are transitioning from an average level of performance to a higher one. The added value of the study lies in refuting the idea of a universally valid (one-size-fits-all) governance strategy. Strategies must be adapted to the ecological maturity of the organisation: companies in their early stages require rigorous control and monitoring mechanisms, while advanced companies benefit from mechanisms that support and stimulate innovation.
Recent research in the literature revisits a fundamental debate regarding the ontological nature of corporate environmental governance: is it a mandatory compliance mechanism or a strategic voluntary initiative? This question is at the heart of a recent study investigating whether environmental regulatory pressure acts as an inhibitor or, conversely, as a catalyst for Corporate Social Responsibility (CSR). The research proposes a rigorous methodological approach, in which the corporate environmental governance (acting as independent variable) is operationalised through a composite index. The construction of this index is based on awarding a cumulative score for the existence of ISO 14001 [
19] certification, the complexity of the organisational structure dedicated to the environment, internal regulations, as well as environmental education and training programmes. In contrast, the dependent variable, corporate social responsibility performance, is quantified using the Hexun CSR score, an assessment tool specific to the Chinese capital market, recognised for the granularity of the data it provides. The empirical results contest the hypothesis of a long-term “destructive dilemma”, demonstrating that rigorous environmental governance not only supports social initiatives but actively promotes corporate social responsibility. The mechanism identified suggests a chain of causality in which environmental regulatory pressure forces firms to adopt superior governance structures. Although initial compliance generates costs, external pressure stimulates innovation. Innovation leads to increased operational efficiency and company expansion, which are necessary to support more complex and comprehensive corporate social responsibility. However, the study identifies a persistent methodological and conceptual gap related to the difficulty of distinguishing between genuine and symbolic corporate social responsibility, a phenomenon known as greenwashing. In the absence of precise methods of discrimination, there is a risk that certain governance actions are merely “window dressing”.
Another critical area for future research concerns the need for a comparative analysis of the role of the state in the environmental governance–CSR relationship. There is a theoretical assumption that, in Western economies, this responsibility is predominantly voluntary and governed by market mechanisms, in contrast to Asian markets, where corporate behaviour is strongly shaped by state interventionism and strict government regulations.
The effectiveness of corporate environmental governance is intrinsically linked to several contextual and organisational factors, including managerial planning, the ecological expertise of management members, and company history. The literature extensively investigates the impact of these variables on environmental performance, highlighting complex transmission mechanisms.
Research also isolates the impact of corporate leaders’ previous experience in environmental governance on the adoption of green management practices, while analysing the moderating effect of contextual variables such as company age and financial performance [
20]. If the research focuses on energy-intensive sectors (automotive, energy, and manufacturing) it offers nuanced results. Conclusions indicate that the impact of the CEO’s environmental experience is positive but strongly conditioned by context. Sustainability-oriented management succeeds in implementing green practices primarily in young and financially successful companies. In contrast, within mature or financially troubled organisations, managerial influence is limited, either due to organisational inertia and resistance to change or due to resource constraints. Results also prove that the environmental experience of board members is much more robust, exerting a constant positive influence on the adoption of green practices, regardless of the age or financial health of the company. These findings underscore that environmental governance is inextricably linked to the higher governance structure and shareholder engagement. However, a methodological limitation was the biographical data of the CEO or board members as a proxy measure for experience. Therefore, the approach does not necessarily guarantee an intrinsic commitment to the environment but mostly reflects previous exposure to sustainability issues.
Another line of research focuses on formalising governance structures, raising the question of whether establishing environmental committees at the board level enhances environmental performance or not. Companies that allocate resources and establish a formal structure dedicated to the environment at the board level tend to perform better. More specifically, previous research reveals that an environmental committee, acting as a superior mechanism compared to simply appointing an environmental manager at the executive level, creates a structure with a strong signal about organisational commitment and ensures strategic and constant monitoring of climate risks and opportunities [
21].
Corporate environmental governance also involves the ability to attract external resources, such as government subsidies, to catalyse environmental performance. A previous study [
22] hypothesises that subsidies work by easing financial constraints, allowing firms to invest in clean technologies, which subsequently improve environmental impact. A distinctive feature of this study is the methodology used to measure environmental performance: unlike research employing standardised ESG scores, the authors qualitatively assess environmental protection strategies (targets set, management systems implemented, education and training, emergency mechanisms, and awards received). Results validate a direct positive impact: environmental subsidies have the potential to significantly reduce pollution at the level of subsidiary companies. The explanatory mechanism is, once again, reflected by technological innovation, with subsidies increasing R&D capacity, and implicitly leading to a reduced ecological footprint.
The literature is making significant progress in elucidating the link between corporate environmental governance and environmental and financial performance. However, the critical analysis of existing studies reveals geographical, methodological, sectoral, and contextual limitations. The first limitation observed is geographical, proving that the incidence of research depends on the origin of the scientific researchers, the research areas, and the sectors overviewed. An analysis of the studies reveals Asia as the predominant region, particularly advanced economies such as China and Japan, which actively implement corporate environmental governance strategies and are mature in terms of sustainability. The same trend can be observed in the emerging economies of the East. The paradox is the low incidence of research on European countries, precisely because the integration of environmental governance strategies clearly brings benefits, and research is focused on identifying the factors that stimulate environmental governance. The same trend is evident in the United States. Another critical limitation revealed from the literature analysed is the institutional bias. Studies focusing on China [
23] or the USA [
18] prove differences across systems when they are characterised either by strong state interventionism or by free market mechanisms.
Several methodological gaps were revealed, such as the dichotomy between “disclosure” and “actual performance”, where robust corporate governance often leads to increased transparency in reporting but does not guarantee an effective reduction in environmental impact (e.g., carbon emissions). Most current studies employ ESG or CSR composite scores (e.g., Hexun, Thomas Reuters, Asset4) as a proxy for environmental performance. There is a lack of integration of corporate governance within EU-specific regulatory frameworks, such as the European Green Deal or the Emissions Trading System (EU-ETS). The study reviewed for the importance of subsidies [
22] treat public policies as generic control variables, without investigating how specific governance mechanisms (e.g., the board’s climate experience) interact with the pressure of strict climate regulations. It is not sufficiently explored whether digitalisation acts as a facilitator of compliance with these new transnational climate regulations.
Aggregate scores can mask operational reality, being susceptible to greenwashing or the subjectivity of rating agencies. There is an acute need for research that uses quantifiable physical indicators (carbon intensity, actual energy consumption) instead of perception scores. Second, there is insufficient management of endogeneity and complex causality. Although Yassin et al. [
15] propose a mediation model, most cross-sectional studies capture a static “snapshot”, failing to explain temporal dynamics. Longitudinal studies capturing the transition from standard governance to sustainability-oriented governance are still rare. Furthermore, measuring innovation remains problematic. As shown in the analysis by Yassin et al. [
15], innovation can be measured by inputs (R&D expenditure), which does not necessarily reflect the efficiency of the results (outputs such as valid green patents or revenues from sustainable products), an aspect highlighted as a limitation in capturing the real impact of digital transformation.
There is a significant lack of studies on energy-intensive sectors in service economies or the environmental impact of the digital sector itself. Of course, phenomena such as digitisation and digital transformation are not sufficiently differentiated in the literature between the impact of environmental governance in “brown” industries (chemicals, energy) and in “digital” industries, where the carbon footprint is indirect (data centres, logistics chains). It is unclear whether effective governance mechanisms in factories (e.g., environmental safety committees) are replicable or relevant in technology or financial services companies.
The literature review establishes corporate environmental governance as an essential strategic pillar, confirming its positive impact on financial performance, often mediated by innovation and social responsibility. However, current research remains fragmented, dominated by studies of Asian and American companies, focused on heavy industries and based predominantly on perceived ESG scores, which might mask the actual performance. Consequently, this geographical imbalance in the literature creates a significant empirical gap, as findings from Asian [
14,
15,
16,
17,
20,
21,
22] and U.S. [
18] markets emphasise distinct governance styles. On the one hand, Asian studies frequently highlight top-down government pressure, while on the other hand, U.S. research focuses predominantly on stakeholder and investor-driven demands. These findings cannot be directly extrapolated to the European Union, which operates under a fundamentally different and stringent framework of mandatory non-financial disclosure and carbon pricing. Therefore, by focusing exclusively on EU energy-intensive industries, this study provides a regional assessment that introduces a distinct novelty within the literature. Our research integrates a theoretical framework focused on greenhouse gas emissions, as indicators of sectoral subsystem dynamics: the carbon dioxide (CO
2), with its higher economic elasticity and stronger policy responsiveness, reflects a more responsive and sensitive mitigation pathway, whereas the methane (CH
4) and nitrous oxide (N
2O) emissions could signal a more rigid subsystem, from agriculture, where financial constraints and behavioural inertia delay structural changes.
Greenhouse gas emissions are strongly linked to the concept of Life Cycle Assessment (LCA) methodologies, one of the most established frameworks for evaluating environmental impacts across a product’s life cycle. LCA relates all material and energy inputs and outputs to their corresponding environmental impacts, expressed as the amount of emissions, waste, or reduced resources. While LCA is indispensable for operational and product-specific assessments due to its granular and micro-level approach, our analysis is focused strictly on a panel dataset across EU member states to capture the macro-sectoral perspective. Additionally, recent publications critically examine life cycle approaches when extended to the analysis of social and economic dimensions of sustainability [
24]. Consequently, conducting a comprehensive LCA analysis at a macroeconomic scale across multiple EU countries would require prohibitive resources and be highly time-consuming, expensive, and subject to significant data uncertainties.
Building on the literature, we conceptualise these differences as distinct decarbonisation regimes, driven by technology, finance or regulation, and integrated by investment flows, sectoral adaptability, and regulatory stringency. Accordingly, our main hypothesis considers that environmental governance is significantly associated with sectoral performance and pollution intensity across EU member states. However, we expect the relationship to vary by sectors, emissions, and regulatory context.
3. Methodology and Data
This research tries to evaluate the ways in which corporate environmental governance practices in key sectors correspond to their pollution intensity and economic output, treating firms, sectors, and national climate regimes as interconnected subsystems within the broader EU sustainability architecture. Due to data limitations and with a focus on energy-intensive industries, we decided to overlook four industries, industrial (Ind.), manufacturing (Manuf.), agricultural (Agri.), and services (Serv.), whose distinct input–output structures and institutional logics generate on sectors specific feedback between governance, emissions, and value added. As climate change proxies, we chose gas emissions and the share of renewable energy use to capture the primary drivers and mitigators of global warming in the EU countries. While CO2 dominates the long-term global warming, CH4 and N2O derived from agriculture and waste add a possible short-term effect, especially in terms of ozone reduction, reflecting sectoral pollution intensity tied to value added. Renewable energy is introduced as a proxy for mitigation progress, while renewables displace fossil fuels, avoiding emissions, though they have limited integration, as we move towards decarbonisation as the EU’s neutrality goal. However, we expect limited integration across sectors within the rate and coherence of decarbonisation, due to the multi-level governance frameworks aligning corporate behaviour, finance, and technological pathways.
In
Table 1, we illustrate details on the variables included in the analysis. We add that our panel dataset comprises annual data on EU member states across four key sectors, with sectoral value added (% GDP) as the core independent variable driving emissions. Dependent variables refer to CO
2, CH
4, and N
2O emissions (key GHGs linked to pollution intensity), while the renewable energy share (% total final consumption) is added as a control for mitigation effects, alongside economic drivers of development from the stock market capitalisation of listed domestic companies. The period observed is 2000–2021.
The methodology involves several stages of econometric analysis. We start by testing the ordinary least squares (OLS) for baseline associations between the sectoral value added and each variable of gas emissions, then test for fixed-effects (FE) and random-effects (RE) models, followed by the Hausman test to choose between the latter two. The final stage includes the dynamic model (generalised methods of moments—GMM) for endogeneity, persistence (considering lagged values of gas emissions), and cross-country variations, capturing how the elasticity of the value added persists. We expect the GMM instruments to better emphasise the changes in emissions, while we also want to employ the roles of renewable energy, and the potential of investments and economic and financial development.
The regression model starts by considering one independent variable, depending on the energy-intensive sectors, and it is further developed by including as control variables the renewable energy and market capitalisation indicators.
where i = 1…27 (the EU countries), t = 2000…2021 (the year in the period analysed), α is the constant, β is the regression coefficient and ε is the standard error.
Emissions refer to carbon dioxide (CO
2emiss), methane (CH
4emiss), and nitrous oxide (N
2Oemiss), defining three regression models. Furthermore, the value added will refer to the four sectors previously mentioned (and noted Ind.VA, Manuf.VA, Agri.VA, and Serv.VA). Then, to test the consistency of the influences of sectors on gas emissions, we develop the model as follows, including the control variables:
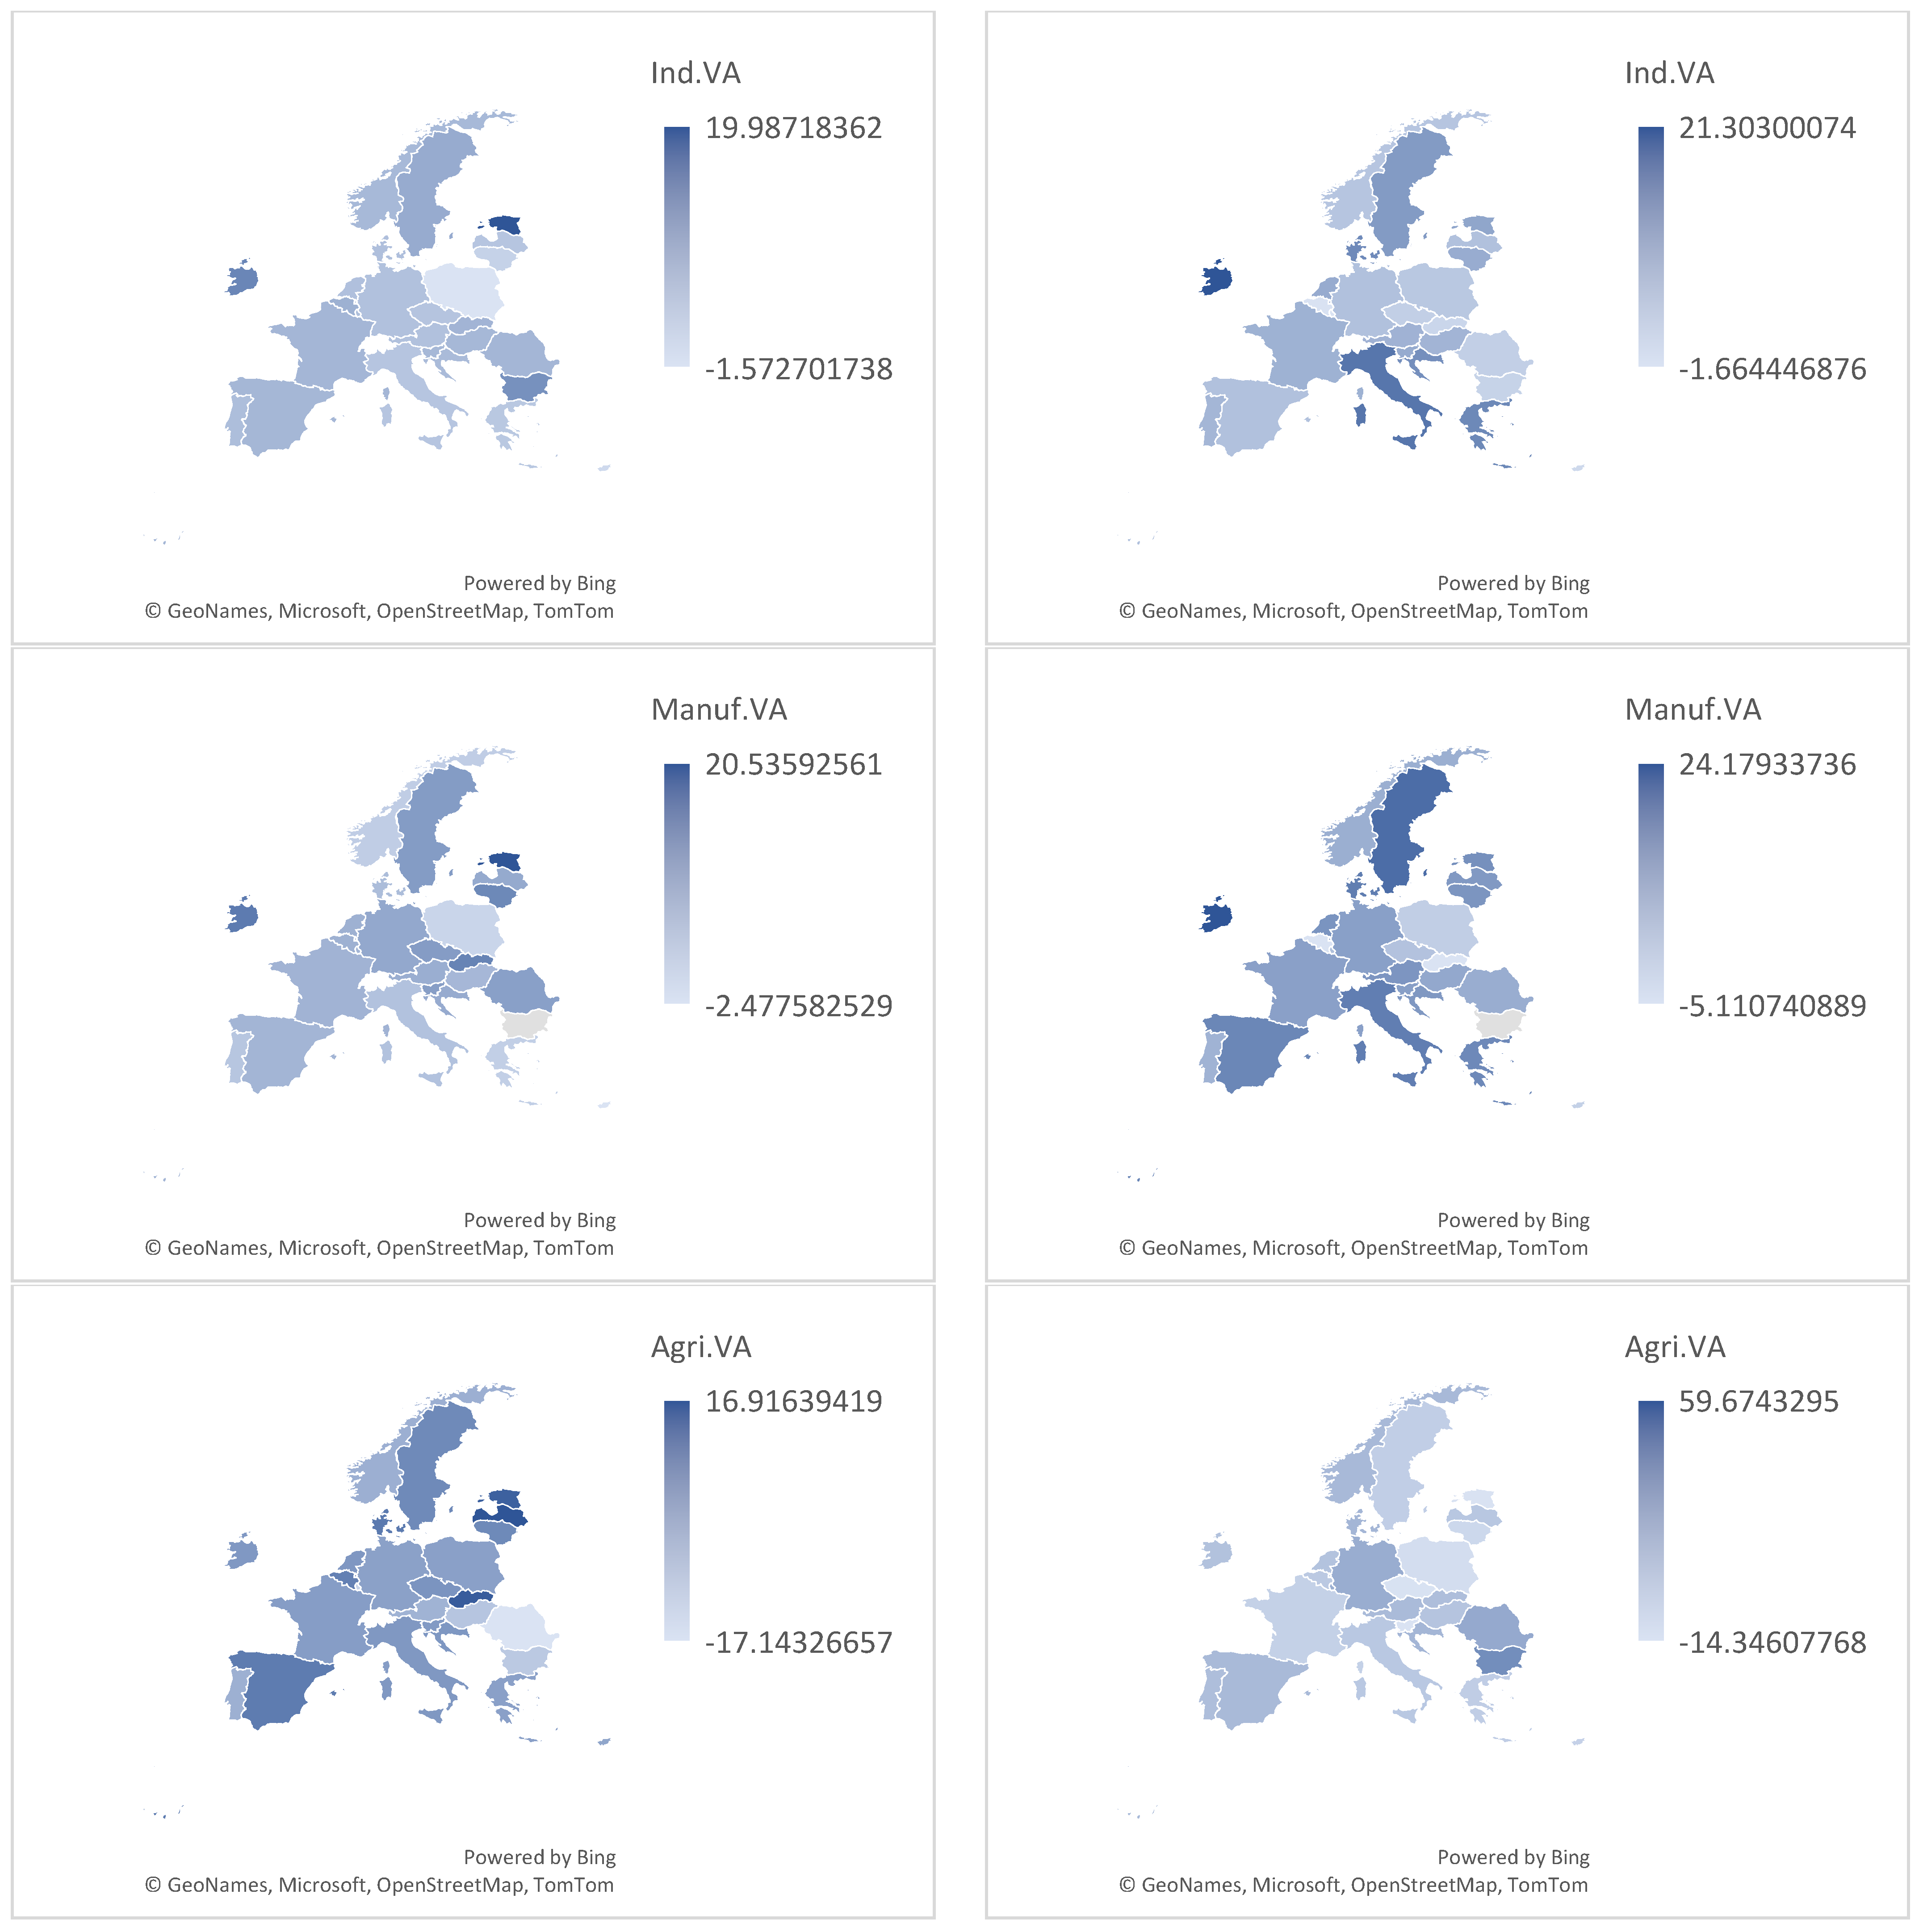
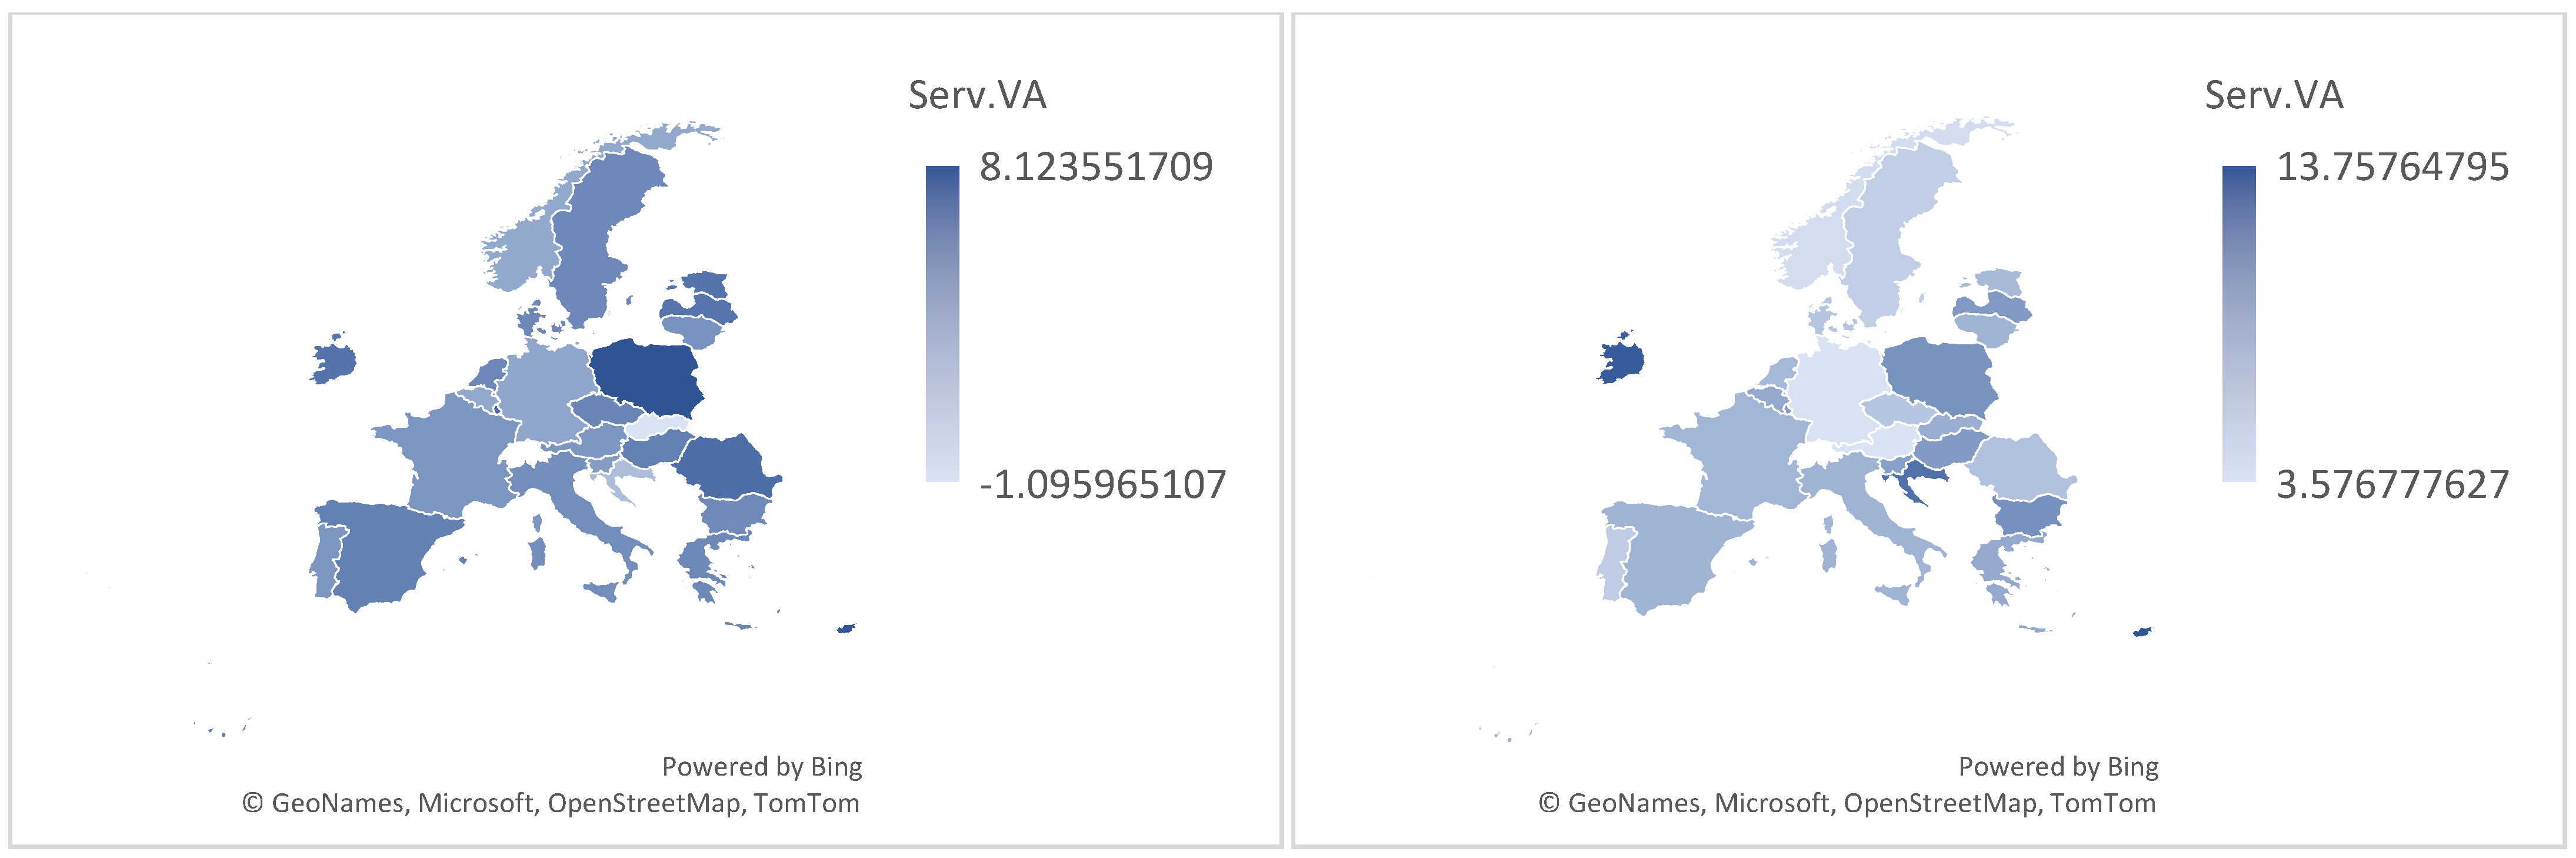
First, we observe the net output of each sector after subtracting intermediate inputs, obtaining essentially the economic contribution of each sector to GDP, across two years, 2000 and 2021. The % changes across the net outputs of distinctive sectors—industrial value added (Ind.VA), manufacturing value added (Manuf.VA), agricultural value added (Agri.VA), and services value added (Serv.VA)—are shown in light to darker blue, on a scale basis, within the EU countries, in the graphs presented in
Figure 2.
Figure 2 reveals important structural changes in the EU economies across the two reference years, with sectoral value added evolving unevenly over time. The highest difference in level across the EU member states is evidenced by the agricultural value added, followed by manufacturing. Additionally, the former presents a very large increase in the net output, from 2000, when the maximum increase from the previous year, of approximately 17%, was reported in Latvia, until 2021, when Malta registered an increase in Agri.VA of approximately 60%. Furthermore, countries leading in agricultural value added (e.g., Latvia or Slovakia) in 2000 significantly diminished their agricultural focus by 2021, not indicating a large increase in any other sector included in this analysis, as compensation. For Italy and Ireland, we observe a significant increase in the industrial, manufacturing and services value added across time. These changes support the study’s focus on sector-specific environmental performance, since differences in economic weight across sectors may translate into distinct pollution intensities and decarbonisation challenges.
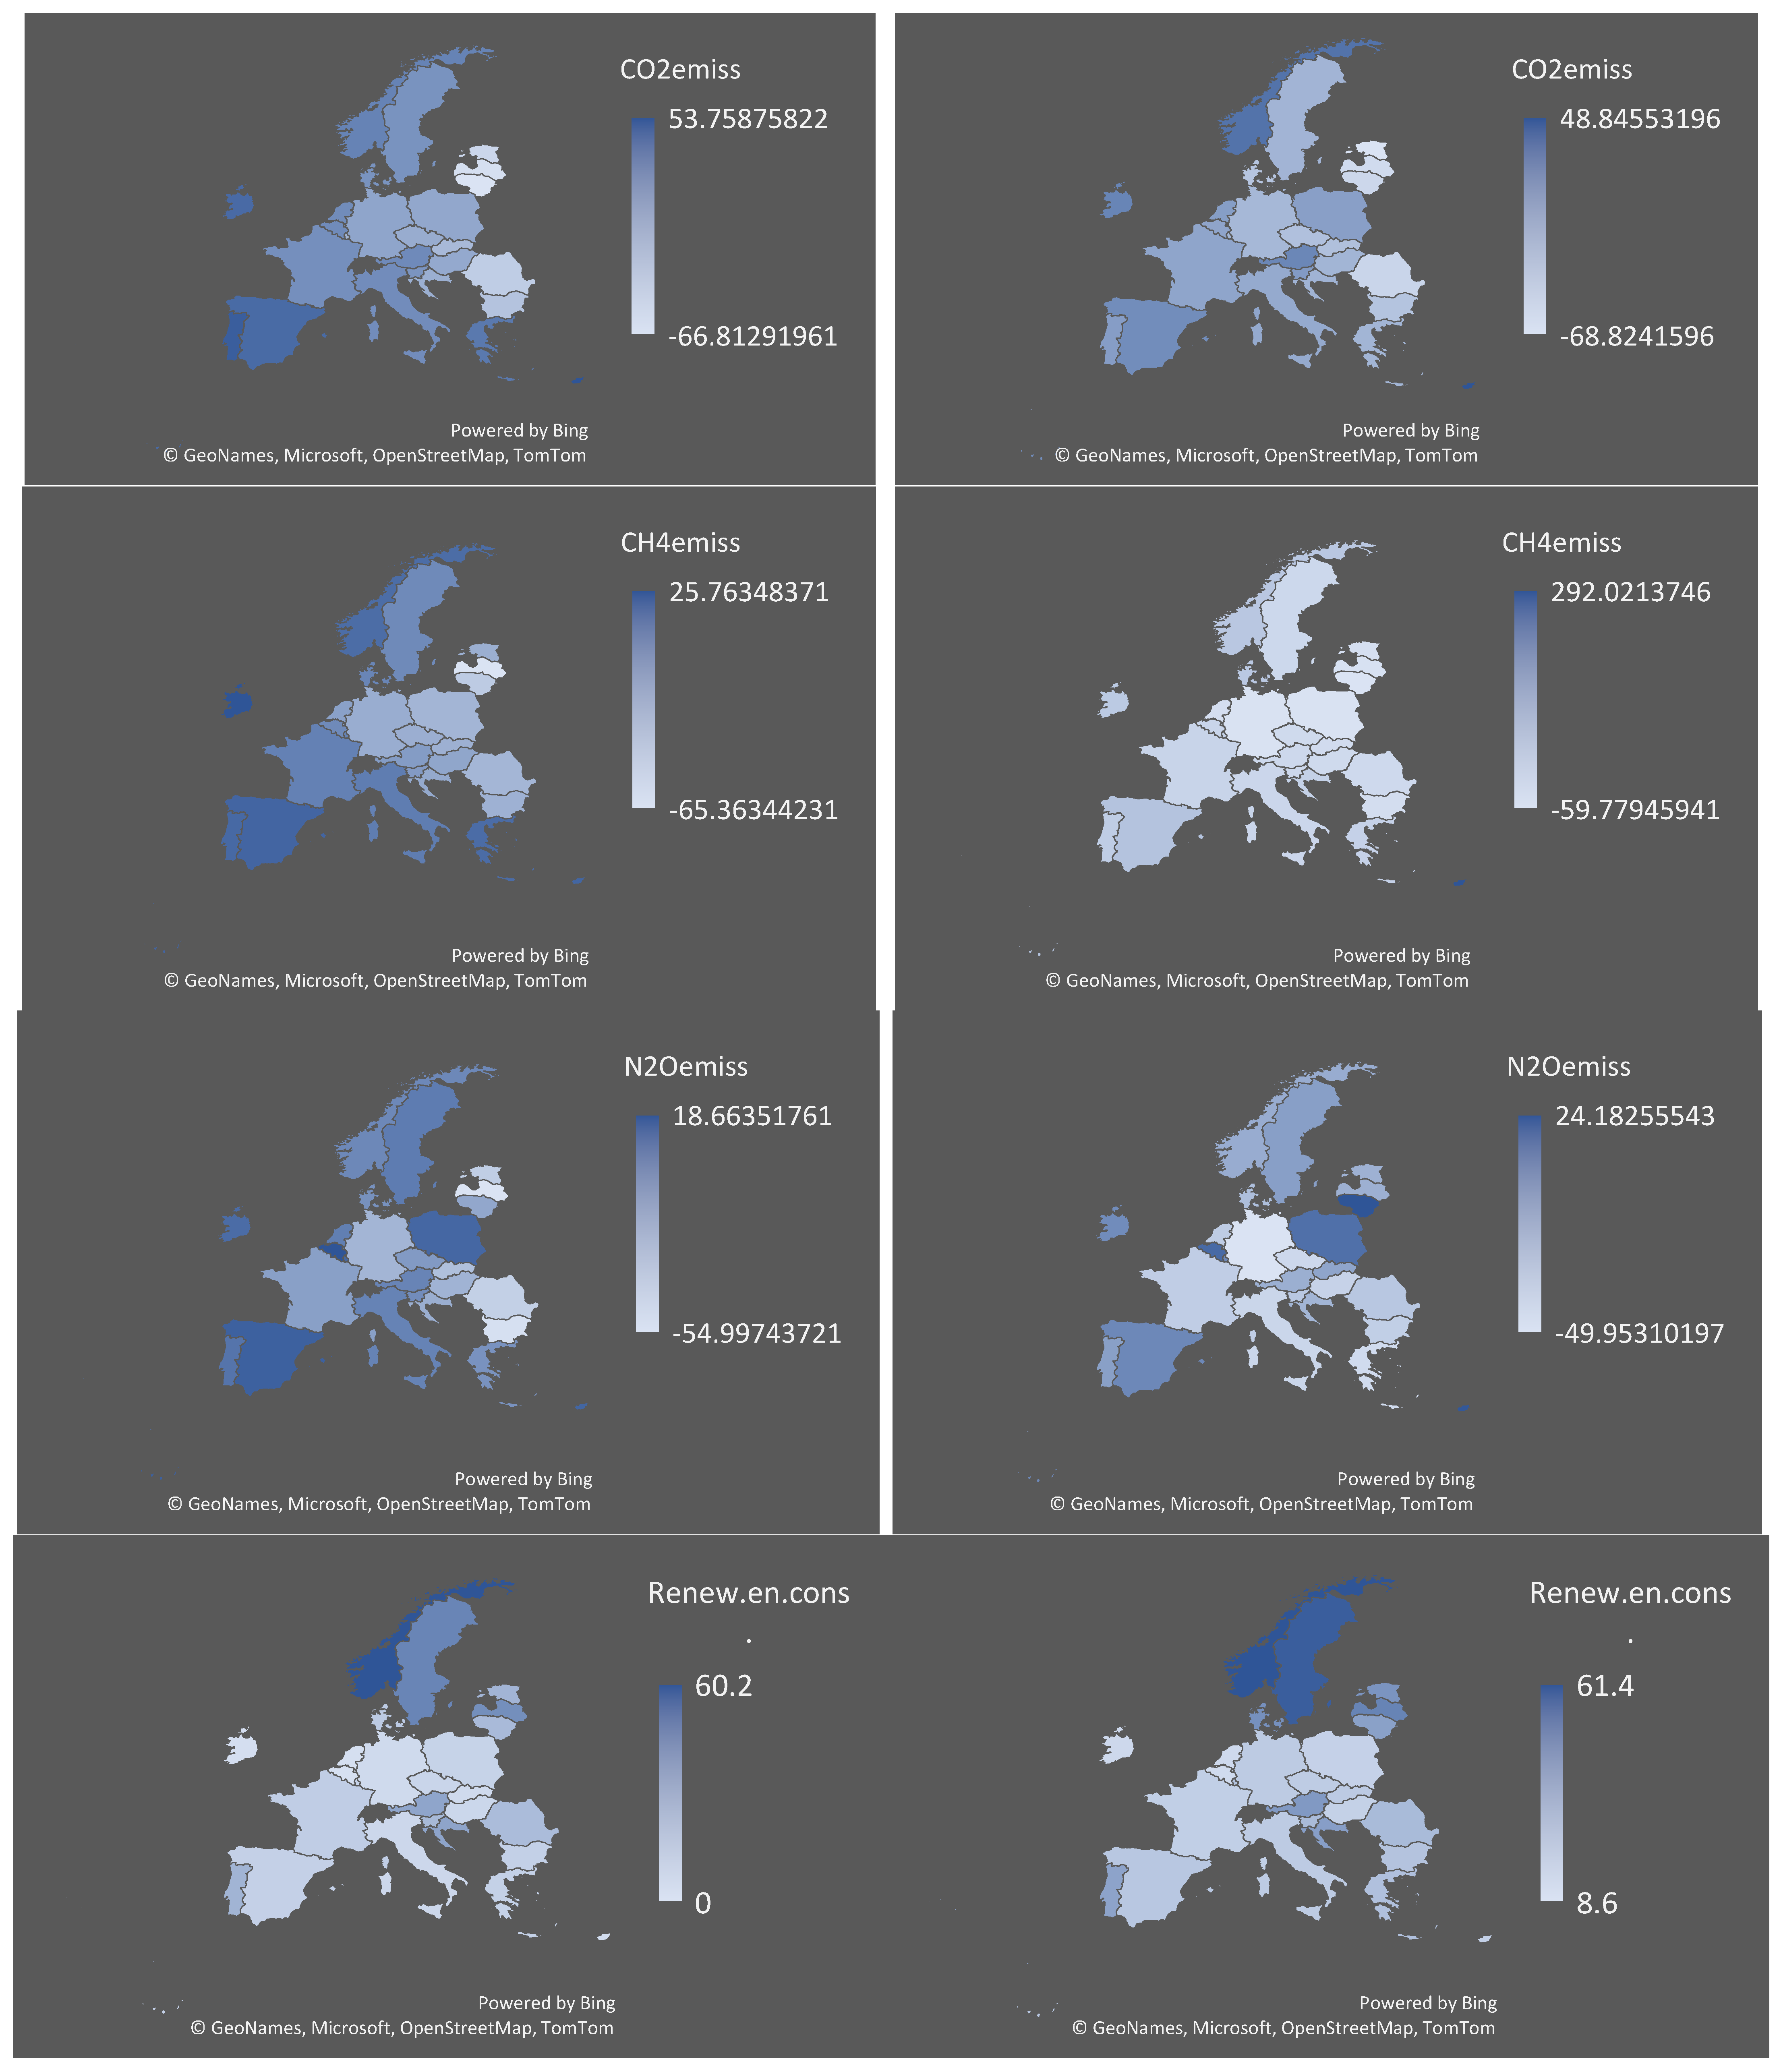
In terms of gas emissions, our analysis includes three distinctive emissions, carbon dioxide (CO2), methane (CH4), and nitrous oxide (N2O) emissions, all three important in driving climate change. Carbon dioxide comes from fossil fuel combustion (e.g., coal, oil, gas), industrial processes related to cement and steel, and land-use changes, such as deforestation, contributing to long-term warming. CO2 is driven by increased natural gas and coal use, and although industrial processes reacted to the necessity of reducing emissions, the decline in CO2 levels across the two decades is still small. CH4 results from fossil fuel operations, agriculture, or waste, emphasising the fastest growth over the last five years, as emissions rose by 20% over the past two decades. The largest contributor is the agriculture sector, especially from synthetic fertilisers. These emissions have the longest lifetime of all three types, contributing to the depletion of the ozone layer. For climate change vectors, we also include in the analysis renewable energy consumption (% of total), representing the share of renewable energy in total final energy consumption. To compare values from 2000 with those in 2021, we present the evolution of the indicators related to climate change through mapping.
From the graphs presented in
Figure 3, we observe that CO
2 emissions are the only gas emissions to have slightly declined over the two decades, due to industrial reductions and a balanced use of natural gas and coal from fossil combustion and processes. Compared to 2000, the CH
4 emissions rose in an accelerating manner for Cyprus and Malta, driven by agriculture, fossil operations, and waste. N
2O, with the longest atmospheric persistence and impacting ozone in the greatest manner, increased in a few countries, such as Cyprus or Lithuania, but for most EU members, its levels were kept to a negative number. Renewable energy consumption increased from 2000 until 2021, signalling a green transition via the mapped evolutions. Accordingly, we expect the use of renewable energy to sustain the reduction in gas emissions, especially for CO
2. This is because carbon dioxide represents the main product of fossil-fuel combustion displaced by renewables. Methane and nitrous oxide are more strongly linked to agricultural, waste, and process-based sources, making their response to renewable energy adoption weaker and more heterogeneous across the regions.
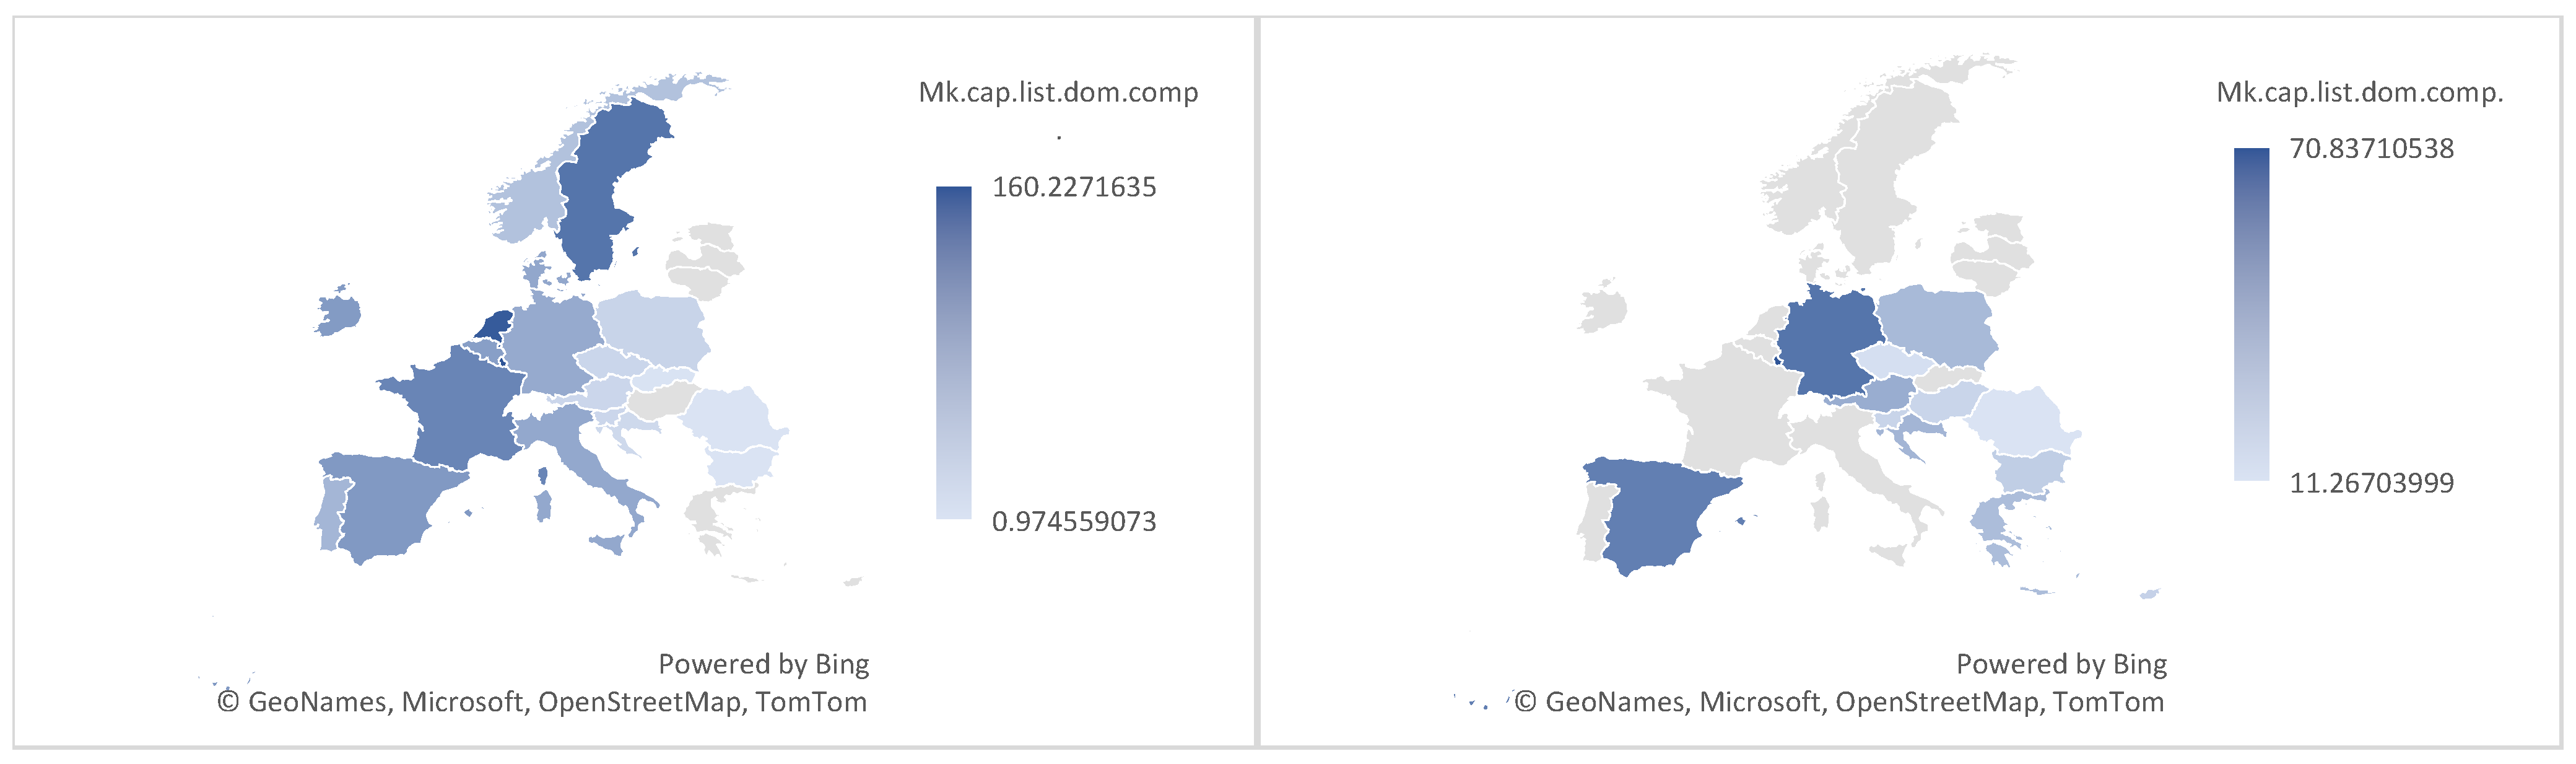
In terms of performance, we review the market capitalisation of listed domestic companies (% of GDP), referring to the total value of all outstanding shares of listed domestic companies. The evolution of market capitalisation levels across EU member states is illustrated in
Figure 4.
The overall drop in market capitalisation values was due to a significant reduction in the number of domestic listed companies in the case of Luxembourg, which was at the top of EU countries, followed by Germany, whose reduction in market capitalisation was by approximately 7% of GDP, compared to Luxembourg, where the reduction was from 160 to 70% of GDP. Also, considering the pandemic crisis, there was still a significant rebound in 2021, driven by a strong recovery in the equity market (e.g., Austria, Bulgaria and Romania evidenced a significant increase in the market capitalisation from 2000 until 2021). Due to missing data for this indicator, some EU countries are illustrated in grey in the maps in
Figure 4.
4. Results and Discussions
Before applying the regression models, we start by testing the unit root of the variables collected in the panel data. Due to non-stationary gas emissions variables, we decided to apply the first-order difference, which offered us stationary data. Accordingly, the regression models include first-order difference for emissions data, and variables will be noted with “d.”, as follows in the result tables.
The results of the OLS models are presented in
Table 2, and they reveal that CO
2 and CH
4 emissions increase along with the growth in value added of services, industry and manufacturing sectors, while agriculture has a statistically significant influence only on N
2O emissions. We add that growing added values from industrial and manufacturing sectors also increase the nitrous oxide levels.
When we test the influence of all four sectoral values added on each category of gas emission, the statistical significance of regression coefficients diminishes, as presented in
Table 3. While the agricultural sector keeps its significant positive influence on N
2O emissions, CO
2 emissions seem to be significantly impacted by the services and manufacturing sectors. From the OLS models, no statistically significant coefficients were found in explaining the CH
4 emissions. Additionally, we continue by testing the regression models with fixed and random effects, and the Hausman test, which reveals that fixed effects are more appropriate for the models explaining N
2O emissions, while the CO
2 emissions model is better expressed by random effects. The models explaining the CH
4 emissions do not indicate any of the sectors’ value added as an influential factor. Accordingly, we expect country-specific characteristics to have an important effect on N
2O emissions, while for CO
2 emissions, based on a random effect model, we assume that variations do not change over time or countries, still evidencing services and manufacturing industries as the most relevant in producing the emission of carbon dioxide.
Considering that the statistical significance of the models reduced after including all sectoral value added variables, we continue by testing the Pearson correlations between these, and, according to the coefficients illustrated in
Table 4, there seems to be a strong correlation, especially between the value added of the industrial and manufacturing sectors. Therefore, we realise a principal component out of these four sectors and retest the influence of the value added on gas emissions across the EU countries, over the period 2000–2021.
As included in
Table 5, the principal component analysis returned one main factor, with an eigenvalue above 1, which is positively impacted by all four sectors included (industrial, agricultural, services, manufacturing).
After generating one main component through the principal component analysis, we further test the influence of this aggregate level of value added within all sectors overviewed (pc_va) on the gas emissions. As a control variable, we add the share of renewable energy, as first-order difference, to ensure the stationarity of the variable. The results obtained are presented in
Table 6, and they prove the direct influence of the aggregated sectoral value added on the three categories of gas emissions. In addition, these results prove that the increase in the usage of renewable energy induces a significant decrease in the levels of gas emissions.
The last stage of the analysis considers dynamic models to appreciate the autocorrelation effect. System GMM uses lagged dependent variables (gas emissions) as instruments, unlike static panels, capturing true dynamics where past pollution drives current levels beyond present value added. The system approach also improves efficiency for persistent series near a unit root, being able to absorb time-invariant characteristics (from fixed effects, such as national regulations or geographic position) and handle time-varying shocks. The results are reported comparatively in
Table 7. The main results prove the direct influence of the value added (principal component) on all three types of gas emissions, also after we add the control variables related to the share of renewable energy and the market capitalisation of the domestic listed companies. Renewable energy carries specific influences: the % of renewable energy from total final energy consumption has an indirect influence on carbon dioxide and methane, but it directly impacts the level of nitrous oxide emissions (but to a lower extent, considering the regression coefficient compared to those from CO
2 and CH
4 emissions models). The market capitalisation of the listed domestic companies has a low and indirect effect on CO
2 emissions, and a stronger and direct influence on CH
4 and N
2O emissions. We link the CO
2 relationship to energy-intensive sectors (especially those related to industry and manufacturing) that drive CO
2 via combustion. As highly capitalised firms tend to invest in renewables, they would dilute carbon dioxide emissions, especially over the short term. This effect manifests indirectly, also yielding smaller coefficients. The direct influence on methane and nitrous oxide is primarily due to the scale effect of economic expansion, as the financial resources allow companies to expand, especially in energy-intensive industries. Market capitalisation reflects increased production and industrial activity, a growth that relies most commonly on conventional energy, increasing the combustion of fossil fuels. This is more specific to developing and high-growth economies, but also considers the prioritisation of profits over environmental impact when referring to large, listed companies with high greenhouse gas output, such as oil, gas, and agriculture. However, we could expect a non-linear relationship from the market capitalisation variable, and beyond some thresholds, the increased wealth and high profits allow companies to invest in modern green technologies.
For the dynamic panel estimation, we employed lagged levels and lagged differences as instruments, and the lag order was adjusted iteratively until the diagnostics (Sargan and Arellano–Bond tests) indicated the best specification. We retained the model that produced the most satisfactory overidentification test results, did not indicate problematic second-order serial correlation, and avoided excessive instrument proliferation. The dynamic analysis indicates statistical significance of lagged gas emissions, and depending on the model employed, CO2 and CH4 emissions have changing effects (with positive and negative coefficients) on the current levels of emissions. This could be due to policy shocks, as carbon prices spike after high-emission years, forcing a reduction in emissions. Also, periods with high emissions trigger renewable buildout and fossil fuel withdrawals. Therefore, certain years or periods could be illustrated with increasing levels of emissions, while others could be subject to significant declines in greenhouse gas emissions.




 ,
,