1. Introduction
Green innovation has become central to the low-carbon transition in manufacturing under China’s “dual carbon” agenda and the continued development of the carbon emission trading system. Regulatory pressure has intensified. Firms are increasingly required to reduce emissions, improve environmental performance, and adjust their production models accordingly [
1]. Yet tighter regulation does not necessarily lead to substantive green innovation. This disconnect is particularly visible among small and medium-sized manufacturing enterprises (SMEs), which continue to face serious barriers in the transition process.
The difficulties are not incidental. They are rooted in the structural constraints of SMEs. Green innovation typically requires substantial upfront investment, involves long payback periods, and is associated with considerable uncertainty. SMEs, however, usually have weaker credit support, narrower financing channels, and lower capacity to absorb risk than large firms [
2]. In practice, these constraints are consequential. The case of Deer Energy-Saving and Environmental Protection Co., Ltd. shows that when formal financing channels are inaccessible, firms may turn to irregular fundraising and eventually collapse, revealing the fragility of SMEs under market-based financing conditions. The problem is not limited to finance. Green technologies also face significant uncertainty in the commercialization stage [
3]. Before generating market returns, they often need to pass testing, certification, and market validation. The case of Beijing Guoneng Battery Technology Co., Ltd., which became involved in investor litigation over overstated battery capacity and cycle life, illustrates how technology claims, certification risk, and weak market trust can undermine commercialization prospects. Compared with state-owned enterprises, SMEs generally operate with weaker institutional support, less stable financing, and lower market credibility. As a result, their green innovation decisions are shaped not only by policy incentives, but also by financing conditions, commercialization capability, and market trust.
Under the carbon emission trading system, government regulation has become more stringent, consumer demand for green products has expanded, and investment institutions have shown growing interest in green projects [
4]. Even so, SMEs do not always engage in substantive green innovation. Two issues therefore require closer examination. The first is how green innovation in SMEs is shaped by the interaction between policy intensity and market feedback under carbon trading arrangements [
5]. The second is how policy design can be improved to ease the financing constraints that continue to impede green innovation in SMEs [
6]. These issues are important not only for understanding firm behavior, but also for improving the effectiveness of environmental regulation in practice.
Existing studies have generated substantial insights into the determinants of green innovation. Prior research has shown that environmental regulation, fiscal subsidies [
7], tax incentives [
8], green finance [
9], and market demand can all affect firms’ green innovation input, innovation behavior, and innovation performance. Other studies have examined how different regulatory intensities, policy tools, and carbon trading arrangements influence firms’ emission reduction and innovation outcomes [
10]. More recent work has moved beyond firm-level responses alone and has begun to consider the role of consumer green preferences, financial support, and interaction among multiple actors in the green transition process. Empirical analysis, case-based inquiry, and evolutionary game approaches have all contributed to this literature.
However, four limitations remain. First, much of the literature focuses on large firms, listed firms, or state-owned enterprises, while SMEs remain underexplored. This is a significant omission because SMEs differ systematically from large firms in financing capacity, risk tolerance, and resource mobilization, and these differences are likely to affect their green innovation choices. Second, existing studies tend to examine government regulation, green consumption, and green finance separately. Less is known about how these factors jointly shape SMEs’ decisions to engage in green innovation. Third, game-theoretic research on green innovation has mostly focused on interactions between government and firms, or among government, firms, and consumers. The role of investment institutions as providers of capital has received comparatively little attention, despite its importance for SMEs. Fourth, although financing barriers and technology-related uncertainty are widely acknowledged, limited research has examined how financing uncertainty and technological commercialization risk together condition policy effectiveness and firm behavior in the context of SME green innovation.
This study addresses these gaps by examining the impact of government regulation on green innovation in SMEs under the carbon emission trading system. It considers the strategic choices of four actors: government, SMEs, consumers, and investment institutions. The analysis focuses on four sets of factors: regulatory intensity, consumer demand for green products, investment willingness, and the financing uncertainty and technological commercialization risk faced by SMEs. By comparing behavioral changes across different scenarios, the study identifies the conditions under which SMEs shift from non-substantive to substantive green innovation. It also examines how policy penalties, policy incentives, improved financing conditions, and lower technological risk alter this process. The results show that stronger administrative penalties increase the likelihood that SMEs adopt substantive green innovation and that consumers purchase green products. This effect becomes stronger when financing uncertainty declines. In addition, when technological commercialization risk is reduced, policy incentives for green investment more effectively increase the willingness of investment institutions to support green projects.
Existing studies have widely used evolutionary game models to analyze green innovation. Two-party, three-party, and four-party frameworks have been developed to examine the strategic interaction among governments, enterprises, consumers, financial institutions, and other stakeholders. These studies have provided useful explanations of how policy pressure, market demand, and external support influence green innovation behavior. However, the value of a multi-party game model should not be judged by the number of actors included. More importantly, it should explain mechanisms that cannot be adequately captured by simpler analytical settings.
In the context of SME green innovation, several issues remain insufficiently addressed. First, although the relationship between environmental regulation and green innovation has been extensively examined, much of the existing evidence is based on large firms, listed firms, or state-owned enterprises. These firms usually have stronger financing capacity, more stable access to policy resources, and greater ability to absorb innovation risks. By contrast, SMEs face more fragile financing conditions, weaker credit support, and greater uncertainty in the commercialization of green technologies. Findings derived from large firms therefore cannot fully explain the green innovation decisions of SMEs.
Second, existing evolutionary game studies often examine government regulation, consumer green demand, and financial support as separate incentive mechanisms. In practice, however, these factors do not operate independently. For SMEs, regulatory pressure may fail to generate substantive innovation if financing uncertainty remains high. Similarly, consumer demand and investment support may not be sufficient when green technologies face high certification costs and uncertain market acceptance. The interaction among regulation, market demand, capital supply, financing uncertainty, and technological commercialization risk therefore requires further investigation.
Third, the role of investment institutions has not been fully clarified. In many studies, financial support is treated as an external condition that directly promotes green innovation. This assumption overlooks the fact that investment institutions make decisions on the basis of expected returns and risk evaluation. For SME green projects, investors must consider not only potential returns from green products and carbon trading, but also certification costs, commercialization uncertainty, and policy incentives. Their participation is therefore not automatic. It depends on whether the expected return from green investment is sufficient to compensate for the risks associated with SME green innovation.
This study further explains why the same policy measures may produce different effects across SMEs. Financing uncertainty affects whether SMEs have enough capital to respond to administrative penalties and innovation subsidies. When financing channels are unstable or financing costs are high, firms may still find it difficult to undertake green transformation, even under stronger regulation. Technological commercialization risk affects whether investment institutions are willing to support green projects. If certification costs are high, market acceptance is uncertain, or future returns are unclear, investment incentives alone may not be sufficient to attract capital. By considering these two risks together, this study explains why stronger regulation or higher investment incentives may fail to promote substantive green innovation under high uncertainty, and why these policies become more effective when financing access improves and commercialization risk declines.
Based on these considerations, this study develops a four-party evolutionary game model involving government, SMEs, consumers, and investment institutions. The purpose is not merely to add investment institutions to an existing game structure, but to examine how their risk-adjusted investment decisions affect SME green innovation under carbon trading arrangements. By incorporating financing uncertainty and technological commercialization risk into the model, this study explains why SMEs may still choose non-substantive green innovation even when regulatory pressure, green demand, and capital support are present. It also identifies the conditions under which government regulation, consumer demand, and investment incentives jointly promote the shift from non-substantive to substantive green innovation.
2. Literature Review
Research on green innovation in SMEs has mainly examined the roles of regulation, market demand, financial support, firm-level constraints, and multi-actor interaction. This literature offers important insights into the drivers of corporate green innovation. Yet three issues remain insufficiently addressed in the SME context: financing uncertainty, technological commercialization risk, and the joint effects of multiple actors. These gaps are especially relevant under carbon trading arrangements, where regulation, market demand, and capital support interact. The existing literature can be grouped into five strands.
2.1. Government Regulation and Green Innovation
Government regulation is one of the most widely studied drivers of green innovation. Existing studies show that environmental regulation, administrative penalties, fiscal subsidies, tax incentives, and carbon trading schemes can affect green innovation by reshaping firms’ cost–benefit structure [
11,
12]. Some studies emphasize the inducement effect of regulation, arguing that stricter environmental constraints push firms to invest in cleaner technologies and production processes [
13]. Others suggest that regulation does not always stimulate innovation, because stringent compliance requirements may crowd out operating resources and reduce innovation investment, especially in financially constrained firms [
14]. The effect of regulation is therefore contingent rather than uniform.
Related work further distinguishes across policy instruments. Subsidies, tax incentives, and carbon trading revenues tend to improve the expected returns to green innovation, whereas penalties [
15], pollution charges, and mandatory standards mainly influence firm behavior by increasing the cost of non-compliance. This line of research has clarified how different regulatory tools create different innovation incentives.
However, several limitations remain. First, most studies focus on large firms, listed firms, or state-owned enterprises, while SMEs remain underexamined. Because SMEs are weaker in financing capacity, risk-bearing ability, and resource mobilization, their responses to regulation may differ substantially. Second, the literature has paid greater attention to the direct effects of regulation than to the ways in which regulation operates through market feedback. This limits our understanding of why firms under similar regulatory conditions may make different innovation choices. Third, policy instruments are often treated as exogenous constraints, while less attention is given to the conditions under which regulation becomes effective when firms face financing fragility and commercialization barriers. In addition, the distinction between symbolic and substantive environmental behavior further helps explain why firms may respond differently to environmental regulation. Substantive environmental behavior involves real changes in production processes, technology investment, resource use, and emission reduction. Symbolic environmental behavior, by contrast, creates an appearance of environmental responsibility without equivalent operational improvement. Marquis et al. examine greenwashing as a form of selective disclosure, in which firms disclose favorable environmental actions while concealing unfavorable ones, thereby creating a misleadingly positive impression of environmental performance. Testa et al. show that environmental practices may be internalized into firms’ operations, but they may also be adopted superficially under stakeholder and institutional pressures. This distinction is relevant to the present study because non-substantive green innovation is not treated as simple inaction. It may include formal compliance, limited environmental disclosure, reliance on carbon allowance purchases, or other superficial responses to regulatory pressure. Such behavior can reduce transformation costs in the short term, but it also exposes firms to regulatory penalties, higher compliance costs, weaker consumer trust, and lower willingness of investment institutions to provide capital. Therefore, this study examines how government regulation affects SME green innovation under financing uncertainty and technological commercialization risk, while also clarifying the distinction between substantive green innovation and non-substantive responses to environmental regulation.
2.2. Consumer Green Demand and Green Innovation
Market demand is another important driver of green innovation [
16]. A substantial body of research suggests that stronger consumer green preferences, higher willingness to pay for green products, and the emergence of green price premiums can improve the market returns to green innovation [
17]. When green products generate higher premiums, stronger brand value, or larger market share, firms have greater incentives to invest in green R&D and process upgrading [
18]. Consumer demand is therefore often seen as a market-based source of green innovation incentives [
19].
Yet this effect is conditional. Consumers do not base their choices on environmental preferences alone [
20]. Price, quality, performance, and brand trust also matter [
21]. Moreover, when information asymmetry is high, certification is weak, or trust in green claims is limited, even environmentally oriented consumers may not translate preferences into stable purchasing behavior [
22]. Green demand may support green innovation, but only under specific conditions.
The above research has several limitations. First, consumer demand is often treated as a background condition rather than as an active force interacting with regulation. Second, prior studies often assume that green demand can be converted into innovation returns, but for SMEs this is far from guaranteed. Whether green demand can be identified, captured, and translated into sufficient revenue to offset innovation costs remains uncertain. Third, little attention has been paid to how consumer demand interacts with firms’ financing conditions and technological commercialization risk. This makes it difficult to explain why firms may still avoid substantive green innovation even when green consumption is growing. In addition, consumer green demand is affected not only by environmental preference, but also by the attitude–behavior gap. Consumers may support environmental protection in principle, but their actual green purchasing behavior can still be constrained by price premiums, information asymmetry, trust problems, and uncertainty about product quality. Prior studies on pro-environmental behavior and green purchase behavior have shown that environmental attitudes do not always translate into actual purchase decisions [
23]. Therefore, by incorporating consumers’ purchasing choices into the analysis, this study clarifies when demand-side incentives become effective for SMEs and treats consumer utility as a composite payoff that includes baseline consumption utility, green preference, product price, demand, and consumption-side incentives.
2.3. Investment Support and Green Innovation
Green innovation requires substantial upfront investment, long payback periods, and high tolerance for uncertainty [
24]. Existing research has examined the roles of green credit, green funds, venture capital, and financial constraints in shaping firms’ green innovation activities [
25]. The dominant view is that external finance can ease funding pressure, improve firms’ capacity to bear innovation risk, and thereby support green innovation.
Recent studies have also begun to examine investment institutions more directly [
26]. These actors not only provide capital, but also affect resource allocation through project screening, risk assessment, and return-sharing arrangements. Their role is particularly important for SMEs, which generally have limited internal capital and depend more heavily on external finance [
27]. In many cases, the willingness of external capital to enter is decisive for whether a green project can proceed.
However, the limited in three respects. First, most studies start from the proposition that green finance supports green innovation, but pay less attention to why investment institutions differ in their willingness to invest across contexts. Second, capital support is often treated as given, while the strategic considerations of investment institutions themselves remain underexplored. Third, in the SME context, the relationship between investment support and technological commercialization risk has received limited attention. As a result, it remains unclear why some green projects fail to attract capital even when policy support is present. This study responds to that gap by treating investment institutions as an independent actor and by examining how policy incentives and commercialization risk jointly shape their decisions.
2.4. Financing Constraints, Technological Commercialization Risk, and SME Green Innovation
Compared with external drivers such as regulation, demand, and financial support, firm-level constraints have received more sustained attention only in recent years [
28,
29]. Existing studies show that SMEs often face insufficient funding sources, high financing costs, limited collateral, and elevated innovation failure risk [
30]. These problems are particularly salient in green innovation, which requires large initial investment and involves long and uncertain return periods.
Technological commercialization risk is equally important. Green technologies do not generate market returns automatically once developed [
31]. They must often pass through testing, certification, promotion, and market acceptance before commercialization succeeds. SMEs are typically disadvantaged in this process because they have weaker brand credibility, less standard-setting power, and fewer complementary resources. Green innovation therefore depends not only on the development of new technologies, but also on whether those technologies can be commercialized successfully [
32].
Although prior studies recognize the importance of financing constraints and technology conversion barriers, two issues remain insufficiently addressed. First, financing uncertainty and technological commercialization risk are often examined separately, even though they are closely connected in SME green innovation. When the commercialization prospect of a green technology is unclear, investment institutions usually become more cautious. They may require stricter project evaluation, expect a shorter payback period, or reduce the amount of capital supplied, which increases the difficulty of external financing for SMEs. At the same time, unstable financing limits SMEs’ ability to deal with commercialization problems. Testing, certification, product improvement, and market promotion all require continuous investment. If firms cannot secure stable funding, they may find it difficult to complete these stages, even when the technology itself has potential. In this sense, commercialization risk may aggravate financing difficulty, while financing uncertainty may further increase the difficulty of technology commercialization. Second, limited attention has been paid to how these two risks affect the effectiveness of policy tools. Administrative penalties can raise the cost of non-substantive green innovation, but they do not necessarily lead SMEs to undertake substantive green innovation if firms lack the capital needed for green transformation. Similarly, policy incentives for green investment can improve the expected return of investment institutions, but they may be insufficient when certification costs are high and market acceptance remains uncertain. Therefore, the effect of environmental regulation and green finance policies depends not only on policy intensity, but also on whether financing conditions and commercialization prospects improve at the same time. This helps explain why SMEs may still refrain from substantive green innovation even when policy incentives exist and market demand is expanding.
2.5. Multi-Actor Interaction and Green Innovation
As green transition processes become more complex, a growing body of research recognizes that green innovation is not determined by firms alone [
33]. It emerges through the interaction of regulation, market demand, financial support, and social preferences [
34]. This has led scholars to examine green innovation from a multi-actor perspective, especially in settings where regulation, consumer preferences, and financial support operate simultaneously [
35].
Evolutionary game theory has been widely used in this context [
36]. Under bounded rationality, it allows researchers to analyze how governments, firms, consumers, and other actors adjust their strategies over repeated interaction and which outcomes become stable over time [
37]. Its key advantage is that it captures dynamic adjustment rather than static equilibrium alone.
However, this literature still has several limitations. First, most multi-actor studies focus on government–firm relationships or on three-party interactions among government, firms, and consumers [
38]. Investment institutions have received far less attention, despite their importance as capital providers. Second, even when multi-actor interaction is considered, the distinctive constraints faced by SMEs are often not examined in depth, particularly financing uncertainty and technological commercialization risk. Third, many studies identify interaction effects without specifying how changes in key variables alter the direction or speed of behavioral evolution. By including government, SMEs, consumers, and investment institutions in the same analysis and by examining strategic change under financing uncertainty and commercialization risk, this study provides a more complete account of SME green innovation [
39].
2.6. Research Gaps
Existing studies have widely applied evolutionary game models to green innovation, including two-party, three-party, and four-party models. These studies have examined the interactions among governments, enterprises, consumers, financial institutions, and other participants. They have also shown that environmental regulation, market demand, and external support can affect firms’ green innovation decisions. However, the value of a multi-party game model does not lie simply in adding more participants. It depends on whether the model can explain mechanisms that are not adequately captured by existing settings.
Several issues remain insufficiently addressed. First, existing research has paid more attention to large firms, listed firms, and state-owned enterprises than to SMEs. These firms differ substantially from SMEs in financing capacity, policy access, risk-bearing ability, and market credibility. As a result, conclusions drawn from large firms may not fully explain why SMEs choose or avoid substantive green innovation.
Second, previous studies often examine regulation, consumer demand, and financial support separately. In practice, these factors are closely connected. For SMEs, stronger regulation may not be sufficient if financing access is unstable. Likewise, green consumer demand or external investment may not lead to innovation when technology certification is costly and commercialization prospects are uncertain. The combined effect of these factors remains underexplored.
Third, the decision logic of investment institutions requires further attention. Existing studies often assume that financial support promotes green innovation once it is available. However, investment institutions decide whether to enter green projects by comparing expected returns with certification costs, commercialization uncertainty, and policy incentives. This is especially important for SME green projects, where risks are higher and future returns are less certain.
In addition, the literature on symbolic and substantive environmental behavior suggests that firms may respond to regulation through formal or symbolic actions rather than real operational change. However, this distinction has not been sufficiently incorporated into evolutionary game studies of SME green innovation. In particular, the costs and risks associated with superficial compliance, such as administrative penalties, loss of consumer trust, and investor caution, are often simplified or left implicit. This study therefore clarifies the meaning of non-substantive green innovation and explains how its risks are reflected in the existing payoff structure.
Therefore, further research is needed to examine SME green innovation under the joint influence of government regulation, consumer demand, investment decisions, financing uncertainty, and technological commercialization risk. This perspective can help clarify why SMEs may still avoid substantive green innovation even when external policy and market incentives are present.
3. Model Construction
3.1. Problem Description
The inclusion of investment institutions is based on the financing characteristics of SME green innovation. Green innovation usually requires large initial investment, long payback periods, and uncertain commercialization outcomes. For SMEs with limited internal funds and weak credit support, external capital can directly affect whether green innovation projects are implemented. Investment institutions therefore should not be treated merely as a background condition or an exogenous source of finance. Their participation depends on expected returns, policy incentives, certification costs, and the perceived prospects of technology commercialization. Without considering investment institutions as strategic actors, it is difficult to explain why some SMEs still avoid substantive green innovation even when regulation and green demand are present.
This section addresses two related questions. The first is how green innovation in SMEs is shaped by the interaction between policy intensity and market feedback under the carbon trading regime. The second is how policy design can be improved to ease the financing constraints that hinder green innovation in SMEs. In this model, financing uncertainty and technological commercialization risk are considered together. Financing uncertainty affects whether SMEs have the capacity to respond to regulation and market demand, while technological commercialization risk affects whether investment institutions are willing to provide capital. Higher commercialization risk may increase financing difficulty, and unstable financing may in turn weaken SMEs’ ability to complete testing, certification, product improvement, and market promotion. To examine these issues, this study develops a four-party evolutionary game model involving government, SMEs, consumers, and investment institutions.
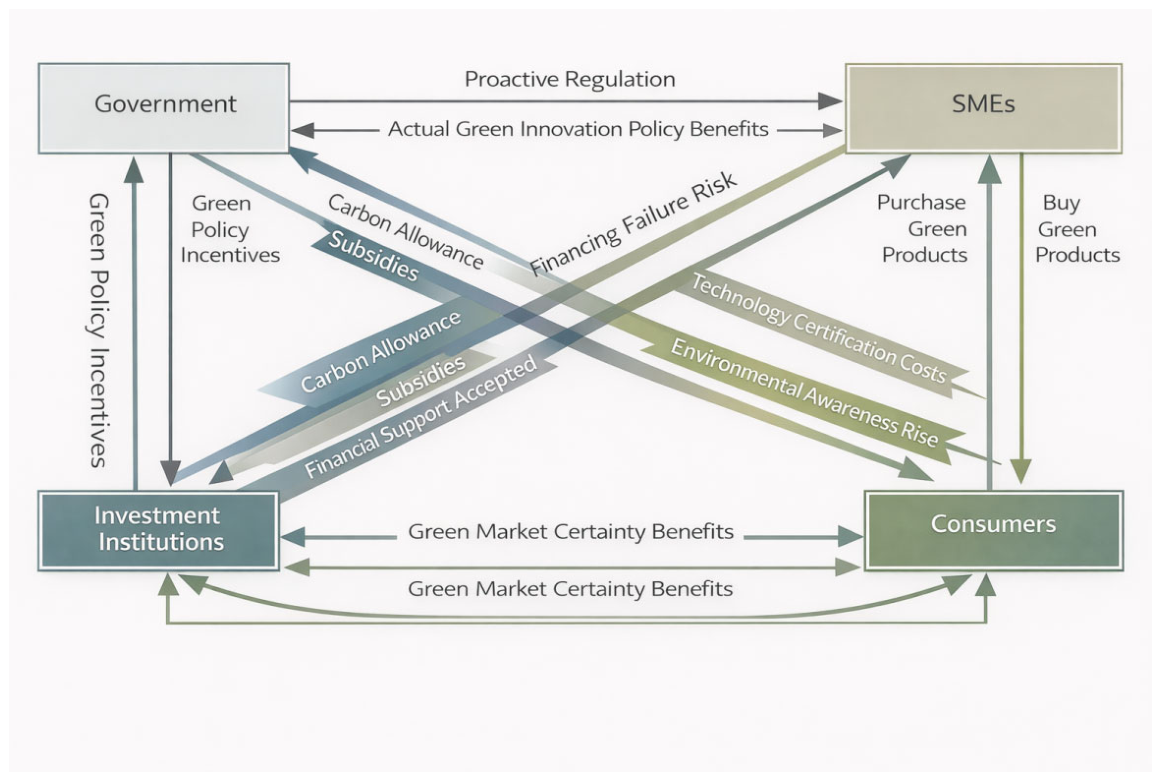
Consumers choose whether to purchase green products. If they do, they obtain psychological utility and carbon-credit-related benefits, while their choices also reshape market demand. Investment institutions choose whether to invest in green projects. By investing, they can reduce the financing cost of green innovation for SMEs and obtain a share of the returns from green product sales and carbon trading revenues, but they must also bear additional risk associated with green innovation. The strategic relationships among government, SMEs, consumers, and investment institutions are presented in
Figure 1.
In addition, the role of investment institutions can be understood from both extensive and intensive financing margins. The extensive margin refers to whether SMEs can obtain access to external green finance, such as the entry of more investment institutions, green funds, guarantee agencies, or other financing channels. The intensive margin refers to the amount, cost, maturity, and continuity of financing provided once investment institutions decide to participate. These two financing margins may lead to different equilibrium paths. An improvement in the extensive margin may help SMEs move from no external support to initial access to green finance, thereby increasing the probability that investment institutions choose to invest. An improvement in the intensive margin may further reduce SMEs’ effective financing uncertainty and strengthen their ability to bear green transformation costs. Therefore, investment institutions do not only affect SMEs through a binary investment decision; they also influence the speed and stability of SMEs’ transition toward substantive green innovation through the structure and intensity of financing support.
3.2. Research Assumptions
Based on the analytical setting described above, the following assumptions are proposed. All parameters are assumed to be positive constants.
Assumption 1. The system consists of four actors: government, SMEs, consumers, and investment institutions. All actors are boundedly rational and risk averse. In the dynamic game process, each actor adjusts its strategy on the basis of cost–benefit comparisons, and repeated interaction eventually converges to a stable equilibrium. The government chooses between active regulation with probability
and passive regulation with probability. SMEs choose between substantive green innovation with probability
and non-substantive green innovation with probability
. Consumers choose between purchasing green products with probability z and not purchasing green products with probability
. Investment institutions choose between investing in green projects with probability w and not investing in green projects with probability
. In this setting, the strategic choice of SMEs is strongly shaped by market conditions and is highly sensitive to financing availability ().
Assumption 2. In terms of market dependence, SMEs rely primarily on market-based financing channels such as commercial bank loans and venture capital, and they do not benefit from direct government credit endorsement. Because green projects are typically characterized by high technological risk and long payback periods, they are subject to stricter credit screening. This makes external financing more uncertain for SMEs. A representative case is Deer Energy-Saving and Environmental Protection Co., Ltd., the first company in Penglai, Shandong Province, listed on the National Equities Exchange and Quotations, which turned to illegal fundraising and eventually went bankrupt after failing to obtain financing through formal channels. By contrast, state-owned enterprises often have access to low-interest loans from policy banks, government special funds, and other forms of institutional support, which reduce financing costs and improve funding stability. For example, the State Power Investment Corporation received strategic investment through the Guoxin Fund, while Sichuan Energy Investment Group was able to obtain debt restructuring support through government coordination even after suffering losses from overexpansion. To capture this structural difference, the model introduces
as the degree of financing uncertainty faced by SMEs, reflecting the fragility associated with their reliance on market-based financing.
In terms of resource constraints, SMEs typically invest less in research and development and depend more heavily on third-party institutions for technology certification. This raises the risk of misreporting and weakens market confidence during commercialization. A relevant example is Beijing Guoneng Battery Technology Co., Ltd., a private enterprise that became involved in investor litigation after overstating the capacity and cycle life of its 68 Ah lithium-ion battery products sold in 2018. By comparison, state-owned enterprises often benefit from stronger technical standards and higher market credibility. For instance, the smart metering technology of State Grid is subject to mandatory national certification, which supports greater market trust. To reflect this difference, the model introduces as the technological commercialization risk specific to SMEs.
The model also considers how financing uncertainty and technological commercialization risk influence the role of policy measures. Financing uncertainty may reduce the effect of regulatory pressure and firm subsidies because SMEs need stable capital to carry out green transformation. If financing channels are unstable or financing costs are high, firms may be unable to respond effectively to penalties or subsidies. Technological commercialization risk may reduce the effect of investment incentives because investment institutions are concerned not only with policy support, but also with whether green technologies can pass certification, gain market acceptance, and generate stable returns. When both financing uncertainty and commercialization risk are high, stronger policy measures may still have limited influence on firms and investors. When financing conditions improve and commercialization risk declines, the same regulatory and incentive measures are more likely to encourage substantive green innovation, green consumption, and green investment.
Assumption 3. Government regulation involves an organizational cost, denoted by
. At the same time, the government establishes a policy mix to support green innovation. This includes a subsidy for firms undertaking green innovation, a carbon-credit subsidy for consumers who purchase green products, and a policy incentive for investment institutions that invest in green projects. The combined effect of these policy instruments generates an overall policy return, denoted by .
In addition, the government performs its regulatory role in the carbon market by setting entry thresholds and supervising market participation. Under active regulation, it conducts qualification reviews and verifies carbon emission monitoring and reporting systems. It also collects membership and registration fees, denoted by , to offset market administration costs. A comparable practice can be observed in the European Union, where transaction-based charges are used to channel platform revenues into climate policy. Under active regulation, the government also imposes a penalty on SMEs that do not undertake substantive green innovation. If SMEs choose non-substantive green innovation, the government must further bear an additional environmental governance cost, denoted by .
Assumption 4. SMEs undertaking green innovation incur a green transformation cost, denoted by
. If they choose substantive green innovation, they obtain carbon trading revenue
from the carbon market, where
. If consumers purchase green products, firms also receive green product sales revenue
, where
is the market price of green products and
is the demand for green products. If investment institutions invest in green projects, SMEs obtain financing support equal to
. Here,
denotes market-based financing uncertainty, such as stricter credit screening or the absence of policy support. A higher value of
implies a larger loss in financing efficiency. In the limiting case where
approaches 1, effective financing approaches zero, which is consistent with situations in which firms are unable to secure formal financing and are forced to seek irregular channels.
By contrast, SMEs that do not undertake substantive green innovation do not bear the transformation cost , but they must pay the carbon allowance purchase cost associated with excess emissions, denoted by , where . In this expression, is the emission reduction coefficient per unit of green product, is the excess emission coefficient per unit of conventional product, and is the carbon market price. If consumers purchase conventional products, firms receive conventional product sales revenue , where is the market price of conventional products and is the demand for conventional products. Under active regulation, SMEs that do not engage in substantive green innovation must also pay the penalty .
Following [
38,
39], non-substantive green innovation in this study does not simply mean the absence of environmental action. It also includes symbolic or superficial responses to regulation, such as formal compliance, limited disclosure, reliance on carbon allowance purchases, or low-level environmental adjustment without substantial technological improvement. These responses allow SMEs to avoid green transformation costs in the short term, but they are not risk-free. In the current payoff structure, the costs and risks associated with non-substantive green innovation are reflected through the carbon allowance purchase cost, the administrative penalty imposed by the government, consumers’ purchasing decisions, and investment institutions’ risk assessment. Therefore, the model retains the existing payoff structure while clarifying that non-substantive green innovation includes the risks of superficial or symbolic environmental behavior.
Assumption 5. Consumers are the purchasers of products. In choosing between green and conventional products, they evaluate multiple dimensions of utility. Regardless of whether SMEs undertake substantive green innovation, the basic consumption value derived from product purchase is assumed to be the same and is denoted by
, where
and
. If consumers purchase green products, they obtain purchasing utility equal to
. They also receive an additional psychological utility
, where
and
denotes the utility associated with green preference per unit of product. In addition, consumers receive the carbon-credit subsidy
provided by the government.
If investment institutions invest in green projects, consumers obtain an additional utility due to improvements in product quality brought about by green investment. By contrast, if consumers do not purchase green products, they obtain utility from conventional product consumption equal to . Moreover, when SMEs undertake green innovation and green transformation, consumers also receive a long-term environmental benefit, denoted by .
The homogeneous baseline utility U is used as a representative-consumer approximation and does not imply that all consumers have identical preferences in reality. The psychological utility MMM represents the aggregate effect of green preference and environmental awareness. The carbon-credit subsidy T is interpreted as a price-equivalent consumption incentive rather than a direct psychological utility injection. In practice, such incentives may take the form of price discounts, carbon credits, vouchers, or reward points. Since consumer payoff is expressed in monetary-equivalent terms, T represents a reduction in the effective purchase burden of green products.
Assumption 6. Investment institutions act as market-based capital allocators, and their investment decisions are determined by risk-adjusted expected returns. When they invest in green projects undertaken by SMEs, they receive the government policy incentive
, but must also bear an additional green technology certification cost equal to
. Here,
denotes the technological commercialization risk specific to SMEs. It captures the greater certification complexity and uncertainty that arise when firm technologies lack strong national standard support.
If the investment is successful, investment institutions receive a share of green product sales revenue and carbon trading revenue at the proportion . By contrast, if they invest in conventional projects, they receive the same proportion of conventional product sales revenue and bear a corresponding share of carbon allowance purchase costs. Because SMEs do not possess the same degree of strategic stability associated with state-backed firms, investment institutions do not obtain any additional premium from long-term strategic alignment.
The model adopts linear payoff specifications for several key relationships, including carbon trading revenue, carbon allowance purchase cost, effective financing support, technological commercialization cost, and consumer green preference utility. This treatment follows the common practice in recent evolutionary game studies on green innovation and environmental regulation. In such models, the purpose is usually to examine the direction of strategic evolution and the conditions under which different equilibrium outcomes emerge, rather than to estimate nonlinear marginal effects. Therefore, the model focuses on the relative payoff differences among strategies. Linear payoff specifications provide a tractable baseline setting that makes it possible to derive equilibrium conditions, conduct stability analysis, and carry out numerical simulations in a transparent way [
40,
41].
Based on the basic assumptions and supplementary information of the above model, the parameter settings are summarized in
Table 1.
For a complete and detailed definition of all symbols, strategic probabilities, payoff functions and evolutionary dynamics involved in this study, please refer to
Appendix A.
3.3. Model Analysis
Based on the assumptions above, there are 16 possible strategy combinations among government, SMEs, consumers, and investment institutions. These combinations give rise to the corresponding payoff matrix, that is, the four-party evolutionary game model shown in
Table 2. In
Table 2, the entries in each elementary matrix represent, from top to bottom, the payoff functions of government, SMEs, consumers, and investment institutions, respectively.
When the government chooses between active regulation and passive regulation, its expected payoffs are denoted by
and
, respectively, as shown in Equations (1) and (2). Its average expected payoff is denoted by
, as presented in Equation (3). On this basis, the replicator dynamic equation describing the evolution of the government’s strategic choice is given in Equation (4).
When SMEs choose between substantive green innovation and non-substantive green innovation, their expected payoffs are denoted by
and
, respectively, as shown in Equations (5) and (6). Their average expected payoff is denoted by
, as presented in Equation (7). The replicator dynamic equation describing the evolution of SMEs’ strategic choice is given in Equation (8).
When consumers choose between purchasing green products and not purchasing green products, their expected payoffs are denoted by
and
, respectively, as shown in Equations (9) and (10). Their average expected payoff is denoted by
, as presented in Equation (11). The replicator dynamic equation describing the evolution of consumers’ strategic choice is given in Equation (12).
When investment institutions choose between investing in green projects and not investing in green projects, their expected payoffs are denoted by
and
, respectively, as shown in Equations (13) and (14). Their average expected payoff is denoted by
, as presented in Equation (15). The replicator dynamic equation describing the evolution of investment institutions’ strategic choice is given in Equation (16).
The payoff matrix distinguishes between substantive and non-substantive green innovation. Substantive green innovation requires SMEs to bear green transformation costs, but it may generate carbon trading revenue, green product sales revenue, and financing support. Non-substantive green innovation allows SMEs to avoid transformation costs in the short term, but it also entails carbon allowance purchase costs and possible administrative penalties. In addition, because non-substantive green innovation may include symbolic compliance or superficial environmental responses, it may weaken consumers’ trust and increase investment institutions’ concerns about the credibility of green claims and commercialization prospects. These market and financing risks are captured through consumers’ purchasing strategies and investment institutions’ investment strategies, rather than by adding a new payoff parameter. This treatment keeps the payoff structure consistent with the subsequent stability analysis and numerical simulations.
3.4. Stability Analysis of Evolutionary Strategies
Under the carbon trading mechanism, this study develops a four-party evolutionary game model to examine the dynamic effect of government regulatory strategy on green innovation in SMEs. The analysis takes a multi-actor perspective and considers government, SMEs, consumers, and investment institutions within a unified setting. On this basis, an evolutionary system is constructed using replicator dynamic equations. Solving the equilibrium conditions
yields 16 Nash equilibrium solutions corresponding to 16 pure-strategy combinations, as reported in
Table 3. Building on Lyapunov stability theory, the study then evaluates the local asymptotic stability of each equilibrium point. The stability condition is determined by the signs of the eigenvalues of the Jacobian matrix, which is given in Equation (17).
Based on the Jacobian matrix described above, the eigenvalues of each equilibrium point can be obtained, as shown in
Table 3.
According to the stability criterion for the four-party evolutionary game, an equilibrium point is stable if and only if all eigenvalues are negative. Among the 16 equilibrium points identified above, equilibrium points
,
,
,
,
,
,
,
,
,
and
always contain at least one positive eigenvalue and are therefore saddle points. The remaining equilibrium points satisfy the condition that all four eigenvalues are negative only under specific parameter restrictions. As a result, the ESS can arise only at
,
,
,
and
. Even when stability is achieved at these five equilibrium points, the ESS is not necessarily unique. The corresponding conditions are reported in
Table 4.
Under ideal conditions within the carbon trading system, the government adopts active regulation in order to accelerate the achievement of the “dual carbon” goals, SMEs undertake substantive green innovation, consumers purchase green products, and investment institutions support green projects. At the equilibrium level, this ideal outcome is represented by
,
,
,
. That is,
is the ideal stable point. The conditions under which
,
,
and
become the unique stable equilibrium are reported in
Table 5.
Based on the eigenvalue analysis and stability conditions reported above, this study identifies five representative scenarios that the system may reach, together with the conditions under which they emerge. These scenarios describe the strategic combinations adopted by government, SMEs, consumers, and investment institutions under different market environments and policy constraints within the carbon trading system. A systematic analysis of the equilibrium conditions associated with each scenario helps clarify the main factors constraining green innovation in SMEs and the mechanism through which strategic choices are formed. The five scenarios and their economic implications are discussed in detail below.
Scenario 1. When the conditions
,
, and
are satisfied, the system has a stable equilibrium point
. Furthermore, when
, the system has a unique stable equilibrium. This equilibrium corresponds to a situation in which the government adopts active regulation, SMEs do not undertake substantive green innovation, consumers do not purchase green products, and investment institutions do not invest in green projects.
The condition can be interpreted as follows: the net gain from substantive green innovation, measured as carbon trading revenue minus green transformation cost, is lower than the net return from conventional production, measured as conventional product sales revenue minus carbon allowance purchase cost and the penalty for not undertaking substantive green innovation. Under this condition, SMEs choose not to undertake substantive green innovation.
The condition implies that . That is, the utility generated by the carbon-credit subsidy for purchasing green products is lower than the utility obtained from purchasing conventional products. Under such circumstances, consumers choose not to purchase green products.
The condition indicates that the government policy incentive for investment in green projects is lower than the return associated with conventional product sales, net of the share of carbon allowance purchase costs. Under this condition, investment institutions choose not to invest in green projects.
In this scenario, the government can improve the system outcome in three ways. It can strengthen penalties on firms that do not undertake substantive green innovation, thereby accelerating the shift in SMEs toward substantive green innovation. It can also increase carbon-credit subsidies for consumers who purchase green products, which would help foster green consumption. Finally, it can raise policy incentives for green project investment so as to encourage investment institutions to support green projects.
Scenario 2. When the conditions
,
, and
are satisfied, the system has a stable equilibrium point E10. Furthermore, when
, the system has a unique stable equilibrium at E10. This equilibrium corresponds to a situation in which the government adopts active regulation, SMEs do not undertake substantive green innovation, consumers do not purchase green products, and investment institutions invest in green projects.
The condition means that the net return from substantive green innovation, including carbon trading revenue and investment support, after deducting green transformation cost and the cost associated with financing uncertainty, is lower than the net return from conventional production, measured as conventional product sales revenue minus carbon allowance purchase cost and administrative penalties. Under this condition, SMEs choose non-substantive green innovation.
The condition implies that . This means that the government policy incentive for investment in green projects exceeds the net return that investment institutions obtain from conventional product sales after accounting for their share of carbon allowance purchase costs. Under this condition, investment institutions choose to invest in green projects.
In this scenario, the government adopts active regulation, SMEs do not undertake substantive green innovation, consumers do not purchase green products, and investment institutions invest in green projects. To improve the system outcome, the government can strengthen penalties on firms that do not undertake substantive green innovation and provide broader-based financial support, thereby encouraging SMEs to move toward substantive green innovation. It can also increase the utility value of carbon-credit subsidies for consumers, so as to promote the purchase of green products.
Scenario 3. When the conditions
and
are satisfied, the system has a unique stable equilibrium at E12. This equilibrium corresponds to a situation in which the government adopts active regulation, SMEs do not undertake substantive green innovation, consumers purchase green products, and investment institutions invest in green projects.
The condition implies that the net return obtained by SMEs from carbon trading revenue, green product sales revenue, and investment support, after accounting for green transformation cost and the cost associated with financing uncertainty, is lower than the combined burden of carbon allowance purchase costs and administrative penalties incurred when substantive green innovation is not undertaken. Under this condition, SMEs choose not to undertake substantive green innovation.
The condition implies that . That is, the utility generated by the subsidy associated with purchasing green products exceeds the utility obtained from purchasing conventional products. Under such circumstances, consumers choose to purchase green products. In this scenario, the government can improve the system outcome by strengthening penalties on firms that do not undertake substantive green innovation and by providing broader-based financial support, thereby encouraging SMEs to move toward substantive green innovation. It can also increase the utility value of carbon-credit subsidies for consumers, which would help promote green product purchases.
Scenario 4. When the conditions
and
are satisfied, the game system has a stable equilibrium point, denoted by
. Furthermore, when
, the system has a unique stable equilibrium. This equilibrium corresponds to a situation in which the government adopts active regulation, SMEs undertake substantive green innovation, consumers purchase green products, and investment institutions do not invest in green projects.
The condition can be rewritten as . This means that SMEs choose substantive green innovation when the combined cost of carbon allowance purchases and administrative penalties under non-substantive green innovation exceeds the sum of green transformation cost, carbon trading revenue, and green product sales revenue associated with substantive green innovation.
The condition implies that . In other words, investment institutions choose not to invest in SME green projects when the additional risk cost and technology certification cost of such investment exceed the sum of policy incentives, the share of green product sales revenue, and the share of carbon trading revenue. Under this scenario, the government can encourage green investment by reducing the technological commercialization risk faced by SMEs, for example through easier access to technology certification, and by further increasing policy incentives for investment institutions that support green projects.
Scenario 5. When the conditions
and
are both satisfied, the game system has a stable equilibrium point, denoted by E16. More specifically, when
the system has a unique stable equilibrium at
. This equilibrium corresponds to a situation in which the government adopts active regulation, SMEs undertake substantive green innovation, consumers purchase green products, and investment institutions invest in green projects. The condition
can be rewritten as
. This means that when the combined burden of carbon allowance purchase costs and government administrative penalties exceeds the sum of green transformation costs, financing support adjusted for market-based financing uncertainty, carbon trading revenue, and green product sales revenue, SMEs choose to undertake substantive green innovation.
Similarly, the condition can be rewritten as . This implies that investment institutions choose to invest in green projects undertaken by SMEs when the combined risk cost and technology certification cost of such investment are lower than the sum of policy incentives, the share of green product sales revenue, and the share of carbon trading revenue. Under these conditions, all actors in the game hold favorable incentives toward green innovation. A mutually reinforcing cycle then emerges, making this the ideal stable state.
4. Numerical Analysis
This section uses MATLAB R2024b to conduct numerical simulations of the four-party evolutionary game involving the government, SMEs, consumers, and investment institutions. The purpose of the simulations is to examine whether the evolutionary paths of the system are consistent with the stability conditions derived in the theoretical analysis and to provide a more intuitive illustration of the strategic interactions among the four actors. Based on the equilibrium conditions obtained in
Section 3.4, different parameter values are assigned to represent alternative evolutionary scenarios. Some parameters remain unchanged across scenarios. To simplify the simulation procedure and improve readability, these invariant parameters are reported in
Table 6.
The cases discussed above are used as contextual evidence to illustrate the practical relevance of the model assumptions, rather than as direct empirical validation of the model predictions. Since this study develops a theoretical evolutionary game model, the parameter settings are primarily based on the stability conditions derived in
Section 3.4 and the practical characteristics of SME green innovation under the carbon emission trading system. The numerical simulations are therefore used to examine the consistency between the theoretical stability results and the simulated evolutionary paths. In addition, the global sensitivity analysis in
Section 4.3 further tests whether the main conclusions remain robust when multiple parameters vary simultaneously over a wider parameter space.
It should also be noted that parameter variation in the model is not intended to reproduce the empirical fluctuation range of real-world data. Rather, it is used to capture how changes in policy intensity, financing conditions, market demand, and technological commercialization risk affect strategic evolution under the theoretical assumptions of the model. In this sense, parameter variation reflects the dynamic properties of the evolutionary system under different model settings. Its purpose is to identify how key parameters shape system stability and equilibrium paths, thereby supporting theoretical interpretation and policy discussion, rather than to establish a direct mapping to empirical values or to generate point predictions. This setting also allows the study to assess model robustness and examine possible evolutionary patterns under alternative policy scenarios when detailed industry-level calibration data are not available.
4.1. Initial Evolution Path Analysis of the Four Parties in the Game Theory Model
To verify the scenarios described above, this section examines the evolutionary paths of the model at points E9 (1,0,0,0), E10 (1,0,0,1), E12 (1,0,1,1), E15 (1,1,1,0), and E16 (1,1,1,1). The primary purpose of the parameter setting is to use the theoretical model to reveal the mechanism of policy transmission and the process of multi-actor strategic interaction, rather than to simulate the behavior of specific firms directly. For this reason, the relative values of the parameters and their changing patterns are central to the analysis, whereas exact precision in their absolute magnitudes does not affect the validity of the conclusions. The remaining parameter settings are reported in
Table 7. In addition, the variables x, y, z, and w take values from 0.1 to 0.9, with 0.5 as the step size.
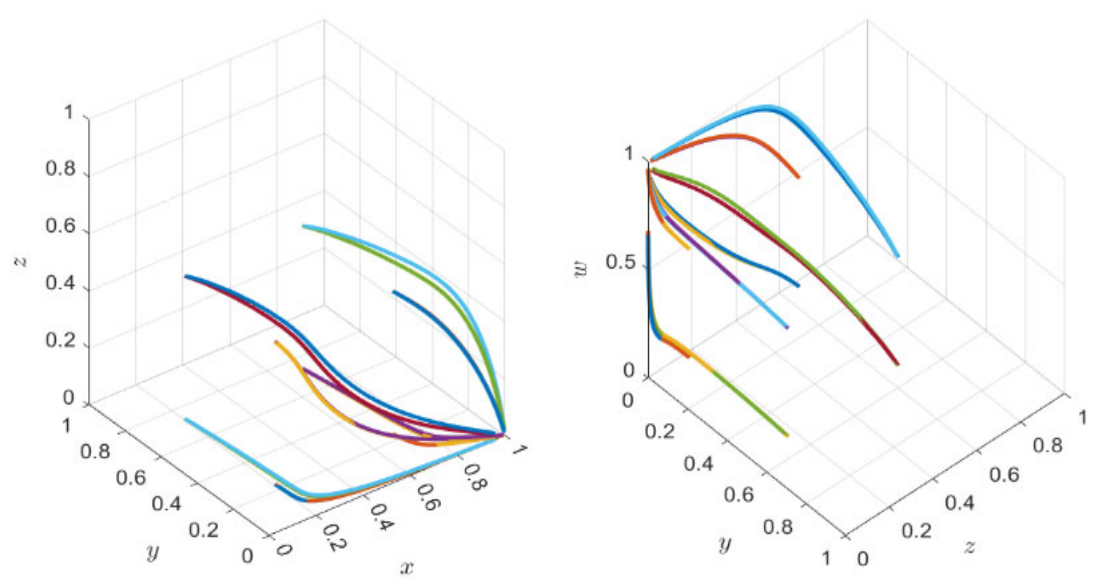
(1) SME green innovation is hindered by financing uncertainty, while an effective external incentive environment has not yet formed. Based on the parameter settings reported in
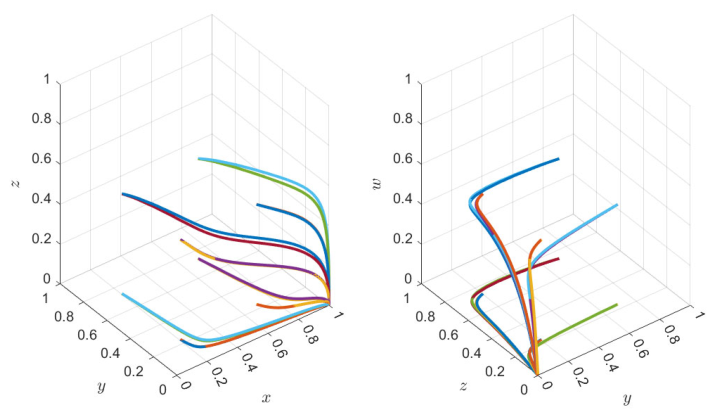
Table 7, the evolutionary trajectories of the participants can be derived when the model converges to the ESS of (1,0,0,0), as shown in
Figure 2. The results in
Figure 2 indicate that, regardless of the initial combination of strategy values in the four-party game, the ESS converges to (1,0,0,0) once the conditions of the proposition are satisfied. This confirms Scenario 1. In
Figure 2, SMEs, consumers, and investment institutions all fail to exhibit a positive orientation toward green innovation, and the system stabilizes at equilibrium point E9 (1,0,0,0). Although the government adopts active regulation, with x converging to 1, SMEs choose not to innovate, with y converging to 0; consumers do not purchase green products, with z converging to 0; and investment institutions do not support green projects, with w converging to 0. Green innovation in SMEs is strongly constrained by financing uncertainty and technological commercialization risk. More fundamentally, SME green innovation is highly sensitive to financing conditions and commercialization risk, which limits the ability of policy incentives alone to induce a shift toward green transformation.
(2) Financing uncertainty and technological commercialization risk weaken the incentive effect of investment support on SME green innovation.
Based on the parameter settings reported in
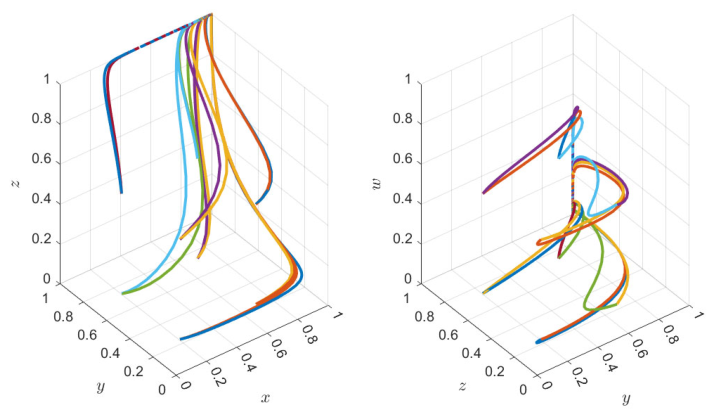
Table 7, the evolutionary trajectories of the participants can be derived when the model converges to the ESS of (1,0,0,1), as shown in
Figure 3. The results in
Figure 3 indicate that, regardless of the initial combination of strategy values in the four-party game, the ESS converges to (1,0,0,1) once the conditions of the proposition are satisfied. This confirms Scenario 2. At equilibrium point E10 (1,0,0,1), the government adopts active regulation, with x converging to 1, and investment institutions support green projects, with w converging to 1. However, SMEs still do not undertake green innovation, with y converging to 0, and consumers do not purchase green products, with z converging to 0. This result shows that financing uncertainty and technological commercialization risk weaken the incentive effect of investment support on SME green innovation.
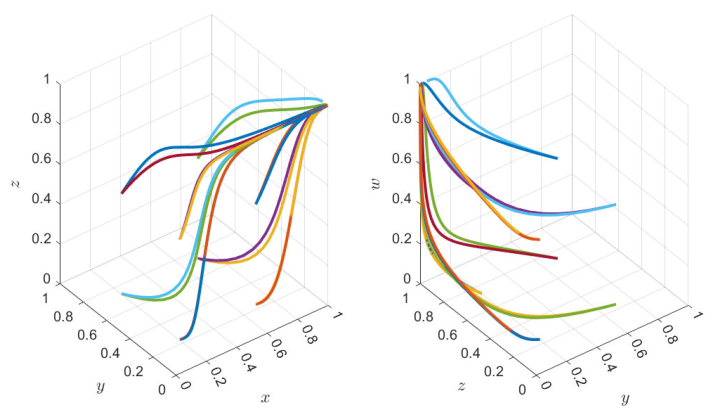
(3) An external incentive environment begins to take shape, but financing barriers and certification costs still prevent SME green innovation.
Based on the parameter settings reported in
Table 7, the evolutionary trajectories of the participants can be derived when the model converges to the ESS of (1,0,1,1), as shown in
Figure 4. The results in
Figure 4 indicate that, regardless of the initial combination of strategy values in the four-party game, the ESS converges to (1,0,1,1) once the conditions of the proposition are satisfied. This confirms Scenario 3. As shown in
Figure 4, at equilibrium point E12 (1,0,1,1), government regulation is active, consumers purchase green products, and investment institutions support green projects, with the relevant probabilities converging to 1. However, SMEs still do not undertake green innovation, with y converging to 0. This result suggests that the initiation of green innovation in SMEs requires a further reduction in financing barriers and technology certification costs. Market demand alone is not sufficient to induce innovation.
(4) SMEs undertake green innovation, but investment institutions withhold support because of concerns over technological commercialization risk. Based on the parameter settings reported in
Table 7, the evolutionary trajectories of the participants can be derived when the model converges to the ESS of (1,1,1,0), as shown in
Figure 5. The results in
Figure 5 indicate that, regardless of the initial combination of strategy values in the four-party game, the ESS converges to (1,1,1,0) once the conditions of the proposition are satisfied. This confirms Scenario 4. As
Figure 5 shows, at equilibrium point (1,1,1,0), SMEs begin to undertake substantive green innovation, with y converging to 1, and consumers purchase green products, with z converging to 1. However, investment institutions do not support green projects, with w converging to 0. This result indicates that, although SME innovation responds relatively quickly to policy signals and market demand, green innovation still faces insufficient capital support. Technological commercialization risk remains the main concern for investment institutions.
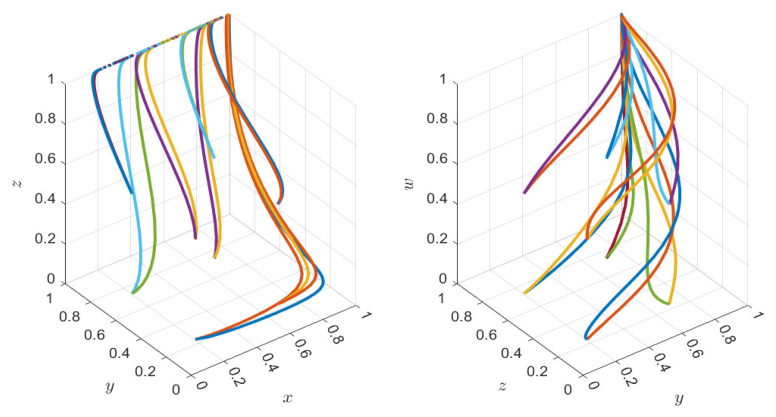
(5) SME green innovation emerges through the joint effects of policy incentives, market demand, and capital support. Based on the parameter settings reported in
Table 7, the evolutionary trajectories of the participants can be derived when the model converges to the ESS of (1,1,1,1), as shown in
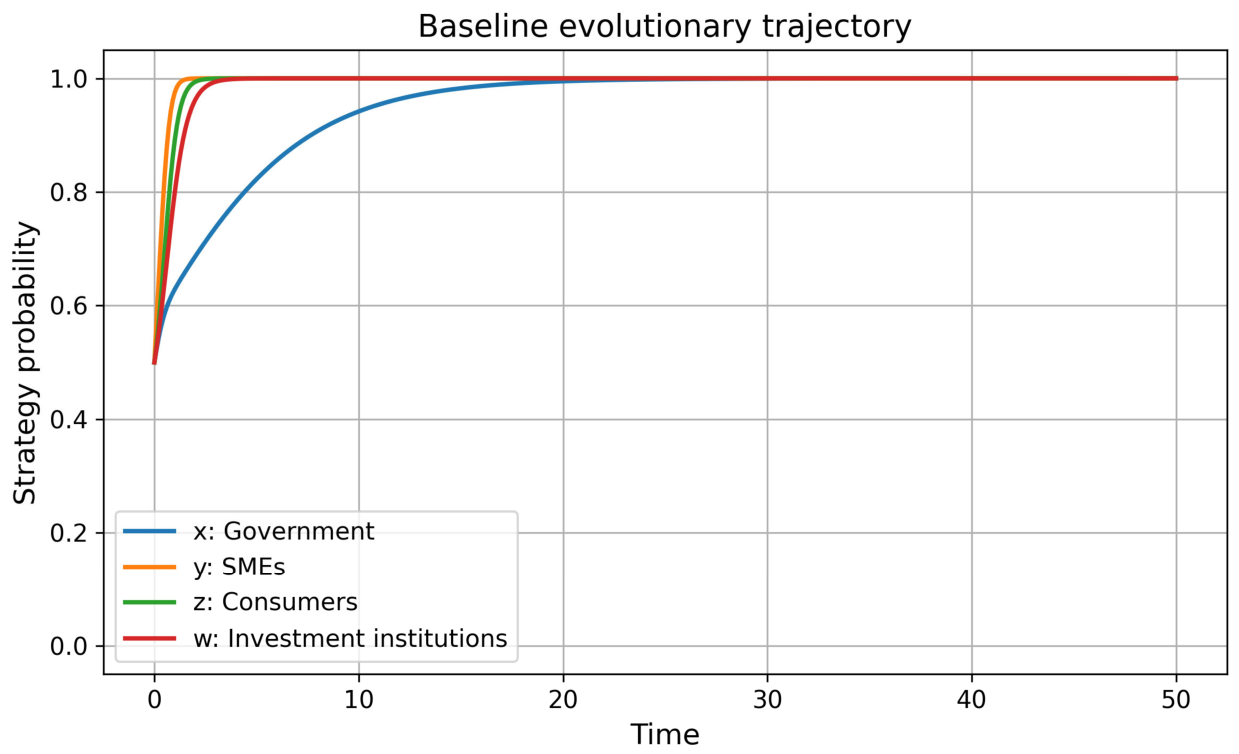
Figure 6. The results in
Figure 6 indicate that, regardless of the initial combination of strategy values in the four-party game, the ESS converges to (1,1,1,1) once the conditions of the proposition are satisfied. This confirms Scenario 5. In
Figure 6, the ideal equilibrium point (1,1,1,1) shows that all actors adopt strategies favorable to green innovation. SMEs undertake substantive green innovation, with y converging to 1; consumers purchase green products, with z converging to 1; investment institutions support green projects, with w converging to 1; and the government maintains active regulation, with x converging to 1. This result indicates that green innovation in SMEs can be realized through the combined effects of policy incentives, market demand, and capital support. At the same time, compared with state-owned enterprises, SMEs remain more dependent on financing conditions for the implementation of green innovation.
The welfare implications of different equilibria should be interpreted conditionally. E16(1,1,1,1) represents a coordinated green innovation state and is desirable from the perspective of environmental improvement and long-term green transformation. However, it is not costless, because it may involve regulatory expenditure, fiscal subsidies, SME transformation costs, consumer price burdens, and investment risks. Other equilibria also imply different welfare trade-offs. For example, E9(1,0,0,0) may generate regulatory costs without sufficient innovation benefits, while E15(1,1,1,0) may improve green innovation and green consumption but still suffer from insufficient financial support. Therefore, this study regards E16 as an ideal coordinated state rather than as a universally welfare-maximizing outcome under all conditions.
4.2. Parameter Sensitivity Analysis
This section examines how changes in key parameters shift the four-party evolutionary game system from alternative stable points to the ideal stable point, E16 (1,1,1,1). The most visible feature of this transition is the change in the strategic choices of SMEs, consumers, and investment institutions. In particular, the stable state shifts from y = 0 to y = 1, from z = 0 to z = 1, and from w = 0 to w = 1. The sensitivity analysis further focuses on how financing uncertainty and technological commercialization risk affect this transition. Administrative penalties mainly influence the strategic choice of SMEs, but this influence depends on firms’ financing conditions. When financing uncertainty is high, SMEs may still be unable to bear the initial cost of green transformation, even if the penalty for non-substantive green innovation increases. When financing uncertainty declines, the same penalty has a stronger effect because firms are better able to finance and implement green innovation. Policy incentives for green investment mainly influence the strategic choice of investment institutions, but their effect depends on the risk of technology commercialization. When commercialization risk is high, investment institutions may avoid green projects because expected returns are not sufficient to cover certification costs and market uncertainty. When commercialization risk declines, policy incentives are more likely to change investment decisions. Therefore, administrative penalties and investment incentives are more effective when financing constraints and commercialization risks are reduced.
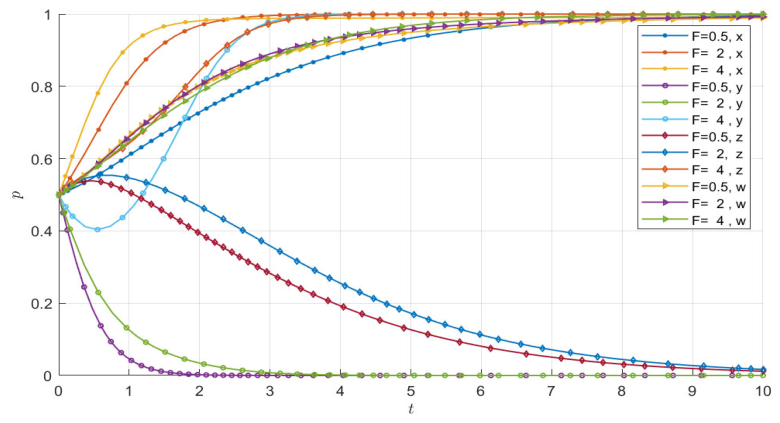
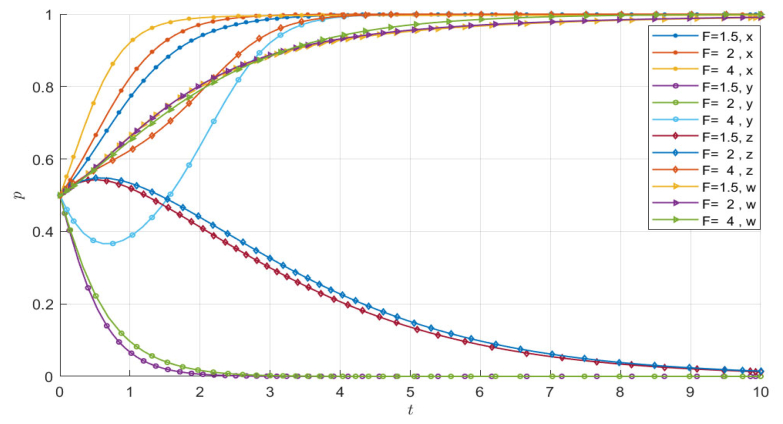
(1) Effects of changes in government administrative penalties on the game actors. According to the preceding stability analysis, changes in government administrative penalties may alter the strategic choice of SMEs. Based on the parameter settings reported in
Table 7, this study takes Scenario 2 as an example to examine how variation in government administrative penalties affects the game system. Holding all other parameters constant, the administrative penalty is assigned three values: F = 1.5, F = 2, and F = 4. The corresponding simulation results are presented in
Figure 7.
As shown in
Figure 7, holding other conditions constant, an increase in the government’s administrative penalty
on SMEs that do not undertake substantive green innovation from 1.5 to 4 changes the stable strategy of the game system. SMEs shift from non-substantive green innovation to substantive green innovation, while consumers shift from not purchasing green products to purchasing them. This result shows that a higher value of
substantially increases the cost of non-substantive green innovation. Once
exceeds the investment threshold for green innovation, the net return to avoiding penalties through substantive green innovation rises, which drives SMEs to change strategy. At the same time, greater green innovation by SMEs increases the supply of higher-quality green products, while stricter government regulation strengthens market credibility. Together, these two effects reduce consumers’ perceived risk in choosing green products and increase their willingness to purchase them.
According to the preceding stability analysis, the cost of market-based financing uncertainty faced by SMEs may alter their strategic choice. Based on the parameter settings reported in
Table 7, this study takes Scenario 2 as an example to examine how the strength of government administrative penalties affects the game system when financing uncertainty declines. Building on the previous analysis, all other parameters are held constant and financing uncertainty is reduced to
. The evolution of the game system is then examined under
,
, and
. The corresponding simulation results are shown in
Figure 7.
As shown in
Figure 8, when market-based financing uncertainty faced by SMEs is relatively low, the probability
that SMEs choose substantive green innovation converges more rapidly to 1 as t increases, once the administrative penalty
exceeds the threshold level of green innovation investment. Compared with
Figure 6, the speed of convergence is clearly higher under lower financing uncertainty. This result indicates that when financing uncertainty is limited, SMEs face more stable access to capital and are less likely to delay innovation because of financing constraints. Under such conditions, if the government’s administrative penalty exceeds the cost threshold of green innovation, SMEs move more quickly toward substantive green innovation.
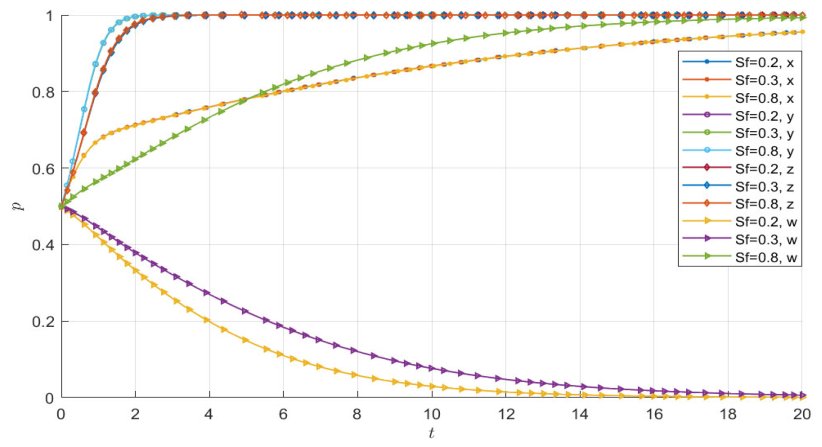
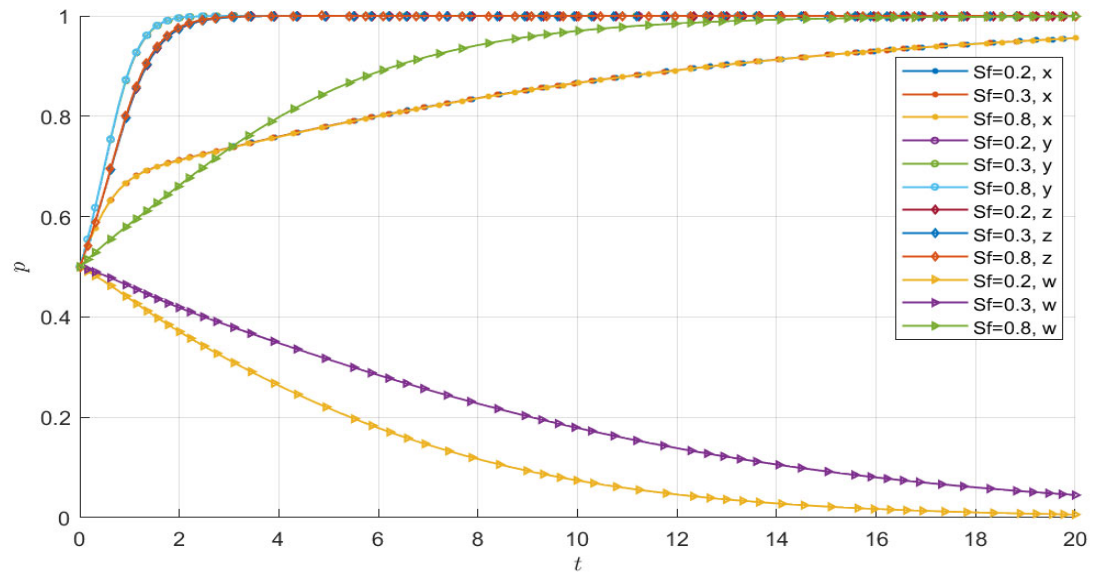
(2) The impact of preferential policies for investing in green projects. According to the preceding stability analysis, government policy incentives for green project investment may affect the strategic choice of investment institutions. Based on the parameter settings reported in
Table 7, this study takes Scenario 4 as an example to examine the effect of policy incentives for green project investment on the game system. Holding all other parameters constant, the policy incentive for green project investment is assigned three values:
,
, and
.
As shown in
Figure 9, holding other conditions constant, an increase in the government policy incentive for green project investment
from 0.2 to 0.8 changes the stable strategy of the game system. Specifically, investment institutions shift from not investing in green projects undertaken by SMEs to investing in such projects. This result indicates that a higher level of Sf directly reduces the investment cost of green projects and raises their expected return. Once Sf exceeds the relevant risk threshold, the marginal utility of the net return from green projects increases markedly, which in turn drives the strategic shift toward investment in SME green projects.
According to the preceding stability analysis, the technological commercialization risk specific to SMEs may affect the strategic choice of investment institutions. To examine this mechanism, and using the parameter settings reported in
Table 7, this study takes Scenario 4 as an example and further analyzes how changes in policy incentives for green project investment affect the game system when this risk declines. Building on the previous analysis, all other parameters are held constant and the technological commercialization risk faced by SMEs is reduced to
. The evolution of the game system is then observed under
,
, and
.
As shown in
Figure 10, the lower the technological commercialization risk specific to SMEs, the faster investment institutions shift toward supporting green projects as time t increases. When the government policy incentive for green investment
rises from 0.2 to 0.8, the probability
that investment institutions choose to invest in green projects undertaken by SMEs converges more rapidly to 1, with the convergence time shortening from 20 to 14. This finding suggests that greater technological maturity reduces the evaluation period for green projects, for example by shortening the time required for technology validation, while policy incentives accelerate the realization of returns by lowering capital costs. Together, these two factors compress the hesitation period in investment decision-making.
4.3. Global Sensitivity Analysis
To further examine whether the numerical results depend on specific parameter settings, this section conducts a global sensitivity analysis over a wider parameter space (
Table 8). The scenario-based simulations in
Section 4.1 examine several representative equilibrium states, while the parameter sensitivity analysis in
Section 4.2 focuses on selected key parameters. By contrast, the global sensitivity analysis allows multiple parameters to vary simultaneously. This approach is used to test whether the main conclusions remain stable under different combinations of regulatory intensity, financing conditions, market demand, carbon trading returns, and technological commercialization risk.
The analysis is based on the four-dimensional replicator dynamic system developed in
Section 3. The parameters included in the global sensitivity analysis are the administrative penalty F, policy incentive for investment institutions
, consumer-side incentive T, green transformation cost
, financing support
, financing uncertainty d, carbon allowance purchase cost
, carbon trading revenue
, carbon-related coefficient
, green product price
, green product demand
, conventional product price
, conventional product demand
, consumer utility U, environmental preference utility M, quality improvement utility
, technology certification cost
, technological commercialization risk
, and revenue-sharing ratio
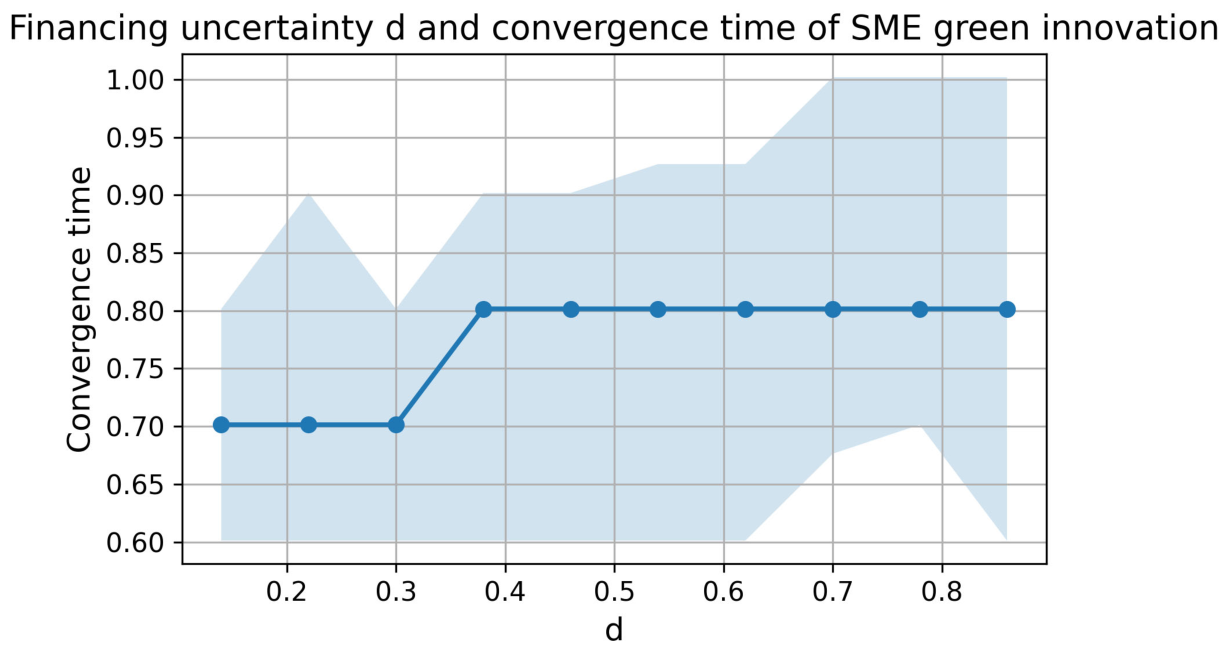
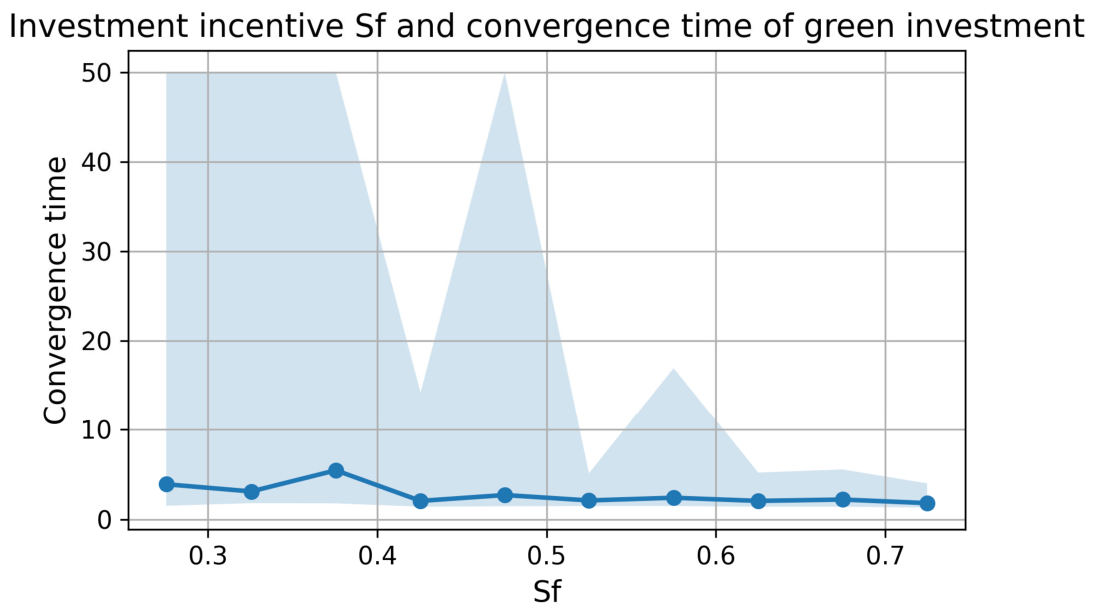
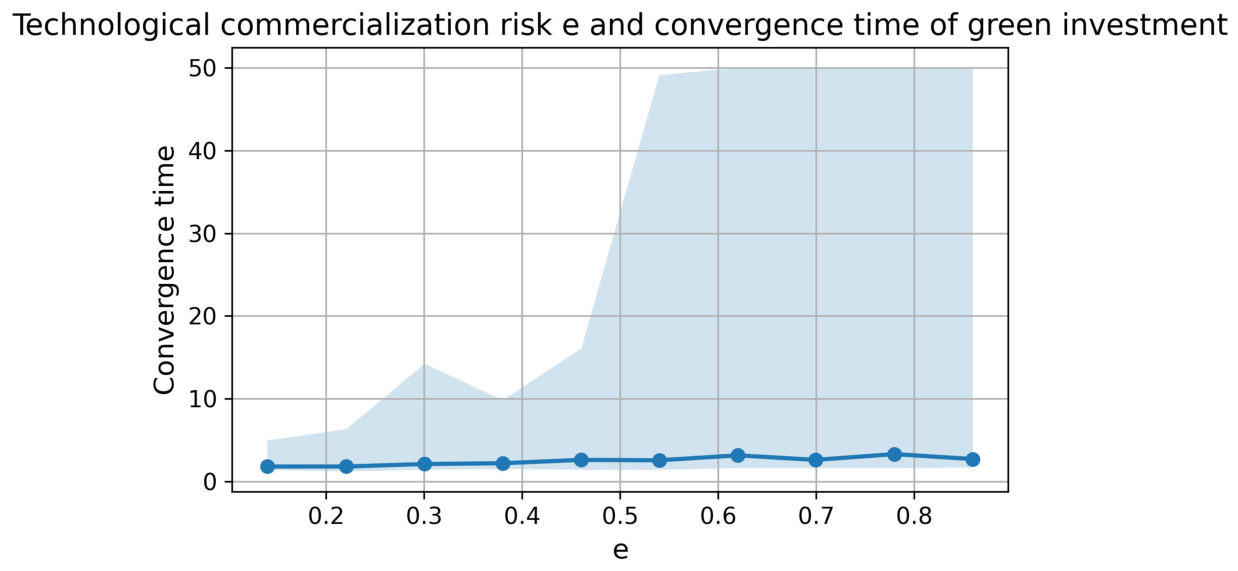
. The baseline values are consistent with the parameter setting used for the ideal equilibrium scenario. For positive parameters, the lower and upper bounds are set as 50% and 150% of the baseline value, respectively. For financing uncertainty d, technological commercialization risk e, and revenue-sharing ratio r, the sampling range is set as [0.1,0.9], because these parameters are bounded ratio-type variables. Latin hypercube sampling is used to generate 1000 parameter combinations within these ranges. For each parameter combination, the evolutionary system is solved numerically with the initial state (0.5,0.5,0.5,0.5).
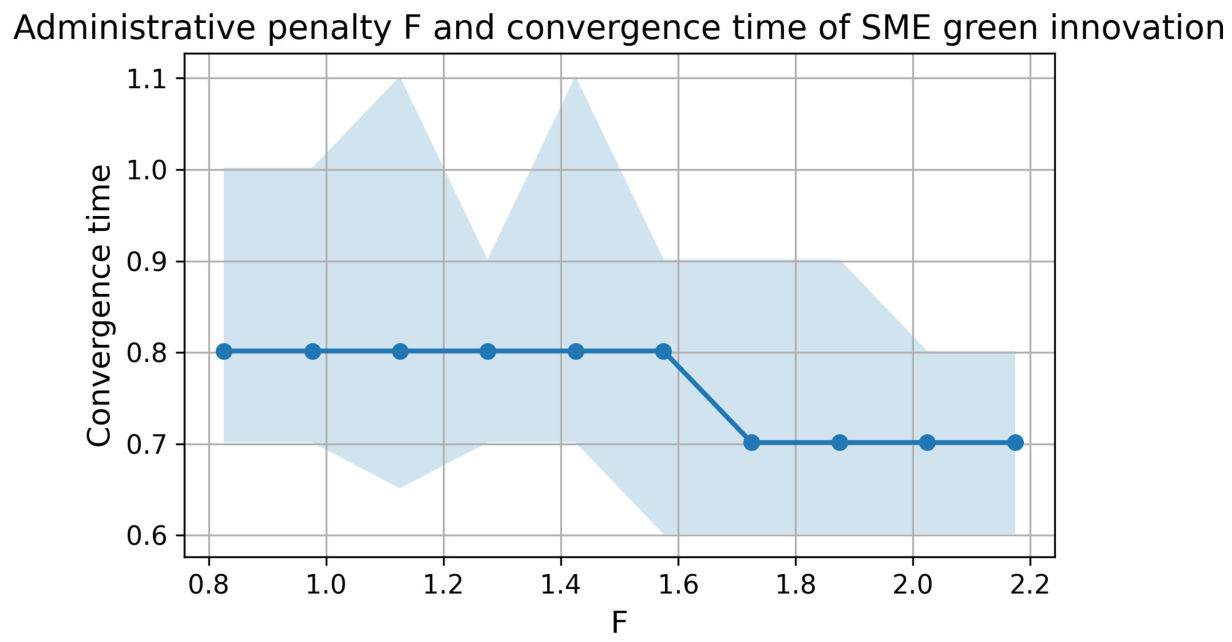
Because the evolutionary system often converges to pure strategies, the final strategy probabilities alone may not fully show how policy and risk parameters affect the evolutionary process. Therefore, this section records both the final strategy probabilities and the convergence time required for each actor to reach the threshold value of 0.9. A shorter convergence time indicates faster strategic adjustment toward the corresponding strategy. If the threshold is not reached within the simulation period, the convergence time is recorded as the terminal time. This treatment makes it possible to examine not only whether the system reaches a stable state, but also how quickly the key actors adjust their strategies under different parameter combinations.
The results in
Table 9 show that the government, SMEs, and consumers converge to their expected green strategies in most parameter combinations. The shares of simulations with x > 0.9, y > 0.9, and z > 0.9 are 1.000, 0.999, and 0.997, respectively. The corresponding mean final strategy probabilities are also close to 1. This indicates that active regulation, substantive green innovation, and green consumption are relatively stable under the sampled parameter space. By contrast, the share of simulations with w > 0.9 is 0.776, and the mean final value of w is 0.791. This suggests that investment institutions are more sensitive to parameter changes than the other three actors. Green investment depends not only on policy incentives, but also on technological commercialization risk, expected revenue sharing, and green project returns.
The convergence time results further show differences among the four actors. SMEs reach the threshold value most quickly, with a median convergence time of 0.802. Consumers follow with a median convergence time of 1.202, and investment institutions reach the threshold with a median convergence time of 2.405. The government converges more slowly, with a median convergence time of 8.016. This result suggests that, under the sampled parameter space, SMEs and consumers respond relatively quickly once the payoff structure favors green strategies, while the government’s regulatory strategy evolves more gradually. The slower convergence of the government strategy is consistent with the fact that regulatory decisions involve policy costs, subsidies, penalties, and expected governance returns.
Figure 11 presents the baseline evolutionary trajectory. Under the baseline setting, the four actors eventually converge to the ideal stable state E16(1,1,1,1), where the government adopts active regulation, SMEs undertake substantive green innovation, consumers purchase green products, and investment institutions invest in green projects. The trajectory also shows that SMEs, consumers, and investment institutions adjust faster than the government. This result is consistent with the theoretical stability analysis and supports the use of E16 as the ideal coordinated state.
Figure 12 reports the effect of administrative penalty F on the convergence time of SMEs’ substantive green innovation. The median convergence time of y decreases as F increases. This means that stronger administrative penalties accelerate SMEs’ transition toward substantive green innovation. A higher penalty increases the cost of non-substantive green innovation and thereby improves the relative attractiveness of substantive green innovation. Thus, administrative penalties affect not only the final innovation choice of SMEs, but also the speed of strategic adjustment.
Figure 13 shows the effect of financing uncertainty d on the convergence time of SMEs’ substantive green innovation. The convergence time tends to increase when d becomes higher. This indicates that financing uncertainty delays SMEs’ transition toward substantive green innovation, even when the final strategy remains favorable. Higher financing uncertainty weakens the effective financing support available to SMEs and reduces their capacity to bear the initial costs of green transformation. This finding confirms that financing uncertainty is an important boundary condition for the effectiveness of regulatory pressure.
Figure 14 presents the effect of policy incentive
on the convergence time of green project investment. The median convergence time of w generally decreases when
increases, especially in the higher incentive range. This suggests that stronger policy incentives can accelerate the participation of investment institutions in green projects. However, the interquartile range remains relatively wide in some intervals, which means that investment behavior is also influenced by other factors, such as technological commercialization risk, revenue-sharing arrangements, and expected green project returns. Therefore, investment incentives are effective, but their effect depends on the broader risk-return conditions faced by investment institutions.
Figure 15 reports the effect of technological commercialization risk e on the convergence time of green project investment. The convergence time of w increases as e rises. This result indicates that higher technological commercialization risk delays investment institutions’ willingness to invest in green projects. When green technologies face higher certification costs, uncertain market acceptance, or unclear revenue prospects, investment institutions require more favorable conditions before entering green projects. The widening interquartile range at higher levels of e further suggests that commercialization risk increases the uncertainty of investment behavior.
The global sensitivity analysis supports the robustness of the main conclusions. Administrative penalties and investment incentives help accelerate the transition toward substantive green innovation and green investment, while financing uncertainty and technological commercialization risk delay the adjustment of SMEs and investment institutions. These findings are consistent with the scenario-based simulations and the local sensitivity analysis. They also indicate that the transition toward E16(1,1,1,1) depends not only on the intensity of policy instruments, but also on whether financing conditions and commercialization prospects improve at the same time. The results further suggest that financing structure may affect the equilibrium path of SMEs through both extensive and intensive margins. From the extensive margin, broader access to external finance increases the likelihood that investment institutions participate in green projects, which helps the system move away from equilibria where SMEs lack capital support. From the intensive margin, stronger financing support, lower financing uncertainty, longer investment horizons, or more stable financial commitments can accelerate SMEs’ convergence toward substantive green innovation. In the model, these effects are mainly reflected through , d, , and e. A higher or a lower improves SMEs’ effective financing support, while a higher or a lower improves investment institutions’ willingness to participate. Therefore, SME green innovation under the carbon emission trading system requires coordinated policy design that combines regulatory pressure, financing access, financing intensity, market incentives, and technology commercialization support.
5. Discussion
The results show that SME green innovation is not driven by a single policy instrument. Although government regulation is important, its effect depends on whether SMEs have enough financial capacity to respond. When financing uncertainty is high, stronger penalties may increase the cost of non-substantive green innovation, but they may not be sufficient to induce substantive green innovation. This finding suggests that regulatory pressure must be combined with financing support. Otherwise, SMEs may face higher compliance pressure without being able to complete green transformation.
The results also show that consumer demand and investment support are important but conditional. Green consumption can improve the market return of green innovation, but this effect depends on whether SMEs can convert demand into actual revenue. Similarly, investment institutions can provide external capital for green projects, but their willingness to invest depends on policy incentives and technological commercialization risk. When certification costs are high, market acceptance is uncertain, or expected returns are unclear, investment institutions may remain cautious even under policy support. This explains why SMEs may still hesitate to undertake substantive green innovation when green demand and regulatory pressure already exist.
A key implication of the model is that financing uncertainty and technological commercialization risk jointly shape the effectiveness of policy tools. Administrative penalties become more effective when financing uncertainty declines, because SMEs are then more able to bear the initial costs of green transformation. Policy incentives for green investment become more effective when commercialization risk is reduced, because investment institutions are more willing to support green projects with clearer certification prospects and market returns. Therefore, policy effectiveness depends not only on the intensity of penalties or subsidies, but also on whether financing and commercialization barriers are reduced at the same time.
The findings also highlight the system nature of SME green innovation. Government regulation changes the cost–benefit structure of firms, consumers, and investors. SMEs’ innovation decisions affect the supply and credibility of green products. Consumers influence the market return of green innovation through purchasing behavior. Investment institutions affect whether SMEs can obtain external capital and sustain green projects. These actors are interdependent, and the ideal equilibrium E16(1,1,1,1) can be achieved only when regulation, green demand, financing support, and commercialization conditions improve together. Thus, SME green innovation should be understood as a coordinated evolutionary process rather than as the direct result of a single policy intervention.
From a policy perspective, the results suggest that governments should avoid relying only on stronger penalties or higher subsidies. A more effective policy package should combine regulatory pressure with green finance instruments, risk-sharing mechanisms, technology certification support, and green market cultivation. For SMEs with severe financing constraints, loan guarantees, risk compensation funds, and stable green finance channels may be more important than penalties alone. For investment institutions, policy incentives should be accompanied by mechanisms that reduce commercialization risk, such as certification support, technical evaluation services, and clearer market demand signals. Such coordinated policies can help the system move from partial or low-level equilibria toward the coordinated green innovation state.
6. Conclusions
First, SME green innovation is constrained by both financing uncertainty and technological commercialization risk. When financing constraints are severe and technology certification costs are high, firms may still avoid substantive green innovation even under active government regulation. Under such conditions, consumers and investment institutions are also less likely to form stable green choices, and the system may remain trapped in a low-level equilibrium.
Second, government regulation has a positive effect on SME green innovation, but this effect depends on firms’ financing conditions. Stronger administrative penalties increase the cost of non-substantive green innovation and raise the likelihood that SMEs shift toward substantive green innovation. They can also strengthen consumers’ willingness to purchase green products by improving the credibility of green production. However, when financing uncertainty remains high, SMEs may still lack the capital needed for green transformation, even under stronger regulatory pressure. The simulation results show that administrative penalties become more effective when financing uncertainty declines, because firms are then better able to bear the initial cost of green innovation.
Third, market demand and capital support can provide important external incentives, but they are not sufficient on their own to trigger green innovation. Even when government regulation is active, consumers purchase green products, and investment institutions support green projects, SMEs may still choose not to innovate if financing barriers remain high and technology certification costs are substantial. The initiation of green innovation therefore depends not only on demand and capital supply, but also on whether firms can overcome financing and commercialization barriers.
Fourth, investment support depends on both policy incentives and technological commercialization risk. Policy incentives can increase the expected return of green investment, but their effect is limited when certification costs are high, technology validation remains uncertain, and market acceptance is unclear. Under such conditions, investment institutions may still refrain from supporting green projects even if firms have already engaged in green innovation and consumers have already chosen green products. By contrast, when government increases policy incentives for green investment and commercialization risk declines at the same time, investment institutions become more willing to support green projects. Under these conditions, a more favorable evolutionary outcome can emerge, characterized by active regulation, substantive green innovation, green consumption, and green investment.
Overall, SME green innovation is gradual and strongly condition-dependent. Government regulation can play a guiding role, but whether regulatory pressure translates into actual firm behavior depends on financing conditions and the feasibility of technology commercialization. Consumer demand and investment support can accelerate the evolution of green innovation, but their effects also depend on the easing of financing constraints and technology-related risk. These findings indicate that policy effectiveness depends not only on the intensity of penalties, subsidies, or investment incentives, but also on whether financing and commercialization barriers are reduced at the same time.
This study has several limitations. First, the analysis is based on evolutionary game theory and numerical simulation. Parameter changes are used to capture theoretical trends in strategic adjustment under different scenarios rather than to match real-world magnitudes directly. Therefore, the findings are more suitable for explaining mechanisms and comparing conditions than for predicting specific quantitative effects. Second, SMEs are treated as a relatively homogeneous group, although firms may differ substantially across industries, regions, ownership structures, and stages of development in terms of green innovation capability, financing conditions, and sensitivity to policy intervention. Third, the model focuses on the interactions among government, SMEs, consumers, and investment institutions, but does not include other actors that may also influence SME green innovation, such as core firms in the supply chain, industry associations, financial intermediaries, or third-party certification bodies. As a result, the broader ecosystem of SME green innovation is only partially captured. Fourth, the consumer side is modeled at an aggregate level. Although product price, product demand, consumer preference, and consumption-side incentives are included in the payoff structure, the model does not explicitly capture individual-level heterogeneity in green preferences, willingness-to-pay differences, or the price elasticity of green demand.
These limitations suggest several directions for future research. First, future studies could use firm-level microdata, industry samples, or regional panel data to test the mechanisms and evolutionary patterns identified in this study. Second, further research could distinguish among industries, firm sizes, ownership structures, and regional institutional environments to examine heterogeneous effects more explicitly. Third, the set of actors could be expanded to include upstream and downstream supply chain firms, third-party certification agencies, financial intermediaries, and other market service providers, thereby providing a more complete account of how SME green innovation develops within a broader innovation ecosystem. Fourth, future research could introduce heterogeneous consumer types, willingness-to-pay distributions, or price-elastic demand functions to better explain the attitude–behavior gap in green consumption. Finally, future studies could examine the long-term effects of different policy combinations by considering changes in green finance instruments, carbon market rules, and green consumption policies over time.