1. Introduction: Background and Prior Studies
The Distribution and Logistics (DL) sector has accelerated digital transformation in response to the dispersal of disruptive ICT innovations since 2010—including mobile devices and networks, data analytics, and platform business models. This transition has been driven not by government planning but by voluntary innovation among private firms and their stakeholders. Rapid reconfiguration and transition is ongoing and is expected to continue in the areas of e-commerce and omnichannel, promising permanent structural changes, given that the service chain or service delivery process continues to be reorganized at numerous (even new) service encounter points. Additionally, as various tech platforms play a significant role in this transition, their influence is likely to spread to other industries. Indeed, spillover effects to different sectors have been frequently observed. To verify and quantify these dynamics centered on the DL industries at a national scale, this study employed IO (Input–Output or industrial–relation) data and an IO framework.
Considering the various activities and players across the DL industries, digital innovations have been driven by key segments or functional elements—most prominently in the last mile segment, facilitated by e-commerce and omnichannel. Anticipated by consulting and research institutions since 2010, the growing influence of retail platforms such as Amazon has intensified innovation and competition in the last mile section [
1]. Many recent studies [
2,
3,
4,
5,
6,
7,
8,
9] have demonstrated and analyzed business model shifts and digitization in last mile retailing. However, most of these studies have focused only on a specific segment of the DL industries, limiting the quantification of the impacts of changes in last mile retailing and its surrounding landscape on other industries. To address this research gap, this study tracks changes in the industrial ecosystem over 30 years from 1990 to 2023 (the most recent year for which consistent data are available) to examine interactions between the last mile segment and other industries, as well as changes in their relational structure across the entire economic system. For example, since digital transformation began accelerating after 2010, particularly around 2015, this study compares the situations before and after 2010–2015 from various perspectives.
Since the IO framework is the most effective methodological approach for structurally analyzing interactions with other industries centered on a specific sector and for tracking their changes over years to decades, we also employed it to quantify and analyze multi-industry interactions, influence paths, and role changes. Indeed, it is most appropriate to employ IO data and models to understand interactions and linkages with other industries. For example, refs. [
10,
11,
12,
13,
14,
15] conducted traditional IO analyses of the transportation service industry or distribution sectors.
However, these IO models for the logistics or distribution sectors do not adequately account for recent changes in the LD sector, particularly in the last mile segment. For example, since prior studies focused on transportation services, which encompass the overall logistics from the first to last mile or only deal with the wholesale and retail distribution domains, they are subject to an inherent limitation in properly capturing a newly emerging domain (e.g., structural changes in last mile delivery), in which various processes such as logistics services, warehouses, and loading/unloading activities work altogether. As for the LD sector in particular, even e-commerce has been greatly affected by the rapid, widespread expansion of the mobile service environment since 2010–2015. The supply chain surrounding the last mile segment has also been reorganized into dual and omnichannel, making it difficult to properly capture the transition with only the data frame applied to the existing IO model. From the perspective of the existing data frame, the LD sector will comprise most of the wholesale and retail distribution domain, as well as some parts of the transportation service domain. In the latter, the actual transaction volume for last mile activities will vary from year to year.
The greatest cause of the methodological challenges described above is that, when applying the IO framework, the current IO data frame, rooted in mid-twentieth-century industry classification, cannot adequately capture rapidly reorganized domains such as the DL industries, including last mile retailing. Thus, we first need to reconstruct the IO dataset based on our definition of the Last mile Distribution (LD) segment by rearranging the generic IO data to enable proper recategorization of the LD sector: LD and other sectors in the DL industries. Other industries, except the DL industries, are assumed to be consistently placed within the existing taxonomy.
Indeed, some prior studies have taken this approach. That is, some IO model-based studies analyze specific business domains by operationalizing the notions of target domains in the current classification system and reconfiguring the entire IO data frame. For example, ref. [
16] compared and analyzed the ICT industries, comprising software, manufacturing, and services, in Korea and the United States over 15 years using IO tables based on the World Input–Output Database (WIOD). Since the WIOD does not specify the ICT industry, to identify and analyze the ICT industries, they were treated as compositions of relevant parts of the manufacturing and service industries. Following a method similar to that used in the study above, ref. [
17] reconstructed the WIOD to track changes in the global supply chain. Ref. [
18] also divided and adjusted the higher-level WIOD classification to specify the consumer automobile domain, excluding cargo and industrial vehicles from the original WIOD automobile industry category. Ref. [
19] applied IO analysis after specifying the target construction sector by re-matching the existing SIC’s higher- and lower-level categories to analyze the changes in the construction industry after introducing the carbon tax. Refs. [
20,
21] specified the domains of well-being and digital bio-healthcare, respectively, using the existing IO data frame. Then, they analyzed the ripple effects on other industries and the investment effects of these newly defined sectors. Since it is more difficult to identify emerging sectors such as well-being and digital bio-healthcare within the existing SIC system, the target sectors were operationally redefined by specifying sub-sectors at lower levels of classification based on their relevance to the target business domains.
While most of the literature views the last mile sector from a microscopic perspective, we employ macro- and mesoscopic lenses to provide a holistic view of its evolution within the national industrial ecosystems. Thus, our systematic approach bridges the gap between individual business practices and their aggregate economic impacts. In particular, we define the LD sector based on the IO model’s classification system and reconstruct the entire IO dataset, following some prior studies listed above. The data frame used in the IO model is based on a standardized industry classification, such as the internationally accepted Standard Industrial Classification (SIC). The SIC has been used since the mid-20th century, during the era of industrialization, so it cannot accurately classify a new, emerging business domain such as the LD sector. For this reason, few studies have applied the IO model by specifying the LD sector. However, since the SIC-based IO data frame still provides the most objective classification rule and is widely accepted in many countries, we first extract data for the target domain—the LD sector—from the IO data frame and reconfigure the entire data frame to incorporate the newly created sector, while preserving other transactions and relational interactions.
To the best of our knowledge, this study is the first to apply IO analysis to the LD sector by reconfiguring IO data frames, and this methodological novelty enables a detailed analysis beyond static descriptions of this sector. We also construct industrial relations networks using IO data and apply network analysis to review and supplement the results obtained from the IO model, which contributes to the demonstration and empirical understanding of its coevolutionary process over a 30-year trajectory. For example, the LD sector has transformed from a simple service enabler into a crucial authority that facilitates forward linkage effects for other major industries in the digital era.
This paper is organized as follows.
Section 2 introduces the methodological background and outlines the basic framework for utilizing an IO model and its associated data.
Section 3 introduces our approach to defining the LD sector, which is the target sector of this study, based on the IO data frame. We reconfigure and reconstruct the existing IO table to apply IO analysis to the target sector. Thus, the generic Distribution and Logistics (DL) industries are reorganized into the LD sector and the remaining sector (to be called the other distribution (OD) sector).
Section 4 presents the results of applying the IO model to the reconstructed IO data together with further network analysis. By comparing data outcomes over the periods from 1990 to 2023, we analyze the impacts and ripple effects of digital transformation that occurred in the interim (particularly between 2010 and 2015).
Section 5 concludes this paper by discussing the analysis results, the limitations of our approach, and directions for future work.
2. Research Framework and Approach: IO Model
This section introduces the IO model, which serves as the methodological foundation of this study. Although
Section 3 presents a methodology for reconstructing IO data based on operational definitions of system boundaries and corresponding data frames regarding the LD sector, these relate to the data input used in the model; thus, the models introduced in this section constitute the methodological basis of this study. The typical IO model provides annual transaction data for each pair of n industries, which are defined based on OECD or UN SIC codes. The IO model is best presented in the following format [
22]:
where
is a column vector of gross output produced by
n industries;
is a matrix of interindustry transaction volume between industries
i and
j (i.e., intermediate input from industry
i to
j);
is a column vector of the final consumption of each industry; and
is a column vector whose components are all one. As the core elements of the IO model and data,
,
, and
conceptually represent quantities such as transaction volume and supply scale between industries [
22]. In practice, however, IO data are usually aggregated and evaluated as pecuniary transaction amounts in terms of supply price (and there is no difference between the quantity and price approaches in describing and utilizing the IO model). Since
,
, and
allow us to quantify the relationships and structural characteristics between
n industries or sectors, the IO framework has been widely employed in industrial ecosystem analysis (as introduced in
Section 1). Equation (1) can be further rearranged by incorporating the technology coefficients
1 as follows:
According to the Input–Output approach, “intermediate demands” represent the transaction volumes exchanged between pairs of sectors to use intermediate goods (products and services), so matrix can be considered the set of all B2B transactions. In the same vein, the “final demand” vector can be interpreted as the transaction volumes of B2C trades because each sector supplies its goods or services to its end users.
Now, assuming that
is nonsingular, Equation (2) can also be rewritten in the following Leontief identity:
(denoting the Leontief inverse as
).
From the same IO data, we can also construct row vector
, where
is the share of value-added generated by industry
i (
) in its output
: that is,
. The notion of Gross Domestic Product (GDP) is defined as the sum of the gross added value generated by all industries, which can be approximately characterized as Equation (4) in the IO framework:
From Equation (4), one can directly extract the gross added value generated by some selected or focal industries. Furthermore, one can also calculate the contributions of non-selected industries that provide products and services to the focal industries through indirect channels, which include the three elements specified below:
where
F represents the set of focal industries
2.
Equation (5) includes the GDP generated by the focal industries through their interactions. Equation (6) captures the added value generated by the focal industries through their transactions provided to other industries whose indices do not belong to F. This effect pertains to the destinations of added value generated by the focal sectors. Note that Equations (5) and (6) capture the overall value created by the focal industries. Lastly, Equation (7) encompasses the added value generated by the non-focal industries through their sales to the focal industries (in other words, products and services that flow from non-focal industries to focal industries). Such an explanation pertains to the sources of added value in the focal industries. Here, the sources and destinations refer to industries on which the focal industries depend (so-called “enabling industries”) and those aided by the focal industries (so-called “enabled industries”).
To present the interdependencies of industries—e.g., forward and backward linkages—as a whole (without distinguishing between focal and non-focal sectors), it is more convenient to express Equations (5)–(7) in a different form using matrices and vectors. Since this expression and approach are more widely utilized for many applications [
11,
18,
21,
23], they will also be employed in our study. Now, let
denote the matrix constructed by diagonalizing the vector
, where the diagonal elements
in
equal the corresponding element of
in vector
and the other elements
(
) in
. Then, the matrix
is an
n×
n matrix that disaggregates the total GDP across all industries. That is, each row
i of
represents the distribution of the added value created from industry
i across all industries (or towards all destinations). Thus, adding all entries in row
i gives the amount of contribution to GDP from industry
i, which is usually called the ‘forward linkage effect’ of industry
i (refer to Equation (5) and Equation (6) with
F). Accordingly, tracing the matrix
row-wise presents the respective forward linkages. And each element
in the
ith row represents the value creation scale enabled or supported by sector
i whose product works as an input factor to sector
j. Moreover, each column
j constitutes the breakdown of the value-added contributions (as sources) of all industries to the total production of industry
j. Thus, summing all entries in a column results in the value of the total production of the industry, which is usually called the “backward linkage effect” of industry
j (refer to Equation (5) and Equation (7) with
F). Similarly, tracing
columns-wise presents the respective backward linkages. Each element
in the
jth column represents the value creation scale triggered or led by sector
j that employs the product of sector
i as an input factor
3.
Based on the representation method above, one can capture, quantify, and analyze relationships between specific industrial ecosystems and other sectors. Indeed, this technique capitalizes on the unique potential of the IO framework. While IO models in economics rely on existing industry classification systems and utilize this framework to calculate various economic indicators, including multiplier effects, this study focuses on the structural relations between the DL ecosystems and other sectors; therefore, it does not calculate economic indicators such as multiplier effects. In fact, the generic IO data and existing industry classification system do not explicitly consider the LD sector, requiring a separate database to estimate those indicators. This study focuses on extracting specific sectors (e.g., LD) from the existing IO data frame (see
Section 3.2 and the pseudocode for reconfiguring the existing IO data frame with respect to particular sectors, which is also a novel contribution of this study). It then utilizes the representation method presented above to quantify and analyze the relationships between the newly configured sectors and other industries.
3. Data and Methodology
Section 3 covers the dataset and the data processing to be applied to the IO model. First, it explains the background and practical issues related to the IO data frame, and presents the data source and its inherent characteristics for use in this study.
Section 3.2 introduces the concept and operational definition of the LD and OD sectors’ system boundaries and provides a methodology for reconfiguring IO data based on the generic IO data frame and operational definition.
3.1. Data
We employed IO datasets from 1990 to 2023 to analyze the evolution of the Distribution and Logistics (DL) industries across the middle and last mile segments. They are the most recent IO datasets officially managed, published, and issued by the Bank of Korea
4. National IO data are usually managed by a state agency that collects, processes, and discloses data. Since collecting and organizing nationwide data takes quite a long time and requires enormous administration efforts, almost all OECD countries usually publish the official IO data every three to five years. Although the 2020 and 2023 datasets may fall a little short of capturing the most recent trends, they will be sufficient to serve the primary purpose of this study, which is to analyze and compare changes in overall trends before and after the digital transformation implemented in the DL industries, especially after the 2010–2015 period.
Another point to consider when using IO data is that they actually exhibit an approximately 2-year time lag. For example, when comparing a couple of years, such as 2010 and 2020, the former captures conditions around 2008–2009, when smartphone adoption and mobile innovation were not yet prevalent, while the latter captures conditions around 2018–2019, when digitization was well underway. Furthermore, the 2020 IO data do not reflect the impact of the COVID-19 pandemic, whereas the most recent 2023 release of the IO dataset (an extended estimate based on the 2020 dataset) captures pandemic-related peculiarities. Accordingly, comparing reference years such as 2000, 2010, and 2020 will facilitate benchmark comparative analysis of the LD sector across the pre-Internet, early digitalization, and digitization expansion periods, which clarifies LD’s evolving roles and distinctive characteristics from a macroscopic perspective.
The IO data frame is divided into high-, middle-, and low-level categories according to the degree of granularity of the industries. In our Korean dataset, the high-level categories are divided into 27–33 industries, 76–83 at the middle level, and 170–190 at the low level, and the system codes are assigned (the total number of codes varies because the classification standard may change year by year). This study employs IO datasets that classify industries into, for example, 27 sectors in 1990–1995, 30 in 2010–2015, and 33 in 2020–2023
5. In fact, many studies also use IO data arranged in the high-level category, since middle- and low-level categories divide industries too finely to properly capture essential transaction patterns across industrial departments in a nationwide economy. For this reason, it is necessary to aggregate transaction flows across sectors at an appropriate level, based on the target sector’s economic scale and other conditions. For the DL industries, we concluded that it is appropriate to use the high-level dataset, with some rearrangement, to depict and examine relationships with other industries (see
Table 1 below).
3.2. Methodology: IO Data Reconfiguration
3.2.1. Operationalization of Last Mile Retailing Under Digital Transformation
As shown in
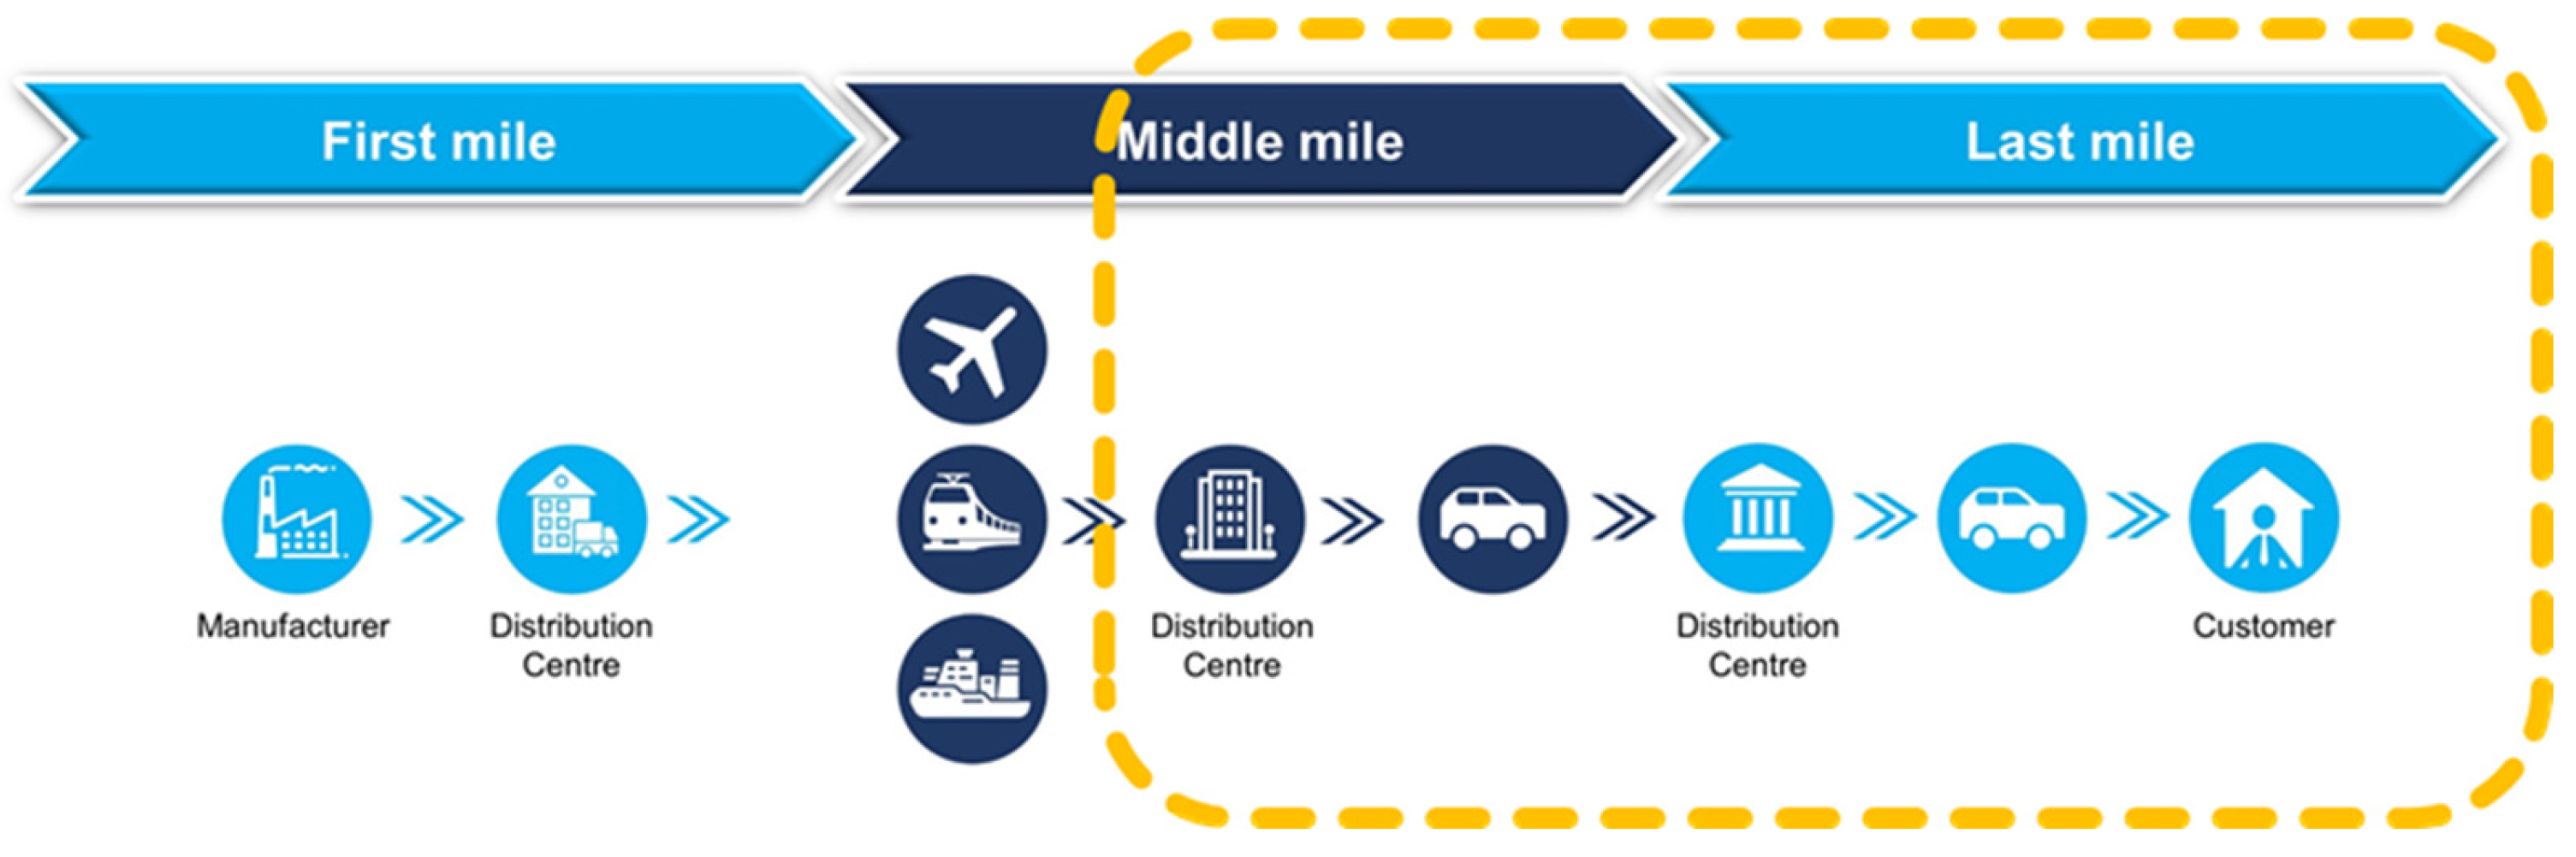
Figure 1, the DL industries consists of diverse sections such as the first, middle, and last mile sections. Based on such delineation, this study defines the LD sector as centering on some parts of the middle mile and the whole part of the last mile that are directly affected by and leading digital transformation, thereby allowing us to examine how the entire DL industries and its relationships with other industries have evolved from this point of view. If the LD sector and other logistics and distribution domains (called the “other distribution or OD” sector in their aggregation into one sector) were well defined in the generic industry classification or at least by convention, then the DL industries as a whole could also be well characterized as the sum of the two sectors—LD and OD. If this were the case, then by setting
F in Equations (3)–(7) to LD and/or OD, one could quantify and analyze the extent to which these sectors contribute to overall wealth creation and their relationship with other industries within the IO framework.
However, as mentioned earlier, the LD sector has never been defined in accordance with the existing SIC system. Moreover, the existing classification was not well designed to proactively capture a newly emerging sector, such as the LD sector, where digital transformation has been widely applied in recent years. For example, most sub-sectors in the retail and wholesale industries are deeply involved in digitizing the middle and last mile segments, while some sub-sectors in the transport industry are not intensely related to such transition. For this reason, we first need to operationalize the notion of the LD sector for our research purposes by extracting the relevant parts concerning the target segments from the existing classification system and IO data frame. The process proceeds as follows, following the schemes employed in some prior studies, such as [
18,
19,
21]
6.
First, we characterize the LD sector based on the generic SIC scheme. That is, the LD sector is constructively defined in the high-level classification by identifying sub-sectors (at lower levels) highly relevant to the notion of the last mile segment and integrating them in a bottom-up manner. The selected sub-sectors are business domains that make a significant contribution to the operations and expansion of e-commerce and omnichannel (e.g., for the year 2020, refer to
Table 1). As a result, the LD sector has been operationalized and designated as the target sector for this study, which is closely related to digital transformation. Sub-sectors left in the lower-level classifications of the generic categories (mainly in the transportation industries) are integrated into the OD sector. Accordingly, the LD sector is the most influential in terms of the digitalization of the DL industries, while the OD sector is relatively less influential.
Since there have been some changes across industries and economic activities, the SIC system also varies slightly from period to period. In the case of the LD and OD sectors, however, there has been relatively little change in the SIC system between 1990 and 2023. The high-level categories have remained largely unchanged, and a few changes to the mid- and low-level categories do not compromise the consistency of the reconstruction procedure. Looking at
Table A1 in
Appendix B, the classification adjustments in the DL industries have been relatively minor and have mainly occurred at the lower-level classification of the transportation sector, which is not decisive for defining the LD sector. For example, the LD sector comprises “Wholesale, retail and other intermediary services” and “Transport services” in the high-level classification. Regarding “Wholesale, retail and other intermediary services,” this category has not been refined in the mid- and low-level classifications for over three decades. Indeed, it can be said that this sector represents the LD sector well, as it practically encompasses wholesale and retail. In the case of “Transport services,” it is subdivided into multiple sub-sectors in the mid- and low-level classifications, as shown in the table below. Among them, the sub-sectors shaded in the table are the business domains not directly related to the digitization of the LD sector (as reconstructed and redefined above). For example, “Railway transportation services (code 531)” is not directly related to transportation or logistics for e-commerce or omnichannels in the last mile segment, as explained above (see
Figure 1). The same reasoning applies to “Water transportation services (codes 54 and 540)” and “Air transportation services (codes 55 and 550).”
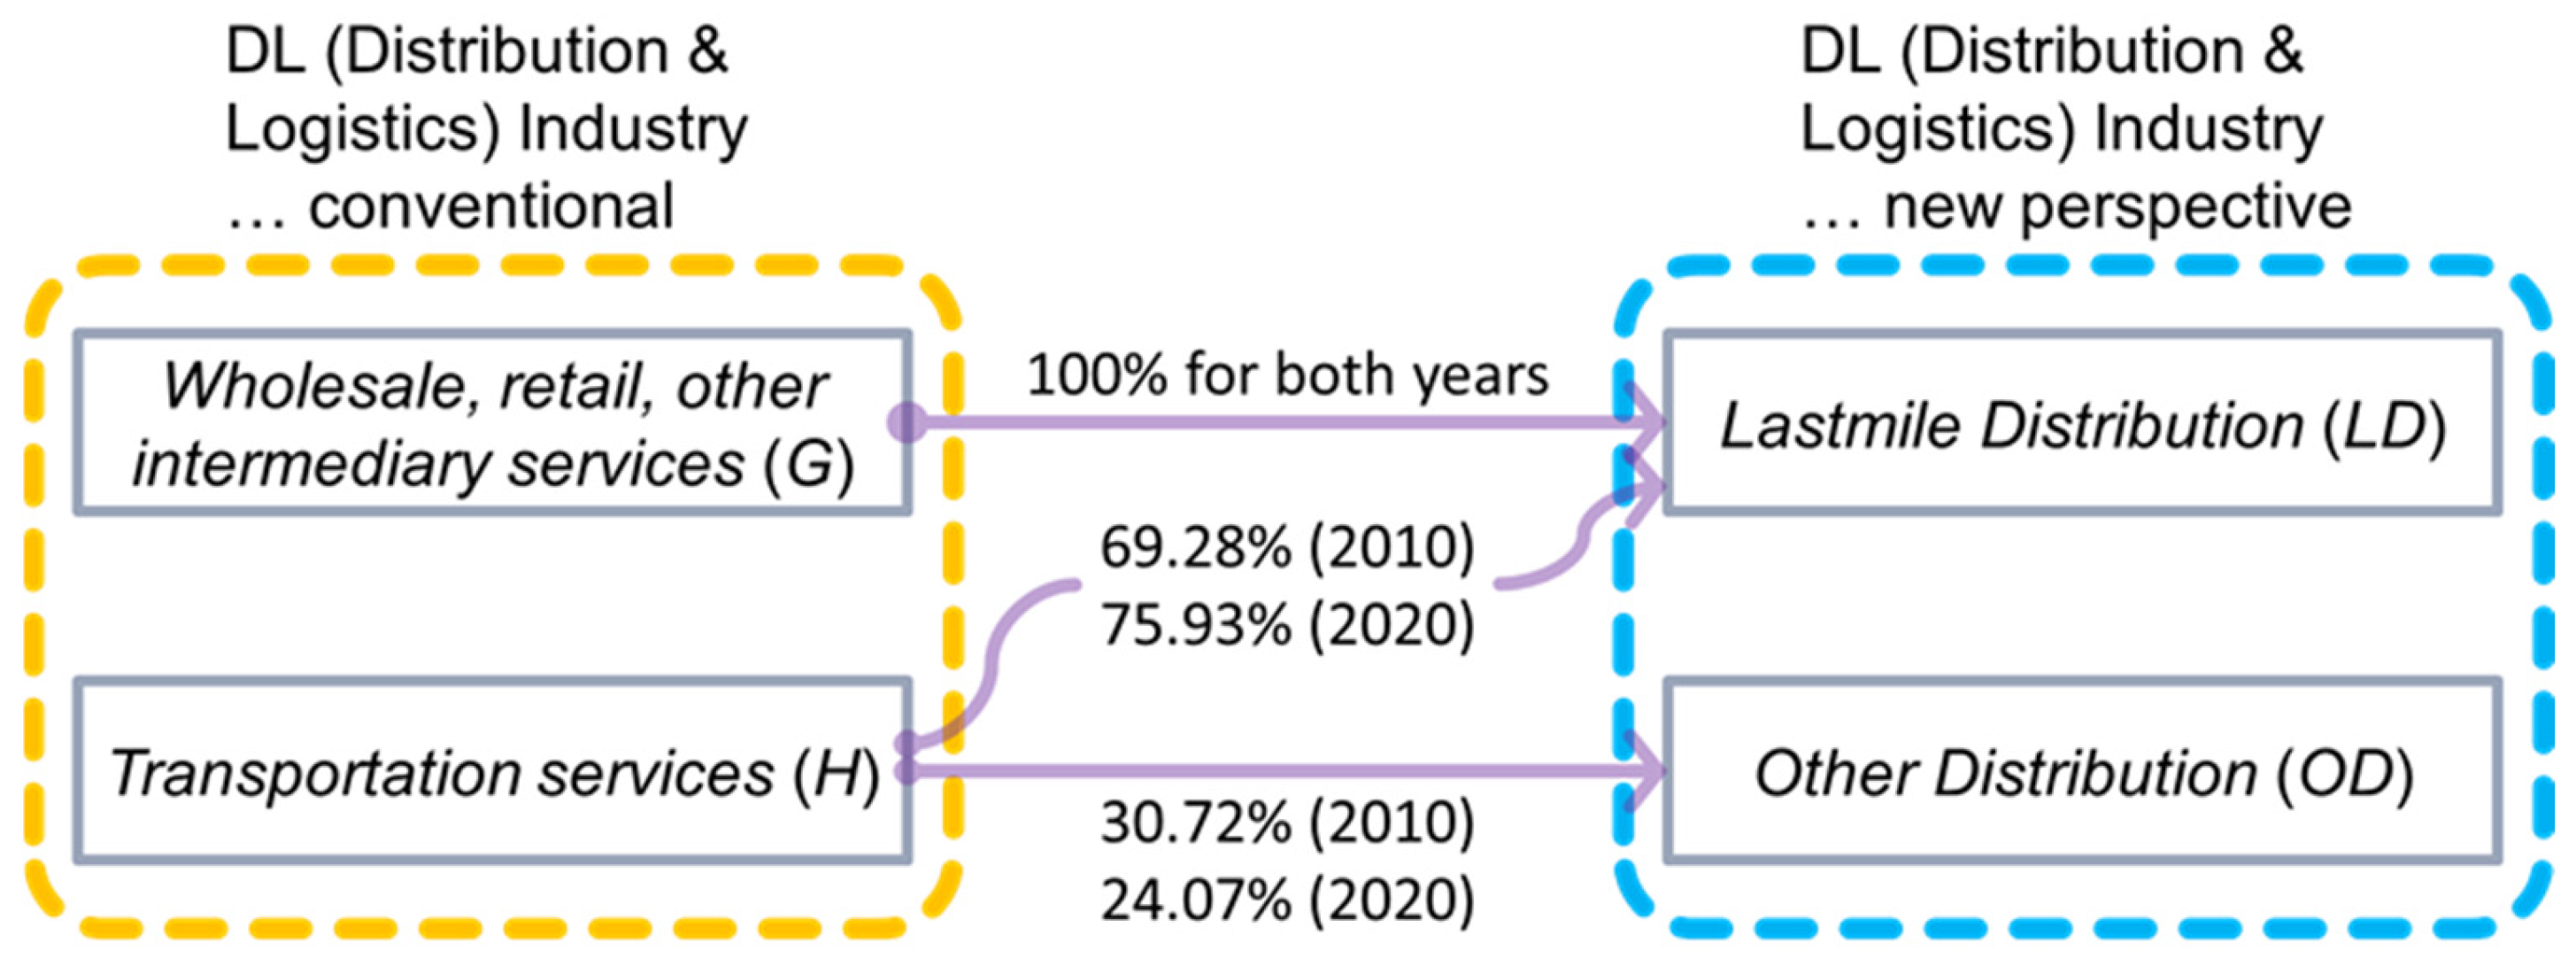
Even if there are no significant changes in the industrial classification itself, inter-industry transactions and relationships vary from year to year. Thus, in addition to the conceptual delineation of the LD sector, its actual scope and scale should be assessed on a period-by-period basis. The process for this assessment is explained in the following section (
Figure 2 and
Figure 3 summarize the idea and procedure).
3.2.2. IO Data Reconfigurations
With the LD sector and OD sector definitions, we reorganize the IO table by reallocating the entire IO data to the ratio that each sector contributes to the amount of value created for the DL industries. In other words, the LD sector is composed of the whole transaction volume (100%) regarding “Wholesale, retail and other intermediary services (code G)” and the fraction (say, α%) related to the LD sector out of the total transaction of “Transportation services (code H)” in the high-level classification. Therefore, the remaining portion of “Transportation services” (1 − α%) is reallocated into the OD sector. Since codes G and H of the original categories are reconstructed into codes LD and OD, there is no change in the total number of sectors (in the high-level classification). The α% applied to the “Transportation services (H)” is calculated as the proportion of the total value created by sub-sectors directly related to LD in the lower-level classifications split from code H (see
Table 1) against the whole value created in H, and varies year by year. The figures below illustrate the reconfiguration process described above. They also specify the numerical scales of each year, by which the generic DL industries are restructured into LD and OD sectors.
Table A1 in
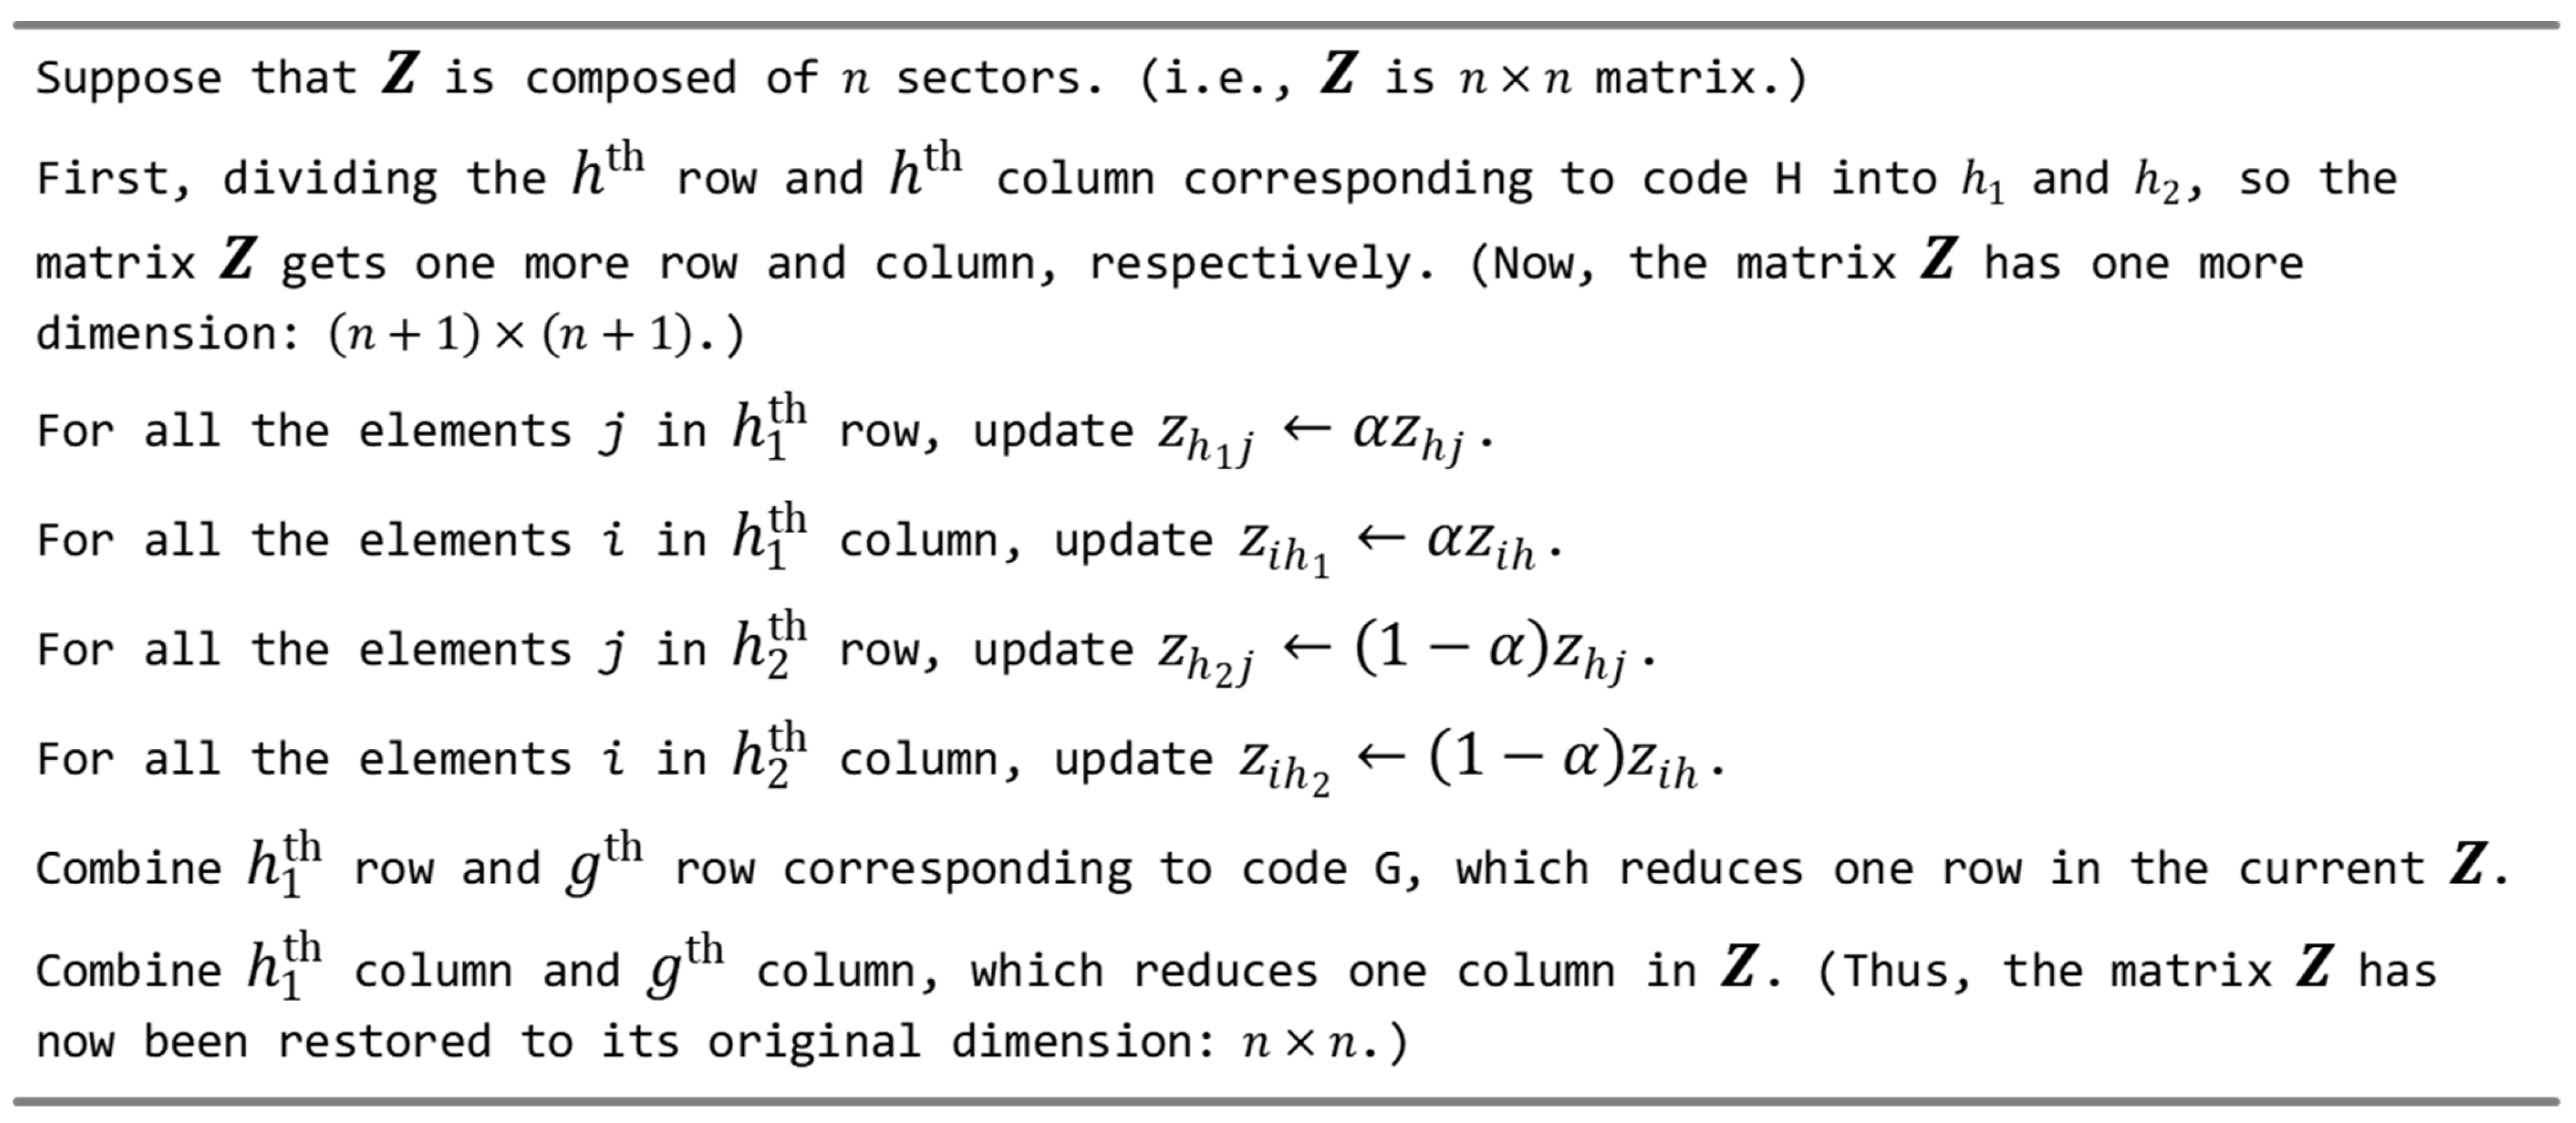
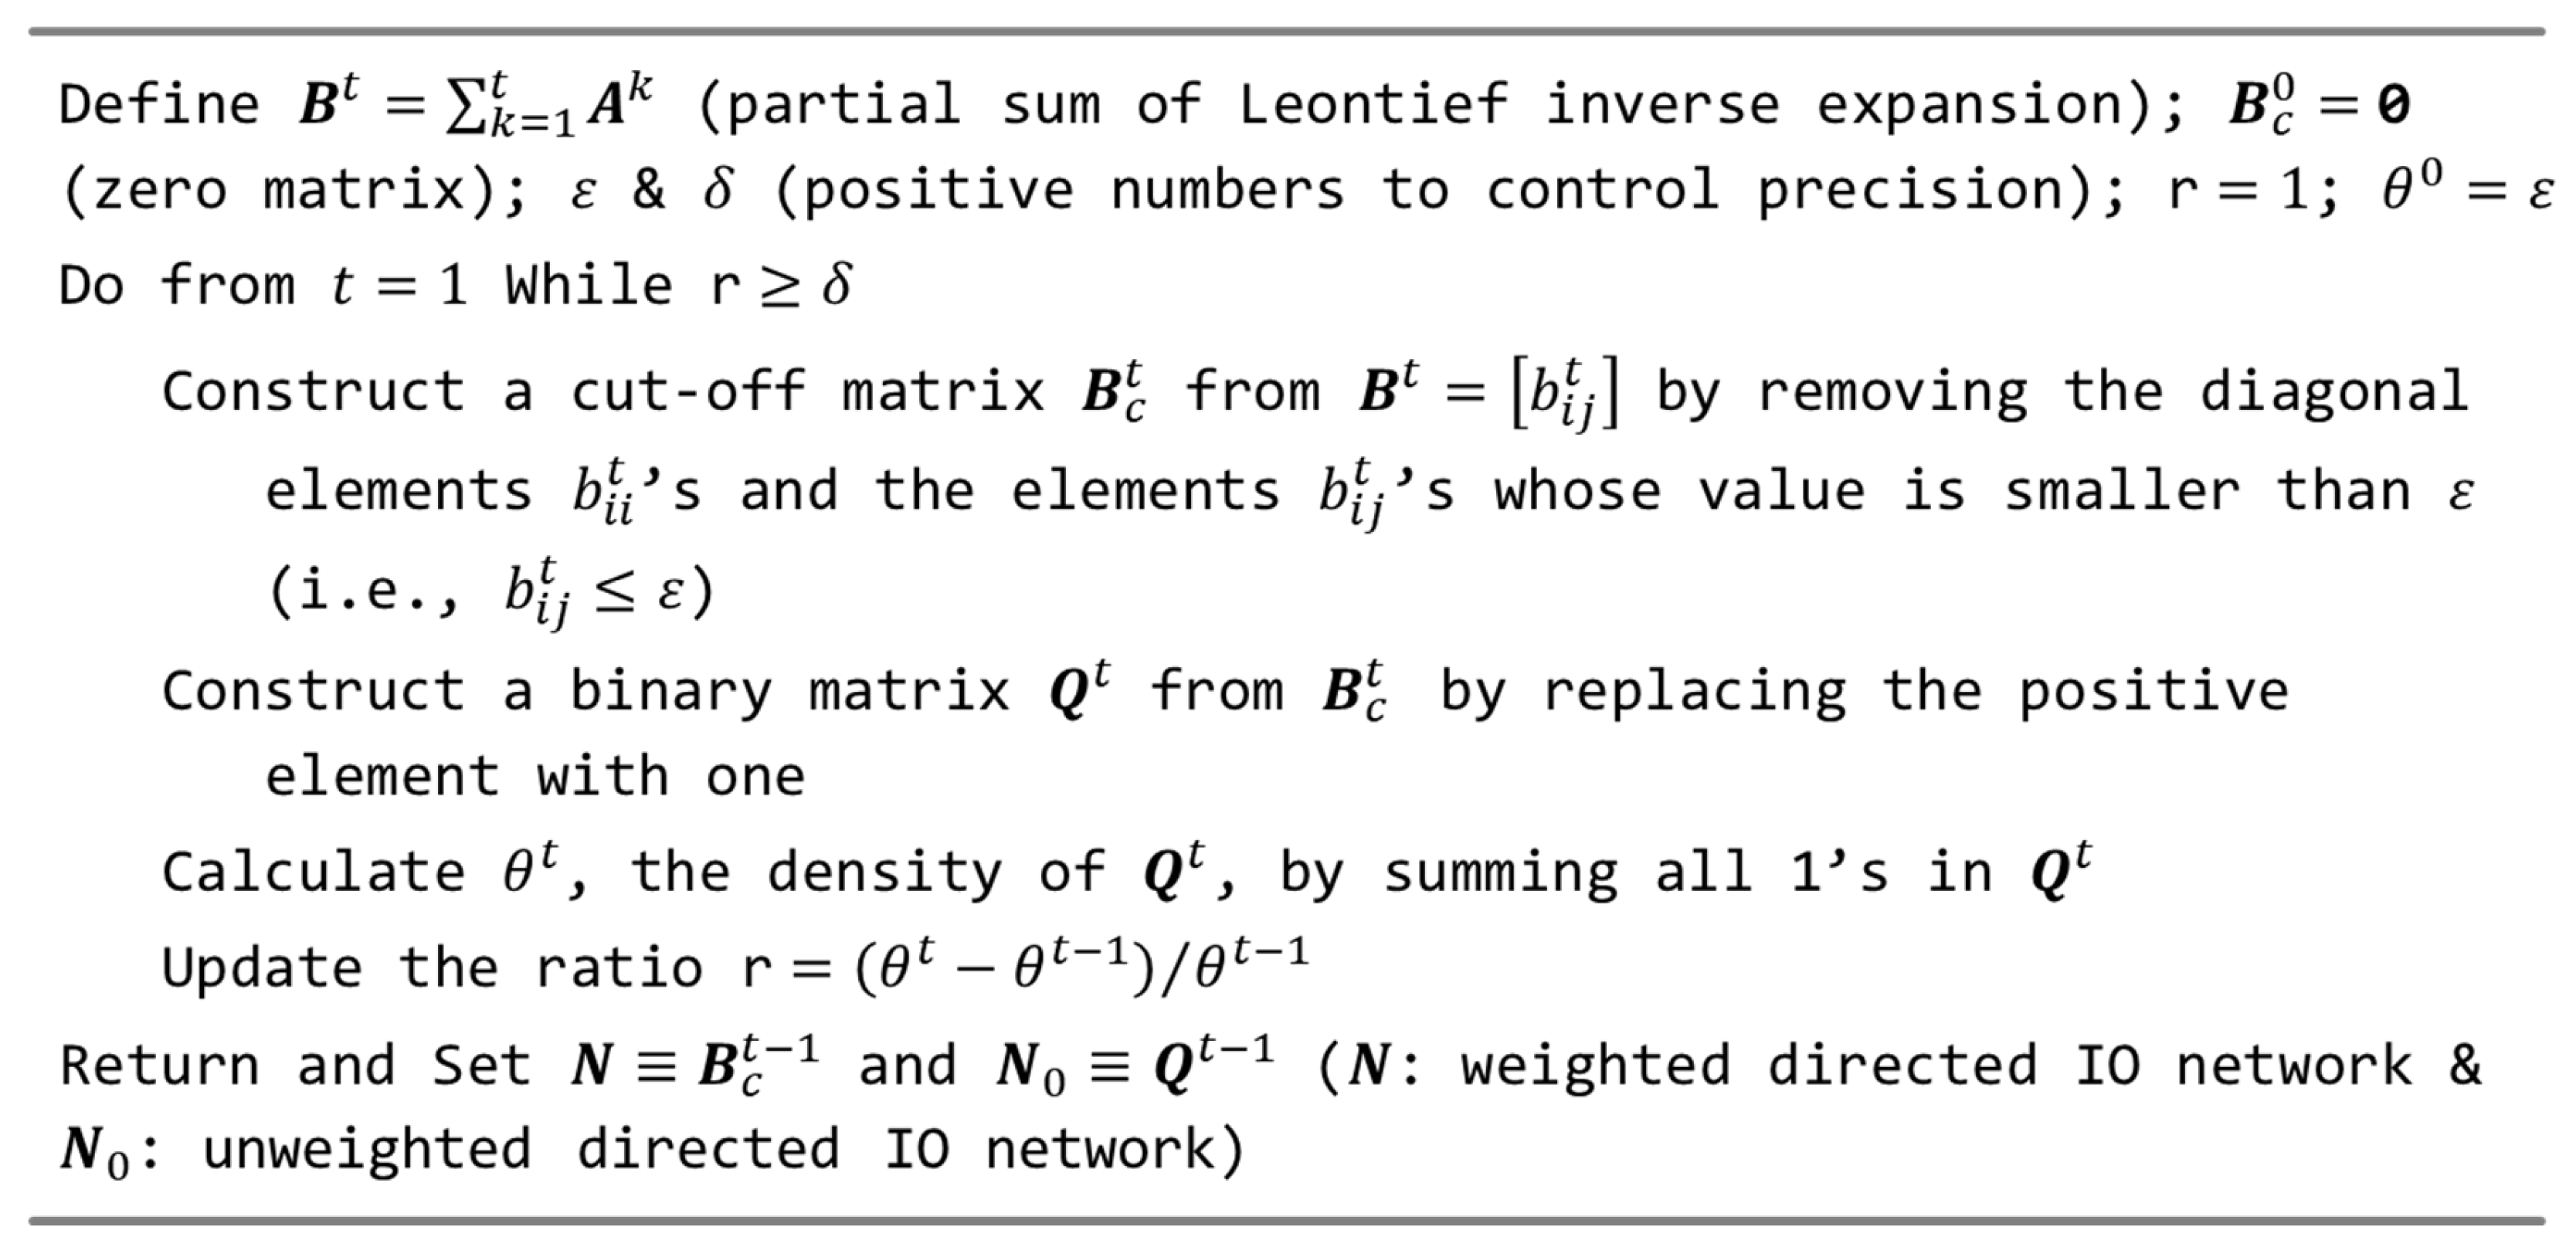
Appendix B summarizes the parameter values (i.e., α’s) calculated from the sub-sector compositions for the corresponding low- and mid-level categories. The detailed procedures are exhibited in the pseudocode below (
Figure 3).
In this process, there is a limitation that activities and transactions directly related to LD may not be fully or accurately extracted. For example, in the low-level classification, “Loading and unloading services (code 562)” captures activities occurring in omnichannel and e-commerce distribution centers, as well as (un)loading operations at ports and airports in the first mile segment, which overestimate α%. It is ideally desirable to distinguish and account for these two activities separately, but unfortunately, no further detailed level of classification is provided in the current IO data frame. In fact, we have no choice but to acknowledge such possible errors and be cautious when interpreting the analysis results while maintaining the overall consistency of the IO model and data. Nevertheless, since the primary goal of this study is to track the changes and roles of the LD sector in the course of the periods before, during early, and during ongoing digital transformation from 1990 to 2023, one can expect to adequately achieve the primary goal of investigating the LD and OD sectors if the overall procedure and criteria are maintained consistent.
To complete the reconfiguration of the original codes G and H in
Table 1 to LD and OD, the transaction volumes for other sectors must also be adjusted to conform to the new classification. This work was conducted by adjusting the figures in the rows and columns corresponding to codes G and H in the generic IO table. That is, the transactions registered in the row and column that generically corresponded to code G are now added by α% from code H, increasing by that amount (with the new codes for the row and volume renamed to LD). The transactions in the row and column that initially corresponded to code H should be reduced by α% (with the new code renamed to OD). This numerical adjustment is achieved through matrix operations below with the generic interindustry transaction matrix
in
Section 2 (refer to [
26] for a more detailed explanation). Refs. [
20,
23] also employed a similar approach.
4. Analysis
4.1. Economic Value Created in the Distribution–Logistics Sector
The LD sector is the business area experiencing the most substantial impact of digital transformation and the new normal. In this section, utilizing IO data and models, we examine how digital transformation and the new normal have changed the DL industries, including the LD sector. We also examine how they have affected other industries and the Korean economy. Setting the index set
F in Equations (5)–(7) as the LD or OD sector in the reconstructed IO data, the economic value created by the sector (either LD or OD) is calculated with the following formula. For example, assuming that the LD sector has been indexed in
F in Equation (8), the total value created by the LD sector is decomposed as follows [
20,
23]:
where
1 and
are defined as follows:
1: the column vector whose components are all 1’s (for the summation of elements related to the Fth item);
: the unit column vector whose components are all 0’s except the Fth position;
: the row vector comprising the diagonal elements of matrix .
Equation (6) represents the total added value attributable to the focal sector (indexed F), such as the LP or OD sector in our study. This is a re-expression of Equation (4) to extract and decompose the added value of the focal section F. The first and second terms in Equation (8) represent value creation by forward and backward linkages, respectively. In other words, while the first term is the total GDP that the focal sector directly creates through the entire sectors—the sum of Equations (5) and (6)—the second term is the aggregation of the non-focal sectors’ contributions that enable value creation in the focal sector—the sum of Equations (5) and (7). Since the first two terms contain the value created only within the focal sector, which Equation (5) or the third term in Equation (8) represents (that is, the focal sector’s contribution to its own final demand), they must be deducted once to prevent double counting when measuring GDPF.
Based on the reconstructed IO data and tables, we designate the LD or OD sector as
F and calculate the value created by the respective sector and the value created through the connections to other industries. The results are shown in
Table 2. First, the added value generated by the LD sector within the overall DL industries increased nearly tenfold, from 28.22 trillion KRW in 1990 to 253.69 trillion KRW in 2023. In contrast, the OD sector increased only fivefold, from 10.33 trillion KRW to 52.88 trillion KRW. Expressed as a CAGR, their growth rates were 6.88% and 5.07%, respectively, indicating that LD’s growth rate was much higher than that of overall GDP and other industries during the same period (OD’s growth rate was similar to that of overall GDP). In particular, these estimated figures are evaluated at current (nominal) prices of the corresponding periods. Considering intensifying price competition across the entire DL industries, including the last mile segment, the scale and trend imply that the LD sector has had a positive impact on other related business areas. The actual scale of the LD sector has also grown significantly, leading to substantial expansions in both intermediate demand (B2B transactions) and final demand (B2C transactions). The respective shares of the LD and OD sectors in total GDP are also showing a steady upward trend. For example, the LD sector accounted for 6-7% until 2010, and has recently approached 8-10%. The robust growth of the LD sector strongly suggests that the last mile segment has driven the evolution of the entire DL industries. It implies that the digital transformation of last mile retailing since 2010, including e-commerce and omnichannel, has been driving growth and change in the DL industries.
4.2. Relations with Other Sectors: Economic Interrelationships and Interpretations
4.2.1. Forward and Backward Linkages
Equation (8) (or Equations (5)–(7)) makes it possible to classify and compare the total added value created directly in the focal sector (LD or OD) and the added value created indirectly by other sectors through the forward and backward linkages of the focal sector. First, in the case of the LD sector, the value-added of KRW 23.269 trillion in 1990, KRW 56.884 trillion in 2000, KRW 155.695 trillion in 2010, and KRW 248.554 trillion in 2020 were created through forward linkages, representing a more than 10 times increase (evaluated and compared in nominal currency) over the three decades. The value added created through backward linkages also increased more than 10-fold, from KRW 17.284 trillion in 1990 to KRW 185.445 trillion in 2020. These growth and expansions can be interpreted as a of result of the strengthened role of the LD sector in both the forward and backward chains, driven by modernization (in the 1990s and early 2000s) and digitalization (after 2010) in last mile retailing. Although the backward linkage effect has generated considerable value, the impacts on other sectors through forward linkages were far more extensive in terms of actual scale and scope than those of backward linkages. The OD sector’s forward linkages generated an added value of KRW 7.268 trillion in 1990, KRW 17.606 trillion in 2000, KRW 45.519 trillion in 2010, and KRW 50.134 trillion in 2020, representing an increase of nearly 8-fold. The added value generated through the backward linkage effect also increased around 4-fold, from KRW 7.325 trillion in 1990 to KRW 28.840 trillion in 2020. The forward chain in the OD sector has expanded more than the backward chain. However, the growth and influence of both chain effects in the OD sector were much smaller in scale and scope than in the LD sector.
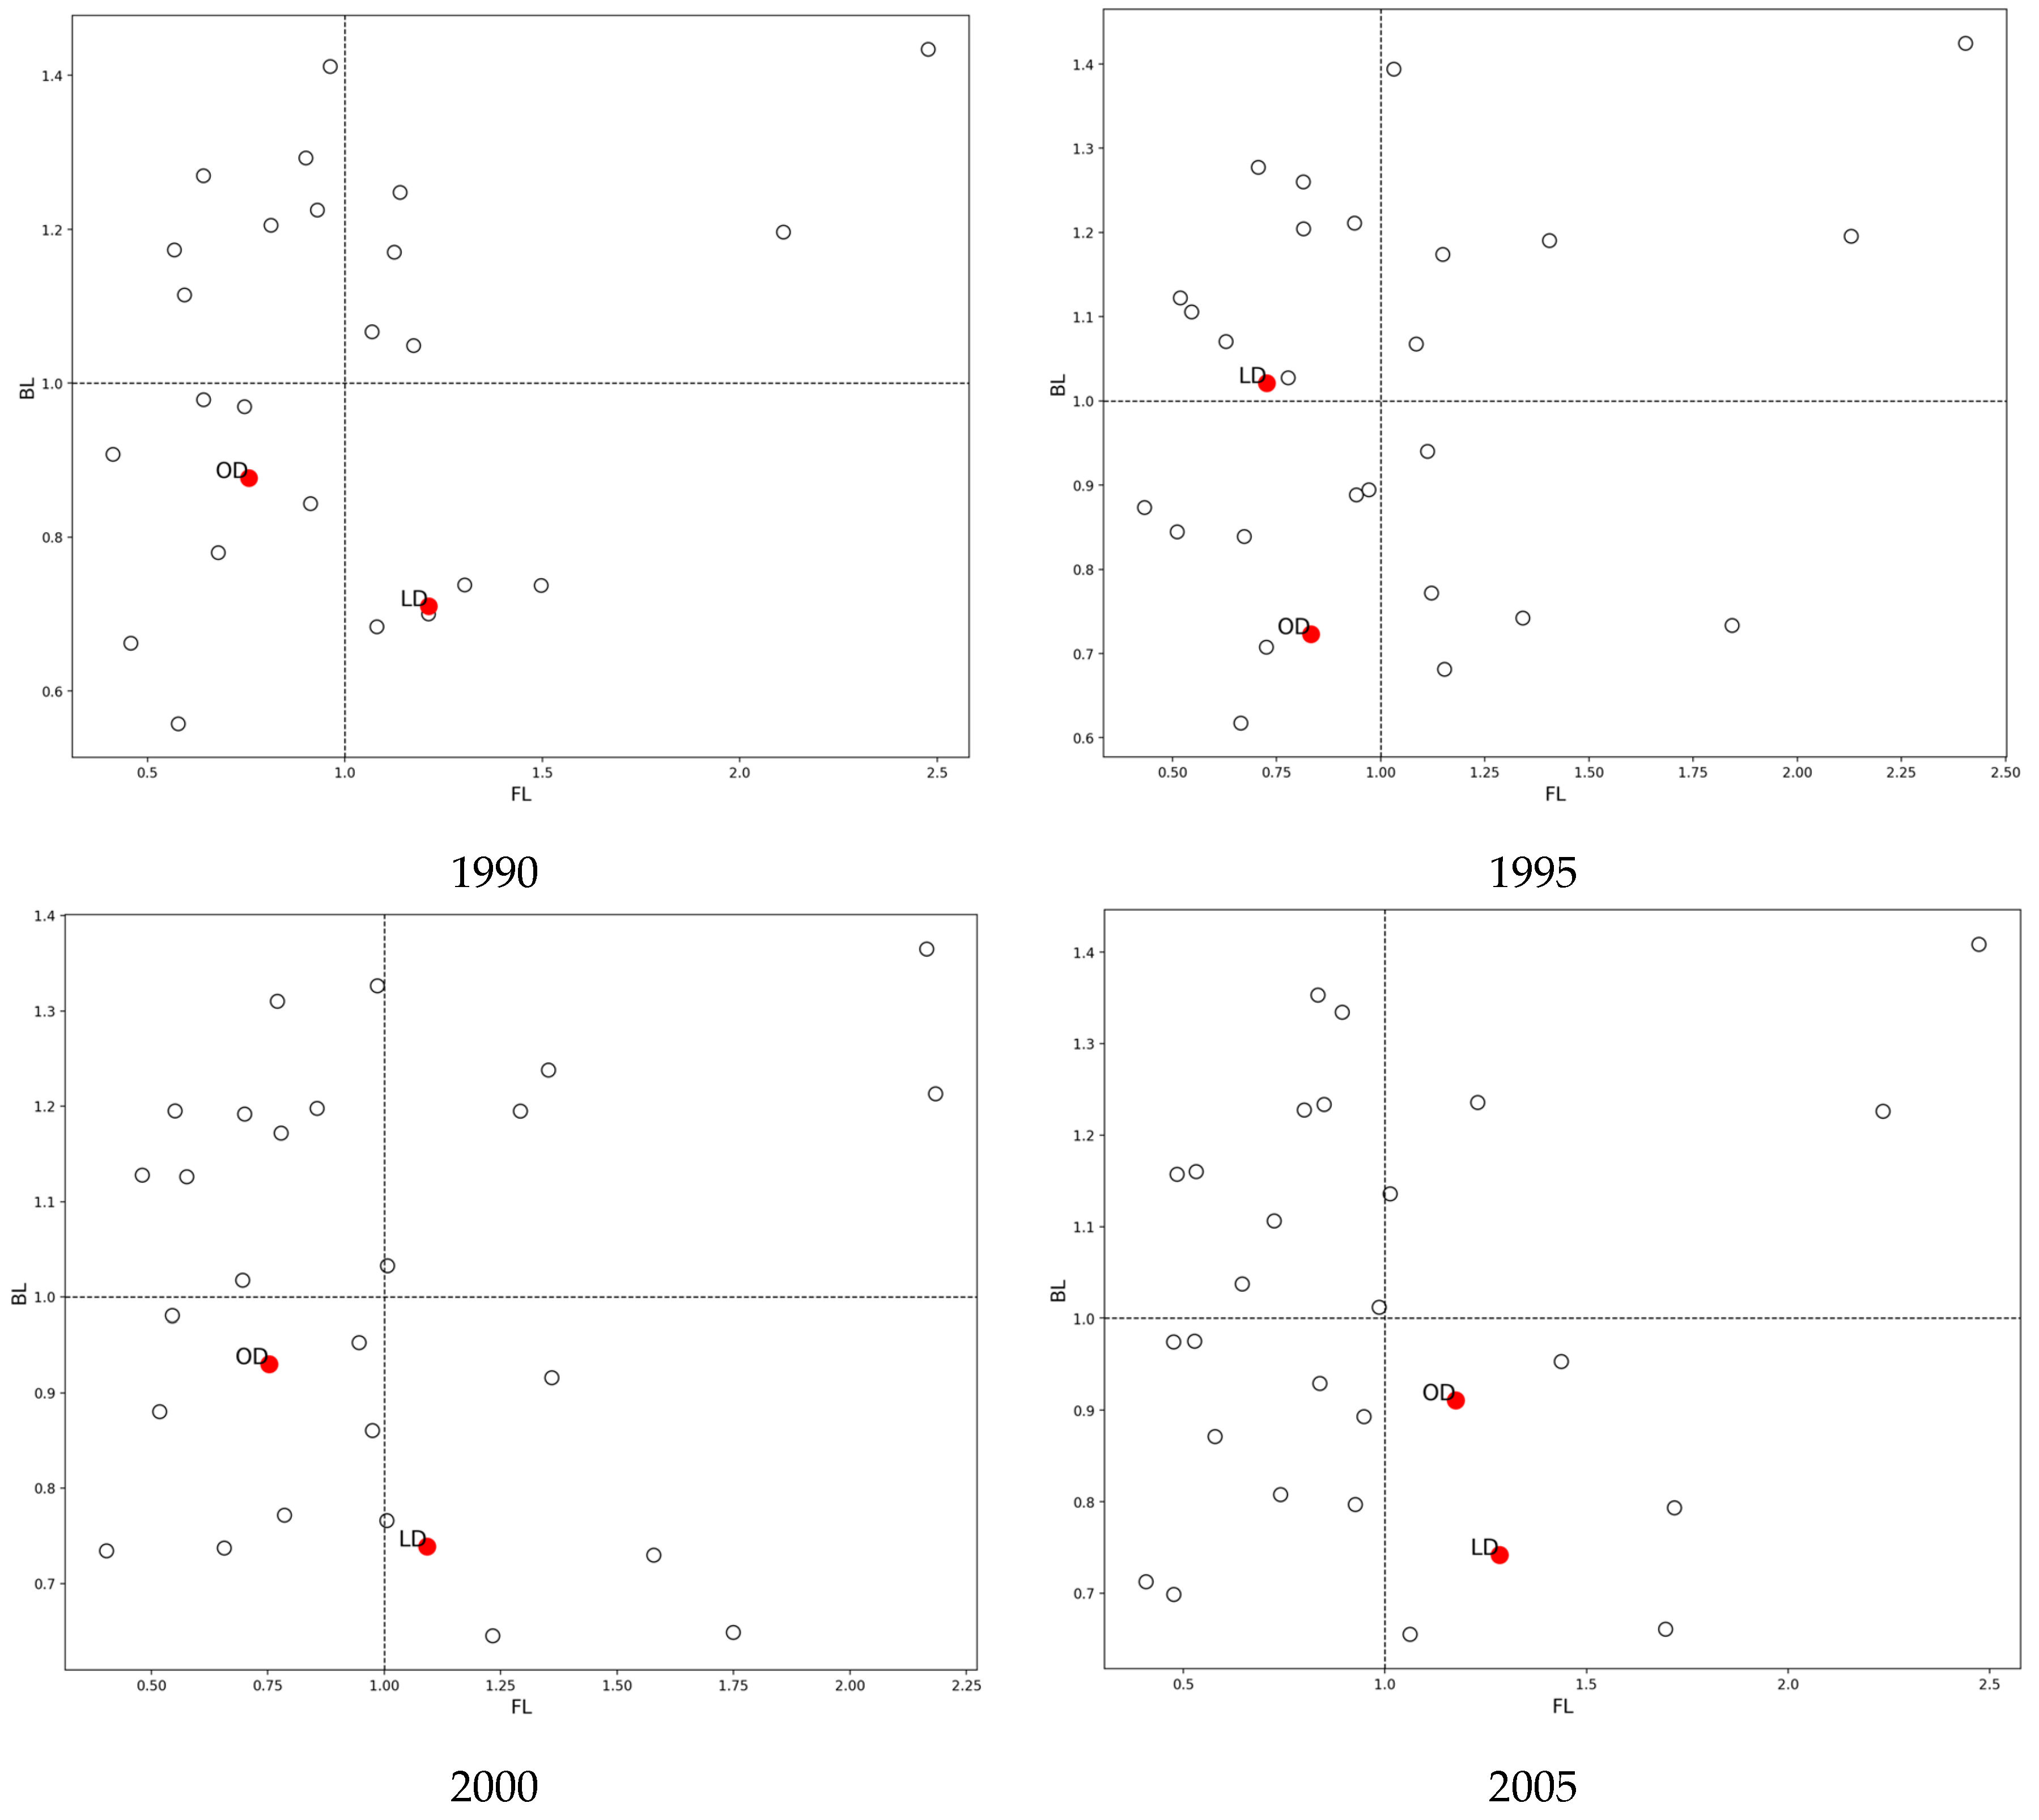
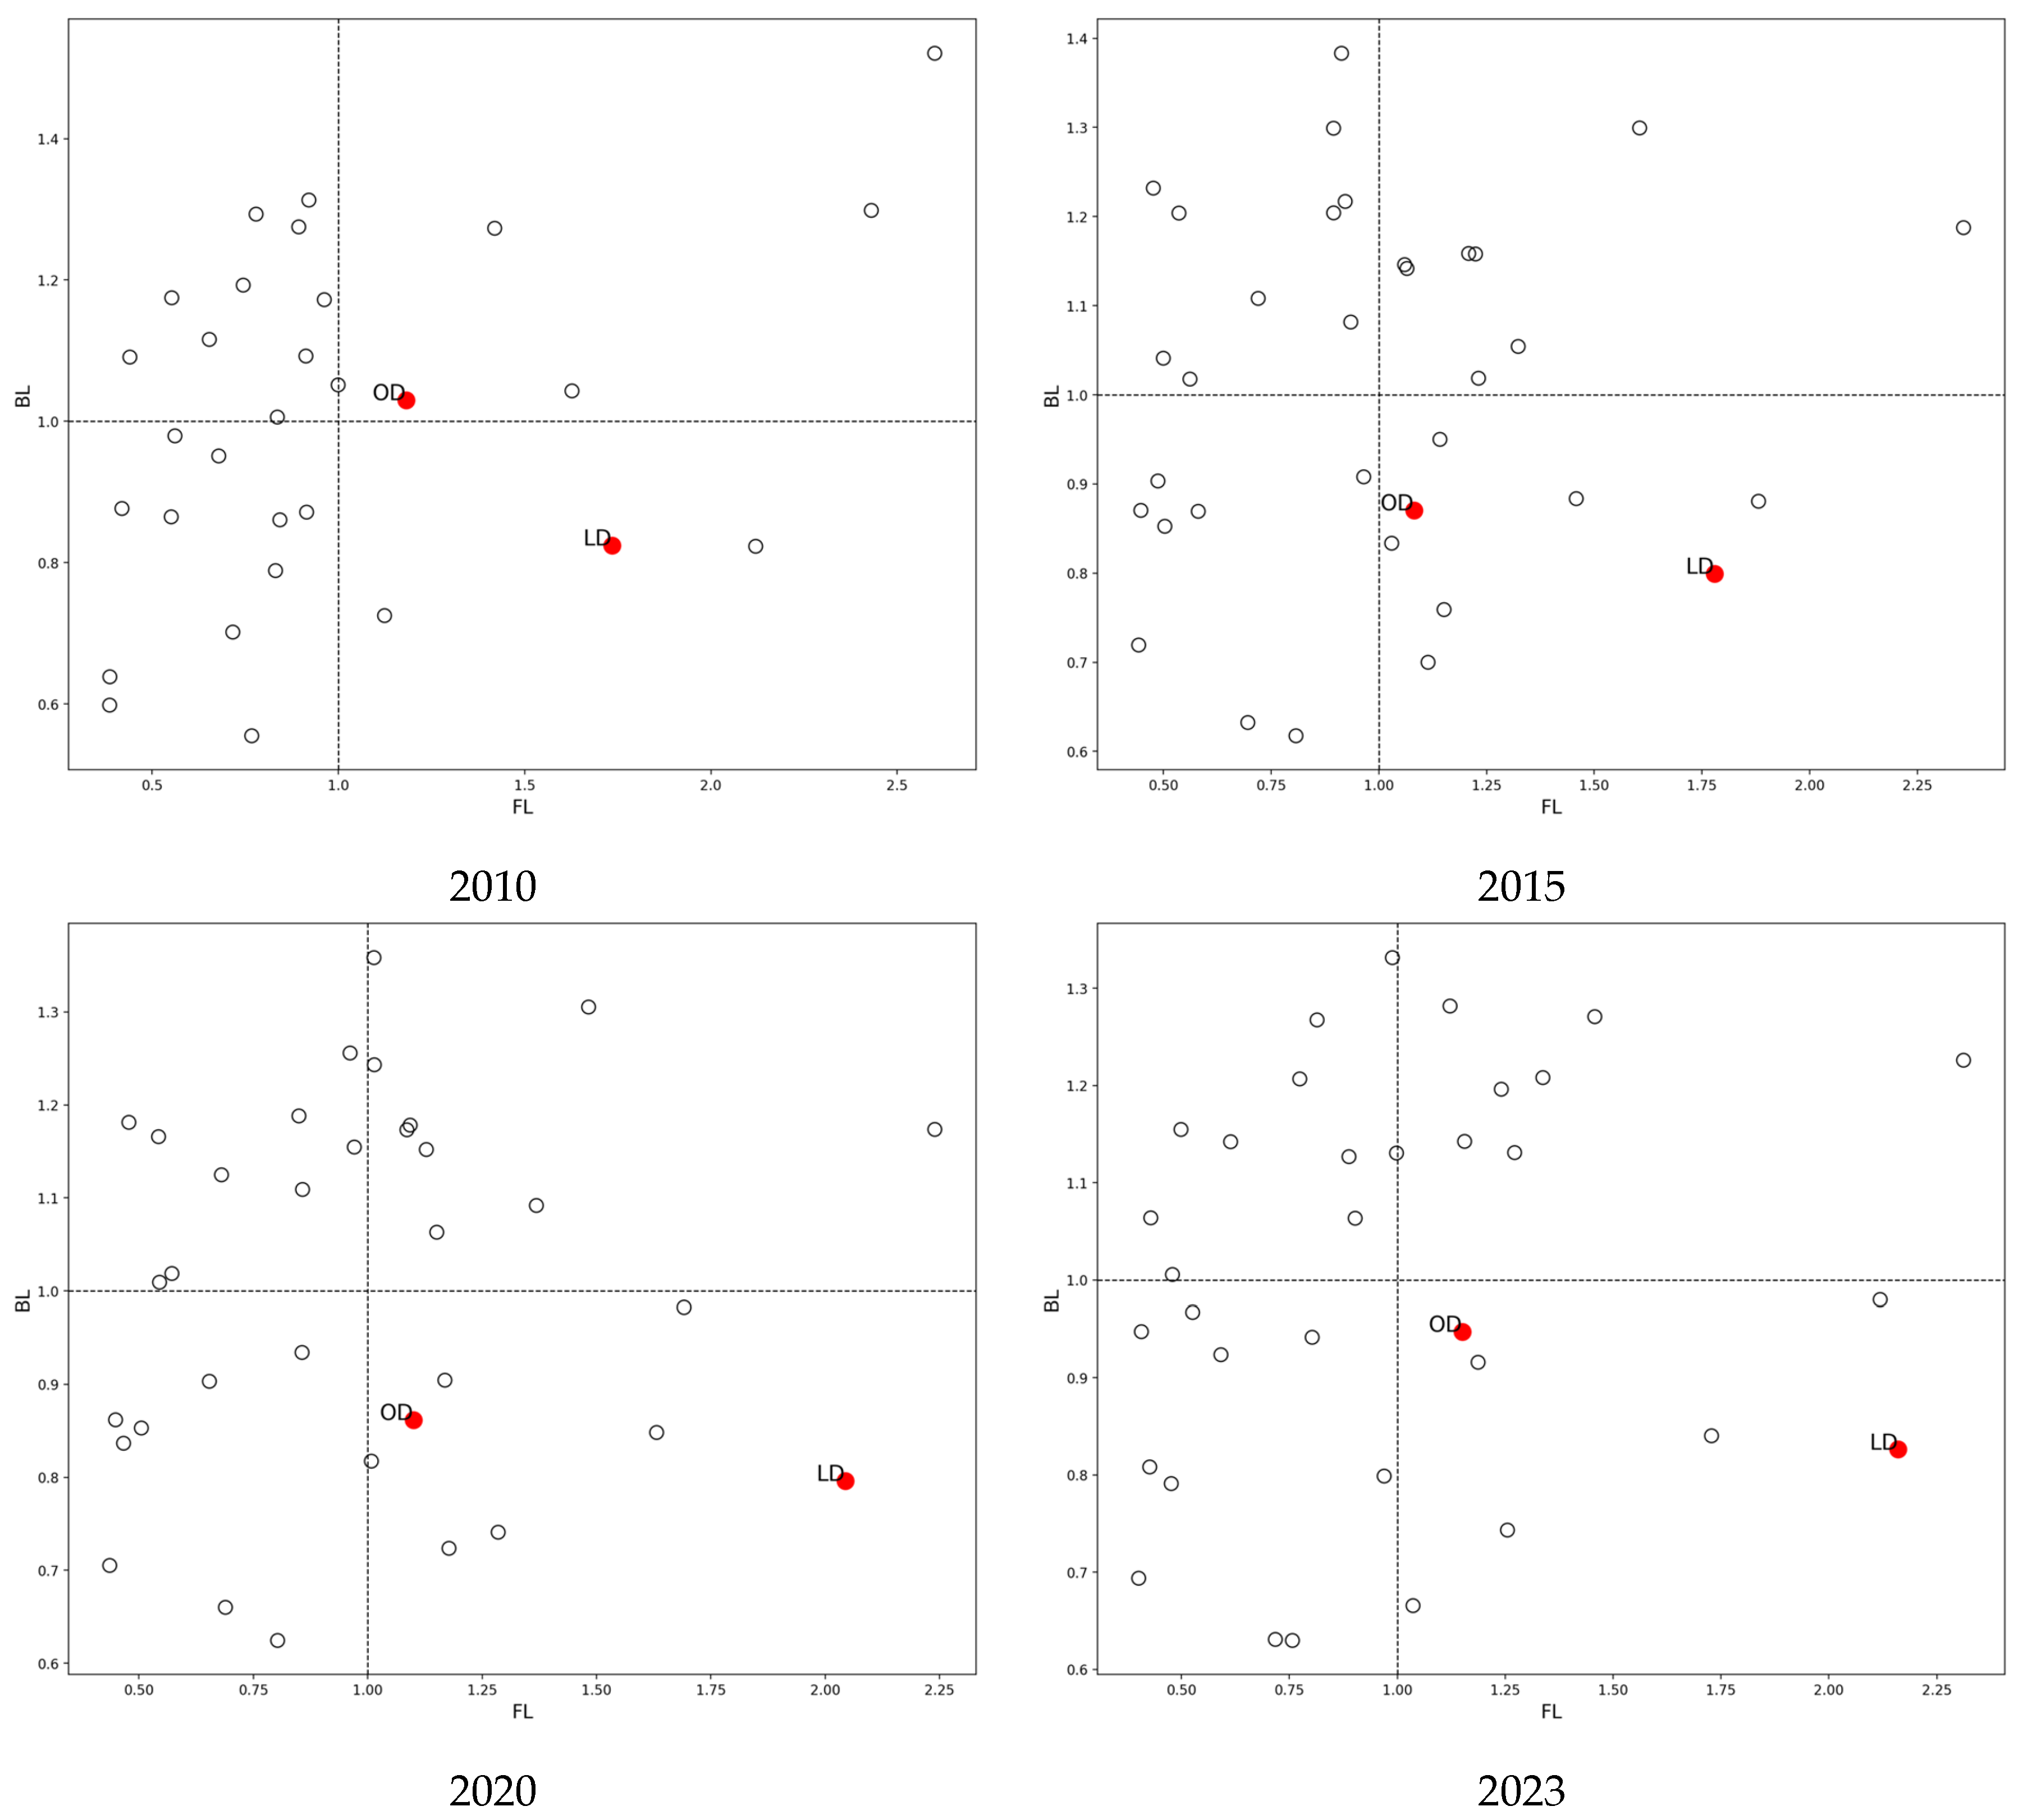
The figure below compares the forward and backward linkage effects of the LD and OD sectors with those of other industries. The horizontal and vertical axes represent normalized forward and backward chain effects, respectively. In particular, the average of the forward/backward effects of all sectors are set to 1, which corresponds to the green vertical/horizontal line in the figure. Accordingly, the two horizontal and vertical lines divide the forward–backward effect space into four regions. For example, the first quadrant in the northeast indicates that both forward and backward effects are above average. Sectors whose forward effect is lower than the average and backward effect is greater than the average are located in the second quadrant.
Except for in 1995, the LD sector has been located in the fourth quadrant in all periods, to the right of the FL’s average line, indicating that LD consistently exhibits very high forward linkage effects compared to other industries. In particular, after 2010 and 2015, the forward linkage effect of the LD sector increased rapidly, reaching the top rank. However, since the LD sector has been slightly below the BL’s average line in almost all periods (excluding 1995), its backward linkage effect has been relatively weaker than that of other industries. Unlike the LD sector, the OD sector has been located in the third quadrant until the 1990s, where both forward and backward linkage effects are below average, and has shown a pattern similar to that of LD after 2010. However, the forward linkage effect of the OD sector is significantly lower than that of the LD sector.
The figure above also shows that the roles of the LD and OD sectors in forward and backward linkage effects remained largely consistent throughout and after 2010 and 2015. However, while the LD sector exhibits significant influence on other industries primarily through forward linkage, the OD sector influences them through both forward and backward linkages. Nevertheless, the actual influence scale of the OD sector appears smaller than that of LD, since both forward and backward linkage effects have remained near the average lines. In contrast, the LD sector’s forward linkage effect has been significantly larger than that of other industries, which indicates a strong incentive for related industries to utilize the LD sector actively. More detailed explanations of this point can be found in
Section 4.3, which examines the structural characteristics of the ego network centered on the LD sector.
The fact that the LD sector’s role has been enhanced after 2010 and 2015 provides substantial evidence, as this period coincides with rapid progress in mobile innovation and digitalization. Given the extensive scale and scope of digitalization, the LD sector’s ripple effects have likely contributed to digital transformation across other industries. As introduced in
Section 3, the last mile segment has supported improvements in productivity and operational efficiency across related industries through the spread of e-commerce, lean processes, automated delivery, and widespread deployment of omnichannels. Business domains that need to be connected to the last mile segment in some way would seek to capitalize on such transitions and improvements, and this movement created a solid feedback loop that further reinforces the LD’s forward linkage effect.
Section 4.3 presents structural aspects supporting this point by analyzing the LD sector’s strategic positioning within the industrial network.
4.2.2. The Most Relevant Sectors
By comparing the forward and backward linkage effects of the LD sector over 30 years, we examine in more detail how this sector has influenced other industries.
Table 3 summarizes the top five industries that received the biggest forward and backward linkage effects from LD for each period. However, the OD sector is the remaining part of the DL industries, excluding LD, and is therefore considered highly relevant in both forward and backward linkages. Looking at
Table 3, excluding OD, the industries showing the most prominent forward linkage effect in 1990, 2000, 2010, and 2020 are as follows: the top ranks include, initially in 1990s and early 2000s, “Precision machines,” “Electronic & electrical equipment,” and “Furniture & other manufacturing,” while after 2010, the top ranks shifted to “Textile & leather,” “Food & beverage,” and “Other manufacturing.” Indeed, there exists a distinct difference in the composition of the top five list around the year 2010.
Looking at backward linkage effects, “Real estate & business services,” “Petroleum & coal products,” and “Communications & broadcasting” ranked at the top around the year 2000. These industries remained there after 2010, with “Professional, scientific & technical services” being added to the top of the list. In other words, there appears to be no significant difference in backward linkage effects before and after the digital transformation of the DL industries. This may indicate, as seen earlier, that the backward linkage effect of DL is not substantial.
The findings from
Table 2 and
Table 3 and
Figure 4 suggest that the influence of the LD sector has not merely expanded over time, but has been reorganized through mutual interactions in response to changes across the entire industrial system. First, notable changes can be found in the composition of industries substantially affected by forward linkages, whereas there has not been a comparable change in the composition led by backward linkages. Furthermore, through the forward linkages of the LD sector, its influence was concentrated before the 2000s on industries primarily related to durable goods, such as machinery and manufacturing, and it gradually expanded, particularly after 2010, to sectors directly connected to distribution and downstream needs. Throughout this transition, not only did the composition of top-ranked industries change, but the LD’s role also shifted from production support to mediating activities more closely linked to retail and services. This aligns with the phenomenon mentioned in
Section 3, in which
structural complexity increased as the last mile segment, having actively adopted digital transformation, moved away from pipelines that focus on efficiently delivering manufacturing outputs toward integrators more closely connected to service-intensive businesses. Indeed, the business areas that have benefited most from the LD’s forward linkage effect since 2015 are fashion, food and restaurants, and accommodation services, signifying the service-oriented expansion of the LD sector, facilitated by the spread of e-commerce and omnichannel.
In contrast, the list of industries that were relatively more affected by LD’s backward linkages remained almost unchanged. Considering the characteristics of input factors fed into the LD sector, business areas most closely associated with the last mile segment have maintained a relatively stable core group while showing a tendency to expand into additional domains, including real estate, business support, and knowledge-related businesses. This analysis and interpretation also suggest that, even though last mile operations have been changing, the primary factors driving their value creation process are not being substituted but are being gradually expanded and complemented.
These features in the forward and backward linkages of the LD sector are also supported by the outcome that, since 2015, professional and business services and their related areas have been significantly influenced by both linkage effects. As shown in
Section 3, the digitalization of the last mile has actually proceeded by adding technological and service capabilities to the legacy infrastructure rather than a replacement of the conventional input base. And it is also confirmed that value creation in the LD sector is increasingly linked to technological innovation and specialized business services. In particular, around 2015, the augmented diversity of forward linkage effects indicates that the LD sector has been boosted, and its influence has spread more widely. This is understood as the result of more industries being assisted and enabled by digital transformation driven by the growth and spread of e-commerce and omnichannel. This change also manifests as
structural changes in industrial relations surrounding the LD sector; the next section illuminates and re-examines the economic interactions and outcomes analyzed above through network analysis.
4.3. Relations with Other Sectors: Network Structure and Analysis
As explained in
Section 2, the Leontief inverse matrix
is a key element of IO analysis that preserves information regarding fundamental structural relations between industries. By extracting the core relations among industries from the Leontief expansion, another expression of
, one can more distinctly highlight the interconnected formation of all industries, that is, since
[
22]. Then, following the method employed in [
26] (see
Appendix A for the detailed description), one can construct a backbone network of the national industrial relations by ignoring the diagonal elements of each
matrix and retaining only the relationships between sectors that have a relatively significant influence on each other. This network is interpreted to represent the skeleton of inter-industry connectivity. Subsequently, the structural status and strategic positions of the LD and OD sectors are analyzed using various social network measures, which supplement and corroborate the results from the conventional IO analysis in
Section 4.2.
4.3.1. Centrality and Power
Table 4 presents the positioning powers of the LD and OD sectors evaluated by various centrality measures. First, from the perspective of degree centrality, the LD sector not only exhibits far greater indegree power than the OD sector but also shows a relatively substantial influence compared with other industries. However, neither sector is particularly powerful in terms of outdegree criteria. Similar patterns appear in inbound and outbound closeness centrality measures. That is, both the LD and OD sectors have a relatively advantageous position in terms of inbound closeness, as they are easily accessible from the other sectors. However, unlike the degree centrality, LD does not appear to be more powerful than OD for inbound closeness, and the measure varies across time periods.
In terms of betweenness centrality, LD demonstrates a stronger influence than OD, and its mediating role appears to be strengthening even more than in other sectors since 2010. This trend coincides with the periods during which digital transformation began and was widely adopted, alongside the burst of mobile innovation and e-commerce. A similar trend is observed in eigenvector centrality, which evaluates indirect influence. In this case as well, LD generally shows greater influence than OD, but the power measured in terms of inbound connections is greater than that of outbound connections. Indeed, LD’s outbound eigenvector centrality falls short of the average, while OD’s outbound influence even slightly exceeds the average. Although OD’s inbound eigenvector centrality is lower than LD’s, it has consistently ranked in the top tier since 2005. These findings imply that the indirect influence of the DL industries, encompassing both LD and OD, as an enabler of other industries, has been increasingly crucial.
Across various centrality measures, the LD sector’s inbound power indicators are consistently higher than its outbound indicators. This demonstrates the structural characteristic of the LD sector as positioned for access channels by other industries, supporting the results of
Section 4.2 (excellent forward linkage). Thus, the LD sector has established a strategic position as an inbound-centric gateway within the national economic system, suggesting the emergence of a virtuous cycle in which forward linkage effects are intensified. In contrast, weak outbound centrality powers imply that the LD sector’s backward linkages have been structurally locked in at their low level.
4.3.2. Structural Hole and Strategic Positioning
Structural hole analysis allows us to examine the strategic positions of the LD and OD sectors from a different perspective.
Table 5 compares the structural hole indices of each sector together with the industry average. Here, the lower the constraint index (the higher the rank) and the higher the efficiency index (the lower the rank), the more structural holes form around the sector, thereby strengthening its strategic locational advantage [
27,
28]. Since the LD sector exhibits lower constraint and higher efficiency than the OD sector, its structural hole characteristics are well demonstrated. Even compared to the overall industry average, the LD sector shows very low constraint and high efficiency, implying that it maintains marked independence while systematically connecting various industries. It also underpins the role as a gateway, demonstrated by centrality power measures in
Section 4.3.1. In particular, this strategic positioning has been further strengthened since 2015, when digital transformation began to spread widely, indicating the growing popularity of this sector in a digitized world.
4.3.3. Hub and Authority: Confirming Linkage Effects
The strategic position of the LD sector is also clearly revealed by hub and authority measures. Using these indicators, one can re-examine the structural and functional characteristics of the LD sector’s strategic position and role in terms of structural holes. First, the LD sector serves as an authority center to a greater extent than the OD sector. And this trend has gradually strengthened since 2005, making it the second-most-influential sector in terms of authority. In other words, highly notable industries to the national economy, such as those listed in
Table 3, are increasing their access to the LD sector (more than other sectors) to improve their performance (e.g., efficiency, lead time, market responsiveness, etc.) by leveraging the last mile segment. This aligns with the result shown in
Figure 4, where various industries utilized the LD sector as an enabler, thereby placing the LD sector’s forward linkage effect at the top among all industries. Indeed, its role as an authority aligns perfectly with the inbound centrality and structural holes explained in the previous sections. Moreover, the authority power was strengthened around the same period when the LD sector’s forward linkage effect increased after 2015, as depicted in
Figure 4. This coincidence implies that LD’s strategic position and structural status are further enhanced by digital transformation. In other words, a positive feedback mechanism, driven by digital transformations such as omnichannel and platformization in retailing, has reinforced the LD sector’s strategic position through the forward linkage effect. In
Table 6, the authority indicator for LD has increased substantially during 2010–2015, whereas the hub indicator has exhibited little room for improvement. This implies that digital transformation feeds back in ways that augment the LD’s forward linkages across industries, thereby solidifying the sector’s economic roles and eventually establishing a path-dependency in its evolution. In a similar vein, LD’s low hub index helps explain its low backward linkage effect from a structural perspective.
5. Discussion and Conclusions
To respond to and capitalize on the opportunities provided and promoted by digitalization, driven by the advent of ICT, the Distribution and Logistics businesses have actively carried out business model transitions and structural reforms. The transition was not deployed by the government but propelled by voluntary participation and innovations led by private business players and stakeholders. As a result, big and rapid changes in the DL industries have been underway, centering around the last mile segment: explosive growth and expansion of e-commerce and quick adoption of and conversion to omnichannel. This change is expected to last for a long time since the transition entails irreversible structural reform in the service chain (or service delivery process), particularly at the points where final contacts or service encounters with consumers occur. In addition, at the heart of digital transformation in this sector, there have also been influential trends, the so-called “big blur” led by giant tech platforms, whose influence effectively spills over to other industries.
Our IO analysis and results, as explained above, confirm this flow of change. For example, the LD sector, which has led the digital transformation in the DL industries, exhibits a more pronounced forward linkage effect than backward linkage. Furthermore, the power displayed in forward linkage effects and authority roles is far greater than in any other industry. The scope of business domains affected by this influence has also expanded, clearly demonstrating that the LD sector, as a structural hole, holds a strategic advantage over other industries. This influence, as reflected in various indicators, marked a turning point between 2010 and 2015 and intensified thereafter, peaking after 2020, coinciding with the widespread expansion of digitalization. In particular, the economic role and structural characteristics of the LD sector have actually been further strengthened throughout the pandemic. Although the pandemic was a general environmental shock affecting the entire economy, the LD sector has experienced relatively minor negative impacts. It has also shown a faster recovery and more resilience than other industries since 2022. As digitalization continues and extends more comprehensively, driven by AI beyond 2023, as covered by the data in this study, the role of the LD sector in supporting the digitalization of other sectors is expected to intensify.
The findings here have implications for policy directions aimed at promoting digital transformation across logistics, distribution, and retail. This study confirmed that the adoption of digital technologies and digital transformation in DL industries, including the LD sector, not only increases the productivity of logistics and retailing activities but also directly and indirectly contributes to the development of a wide range of business domains, from traditional manufacturing, such as chemical production, to service industries, including food and beverage services. Indeed, as observed in the rapid expansion of omnichannel and platform-based retail ecosystems, changes in business tactics and connections within the LD sector are also transforming the entire value chain, from production through distribution to consumption. To positively and effectively boost these changes, the indirect and ripple effects discovered in this study should be considered when developing industrial policies for e-commerce and omnichannel.
Throughout this study, we empirically quantified and analyzed the structural changes in Korea’s LD sector over the past 30 years. We found that in the era of digital transformation, the LD sector is not only strengthening its strategic position as a structural hole but also serving as an authority that enables the digital transformation of key industries. This demonstrates a process in which the LD sector moves beyond its role as a straightforward distribution medium to facilitate the co-evolution of various industrial ecosystems by reinforcing its forward linkages through digital transformation. The novel approach of this study, which bridges micro-level phenomena and industrial relations through meso- and macro-level lenses, provides a quantitative tool for estimating the direction and effects of digitalization policies in the LD sector.
However, some limitations are unavoidable due to the IO model’s characteristics and the data frame used in this study. First, it is challenging to rearrange and redefine the DL industries centered around the middle and last mile, following the IO data frame constructed based on SIC. For example, constraints in the operationalization of IO data pose a clear limitation to properly capturing the overall complexity of emerging digital transformation. This point has been widely recognized as an inherent limitation of the methodology, even in previous studies that took a similar approach. Due to imperfections inherent in the operationalization process, the numerical outcomes cannot be treated as perfect estimates. Instead, it is more reasonable and valuable to focus on their relative changes and trends over time. In addition, while the significant forward linkage effect observed in the LD sector is meaningful and certainly coincides with the period of widespread digitalization, establishing a causal relationship between LD growth and digitalization remains a task for future analysis. Nevertheless, these limitations do not diminish the contributions of this study in understanding the co-evolutionary dynamics of modern distribution systems. Finally, because this study analyzed only Korean data, it is hard to generalize the structural characteristics of the LD sector (e.g., strong forward linkage effects and authority power) to other circumstances and countries. To this end, several cross-country comparative studies must be conducted.
In future research, we will seek to deepen our understanding of this study’s results by conducting case studies to examine how the digitalization of the LD sector has affected not only service industries but also manufacturing industries (especially chemical products). The impacts on the manufacturing sector were not anticipated before this study. Case studies are expected to provide deeper insights into how path dependence or structural reinforcement is actually triggered and developed through a positive feedback mechanism, as described in general systems theory. Finally, since the results of this study are based on Korean cases and data, they may need to be generalized or applied to other countries or regions. Since the DL industries are strongly influenced by local conditions, such as geographic, cultural, and economic factors, it is meaningful to examine whether the results of this study (e.g., the LD sector’s strong forward linkage effect and its authority power and structural hole property) are similarly reproduced in other countries. In future research, comparative studies should be conducted on countries such as the United States, China, and Japan. If similar results are observed in these countries, it can be said that the LD sector facilitates other business domains through its digital transformation. Then, one can also say that the LD sector plays an essential role in the digital transformation of the national economy as a whole.