A One Health Approach to Water as an Ecological Enabler for Leptospirosis: A System Dynamics Model



Abstract
1. Introduction
2. Materials and Methods
2.1. Study Design and Modelling Approach
2.2. Model Formulation and Subsystems
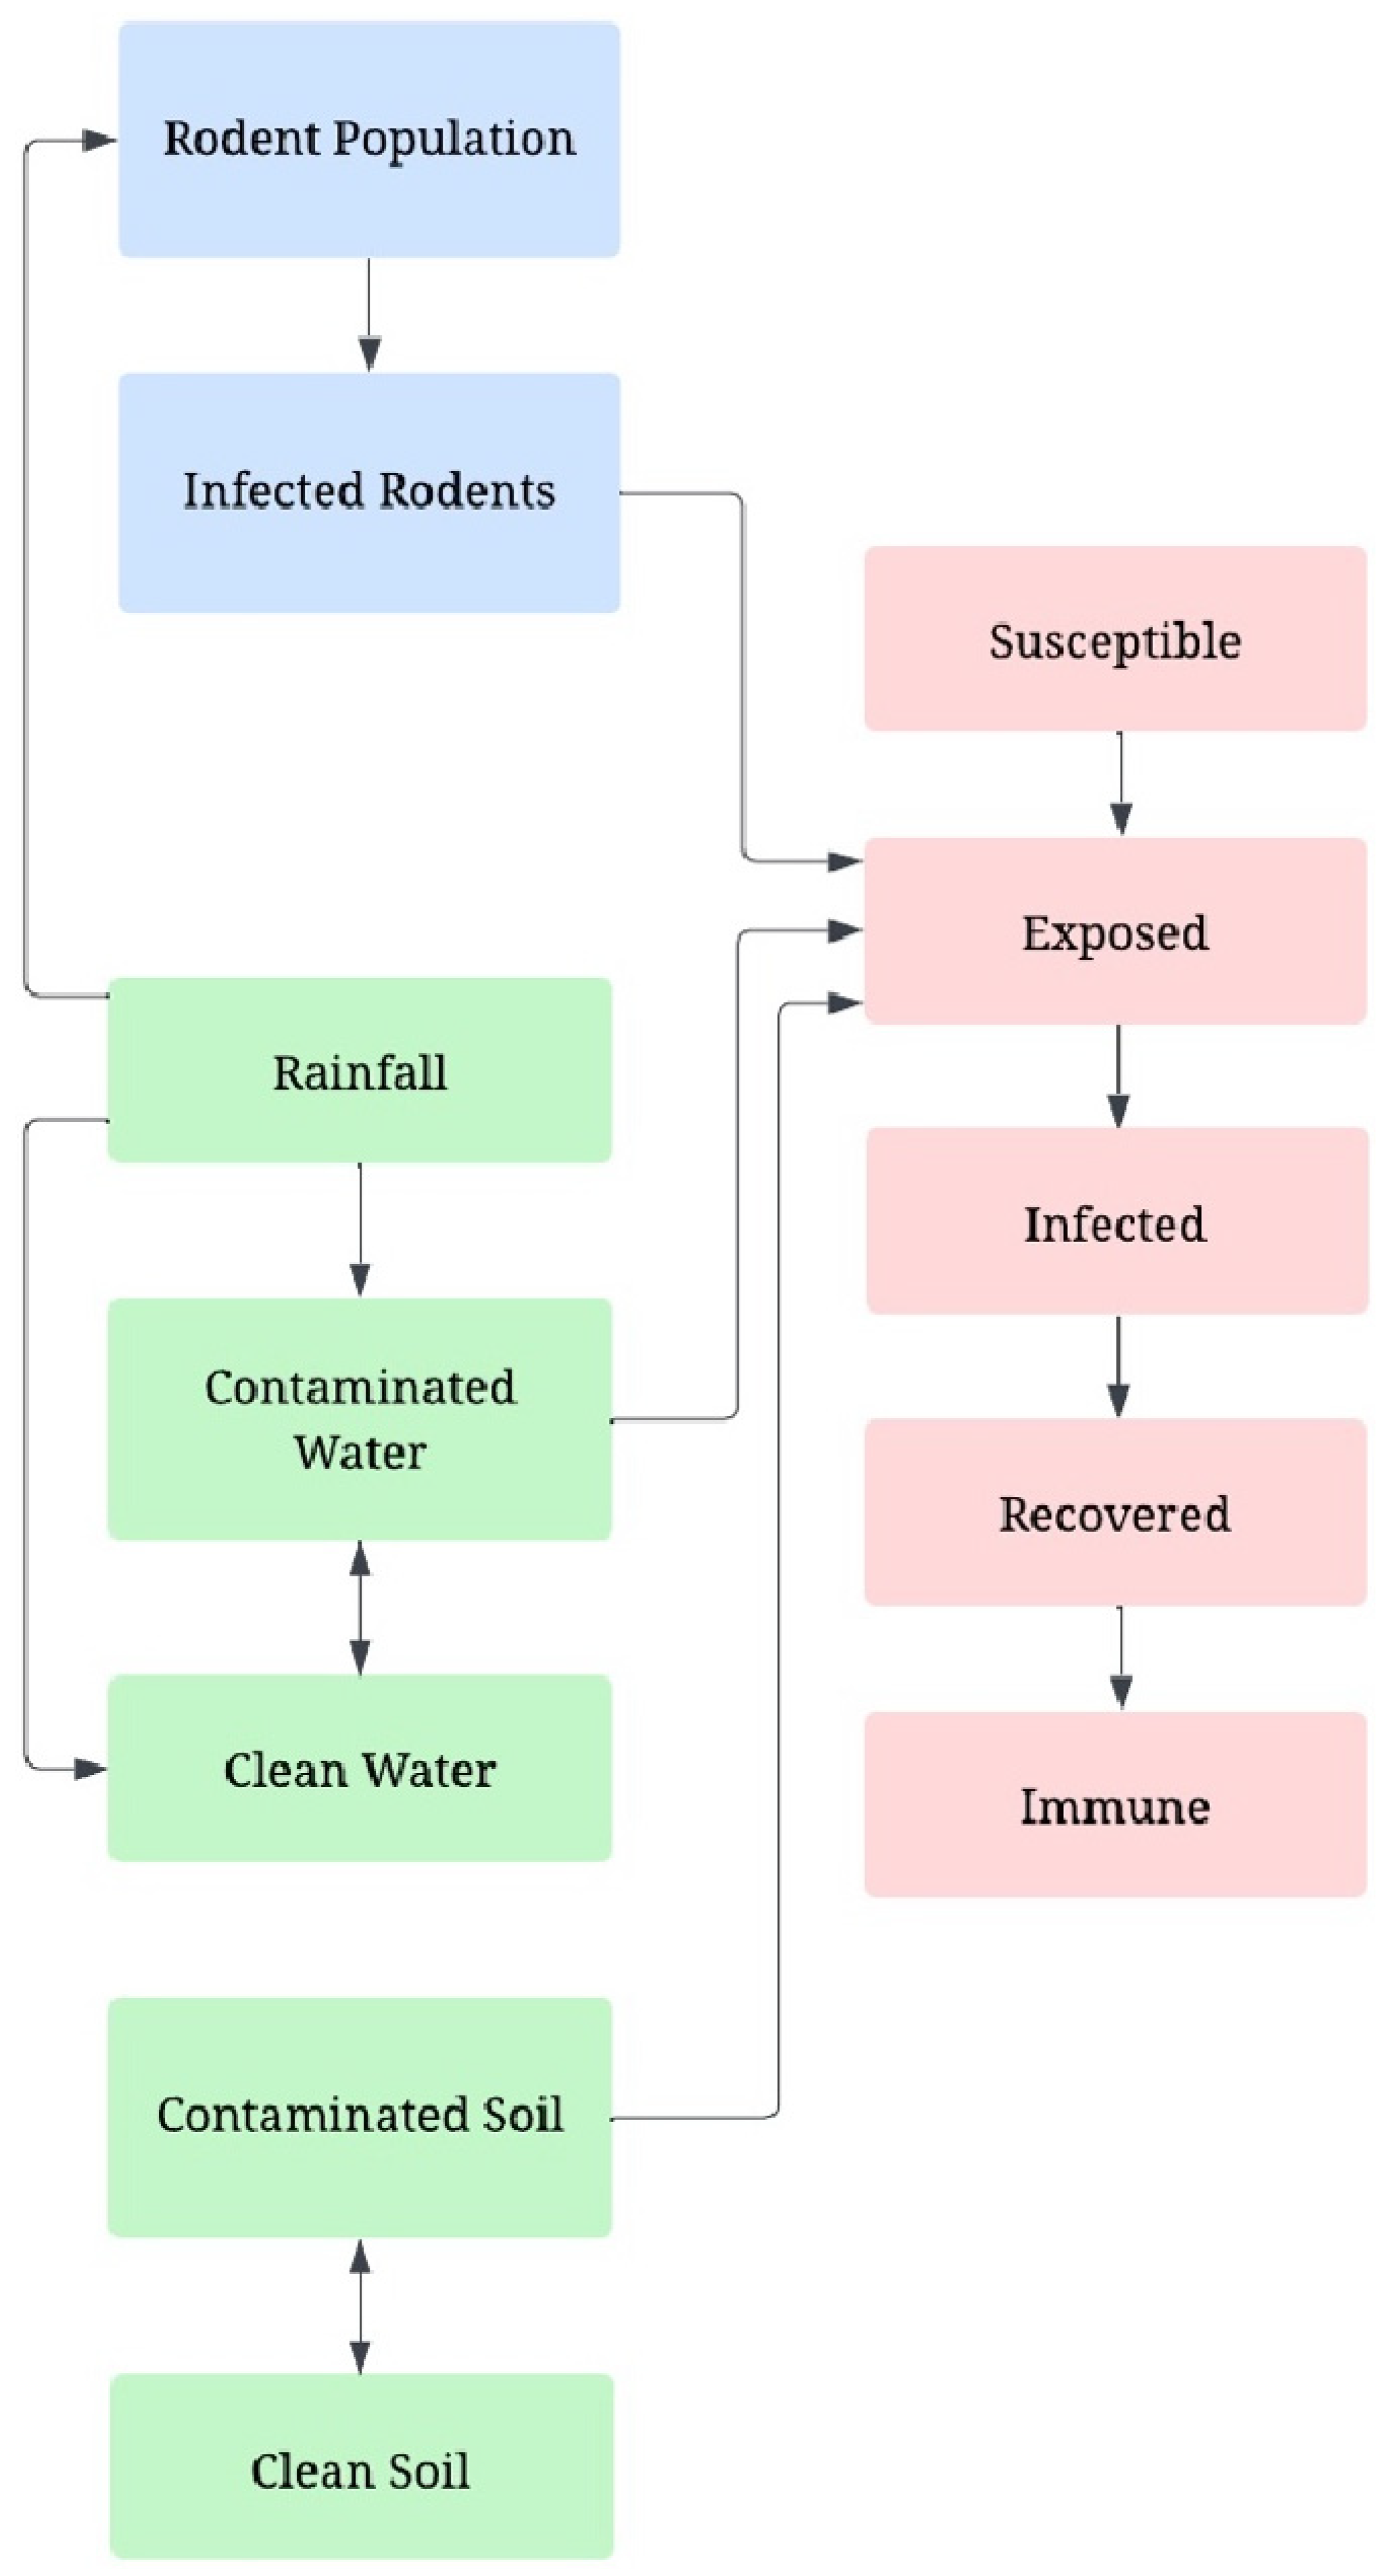
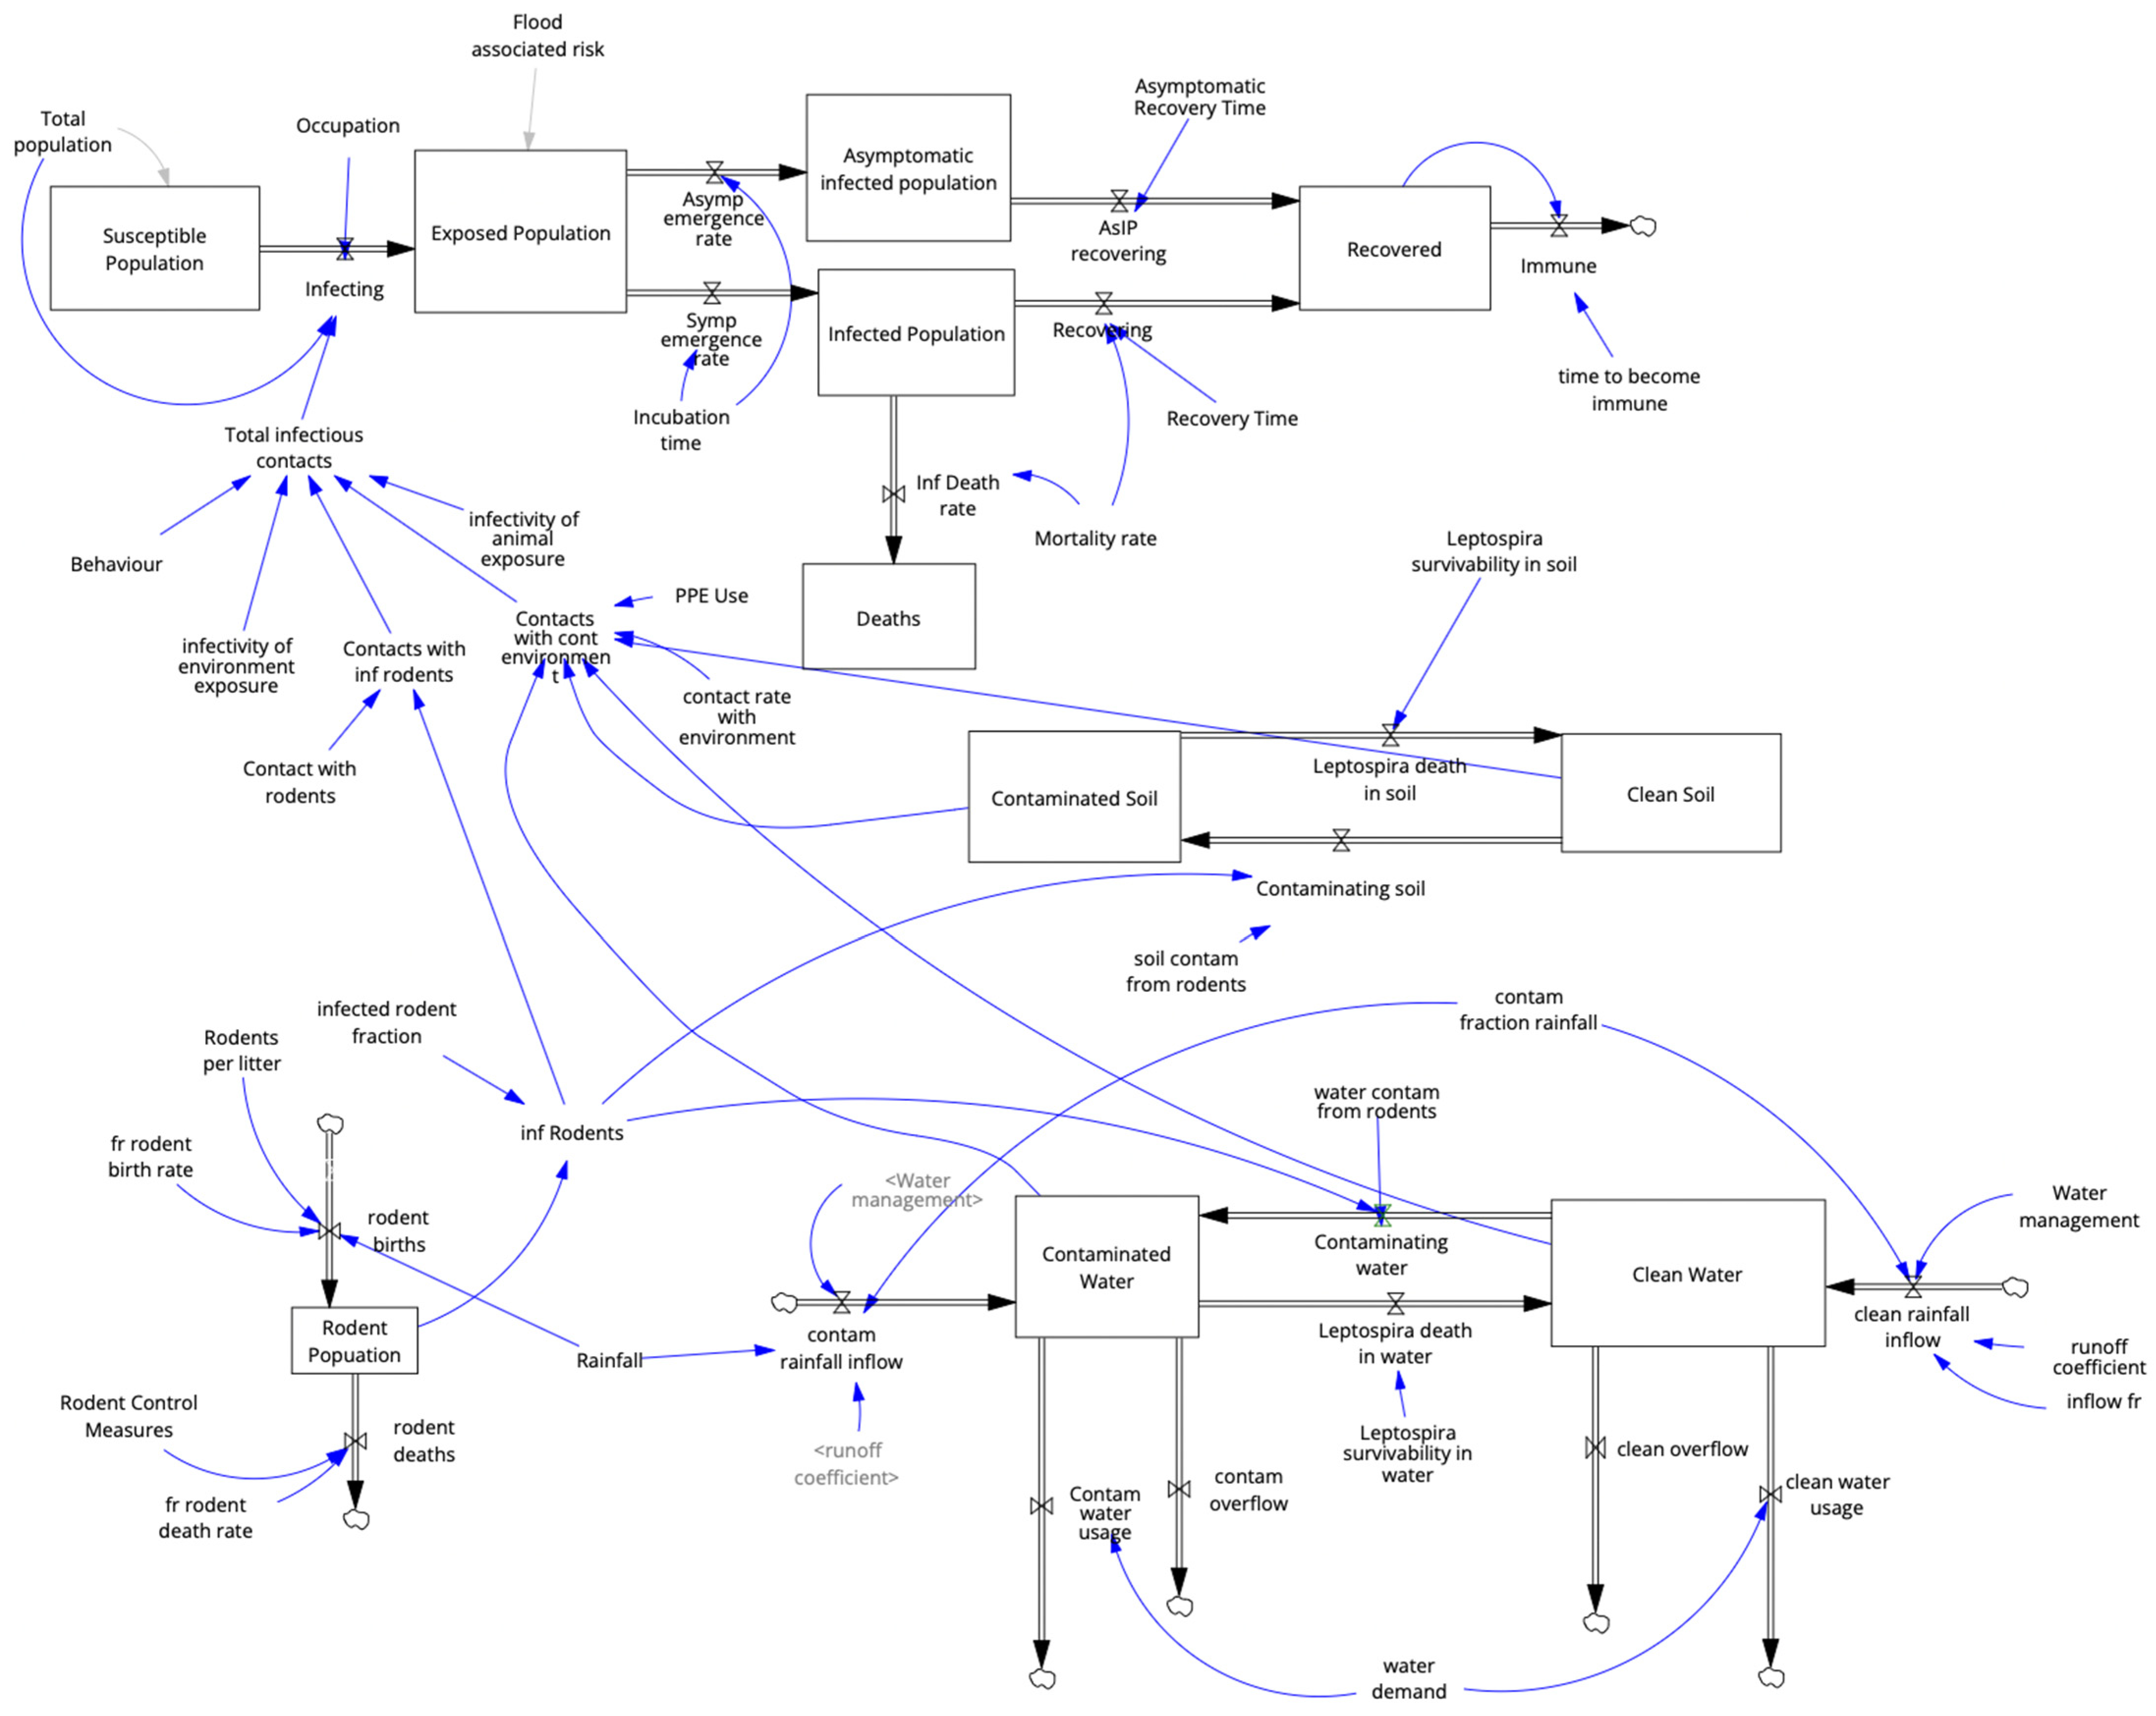
- Human Sub-model: This subsystem followed a susceptible–exposed–infected–recovered (SEIR) framework [23]. The susceptible population, based on Fiji’s average density of 50 people/km2 [24], entered the transmission cycle where a proportion of the population became “exposed” via exposure to contaminated environmental stocks and infected rodents. This “infecting” flow was determined by the total infectious contacts, which combine the calculated risk from both the environmental pathway (contaminated soil and water) and the animal pathway (direct contact with infected rodents). It was assumed that 90% of the exposed population progressed to asymptomatic infection, while 10% developed symptomatic disease with a 5% case fatality rate [25,26].
- Animal (Rodent) Sub-model: Rodents (Rattus spp.) were identified as the primary biological reservoir. The model assumed a constant infected rodent fraction (26.7%) to determine the density of carriers within the population [27]. Rodent population dynamics were modelled based on a population dynamics framework [20] and driven by rainfall deviations, where increased rainfall supported births through improved resource availability [28,29]. The rodent subsystem “bridged” to the environment via a defined contamination fraction, where the rate of transition from clean to contaminated water stocks was proportional to the number of infected rodents and their respective contamination constants.
- Environmental Sub-model: This tracked the accumulation and decay of Leptospira in contaminated soil and water stocks. Water accumulation was determined by monthly rainfall and a runoff coefficient of 0.2 [30,31]. The soil system was modelled over a 1000 km2 area, with an initial contamination level of 20%. Bacterial survival was set at 0.9 months for soil and 2 months for water [12]. In instances where empirical data were unavailable for specific environmental parameters, values were based on logical assumptions derived from system behaviour and expert opinion.
2.3. Model Validation and Calibration
2.4. Sensitivity Analysis and Extreme Scenario Testing
2.5. Intervention Scenario Design
- Rodent Control: A 15% increase in coordinated control effectiveness to reduce reservoir populations.
- Personal Protective Equipment (PPE) Use: A 15% increase in compliance among agricultural and outdoor workers.
- Water Management: A 10% increase in infrastructure effectiveness, such as improved drainage to reduce environmental contamination.
- One Health Intervention: An integrated strategy combining all three individual measures to assess potential synergistic or additive effects.
2.6. Declaration of Generative AI
3. Results
3.1. Model Subsystems
3.2. Model Validation and Behaviour Pattern Testing
3.3. Sensitivity Analysis
3.3.1. Monte Carlo Sensitivity Simulation
3.3.2. Tornado Sensitivity Analysis
3.4. Extreme Scenario Testing: Identifying Key Drivers
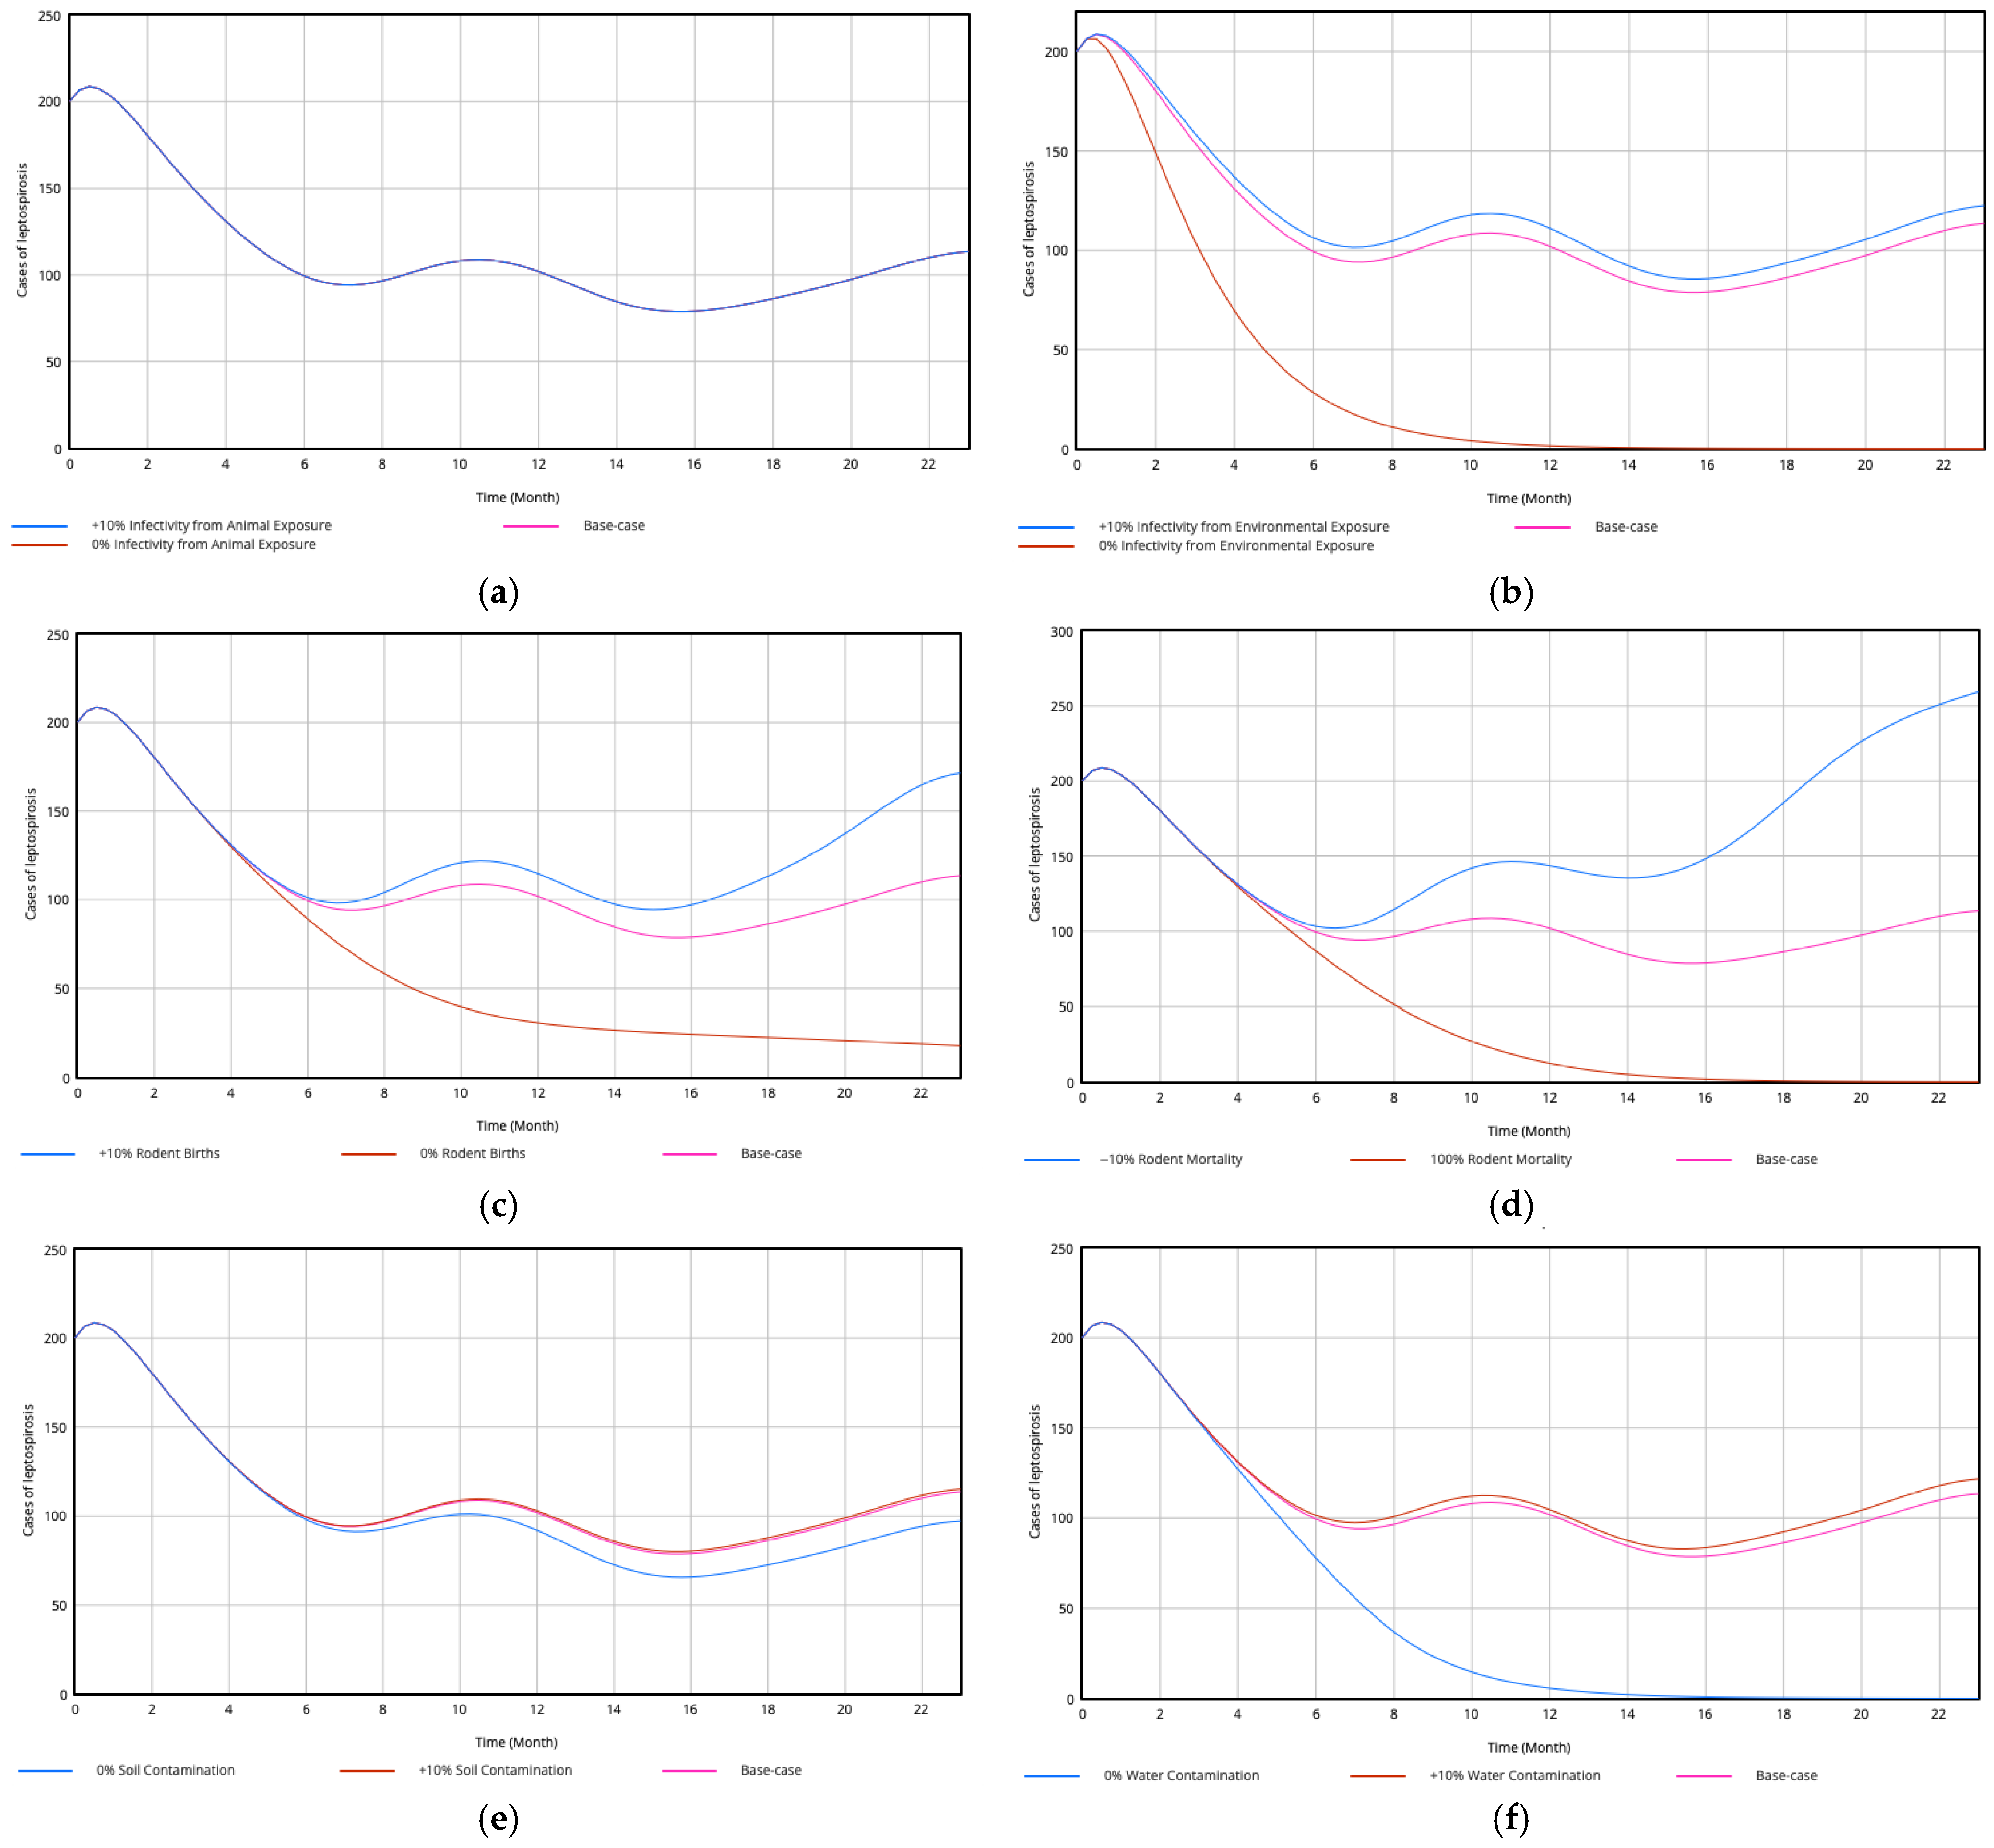
- Animal vs. Environmental Exposure: Removing infectivity from environmental exposure drove cases toward zero by month 12 (Figure 5b). However, eliminating or increasing infectivity from direct animal exposure produced no notable differences compared to the base case (Figure 5a), suggesting direct contact is not a primary driver of overall transmission dynamics in this system.
- Rodent Ecology: Eliminating rodent births resulted in a sharp exponential decline until month 12 (Figure 5c), while increasing rodent mortality led to case numbers nearing zero by month 16 (Figure 5d). Increasing rodent births caused cases to rise substantially above the base case after month 17 (Figure 5c).
- Water vs. Soil Contamination: Eliminating water contamination caused a strong exponential decline in cases, approaching zero by month 14 (Figure 5f). Conversely, removing soil contamination led to only a minor reduction in cases, which continued to follow the seasonal base case pattern (Figure 5e). This suggests soil is a less important driver of symptomatic disease compared to water.
3.5. Intervention Scenario Testing
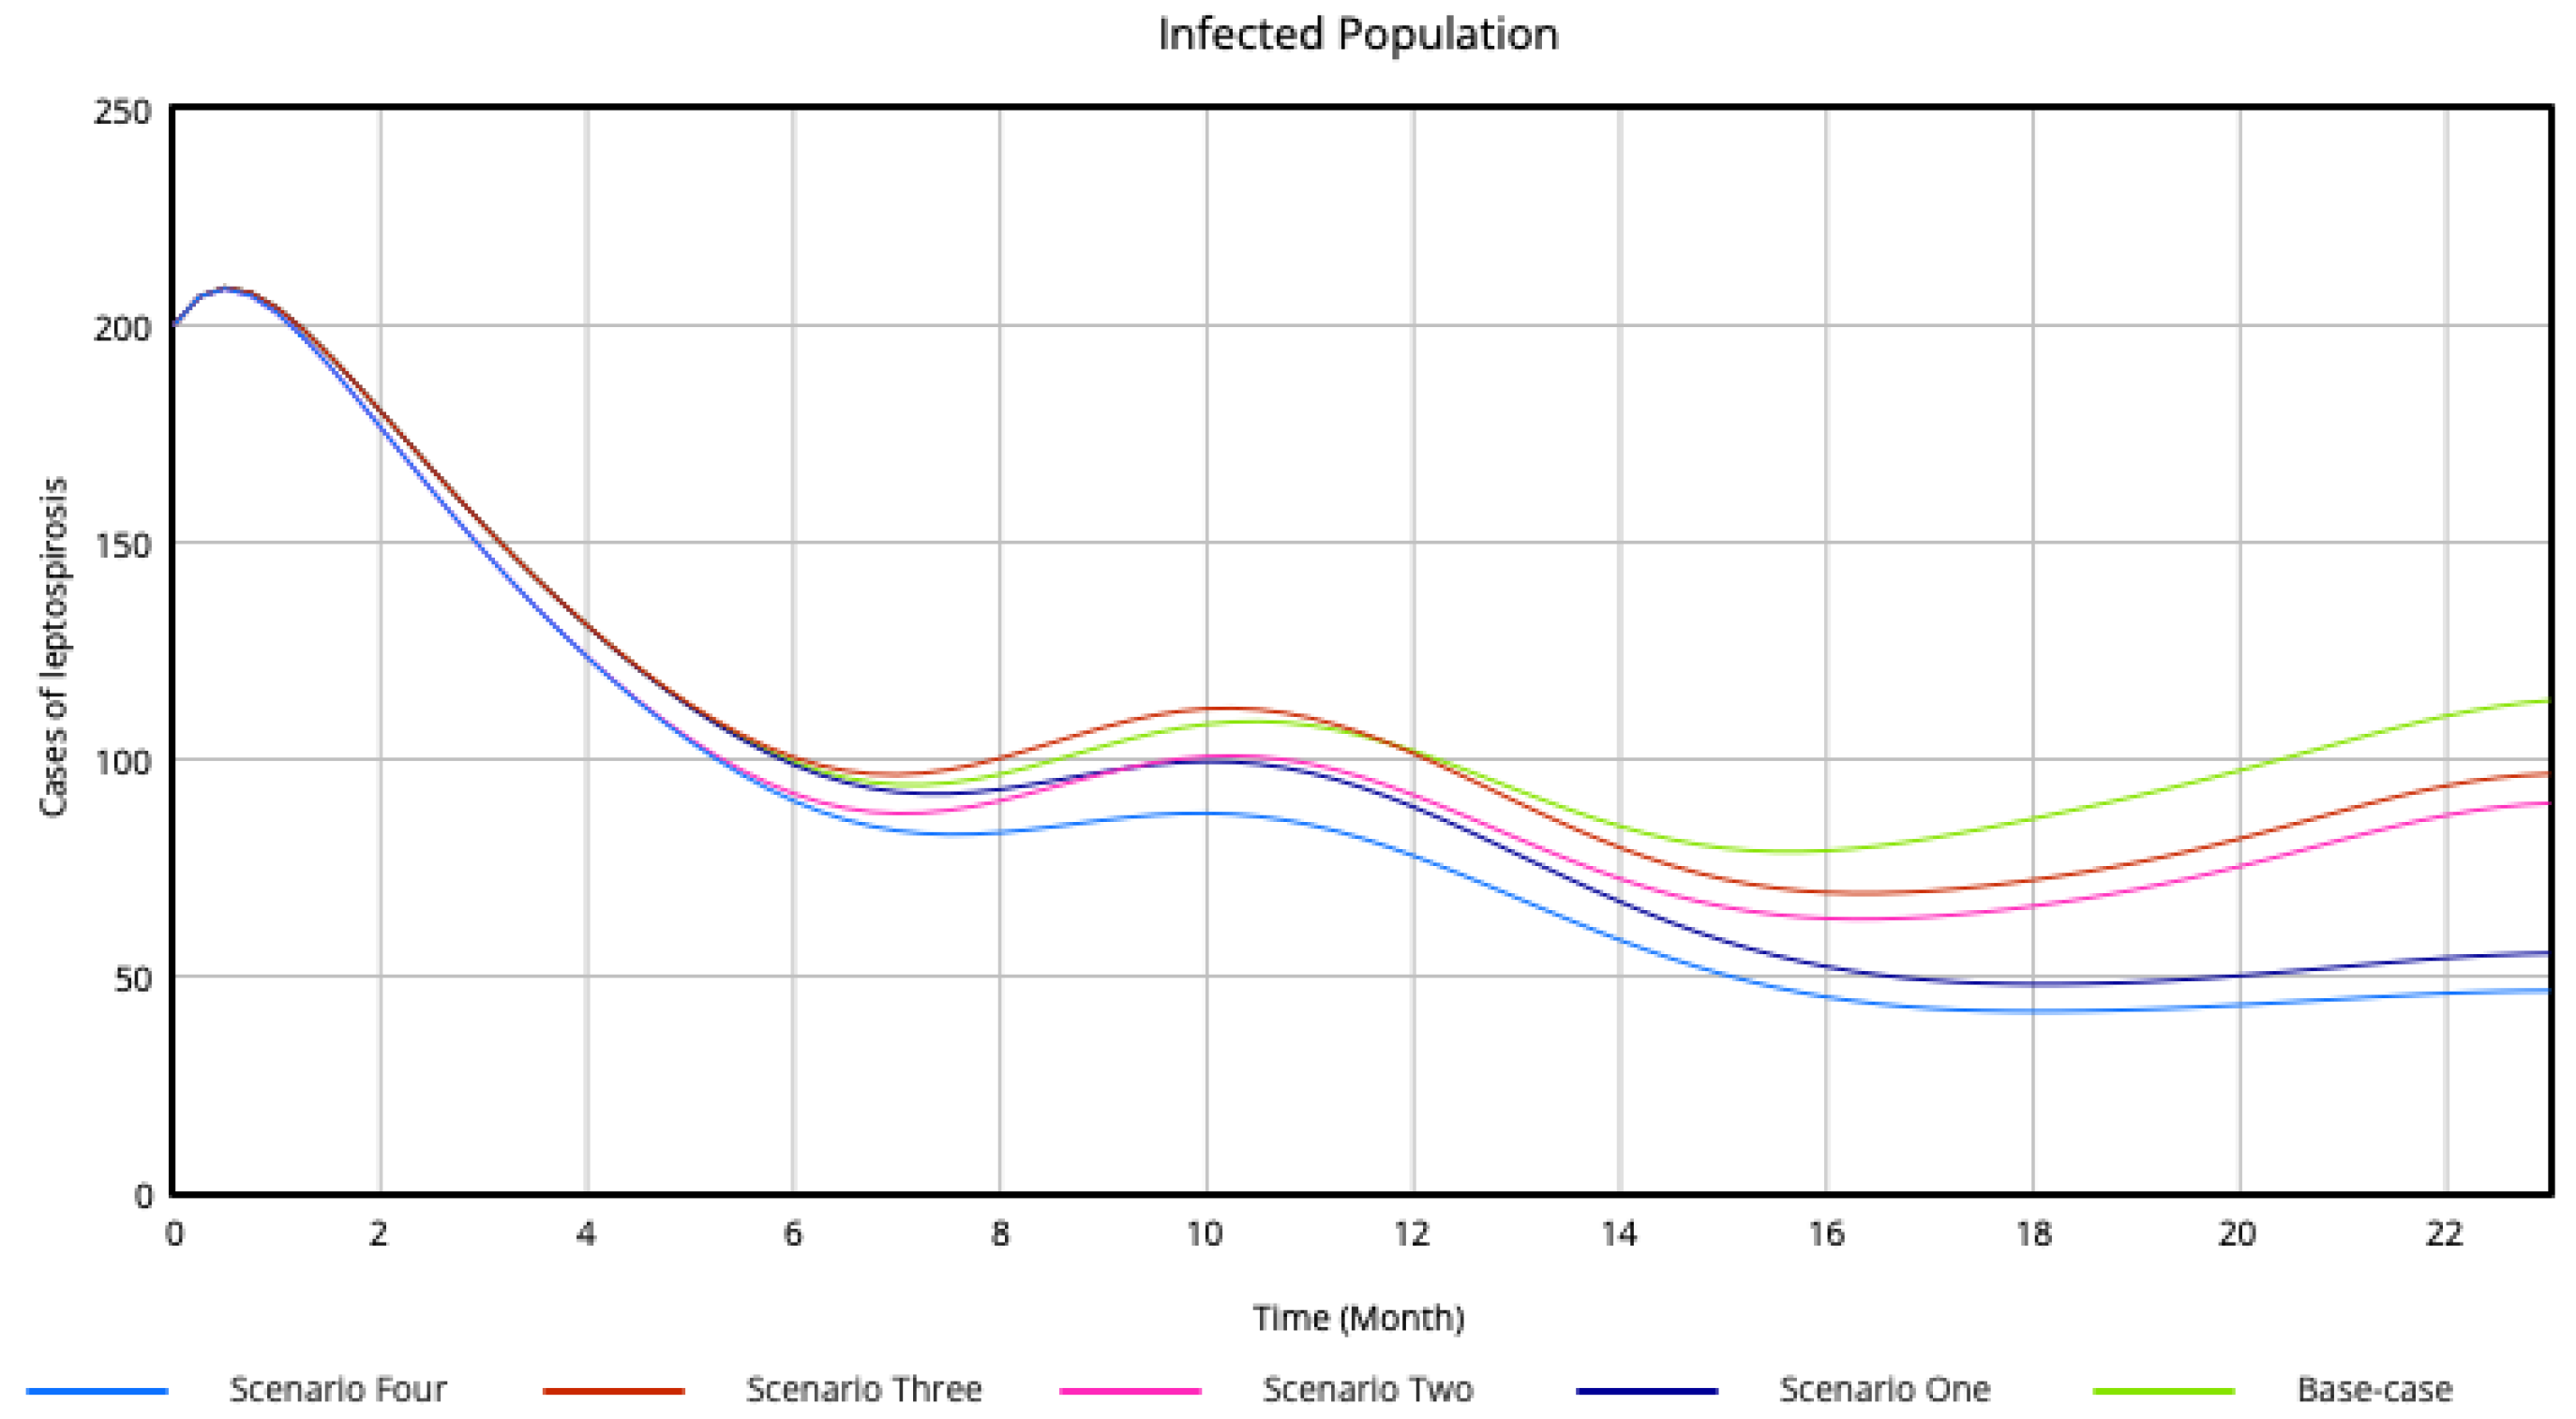
- One Health Intervention: This integrated approach (combining rodent control, PPE, and water management) was the most effective, resulting in a 21.07% cumulative reduction in symptomatic cases.
- Rodent Control: A 15% increase in coordinated control effectiveness was the second most effective strategy, achieving a 13.92% reduction. Notably, both rodent control and One Health interventions helped prevent the resurgence of cases in the later months of the simulation, whereas other scenarios saw renewed increases.
- PPE Use and Water Management: Increased PPE use resulted in a modest 7.69% reduction, while improved water management systems yielded the smallest impact at 1.13%.
4. Discussion
4.1. Model Validity and Theoretical Contributions
4.2. The Synergy Between Water and Rodent Ecology
4.3. Challenging Prevailing Paradigms: Rodents vs. Livestock
4.4. Intervention Scenarios and the One Health Approach
- PPE and Water Management: These interventions were less effective (7.69% and 1.13% reductions, respectively). PPE use is often confined to occupational settings and does not address everyday environmental exposure [7]. Similarly, water management strategies often target runoff rather than the existing standing water that already sustains the rodent–pathogen cycle [47].
4.5. Cultural Relevance and Future Directions
4.6. Limitations
5. Conclusions
Author Contributions
Funding
Data Availability Statement
Acknowledgments
Conflicts of Interest
Abbreviations
| SD | System Dynamics |
| CLD | Causal Loop Diagram |
| SEIR | Susceptible-exposed-infected-recovered |
| PPE | Personal Protective Equipment |
| EBRM | Ecologically Based Rodent Management |
| OR | Odds Ratio |
Appendix A

Appendix B
Appendix C

| Variable Name | Type | Units | Equation/Value | Reference |
|---|---|---|---|---|
| Human Subsystem | ||||
| Susceptible Population | Stock | People | INTEG (Min (0, −Infecting), Total population − Initial asymptomatic population − Initial exposed population − Initial recovered population − Initial infected population) | |
| Exposed Population | Stock | People | INTEG (Infecting − Asymptomatic emergence rate − Symptomatic emergence rate, (IF THEN ELSE (Flood associated risk = 1, 1, 3.37)) × Initial exposed population) | |
| Asymptomatic infected population | Stock | People | INTEG (Max (0, Asymptomatic emergence rate − Asymptomatic infected recovering), Initial asymptomatic population) | |
| Infected Population | Stock | People | INTEG (Symptomatic emergence rate − Infected Death rate − Recovering, Initial infected population) | |
| Deaths | Stock | People | INTEG (Infected Death rate, 0) | |
| Recovered | Stock | People | INTEG (Asymptomatic infected recovering + Recovering − Immune, Initial recovered population) | |
| Infecting | Flow | People/month | IF THEN ELSE (Susceptible Population > 0, (IF THEN ELSE (Occupation = 1, 1, 0.35)) × Total infectious contacts × Susceptible Population ÷ Total population × UC3, 0) | |
| Asymptomatic infected recovering | Flow | People/month | Asymptomatic infected population ÷ Asymptomatic Recovery Time | |
| Symptomatic emergence rate | Flow | People/month | Max (0, (1 − Asymptomatic ratio) × Exposed Population ÷ Incubation time) | |
| Asymptomatic emergence rate | Flow | People/month | max (0, Asymptomatic ratio × (Exposed Population) ÷ Incubation time) | |
| Recovering | Flow | People/month | IF THEN ELSE (Infected Population > 0, Infected Population × (1 − Mortality rate) ÷ Recovery Time ÷ UC2, 0) | |
| Asymptomatic infected recovering | Flow | People/month | (Asymptomatic infected population ÷ Asymptomatic Recovery Time) | |
| Infected Death rate | Flow | People/month | IF THEN ELSE (Infected Population > 0, SMOOTH3 ((Infected Population × Mortality rate), stime2), 0) | |
| Immune | Flow | People/month | Recovered × time to become immune | [55] |
| Initial exposed population | Constant | People | 1000 | Estimation |
| Initial asymptomatic population | Constant | People | 1000 | Estimation |
| Initial infected population | Constant | People | 200 | Estimation |
| Initial recovered population | Constant | People | 10,000 | Estimation |
| Total population | Auxiliary | People | Population density × Land size ÷ km2 to m2 conversion | |
| Total infectious contacts | Auxiliary | Per month | SMOOTH3 ((IF THEN ELSE (Behaviour = 1, 1, IF THEN ELSE (Behaviour = 2, 2.5, IF THEN ELSE (Behaviour = 3, 4.5, 3)))) × (Contacts with contaminated environment × infectivity of environment exposure + Contacts with infected rodents × infectivity of animal exposure), 3) | |
| Contacts with contaminated environment | Auxiliary | Contacts/month | (Contaminated Water ÷ Clean Water Contaminated Soil ÷ Clean Soil) × (Contact rate with environment ÷ (1 + PPE Use)) | |
| Contacts with infected rodents | Auxiliary | Contacts/month | Contact rate with rodents × Infected Rodents | |
| Population density | Constant | People/km2 | 50 | [24] |
| Infectivity of environment exposure | Constant | Per contact | 0.50 | Estimation |
| Infectivity of animal exposure | Constant | Per contact | 0.00223 | [27] |
| Contact rate with environment | Constant | Contacts/Month | 2000 | Estimation |
| Contact rate with rodents | Constant | Contacts/Month | 10 | Estimation |
| Behaviour | Constant | Dimensionless | 1 = general population, 2 = swimming, 3 = fishing, 4 = walking barefoot | Swimming (OR 2.5), fishing (OR 4.5), and walking barefoot (OR 3.0) [11]. |
| PPE Use | Constant | Dimensionless | 0.10 | [21] |
| Occupation | Constant | Dimensionless | 1 = General public, 2 = indoor occupation | Indoor Occupation OR 0.35. [11] |
| Flood-associated risk | Constant | Dimensionless | 1 = General population, 2 = flood-associated risk | 3.37-fold increase in leptospirosis cases [34] |
| Incubation time | Constant | Month | 1 | [25] |
| Asymptomatic ratio | Constant | Dimensionless | 0.90 | [25] |
| Mortality rate | Constant | Per month | 0.05 | [25] |
| Asymptomatic Recovery Time | Constant | Month | 3 | Estimation |
| Recovery Time | Constant | Month | 3 | Estimation |
| Time to become immune | Constant | Per month | 0.90 | [25] |
| UC3 | Constant | People | 1 | Unit Convertor |
| UC2 | Constant | Per month | 1 | Unit Convertor |
| Rodent Subsystem | ||||
| Rodent Population | Stock | Rodents | INTEG (Rodent births − Rodent deaths, Initial Rodent Population) | |
| Rodent births | Flow | Rodents/month | (Rodent Population ÷ 2) × Rodents per litter × Rodent birth rate fraction × (Rainfall ÷ average rainfall) | |
| Rodent deaths | Flow | Rodents/month | Rodent death rate fraction × Rodent Population × (1 + Rodent Control Measures) | |
| Initial Rodent Population | Constant | Rodents | 10 | Estimation |
| Infected Rodents | Auxiliary | Dimensionless | (Rodent Population ÷ Initial Rodent Population) × Infected rodent fraction | |
| Rodents per litter | Constant | Rodents/litter | 4 | [38] |
| Rodent birth rate fraction | Constant | Litter/rodents/month | 0.25 | [38] |
| Rodent death rate fraction | Constant | Per month | 0.30 | [37] |
| Rodent Control Measures | Constant | Dimensionless | 0.10 | [21,36] |
| Infected rodent fraction | Constant | Dimensionless | 0.267 | [27] |
| Environment Subsystem | ||||
| Contaminated Soil | Stock | m2 | INTEG (Contaminating soil − Leptospira death in soil, Land size × 0.2) | [56] |
| Clean Soil | Stock | m2 | INTEG (Leptospira death in soil − Contaminating soil, Land size × 0.8) | |
| Contaminated Water | Stock | m3 | INTEG (contaminated rainfall inflow + Contaminating water- contaminated overflow − Contaminated water usage − Leptospira death in water, Water size × 0.2) | [56] |
| Clean Water | Stock | m3 | INTEG (clean rainfall inflow + Leptospira death in water − Clean overflow − Clean water usage − Contaminating water, Water size × 0.8) | |
| Leptospira death in soil | Flow | m2/month | Contaminated Soil ÷ Leptospira survivability in soil × (1 − EXP (−TIME STEP ÷ stime3)) | |
| Contaminating soil | Flow | m2/month | Min (Clean Soil × UC2, max (0, Clean Soil × Infected Rodents × Soil contaminated from rodents)) | |
| Contaminated rainfall inflow | Flow | m3/month | Rainfall × Contaminated fraction rainfall × Runoff coefficient × Land size × mm to m conversion ÷ (1 + Water management) | |
| Clean rainfall inflow | Flow | m3/month | Min (UC2 × (Water size − Clean Water), (inflow fraction × mm to m conversion × Rainfall × (1 − contaminated fraction rainfall) × runoff coefficient × Land size) ÷ (1 + Water management)) | |
| Leptospira death in water | Flow | m3/month | SMOOTH3 (max (0, min ((Water size − Clean Water) × UC2, Contaminated Water)), Leptospira survivability in water) | |
| Contaminating water | Flow | m3/month | Min (Clean Water × UC2, Clean Water × Infected Rodents × Water contaminated from rodents) | |
| Contaminated water usage | Flow | m3/month | IF THEN ELSE (Contaminated Water > 0, min (water demand, Contaminated Water × UC2), 0) × Contaminated Water ÷ Clean Water | |
| Contaminated overflow | Flow | m3/month | IF THEN ELSE (Contaminated Water > Water size, Contaminated Water − Water size, 0) × UC2 | |
| Clean water usage | Flow | m3/month | IF THEN ELSE (Clean Water > 0, min (Water demand, Clean Water × UC2) × (1 − Contaminated Water ÷ Max (Clean Water + Contaminated Water, 1 × 10⁻⁶)), 0) | |
| Clean overflow | Flow | m3/month | IF THEN ELSE (Clean Water > Water size, Clean Water − Water size, 0) × UC2 | |
| Rainfall | Lookup Table | mm/month | WITH LOOKUP (Rainfall time, ([(0, 90) − (24, 400)], (0, 216), …, (24, 191))) | [31] |
| Rainfall time | Stock | Month | INTEG (1, 0) | |
| Land size | Constant | m2 | 1.00 × 10⁹ | Land size. 1000 km2 |
| Water size | Constant | m3 | 1.30 × 10⁸ | [57] |
| Leptospira survivability in soil | Constant | Month | 0.90 | [12] |
| Soil contaminated by rodents | Constant | Per month | 0.025 | Estimation |
| Leptospira survivability in water | Constant | Month | 2 | [12] |
| Water contaminated by rodents | Constant | Per month | 0.50 | [16] |
| Runoff coefficient | Constant | Dimensionless | 0.20 | [30] |
| Average rainfall | Constant | mm/month | 207 | [35] |
| Inflow fraction | Constant | Dimensionless | 0.07 | Estimation |
| Contaminated fraction rainfall | Constant | Dimensionless | 0.005 | Estimation |
| Water demand | Constant | m3/month | 228,061 | [58] |
| Water management | Constant | Dimensionless | 0.10 | [15] |
| mm to m conversion | Constant | m/mm | 0.001 | Unit Convertor |
| km2 to m2 conversion | Constant | m2/km2 | 1 × 10⁶ | Unit Convertor |
| stime3 | Constant | Month | 5 | Time step |
| stime2 | Constant | Dimensionless | 2 | Time step |
References
- Lau, C.L.; Dobson, A.J.; Smythe, L.D.; Fearnley, E.J.; Skelly, C.; Clements, A.C.; Craig, S.B.; Fuimaono, S.D.; Weinstein, P. Leptospirosis in American Samoa 2010: Epidemiology, environmental drivers, and the management of emergence. Am. J. Trop. Med. Hyg. 2012, 86, 309. [Google Scholar] [CrossRef] [PubMed]
- Sykes, J.E.; Haake, D.A.; Gamage, C.D.; Mills, W.Z.; Nally, J.E. A global one health perspective on leptospirosis in humans and animals. J. Am. Vet. Med. Assoc. 2022, 260, 1589–1596. [Google Scholar] [PubMed]
- Intergovernmental Panel on Climate Change. Climate Change 2001: Impacts, Adaptation, and Vulnerability: Contribution of Working Group II to the Third Assessment Report of the Intergovernmental Panel on Climate Change; Cambridge University Press: Geneva, Switzerland, 2001.
- Lau, C.L.; Smythe, L.D.; Craig, S.B.; Weinstein, P. Climate change, flooding, urbanisation and leptospirosis: Fuelling the fire? Trans. R. Soc. Trop. Med. Hyg. 2010, 104, 631–638. [Google Scholar] [CrossRef] [PubMed]
- Lau, C.L.; Townell, N.; Stephenson, E.; Craig, S.B. Leptospirosis: An important zoonosis acquired through work, play and travel. Aust. J. Gen. Pract. 2018, 47, 105–110. [Google Scholar] [CrossRef]
- Rees, E.M.; Lotto Batista, M.; Kama, M.; Kucharski, A.J.; Lau, C.L.; Lowe, R. Quantifying the relationship between climatic indicators and leptospirosis incidence in Fiji: A modelling study. PLoS Glob. Public Health 2023, 3, e0002400. [Google Scholar] [CrossRef]
- Lau, C.L.; Watson, C.H.; Lowry, J.H.; David, M.C.; Craig, S.B.; Wynwood, S.J.; Kama, M.; Nilles, E.J. Human leptospirosis infection in Fiji: An eco-epidemiological approach to identifying risk factors and environmental drivers for transmission. PLoS Neglected Trop. Dis. 2016, 10, e0004405. [Google Scholar] [CrossRef]
- Islam, T. Infectious disease surveillance update. Lancet Infect. Dis. 2022, 22, 598. [Google Scholar] [CrossRef]
- Ram, P.; Collings, D. Further observations on the epidemiology of leptospirosis in Fiji. Fiji Med. J. 1982, 10, 71–75. [Google Scholar]
- Gomard, Y.; Dellagi, K.; Goodman, S.M.; Mavingui, P.; Tortosa, P. Tracking animal reservoirs of pathogenic Leptospira: The right test for the right claim. Trop. Med. Infect. Dis. 2021, 6, 205. [Google Scholar] [CrossRef]
- Mwachui, M.A.; Crump, L.; Hartskeerl, R.; Zinsstag, J.; Hattendorf, J. Environmental and Behavioural Determinants of Leptospirosis Transmission: A Systematic Review. PLoS Neglected Trop. Dis. 2015, 9, e0003843. [Google Scholar] [CrossRef]
- Bierque, E.; Thibeaux, R.; Girault, D.; Soupé-Gilbert, M.-E.; Goarant, C. A systematic review of Leptospira in water and soil environments. PLoS ONE 2020, 15, e0227055. [Google Scholar]
- Reid, S.; Kama, M.; Richards, R.; Osborne, N.; Batakawai, M.S.; Vitangcol, M.K.; Sahin, O. One Health interventions for leptospirosis: Do we need an engineer? Int. J. Infect. Dis. 2025, 152, 107678. [Google Scholar] [CrossRef]
- Mayfield, H.J.; Smith, C.S.; Lowry, J.H.; Watson, C.H.; Baker, M.G.; Kama, M.; Nilles, E.J.; Lau, C.L. Predictive risk mapping of an environmentally-driven infectious disease using spatial Bayesian networks: A case study of leptospirosis in Fiji. PLoS Neglected Trop. Dis. 2018, 12, e0006857. [Google Scholar]
- Ministry of Waterways and Environment (Fiji). Watershed Management; Ministry of Waterways and Environment (Fiji): Suva, Fiji, 2025.
- Bachoon, D.S.; Redhead, A.S.; Mead, A.J. Mitochondrial DNA marker: A PCR approach for tracking rat (Rattus rattus and Rattus norvegicus) fecal pollution in surface water systems. Sci. Total Environ. 2024, 921, 171164. [Google Scholar] [PubMed]
- United Nations Development Programme. Piloting Climate Change Adaptation to Protect Human Health Project in Fiji; United Nations Development Programme: Suva, Fiji, 2012; p. 38.
- Burger, P.A. Integrating One Health into Systems Science. One Health 2024, 18, 100701. [Google Scholar] [CrossRef] [PubMed]
- Adam, T. Advancing the application of systems thinking in health. Health Res. Policy Syst. 2014, 12, 50. [Google Scholar] [CrossRef]
- Sterman, J.D. Business Dynamics: Systems Thinking and Modeling for a Complex World; MacGraw-Hill/Irwin: Boston, MA, USA, 2000. [Google Scholar]
- McPherson, A.; Hill, P.S.; Kama, M.; Reid, S. Exploring governance for a One Health collaboration for leptospirosis prevention and control in Fiji: Stakeholder perceptions, evidence, and processes. Int. J. Health Plan. Manag. 2018, 33, 677–689. [Google Scholar]
- Ventana Systems, Inc. Vensim DSS, Version 10.3.1; Software for Modelling; Ventana Systems, Inc.: Harvard, MA, USA, 2025. [Google Scholar]
- Biswas, M.H.A.; Paiva, L.T.; De Pinho, M. A SEIR model for control of infectious diseases with constraints. Math. Biosci. Eng. 2014, 11, 761–784. [Google Scholar] [CrossRef]
- The World Bank Group. Population Density (People Per sq. km of Land Area) (World Development Indicators); World Bank Open Data: Washington, DC, USA, 2025. [Google Scholar]
- Centers for Disease Control and Prevention (U.S.). Leptospirosis: Fact Sheet for Clinicians; Centers for Disease Control and Prevention (U.S.): Atlanta, GA, USA, 2018.
- Lane, A.B.; Dore, M.M. Leptospirosis: A clinical review of evidence based diagnosis, treatment and prevention. World J. Clin. Infect. Dis. 2016, 6, 61–66. [Google Scholar] [CrossRef]
- Perez, J.; Brescia, F.; Becam, J.; Mauron, C.; Goarant, C. Rodent abundance dynamics and leptospirosis carriage in an area of hyper-endemicity in New Caledonia. PLoS Neglected Trop. Dis. 2011, 5, e1361. [Google Scholar]
- Htwe, N.M.; Sudarmaji; Pustika, A.B.; Brown, P.R.; Stuart, A.; Duque, U.; Singleton, G.R.; Jacob, J. Impacts of rainfall and rainfall anomalies on the population dynamics of rodents in southeast Asian rice fields. Pest Manag. Sci. 2024, 80, 5574–5583. [Google Scholar] [CrossRef]
- Ernest, S.M.; Brown, J.H.; Parmenter, R.R. Rodents, plants, and precipitation: Spatial and temporal dynamics of consumers and resources. Oikos 2000, 88, 470–482. [Google Scholar] [CrossRef]
- Strahler, A. Quantitative Geomorphology of Drainage Basins and Channel Networks. In Handbook of Applied Hydrology; Chow, V., Ed.; McGraw-Hill: New York, NY, USA, 1964; pp. 439–476. [Google Scholar]
- Cedar Lake Ventures Inc. Climate and Average Weather Year Round Fiji. Available online: https://weatherspark.com/y/150224/Average-Weather-in-Fiji-Year-Round (accessed on 12 June 2025).
- Barlas, Y. Formal aspects of model validity and validation in system dynamics. Syst. Dyn. Rev. 1996, 12, 183–210. [Google Scholar]
- Fiji’s Meteorological Service. Annual Climate Summary-2012; ACS-2012; Fiji’s Meteorological Service: Nadi, Fiji, 2013.
- Togami, E.; Kama, M.; Goarant, C.; Craig, S.B.; Lau, C.; Ritter, J.M.; Imrie, A.; Ko, A.I.; Nilles, E.J. A large leptospirosis outbreak following successive severe floods in Fiji, 2012. Am. J. Trop. Med. Hyg. 2018, 99, 849. [Google Scholar] [CrossRef] [PubMed]
- The World Bank Group. Climate Change Knowledge Portal: Historical Climate Data-Fiji; The World Bank Group: Washington, DC, USA, 2025. [Google Scholar]
- Janković, L.; Drašković, V.; Pintarič, Š.; Mirilović, M.; Đurić, S.; Tajdić, N.; Teodorović, R. Rodent pest control. Vet. Glas. 2019, 73, 85–99. [Google Scholar]
- Feng, A.Y.; Himsworth, C.G. The secret life of the city rat: A review of the ecology of urban Norway and black rats (Rattus norvegicus and Rattus rattus). Urban Ecosyst. 2014, 17, 149–162. [Google Scholar]
- Department of Primary Industries and Regional Development (Western Australia). Pacific Rat-Animal Pest Alert; Department of Primary Industries and Regional Development (Western Australia): Perth, WA, Australia, 2018.
- Britton, T.; Scalia Tomba, G. Estimation in emerging epidemics: Biases and remedies. J. R. Soc. Interface 2019, 16, 20180670. [Google Scholar] [CrossRef]
- van der Steen, J.T.; Ter Riet, G.; van den Bogert, C.A.; Bouter, L.M. Causes of reporting bias: A theoretical framework. F1000Research 2019, 8, 280. [Google Scholar]
- Noufaily, A.; Ghebremichael-Weldeselassie, Y.; Enki, D.G.; Garthwaite, P.; Andrews, N.; Charlett, A.; Farrington, P. Modelling reporting delays for outbreak detection in infectious disease data. J. R. Stat. Soc. Ser. A 2015, 178, 205–222. [Google Scholar]
- Krøjgaard, L.; Villumsen, S.; Markussen, M.; Jensen, J.; Leirs, H.; Heiberg, A.-C. High prevalence of Leptospira spp. in sewer rats (Rattus norvegicus). Epidemiol. Infect. 2009, 137, 1586–1592. [Google Scholar]
- Vave, R. Five culturally protected water body practices in Fiji: Current status and contemporary displacement challenges. Ambio 2022, 51, 1001–1013. [Google Scholar] [CrossRef] [PubMed]
- Nelson, S.; Abimbola, S.; Mangubhai, S.; Jenkins, A.; Jupiter, S.; Naivalu, K.; Naivalulevu, V.; Negin, J. Understanding the decision-making structures, roles and actions of village-level water committees in Fiji. Int. J. Water Resour. Dev. 2022, 38, 518–535. [Google Scholar] [CrossRef]
- Benacer, D.; Thong, K.L.; Verasahib, K.B.; Galloway, R.L.; Hartskeerl, R.A.; Lewis, J.W.; Mohd Zain, S.N. Human leptospirosis in Malaysia: Reviewing the challenges after 8 decades (1925–2012). Asia Pac. J. Public Health 2016, 28, 290–302. [Google Scholar] [CrossRef] [PubMed]
- Holt, J.; Davis, S.; Leirs, H. A model of leptospirosis infection in an African rodent to determine risk to humans: Seasonal fluctuations and the impact of rodent control. Acta Trop. 2006, 99, 218–225. [Google Scholar] [CrossRef]
- Jupiter, S.D.; Jenkins, A.P.; Negin, J.; Anthony, S.; Baleinamau, P.; Devi, R.; Gavidi, S.; Latinne, A.; Mailautoka, K.K.; Mangubhai, S. Transforming place-based management within watersheds in Fiji: The Watershed Interventions for Systems Health project. PLoS Water 2024, 3, e0000102. [Google Scholar] [CrossRef]
- Ramsay, G. Integration of livestock in traditional farming systems in the Pacific Islands. In Proceedings of the Traditional Farming Systems for the South Pacific, Suva, Fiji, 18–22 October 1999; pp. 18–22. [Google Scholar]
- Brown, P.R.; Tuan, N.P.; Singleton, G.R.; Ha, P.T.T.; Hoa, P.T.; Hue, D.T.; Tan, T.Q.; Tuat, N.V.; Jacob, J.; Müller, W.J. Ecologically based management of rodents in the real world: Applied to a mixed agroecosystem in Vietnam. Ecol. Appl. 2006, 16, 2000–2010. [Google Scholar] [CrossRef]
- Singleton, G.R.; Leirs, H.; Hinds, L.A.; Zhang, Z. Ecologically-Based Management of Rodent Pests; Australian Centre for International Agricultural Research: Canberra, ACT, Australia, 1999; Volume 31.
- Saif, A.; Frean, J.; Rossouw, J.; Trataris, A.N. Leptospirosis in South Africa. Onderstepoort J. Vet. Res. 2012, 79, 133. [Google Scholar] [CrossRef]
- Taylor, P. Managing Urban Rats & Rodent-borne Diseases in a Squatter Camp—The Cato Crest Model? Palmnut Post 2006, 9, 18–20. [Google Scholar]
- World Health Organisation. One Health. Available online: https://www.who.int/health-topics/one-health#tab=tab_1 (accessed on 2 May 2025).
- The Lancet. One Health: A call for ecological equity. Lancet 2023, 401, 169. [Google Scholar] [CrossRef]
- Esteves, L.M.; Bulhões, S.M.; Branco, C.C.; Mota, F.M.; Paiva, C.; Cabral, R.; Vieira, M.L.; Mota-Vieira, L. Human leptospirosis: Seroreactivity and genetic susceptibility in the population of Sao Miguel Island (Azores, Portugal). PLoS ONE 2014, 9, e108534. [Google Scholar] [CrossRef]
- Sayanthi, Y.; Susanna, D. Pathogenic Leptospira contamination in the environment: A systematic review. Infect. Ecol. Epidemiol. 2024, 14, 2324820. [Google Scholar] [CrossRef]
- United Nations Statistics Division. Environment Statistics Country Snapshot: Fiji; United Nations: New York, NY, USA, 2016.
- Food and Agriculture Organization of the United Nations. Country Profile: Fiji-Irrigation and Drainage (AQUASTATE Survey 2016); Food and Agriculture Organization of the United Nations: Rome, Italy, 2016.



| Variable | −10% Value | Base Case | +10% Value | Reference |
|---|---|---|---|---|
| PPE Use | 0.05 | 0.1 | 0.15 | [21] |
| Environment contact rate | 1800 | 2000 | 2200 | Estimation |
| Water Management | 0 | 0.1 | 0.2 | [15] |
| Average rainfall | 149.4 | 166 | 182.6 | [35] |
| Rodent control measures | 0.05 | 0.1 | 0.15 | [21,36] |
| Rodent death rate | 0.29 | 0.39 | 0.49 | [37] |
| Rodent birth rate | 0.15 | 0.25 | 0.3 | [38] |
| Rodents per litter | 3 | 4 | 5 | [38] |
| Intervention Scenarios | Stepwise Reduction step,t (SD) | Cumulative Reduction |
|---|---|---|
| Rodent control | −17.49% (15.66) | −13.92% |
| PPE use | −8.82% (3.2) | −7.69% |
| Water management systems | −1.42% (1.13) | −1.13% |
| One Health | −25.51% (16.99) | −21.07% |
Disclaimer/Publisher’s Note: The statements, opinions and data contained in all publications are solely those of the individual author(s) and contributor(s) and not of MDPI and/or the editor(s). MDPI and/or the editor(s) disclaim responsibility for any injury to people or property resulting from any ideas, methods, instructions or products referred to in the content. |
© 2026 by the authors. Licensee MDPI, Basel, Switzerland. This article is an open access article distributed under the terms and conditions of the Creative Commons Attribution (CC BY) license.
Share and Cite
Lennon, L.F.; Sahin, O.; Batikawai, S.; Reid, S.A. A One Health Approach to Water as an Ecological Enabler for Leptospirosis: A System Dynamics Model. Systems 2026, 14, 237. https://doi.org/10.3390/systems14030237
Lennon LF, Sahin O, Batikawai S, Reid SA. A One Health Approach to Water as an Ecological Enabler for Leptospirosis: A System Dynamics Model. Systems. 2026; 14(3):237. https://doi.org/10.3390/systems14030237
Chicago/Turabian StyleLennon, Lydia Fortune, Oz Sahin, Suliasi Batikawai, and Simon Andrew Reid. 2026. "A One Health Approach to Water as an Ecological Enabler for Leptospirosis: A System Dynamics Model" Systems 14, no. 3: 237. https://doi.org/10.3390/systems14030237
APA StyleLennon, L. F., Sahin, O., Batikawai, S., & Reid, S. A. (2026). A One Health Approach to Water as an Ecological Enabler for Leptospirosis: A System Dynamics Model. Systems, 14(3), 237. https://doi.org/10.3390/systems14030237