Abstract
The supply chain network is important for manufacturing enterprises to obtain innovation resources and information; hence, their network location significantly influences innovation performance. The existing research has focused on the factors and the macro environment of the innovation performance but lacks the exploration of how supply chain network location affects innovation performance from a supply chain network perspective. Based on a sample of A-share listed manufacturing enterprises from 2013 to 2023, this research constructs a supply chain network characterized by supplier–customer relationships to explore the impact of supply chain network location on innovation performance and the underlying mechanisms. The findings show that (1) the supply chain network location has a significant positive impact on the innovation performance; (2) operational risk plays a mediating role in the path between supply chain network location and innovation performance; and (3) digital transformation and information asymmetry play a moderating role in the relationship between supply chain network location and innovation performance. This research enriches the theoretical research on supply chain network location and innovation performance, providing insights for manufacturing enterprises to optimize innovation strategies and adjust their supply chain network locations.
1. Introduction
The deepening integration of the world economy has intensified market competition, prompting countries to actively seek new drivers of development. As the foundation of China’s economy, the manufacturing industry should embrace innovation-driven development, increase investment in R&D, and achieve high-quality development through technological innovation. Innovation performance refers to the economic and social benefits achieved by enterprises or other organizations from innovation [1]. It reflects the efficiency and outcomes of the innovation process, emphasizing the importance of value creation throughout the entire course of innovation activities, covering all stages from technological creation to market performance [2]. As a core measure of the effectiveness of innovation activities, innovation performance directly reflects the efficiency of utilizing innovation resources and the capability to transform innovative outcomes. Therefore, it is a critical driving force for promoting high-quality development in manufacturing enterprises and even the entire industry.
With the rapid advancement of technology, the degree of resource interdependence among enterprises has increased, and their capabilities to build supply chains have also strengthened, ultimately leading to the formation of supply chain networks [3]. Enterprises at different supply chain network locations can access different information and resources [4]. Those located at the central position can enhance their risk-bearing capacity and alleviate financial constraints by accessing information and integrating resources [5] and thereby significantly improve the diversity level of innovation [6]. On one hand, those occupying structural holes can obtain abundant information and provide more innovation resources [7]; on the other hand, due to their complex network relationships, they may trigger risks across the entire network, intensify operational pressures, and hinder the improvement of innovation performance [8].
Although scholars have explored the mechanisms through which supply chain network locations influence the innovation performance from the perspectives of knowledge integration [9,10] and financial constraints [11], most studies have focused on cross-industry analyses [12], neglecting the potential and differential impacts of network locations on innovation performance in different industries. Therefore, this research analyzes the impacts of supply chain network locations on the innovation performance of manufacturing firms based on the Social Network Theory, the Resource Dependence Theory, and the Prospect Theory. This research provides theoretical support and managerial insights for manufacturing enterprises in China to optimize their innovation strategies and adjust their supply chain network locations.
The potential contributions are as follows: First, this research analyzes innovation performance from a supply chain network perspective. The impacts of supply chain network locations on innovation performance are explored based on the Social Network Theory, which enriches the understanding of factors influencing the innovation performance and provides a new theoretical foundation for innovation management. Second, this research analyzes the mechanisms through which supply chain network locations affect the innovation performance. It not only validates the proposition that “innovation performance is influenced by the network in which a firm is embedded” but also explores the mediating role of operational risks, as well as the moderating effects of digital transformation and information asymmetry. This comprehensive analysis of the mechanisms helps manufacturing enterprises accurately understand the complex relationships between network locations and innovation performance, thereby offering guidance for developing business strategies.
2. Literature Review and Hypothesis Development
2.1. Supply Chain Network Location and Innovation Performance
Based on the Social Network Theory, the supply chain network location influences enterprises’ operational decision-making processes and performance outcomes [13]. Network embedding enables firms to broaden their access to information and technology, reduce transaction costs, and facilitate the innovation process [14,15]. By connecting heterogeneous networks and integrating diverse knowledge [16], firms can acquire information and knowledge resources [17], thereby achieving breakthrough innovation. However, excessive network embedding may also trigger higher operational risks and lead to information overload and resource dispersion, which will cause a significant decline in performance [18].
Network embedding mainly includes relational embedding and structural embedding. Relational embedding, taking a cohesive perspective, emphasizes enhancing information sharing and resource complementarity between firms through the direct ties among network nodes [19,20]. Structural embedding, transcending relational embedding from a network location perspective, emphasizes that the transfer of information and resources in social networks depends not only on the close-distance, direct contacts between members but also on the network structure, which encompasses indirect linkages [21]. This research focuses on the impacts of supply chain network locations on firms’ innovation performance. Structural embedding emphasizes the locations that network members occupy within the overall network, reflecting outcomes such as information sharing, social monitoring, and reputational effects [22,23]. In structural embedding, network centrality and structural holes characterize the locations occupied by a firm within a social network.
According to the Resource Dependence Theory, the external environment determines whether manufacturing enterprises can easily access the resources essential for innovation, thereby affecting the innovation output and performance. The resources that manufacturing enterprises receive from supply chain networks are closely related to the quantity and quality of the direct partners [24]. On one hand, the manufacturing enterprises with higher centrality usually have a greater number of partners. They can quickly obtain market and technological information and optimize resource allocation by utilizing the advantages of the internet [25]. The richer information accumulated in business interactions and the ability to effectively integrate resources foster innovation in these enterprises [26,27,28]. Consequently, they demonstrate superior performance in both innovation input and output [29]. On the other hand, the enterprises occupying structural holes can act as bridges, enabling them to rapidly integrate resources from diverse nodes within the supply chain. The integration helps balance technological development and market demands, resulting in network control advantages and sustained innovative capabilities [30].
Based on the Information Asymmetry Theory, the enterprises occupying high-centrality locations can act as “information hubs” and reduce decision-making risks and resource waste caused by information asymmetry [31], thereby enhancing their innovation performance. The enterprises occupying structural hole locations can obtain novel and diverse information from unconnected groups, energizing innovation and enhancing innovation performance [32]. Furthermore, when a supplier encounters technological bottlenecks, the manufacturing enterprises can swiftly reallocate resources to other nodes to avoid innovation disruption. The heterogeneity of information enables manufacturing enterprises to effectively integrate cross-field knowledge resources, thereby significantly enhancing innovation capabilities and performance [33,34].
Therefore, this research proposes the following hypotheses:
H1.
In the supply chain network, the closer the manufacturing enterprises are to the center of the network, the more they can enhance their innovation performance.
H2.
In the supply chain network, the greater the number of structural holes occupied by the manufacturing enterprises, the more they can enhance their innovation performance.
2.2. The Role of Operational Risks
Operational risks refer to the various potential risks that enterprises may encounter during their operations and production processes due to management decisions and the external environment. These risks include financial risk, reputational risks, regulatory and legal risk, and information risk, as well as emerging risks associated with the digital transformation process [35]. These risks may lead to vulnerabilities between supply chain nodes, posing potential threats to the stability and sustainability of relationships between suppliers and customers. In supply chain networks, the manufacturing industry is characterized by long industry chains and a high dependence on suppliers for core components. As a result, the supply chain network location of a manufacturing enterprise significantly influences its operational risk. When a company within the supply chain network experiences issues such as poor decision-making, liquidity crises, or bankruptcy, its key suppliers and customers would be directly affected [36].
In supply chain networks, enterprises with high network centrality usually have advantages in resource acquisition and information control [37]. However, this location also renders them more susceptible to risks transmitted from other nodes within the network, thereby amplifying the diffusion effects of operational risks [38]. Enterprises occupying structural holes are able to connect disconnected nodes, so they can efficiently access diverse resources. However, the complexity of these relationships may lead to higher resource dependency. Dependency on resources from specific nodes can amplify operational risks, thereby increasing operational pressure on the enterprise [39]. Operational risks not only adversely affect the enterprise itself but may also spread to upstream and downstream enterprises through the supply chain. The bidirectional and jumping transmission of risks among supply chain enterprises can amplify the overall risks of the whole supply network [40].
In a rapidly changing market, decision-makers of enterprises exhibit bounded rationality when making risk-related decisions and therefore cannot achieve fully rational optimal choices [41]. In supply chain networks, the relationships between enterprises are complex, and their risk resilience capabilities are often limited. When there is a decline in the status of a manufacturing enterprise due to supply chain risks, the enterprise may invest substantially in R&D, with the aim to develop new products, explore new markets, and optimize supply chain management. These innovation activities may help mitigate risks and adapt the enterprise to fluctuations in customer demand or instability in supplier deliveries. Thus, when manufacturing enterprises face operational risks, they often adopt proactive strategies and break away from conventional risk preferences. This typically involves pursuing aggressive innovation measures—such as increasing innovation investment and launching innovation initiatives—to restore their competitive advantage and enhance innovation performance [42,43].
Thus, this research proposes the following hypotheses:
H3a.
Operational risks play a mediating role in the relationship between the centrality of the supply chain network and innovation performance.
H3b.
Operational risks play a mediating role in the relationship between the supply chain network structure holes and innovation performance.
2.3. The Role of Digital Transformation and Information Asymmetry
Digital transformation is a dynamic evolution process driven primarily by data factors, triggering profound changes in business processes and organizational structures and integrating the internal and external operational workflows to gain competitive advantages. Enterprises build their own supply chain networks to secure access to innovative resources and enhance their digital capabilities [44]. Digital technologies significantly improve enterprises’ environmental adaptability and knowledge absorption capacity, increase the utilization rate of the internet, improve information sharing among firms, and facilitate the reintegration of resources, such as technology, knowledge, and data [45]. This reduces the impacts of uncertainty and information asymmetry [46], promoting enterprises’ radical innovation [47]. Digital transformation can enhance enterprises’ resource integration capabilities and operational transparency, thereby reducing their risks to some extent [48]. It also drives the reorganization and optimization of innovation factors, promotes innovation, and generates additional revenue for firms [49,50].
Thus, this research proposes the following research hypotheses:
H4a.
Digital transformation positively moderates the relationship between supply chain network centrality and innovation performance.
H4b.
Digital transformation positively moderates the relationship between supply chain network structural holes and innovation performance.
Information asymmetry refers to the uneven distribution of information among market participants. For manufacturing enterprises, when information asymmetry exists between them and their upstream and downstream partners, they often face the challenge of how to convey signals about the quality of products or services to other firms in the supply chain network [51]. This adversely affects the operation of manufacturers, hinders the acquisition of information, and intensifies innovation risks, which inhibit the improvement of innovation performance. When enterprises integrate information flows from upstream component suppliers and downstream customers, effective market signals can mitigate the negative impacts caused by information asymmetry to some extent. Firstly, information asymmetry may reduce the ability of enterprises occupying structural holes to control and allocate resources. Manufacturing enterprises may be unable to efficiently obtain critical resources or may misallocate them, restricting the innovation activities [52,53]. Secondly, when the degree of information asymmetry is high, manufacturing enterprises with high centrality within the supply chain network cannot accurately assess the quality and value of resources. Finally, information asymmetry may increase an enterprise’s uncertainty regarding market demand and technological trends, affect the efficiency of resource integration and allocation, and weaken the role of dynamic capabilities in enhancing innovation performance [54]. For instance, in complex supply chain environments, it is difficult to adjust resource strategies in time due to insufficient information transparency, resulting in missed opportunities [55]. Especially, the location of structural holes will increase the complexity of information, which raises the risks associated with innovation activities. Excessive information asymmetry limits the ability of enterprises to integrate resources and weakens the innovation benefits derived from network location. From the dual perspectives of the Information Asymmetry Theory and the Social Network Theory, the supply chain locations of enterprises influence their resource acquisition and innovation decision-making, while the degree of information asymmetry acts as a key moderating variable in this relationship.
Thus, this research proposes the following research hypotheses:
H5a.
Information asymmetry negatively moderates the relationship between the centrality of supply chain networks and innovation performance.
H5b.
Information asymmetry negatively moderates the relationship between supply chain network structure holes and innovation performance.
Based on the above analysis and assumptions, the specific research model of this research is proposed, as shown in Figure 1.
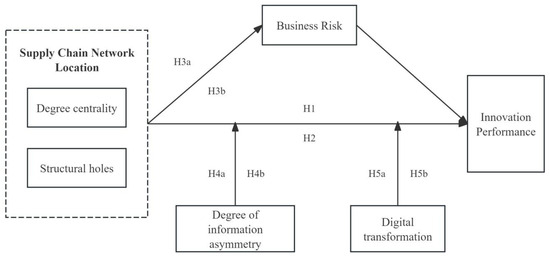
Figure 1.
Theoretical framework.
3. Research Design
3.1. Data Sources and Supply Network Construction
With manufacturing enterprises cooperating more frequently and forming closer ties within supply chain networks, these relationships have gradually attracted significant attention in China’s securities market. Consequently, the disclosure of supply chain information has become an important focal point. The “Content and Format Standards for Information Disclosure by Companies Offering Securities to the Public No. 2” (hereinafter referred to as the “Standards”) issued by the China Securities Regulatory Commission in 2012 encourages listed companies to disclose specific information on their top five suppliers and customers as of 1 January 2013. Therefore, this research takes 2013 as its starting point. The research sample consists of manufacturing companies listed on the Shanghai and Shenzhen A-share markets from 2013 to 2023. Following the approach of Shi et al. (2019), we collected and organized data on manufacturing firms’ supply chains and used Pajek to construct annual supply chain networks [18]. Subsequently, we calculated the relevant network indicators for each manufacturing firm. All data were obtained from the CSMAR database. During data collection, overseas-listed enterprises (including those in Hong Kong) were treated as unlisted entities. The branch companies are uniformly consolidated into the parent company node. Listed enterprises in the financial and insurance sectors, ST and *ST firms, as well as companies with outliers or missing data, were excluded from the sample. Furthermore, all continuous variables were winsorized at the 1% and 99% levels to mitigate the influence of extreme values. The final sample comprised 4324 firm-year observations.
In this research, Pajek was used to construct the supply chain networks for each year from 2013 to 2023. The generated 11-year supply chain network diagrams are shown in Figure 2. In the figure, the dots represent nodes in the supply chain network, which include listed companies and their disclosed top five suppliers and customers. The line segments between nodes depict supply chain relationships. The figure shows that China’s manufacturing enterprises have formed a complex relationship network through supply chain ties. From 2013 to 2023, the supply chain networks of China’s manufacturing sector exhibited a trend of initial decline, followed by a period of increase, and a final decrease again in 2023. This pattern is linked to the distinct economic conditions, policy directions, and global market shifts that characterized different phases of this decade. In 2014, China’s economy entered a “new normal” phase, marked by an accelerated structural adjustment. Traditional industries grappled with overcapacity and weak market demand, leading to reduced inter-firm cooperation and a loosening of the supply chain network. From 2015 to 2022, nationwide pushes for digital transformation, strengthened regional coordination, and a heightened awareness of supply chain risk management contributed to a year-on-year tightening of supply chain relationships. In 2023, however, this trend was reversed. Mounting global economic uncertainties, geopolitical conflicts, and rising trade protectionism disrupted supply chain configurations and dampened cooperation among firms. Furthermore, as a new technological revolution and industrial transformation accelerated, some traditional manufacturers struggled to adapt due to lagging technological upgrades. This inability to meet new market demands and technical standards forced adjustments in supply chain relationships, ultimately leading to a decline in the overall tightness of China’s manufacturing supply chain network in 2023.
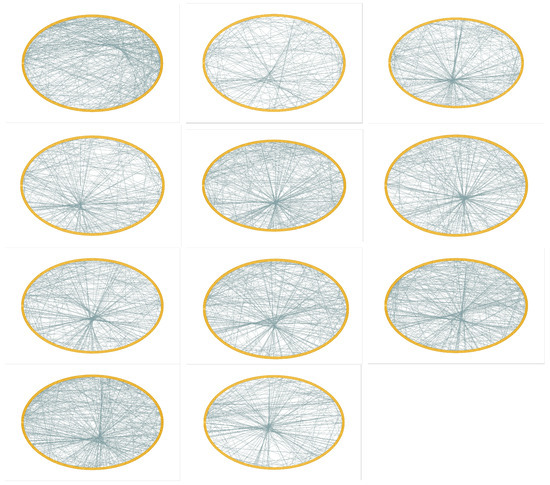
Figure 2.
2013–2023 supply network diagram.
3.2. Measurement of the Variables
3.2.1. Dependent Variables
To measure the innovation performance of manufacturing firms, this study follows Li et al. (2020) by using the number of invention patent applications as a proxy variable, focusing on innovation output [56]. Since patent data typically exhibit a right-skewed distribution, we used the natural logarithm of one plus the number of patent applications in year t as our measure of innovation performance.
3.2.2. Independent Variables
Network centrality (Degree) is an important indicator for measuring the location of an enterprise embedded in the supply chain network, mainly used to reflect the importance of node enterprises. Referring to the research of Wu et al. (2020), in the benchmark regression model, Degree centrality was selected as the core explanatory variable of the centrality of manufacturing enterprises [57]. The centrality index of each node enterprise was calculated by using the Pajek social network analysis software.
Structural hole (CI) is an important indicator for measuring the location of an enterprise embedded in the supply chain network. When a certain node plays the role of a bridge among multiple closely connected nodes, it is regarded as occupying the location of a structural hole. This research refers to the research of Shi et al. (2019), and the network constraint index of each node enterprise calculated in Pajek is obtained through (1—constraint index) to obtain the structural hole index [18].
3.2.3. Mediating Variable
Operational Risk: This research refers to the Altman’s Z-Score model to quantitatively measure the operational risks of enterprises. Among them, a lower Z score represents a higher level of business operation risks. The calculation formula for Z is
X1 = (current assets − current liabilities)/total assets; X2 = accumulated retained earnings/total assets; X3 = EBIT/total assets; X4 = (market value of equity + equity in non-tradable shares)/total liabilities; X5 = sales/total assets. Special note: In view of the lack of market price of non-tradable shares in China’s stock market, this research makes adaptive adjustments to the variable X4: X4 = (market price per share × number of tradable shares + net assets per share × number of non-tradable shares)/total liabilities.
3.2.4. Moderating Variables
Degree of information asymmetry (): Following Chen et al. (2019), we constructed a proxy for information asymmetry based on detailed individual stock trading data [58]. This metric evaluates the asymmetry of information about firm value in the market by analyzing a company’s stock trading patterns. Specifically, we employ three stock market liquidity indicators: the liquidity ratio (LR), the illiquidity ratio (ILL), and the yield reversal indicator (GAM). We then performed principal component analysis (PCA) on these three indicators to extract the components most related to asymmetric information. This composite measure, which captures the difference in value information between informed and uninformed traders, serves as our information asymmetry variable. A higher value indicates worse stock liquidity and a greater degree of information asymmetry.
Digital transformation (): Following the research by Zhen et al., we measured a firm’s level of digital transformation using the index published by the Guotai’an Database in 2023 [59]. This comprehensive index is calculated by weighting six dimensions: strategic guidance, technology-driven, organizational empowerment, environmental support, digital achievements, and digital application.
3.2.5. Control Variables
Following Yu et al. (2022) and Shi et al. (2019) [10,18], this research includes the following control variables: (1) Loss: The profit or loss state of an enterprise has an important impact on its business decisions, resource allocation, and further innovation investment. (2) Listing age: The number of years since a firm’s IPO. A firm’s stage in the capital market lifecycle affects its business strategy, resource base, and focus on innovation. (3) Total Asset Turnover (ATO): This ratio measures the operating efficiency of a firm’s total assets. (4) Cashflow: Net cash flow from operating activities. This represents the core internal financial resource available to fund innovation initiatives. (5) Proportion of Independent Directors (Indep): The ratio of independent directors on the board. This is a key aspect of corporate governance. As external members, independent directors may have interests and incentives that differ from those of internal shareholders or management.
3.3. Model Design
This research focuses on the manufacturing sector. Industry classification follows the “National Economic Industry Classification” published by China’s National Bureau of Statistics. To accurately estimate the impact of a firm’s supply chain network location on its innovation performance, we employed a two-way fixed effects model that controls for both industry and year.
Formula (1) mainly examines the relationship between the centrality of the supply chain network () and the innovation performance of manufacturing enterprises (). Formula (2) mainly examines the relationship between the structural holes of the supply chain network () and the innovation performance of manufacturing enterprises ().
Formulas (3) and (4) examine the mediating effect of operational risks on the relationship between supply chain network location and enterprise innovation performance using the stepwise regression method.
Formulas (5) and (6) examine the moderating effect of information asymmetry on the relationship between supply chain network location and enterprise innovation performance. Formulas (7) and (8) examine the moderating effect of digital transformation on the relationship between supply chain network location and enterprise innovation performance.
4. Empirical Results
4.1. Descriptive Statistics and Correlation Analysis
Descriptive statistics for all variables across 4324 observations are presented in Table 1. The maximum value of innovation performance (Pat) is 5.860, the minimum value is 0.000, and the standard deviation is 1.450, indicating that there are significant differences in the innovation performance of manufacturing enterprises in the supply chain network, and the innovation performance is relatively low. The maximum value of centrality (Degree) is 7, the minimum value is 1, the mean is 1.930, and the standard deviation is 1.360. This indicates that the network centrality among different enterprises varies greatly. The higher the centrality, the more central the enterprise is. According to the structural hole theory [60], the lower the CI value, the more significant is the location of the structural hole occupied by the enterprise. The maximum value of the structural hole (CI) is 0.810, the minimum value is 0, and the average value is 0.230, indicating that there are fewer manufacturing enterprises occupying the location of the structural hole in the supply chain network. The maximum value of operational risk (Risk) is 34.940, the minimum value is 0.150, and the average value is 4340, indicating that there is an extreme differentiation phenomenon of operational risk in the sample enterprises. The maximum value of information asymmetry (ASY) is 0.620, the minimum value is −2.920, the average is −0.400, and the standard deviation is 0.610. This indicates that the degree of information asymmetry among the sample enterprises varies significantly, but most of the sample enterprises perform well in terms of information transparency. The maximum value of Digital Transformation (DCG) is 65.810, the minimum value is 22.980, the average is 37.130, and the standard deviation is 10.600, indicating that there is a significant imbalance in the digitalization process of different enterprises.

Table 1.
Descriptive statistics.
Table 2 shows the correlations among the variables. The results show that network centrality, structural holes, and innovation performance commitment are positively correlated at a significance level of 1%, indicating that there is a certain positive correlation. Furthermore, by calculating the variance inflation factor (VIF) of each variable, it was found that the values were all less than 5, indicating no serious multicollinearity among the explanatory variables. The results are presented in Table 3.
Table 2.
Correlation analysis.
Table 3.
Variance inflation factor.
4.2. Baseline Regression Results
To investigate the impact of a firm’s supply chain network location on its innovation performance, we first performed F-tests and Hausman tests. The p-values for both tests were below 0.01, leading us to reject the null hypotheses at the 1% significance level. These results indicate that the fixed-effects model is more appropriate and provides more reliable estimates for our sample data than alternative models. To control for potential industry and time effects, industry (ind) and year dummy variables are included in all the regression models. The results are presented in Table 4.
Table 4.
Baseline regression test.
Column (1) presents the baseline regression results for network centrality (Degree). The coefficient of 0.0826 is significant at the 1% level, suggesting that a central network location enhances the innovation performance of manufacturing firms. In Column (2), control variables are added to this model. The coefficient on Degree remains positive and significant at the 1% level (0.0813), providing support for hypothesis H1. This result indicates that a central location enables firms to access more information and resources, thereby boosting innovation.
The baseline result for structural holes (CI) is shown in Column (3). The coefficient is 0.314 and is significant at the 1% level, indicating that occupying structural holes also fosters innovation. After adding control variables in Column (4), the coefficient on CI becomes 0.319 and remains significant at the 1% level, confirming hypothesis H2. This finding demonstrates a significant positive relationship between occupying more structural holes and achieving higher innovation performance.
4.3. Endogeneity Test
A firm’s location in the supply chain network may affect its innovation performance with a time lag. The resources and advantages gained from a network location often require time to be translated into innovative outcomes. Consequently, current innovation performance is likely a result of past network positioning rather than contemporaneous position. This lag creates a potential endogeneity issue in the model. To address this, we employed a two-stage least squares (2SLS) approach to estimate the model.
We used the two-period lagged values of the centrality and structural hole indices (DegreeIV and CIIV) as instrumental variables (IVs) for their contemporaneous counterparts (Degree and CI) in the first-stage regression. The first-stage regression results, presented in Table 5 (columns (1) and (3)), demonstrate that the instrumental variables are strongly correlated with the endogenous regressors. The coefficients are positive and statistically significant at the 1% level. Furthermore, the F-statistics for both tests are well above the standard threshold of 10, confirming that weak instruments are not a concern. We then proceed to the second-stage estimation. The results, shown in columns (2) and (4) of Table 5, indicate that after addressing endogeneity via 2SLS, the effects of both network centrality and structural holes on firm innovation performance remain positive and significant at the 1% level. This robust finding further validates our baseline results.
Table 5.
Endogeneity test.
4.4. Robustness Test
To ensure the robustness of the results, this research employs multiple robustness tests. The outcomes of these tests are shown in Table 6.
Table 6.
Regression results.
First, the measurement method of independent variables was replaced. This research refers to the research of Shi Jinyan [18]: the structural hole theory posits that nodes occupying these positions control information flow. Similarly, betweenness measures the extent to which a node acts as an intermediary or “bridge” on the paths between other nodes. Both concepts capture a node’s strategic control over information: high structural hole richness provides access to heterogeneous information, while high betweenness centrality indicates a pivotal location on necessary communication paths. Given this conceptual alignment, we use betweenness (multiplied by 100 for scale compatibility) as an alternative proxy for the structural hole (CI). The regression results are presented in Table 6. Column (1) shows the baseline result using CI, and column (2) shows the result using betweenness. The coefficient for betweenness is 0.145 and is significant at the 1% level. The positive and significant effect after changing the measurement confirms the robustness of the finding that structural holes promote innovation performance.
Second, the measurement method of the dependent variable was replaced. We remeasured innovation performance by replacing the dependent variable. Instead of using only invention patents, we used the sum of utility model and design patents (Pat1), applying the same logarithmic transformation (ln(1 + Pat1)). The results are shown in columns (3) and (4) of Table 6. When either network centrality or structural holes are the core explanatory variables, the coefficients remain positive and significant at the 1% level. These results, consistent in both sign and significance with our baseline findings, further support the main conclusions.
Third, we test robustness by adjusting the sample period to 2012–2022. The results, shown in columns (5) and (6) of Table 6, remain consistent with the baseline results, confirming that our findings are not sensitive to the chosen time window.
4.5. The Mediating Effect of Operational Risks
To examine the mediating effect of operational risks in the relationship between the centrality of the supply chain network and the innovation performance of enterprises, the mediating effect was gradually verified from column (1) to column (3), as shown in Table 7. Column (1) lists the baseline regression of supply chain network centrality on innovation performance. In Column (2), the dependent variable is operational risk (Risk). The coefficient on centrality is −0.223 and is significant at the 1% level. Since a lower Z-score indicates a higher risk of financial distress, this result shows that a more central network location increases the operational risk. In Column (3), operational risk (Risk) is added as a mediator to the regression model from Column (1). The coefficient is −0.0775 and is significant at the 1% level. Concurrently, the coefficient on network centrality decreases from 0.0813 in Column (1) to 0.0775 in Column (3), while remaining statistically significant. This result suggests that operational risk partially mediates the relationship between supply chain network centrality and innovation performance. Thus, Hypothesis H3a is supported.
Table 7.
The mediating effect test.
Similarly, Columns (4), (5), and (6) examine the mediating role of operational risk in the relationship between structural holes and innovation performance. Column (4) shows the baseline regression of structural holes (CI) on innovation performance (coef. = 0.319, significant). In Column (5), the dependent variable is operational risk (Risk). The coefficient is −0.940 and is significant at the 1% level. The results show a significant negative coefficient for CI. In column (6), the operation risk (Risk) is added to the regression model of the supply chain network structure hole and innovation performance. The results show that the coefficient of operation risk is 0.303 and is significant at the 1% level. Meanwhile, the coefficient value of the structural hole decreased from 0.319 in column (4) to 0.303 in column (6) but still maintained statistical significance. This indicates the existence of a mediating effect, and the hypothesis H3b is supported.
4.6. The Moderating Effect of Digital Transformation
To avoid multicollinearity, all variables involved in the interaction terms were mean-centered before testing the moderating effects. Furthermore, we accounted for the inherent time lag in digital transformation—where the full effects of such initiatives take time to materialize. Specifically, we employed a cross-lagged model that introduces a one-period lag for the digital transformation variable when examining its interplay with supply chain network location and innovation performance. The moderating role of digital transformation is presented in Table 8.
Table 8.
The moderation effect test of digital transformation.
Column (2) shows the results for the interaction between digital transformation (L.DCG) and network centrality (Degree). The coefficient on the interaction term (L.DCG∗Degree) is 0.00848 and is significant at the 1% level. This positive and significant coefficient indicates that digital transformation strengthens the positive relationship between network centrality and innovation performance, thus supporting Hypothesis H4a. Similarly, Column (4) presents the results for the interaction between digital transformation (L.DCG) and structural holes (CI). The coefficient on the interaction term (L.DCG∗CI) is 0.0416 and is also significant at the 1% level. This provides evidence that digital transformation also enhances the effect of structural holes on innovation performance, supporting Hypothesis H4b.
4.7. The Moderating Effect of Information Asymmetry
The results for the moderating effect of information asymmetry (ASY) are presented in Table 9. Column (2) shows the interaction between information asymmetry and network centrality. The coefficient on the interaction term (ASY∗Degree) is −0.123 and is significant at the 1% level. This negative and significant coefficient indicates that a higher degree of information asymmetry weakens the positive effect of network centrality on innovation performance. Thus, information asymmetry acts as a significant negative moderator, supporting Hypothesis H5a. Similarly, Column (4) shows the interaction between information asymmetry and structural holes. The coefficient on the interaction term (ASY∗CI) is −0.674 and is significant at the 1% level. This result demonstrates that information asymmetry also attenuates the positive relationship between structural holes and innovation performance, confirming Hypothesis H5b.
Table 9.
The moderation effect test of information asymmetry.
4.8. Regional Heterogeneity Test
Manufacturing firms are categorized into eastern, central, and western regions based on their location. Columns (1)–(3) in Table 10 reveal significant regional heterogeneity in the relationship between supply chain network centrality and innovation performance, a finding supported by significant Chow Test results. The results show a striking regional contrast. For firms in the eastern region, network centrality has a strong positive effect on innovation performance (coef. = 0.134, significant at 1%). In contrast, for firms in the central region, the effect is significantly negative (coef. = −0.0849, significant at 1%). The coefficient for the western region is positive but statistically insignificant (coef. = 0.00694). This heterogeneity is likely attributable to disparities in regional economic development, resource acquisition, and business environments. Firms in the more developed eastern region appear better equipped to leverage their central network positions to enhance innovation, possibly due to superior resources and a more advanced economic ecosystem. Conversely, firms in the central region may struggle to convert this specific advantage into innovation outcomes, potentially due to resource constraints.
Table 10.
Regional heterogeneity test.
A similar pattern of regional heterogeneity is observed for structural holes (CI) in Columns (4)–(6) of Table 10, again confirmed by significant Chow Test results. The impact is significant at the 1% level only in the eastern region (coef. = 0.532). The coefficients for the central (coef. = −0.269) and western (coef. = −0.0252) regions are not statistically significant, indicating no clear link between structural holes and innovation performance in these areas. This divergence can be explained by regional disparities in network maturity and institutional development. In the eastern region, mature supply chains, a concentration of talent and technology, and well-developed market institutions allow firms occupying structural holes to efficiently integrate diverse, cross-regional resources, significantly boosting innovation. In the central and western regions, however, fragmented industrial chains, a scarcity of innovative elements, and a less advanced institutional environment hinder firms from capitalizing on the informational and brokerage advantages of structural holes, resulting in an insignificant effect on innovation. This contrast underscores how regional economic structures and network characteristics shape the innovation mechanism.
5. Conclusions and Future Research Agenda
This research empirically investigates data from listed manufacturing enterprises from 2013 to 2023. From the perspective of social networks, it explores the influence and mechanism of the supply chain network location on the innovation performance of manufacturing enterprises. The main research conclusions are as follows:
First, supply chain network location has a significant positive impact on the innovation performance. Enterprises located in central network locations can more easily access diverse external resources and information, converting these into advantages that enhance innovation. Similarly, enterprises located in structural holes can leverage their brokerage position to control resource flows. This facilitated flow of information and resources is conducive to developing innovation activities and improving performance.
Second, operational risk plays a mediating role in the path between supply chain network location and innovation performance. A favorable network position helps firms mitigate operational risks, thereby freeing up resources that would otherwise be allocated to managing uncertainties. These resources can be reallocated to innovation activities, such as new product development, R&D, and product optimization. Firms occupying central locations and abundant structural holes assume higher levels of operational risk, which in turn exerts a significant impact on their innovation performance. They can better anticipate and plan for future business developments and market demands, allowing them to avoid risks proactively. This enhanced stability and predictability support long-term, strategic decision-making in the innovation process, enabling firms to operate more efficiently and focus on driving technological progress.
Third, information asymmetry plays a negative moderating role in the relationship between supply chain network location and innovation performance. It heightens the uncertainties and risks inherent in the innovation process. When information asymmetry is high, even centrally located or brokerage firms face greater uncertainty and risk due to insufficient or unverifiable information, which weakens the positive impact of network location on innovation. Furthermore, information asymmetry can erode trust among supply chain partners, undermining the stability and efficiency of collaborative relationships. Since innovation often requires sharing information, resources, and risks with partners, this distrust can reduce cooperation efficiency, potentially lead to partnership breakdowns, and ultimately terminate innovation projects, thereby lowering innovation performance.
Fourth, digital transformation positively moderates the relationship between supply chain network location and innovation performance. It enhances this relationship by providing numerous advantages for innovation. Digital tools help break down information barriers, expand information channels, and improve control over supply chain information, even for firms in peripheral network locations. For firms occupying central or brokerage locations, digital transformation enables more efficient integration of resources from diverse nodes, achieves optimal resource allocation, and further leverages their positional advantages. This allows for the precise allocation of previously scattered resources to innovation activities, thereby boosting innovation performance.
This research contributes to the existing literature but has several limitations. First, relying solely on data from listed companies results in an incomplete mapping of the supply chain network, potentially affecting the accurate identification of key nodes. Future studies could employ methods like surveys to incorporate data from non-listed firms and expand the research scope. Second, future research could investigate the impact of global supply chain networks on firm innovation, analyzing innovative behaviors and their drivers within international networks. This could inform strategies for optimizing supply chains to enhance innovation performance and the global competitiveness of domestic firms. Finally, this study does not deeply explore the evolution of dynamic supply chain networks. These networks are in constant flux, and their structural dynamics create endogenous risks. Factors such as shifts in alliance partnerships, market volatility, and technological disruption can destabilize the network, leading to accumulated uncertainties. Moreover, the network’s topological structure dictates unique risk transmission mechanisms, where local risks can propagate rapidly through multiple pathways, creating a networked risk contagion effect. Future research should focus on the long-term impact and evolutionary patterns of dynamic supply chain networks on firm innovation to help develop forward-looking innovation strategies.
Author Contributions
J.W.: formal analysis, methodology, writing—original draft, visualization; X.F.: supervision, writing—review and editing; writing—review and editing; X.F. and Y.G. contributed equally to this manuscript; Y.G. and X.F., conceptualization; X.F., methodology; Y.G., software; J.W. and X.F., validation; Y.G. and J.W., formal analysis; Y.G., resources; J.W., data curation; Y.G. and J.W., writing—original draft preparation; X.F., writing—review and editing; Y.G., visualization; X.F., funding acquisition. All authors have read and agreed to the published version of the manuscript.
Funding
This research was funded by the Key Project of the Special Fund for Basic Scientific Research Business Expenses of Provincial Undergraduate Colleges and Universities in Liaoning Province (Grant No. LJ112410152065), the Key Project of Liaoning Provincial Social Science Planning Fund in 2023: Research on the Construction of Business Environment for Private Enterprises in Liaoning Province (Grant No. L23AJY012), the General Project of Liaoning Province Economic and Social Development Research Project (Grant No. 20241slybkt-009) and the Key Project of the Dalian Social Sciences Association (Grant No. 2024dlskzd170).
Data Availability Statement
The dataset supporting this study cannot be made publicly available due to restrictions designed to protect participant privacy.
Conflicts of Interest
The authors declare no conflicts of interest.
Correction Statement
This article has been republished with a minor correction to the Data Availability Statement. This change does not affect the scientific content of the article.
Abbreviations
The following abbreviations are used in this manuscript:
| Pat | Innovation performance |
| Degree | Degree Centrality |
| CI | Structural Holes |
| Risk | Operational risk |
| ASY | Information Asymmetry |
| DCG | Digital Transformation |
| Loss | The profit or loss state of an enterprise |
| ATO | Total Asset Turnover |
| Cashflow | Net cash flow from operating activities |
| ListAge | The number of years since a firm’s IPO |
| Indep | Proportion of Independent Directors |
References
- Hagedoorn, J.; Cloodt, M. Measuring innovative performance: Is there an advantage in using multiple indicators? Res. Policy 2003, 32, 1365–1379. [Google Scholar] [CrossRef]
- Goodale, J.C.; Kuratko, D.F.; Hornsby, J.S.; Covin, J.G. Operations management and corporate entrepreneurship: The moderating effect of operations control on the antecedents of corporate entrepreneurial activity in relation to innovation performance. J. Oper. Manag. 2011, 29, 116–127. [Google Scholar] [CrossRef]
- Slack, N.; Brandon-Jones, A. Operations and Process Management: Principles and Practice for Strategic Impact; Pearson: London, UK, 2018. [Google Scholar]
- Sharma, A.; Adhikary, A.; Borah, S.B.; Pathak, S. Supply base concentration and firm innovation performance: A contingency study of supply base breadth, depth, dispersion, and collaboration. J. Bus. Res. 2024, 174, 114450. [Google Scholar] [CrossRef]
- Lv, K.F.; Yu, M.Y.; Ruan, Y.P. If You Listen to Both Sides, You will Be Wise—Supply Chain Network Centrality and Enterprise Risk-taking. Bus. Rev. 2023, 35, 266–280. [Google Scholar]
- Zhao, X.Y.; Yi, C.J.; Liao, J. Can the Supply Chain Network Location Improve the Level of Innovation Diversity of Enterprises? Chin. J. Manag. Sci. 2023, 31, 340–349. [Google Scholar]
- Zhu, J.H.; Ning, H.T.; You, J.R. The Influence of the Structural Features of Patent Cooperation Network on Enterprise Exploratory Innovation: A Case Study of the Aviation Equipment Manufacturing Enterprises. Sci. Technol. Manag. Res. 2022, 42, 128–135. [Google Scholar]
- Li, L.; Ding, L.T. Customer network embedding, knowledge base and enterprise innovation performance. Stat. Decis. 2023, 39, 183–188. [Google Scholar]
- Basit, A.; Wang, L.; Nazir, S.; Mehmood, S.; Hussain, I. Managing the COVID-19 pandemic: Enhancing sustainable supply chain performance through management innovation, information processing capability, business model innovation and knowledge management capability in Pakistan. Sustainability 2023, 15, 13538. [Google Scholar] [CrossRef]
- Yu, Y.; Liu, X.; Wu, Y.; Zhang, Y. The Impact of Supply Chain Network Structure on Green Innovation: The Mediating Role of Knowledge Absorption. Emerg. Mark. Financ. Trade 2024, 61, 1315–1341. [Google Scholar] [CrossRef]
- Chen, L.; Zhou, Z.B.; Huang, J. Location in Supply Network, Management Capability, and Firm Technological Innovation Based on Financing and Risk Perspectives. J. Syst. Sci. Math. Sci. 2021, 41, 3078–3092. [Google Scholar]
- Lu, D.Y. The Innovation Effect and the Mechanism Analysis of Supply Chain Network Structure: Theory and Empirical Evidence. J. Yunnan Univ. Financ. Econ. 2023, 39, 40–58. [Google Scholar] [CrossRef]
- Yu, M.Y.; Lv, K.F.; Ruan, Y.P. Supply chain network location and enterprise competitive position. Syst. Eng.-Theory Pract. 2022, 42, 1796–1810. [Google Scholar]
- Granovetter, M. Economic Action and Social Structure: The Problem of Embeddedness. Am. J. Sociol. 1985, 91, 481–510. [Google Scholar] [CrossRef]
- Pyka, A.; Bogner, K. Uzzi (1997): Social Structure and Competition in Interfirm Networks: The Paradox of Embeddedness. In Schlüsselwerke der Netzwerkforschung. Netzwerkforschung; Holzer, B., Stegbauer, C., Eds.; Springer: Wiesbaden, Germany, 2019. [Google Scholar] [CrossRef]
- Zaheer, A.; Bell, G.G. Benefiting from network position: Firm capabilities, structural holes, and performance. Strateg. Manag. J. 2005, 26, 809–825. [Google Scholar] [CrossRef]
- Burt, R.S. Structural holes and good ideas. Am. J. Sociol. 2004, 110, 349–399. [Google Scholar] [CrossRef]
- Shi, J.Y.; Yang, J.H.; Li, Y.X.; Zhang, Q.W. A Slight Move in One Part May Affect the Situation as a Whole: Supply Network Location, Operational Risk and Corporate Performance. China Ind. Econ. 2019, 9, 136–154. [Google Scholar]
- Krishnan, R.; Martin, X.; Noorderhaven, N.G. When does Trust Matter to Alliance Performance. Acad. Manag. J. 2006, 49, 894–917. [Google Scholar] [CrossRef]
- Cui, V.; Yang, H.; Vertinsky, I. Attacking Your Partners: Strategic Alliances and Competition Between Partners in Product Markets. Strateg. Manag. J. 2018, 39, 3116–3139. [Google Scholar] [CrossRef]
- Gulati, R. Alliances and Networks. Strateg. Manag. J. 1998, 19, 293–317. [Google Scholar] [CrossRef]
- Gulati, R.; Gargiulo, M. Where do Interorganizational Networks Come from. Am. J. Sociol. 1999, 104, 1439–1493. [Google Scholar] [CrossRef]
- Polidoro, F., Jr.; Ahuja, G.; Mitchell, W. When the Social Structure Overshadows Competitive Incentives: The Effects of Network Embeddedness on Joint Venture Dissolution. Acad. Manag. J. 2011, 54, 203–223. [Google Scholar] [CrossRef]
- Zhang, C.; Wang, W.Q. Empirical study on the impact of supply chain relationship changes on firms’ innovation performance—Based on the perspective of financing constraints. J. Lanzhou Univ. Financ. Econ. 2024, 1–26. Available online: https://link.cnki.net/urlid/62.1213.F.20241224.1653.004 (accessed on 10 August 2025).
- Ma, L.F.; Zhang, Q.; Wang, L.L. Boardroom Network Location and Investment Expenditure in Technological Innovation: Research on the Technology-Intensive Firms in A-Share. Sci. Sci. Manag. S. T. 2016, 37, 126–136. [Google Scholar]
- Ahuja, G. Collaboration networks, structural holes, and innovation: A longitudinal study. Adm. Sci. Q. 2000, 45, 425–455. [Google Scholar] [CrossRef]
- Li, G.H.; Zhao, S.; Wang, Y. Supply Network Position, Absorption Capacity and Firms’ Innovation Performance. Soft Sci. 2020, 34, 1–7. [Google Scholar]
- Zhang, J.P. Firms’ Closeness Centrality in Supply Chain Network and Innovation Performance: Evidence from Chinese Listed Firms. J. Hubei Univ. Arts Sci. 2022, 43, 34–42. [Google Scholar]
- Wang, S.H.; Wang, G.J.; Dong, M.K. Supply-chain Network Location, Digital Transformation, and Enterprise TFP. J. Shanghai Univ. Financ. Econ. 2024, 26, 3–17. [Google Scholar]
- Wang, S.Y.; Tang, J.J.; Liu, D. Research on the Diffusion Effect of Digital Transformation of Customer Enterprises in Supply Chain Networks and Its Mechanisms. China Bus. Mark. 2024, 38, 87–99. [Google Scholar]
- Zhang, Q.; Hu, H.Q.; Xue, M.; Chen, D. Supply Chain Network Structure, SME Innovativeness, and Supply Chain Financing Performance: A Moderated Mediating Effect. J. Syst. Manag. 2022, 34, 823–836. [Google Scholar]
- Yan, Y.; Guan, J.C. Social capital, exploitative and exploratory innovations: The mediating roles of ego-network dynamics. Technol. Forecast. Soc. Change 2024, 126, 244–258. [Google Scholar] [CrossRef]
- Xu, H.H.; Li, S.X.; Liu, J.Y.; Chu, S.Z. Study on the Influence of Enterprise Network Location on Innovation Performance from the Perspective of Cooperative Network: Taking the Pharmaceutical Manufacturing Industry as an Example. Sci. Technol. Manag. Res. 2023, 43, 143–154. [Google Scholar]
- Xu, Y.K.; Hou, K.X. Research on the Relationship Between Innovation Network Structure and Innovation Performance of S&T Enterprises. J. Ind. Technol. Econ. 2020, 39, 36–41. [Google Scholar]
- Bai, C.; Gao, W.; Sarkis, J. Operational Risks and Firm Market Performance: Evidence from China. Decis. Sci. 2021, 52, 920–951. [Google Scholar] [CrossRef]
- Rezapour, S.; Srinivasan, R.; Tew, J.; Allen, J.K.; Mistree, F. Correlation between strategic and operational risk mitigation strategies in supply networks. Int. J. Prod. Econ. 2018, 201, 225–248. [Google Scholar] [CrossRef]
- Wang, Y.G.; Liu, H. Network Centrality and Firm Performance—Contingent Roles of Innovative Ties, Political Ties and Technological Uncertainty. Res. Econ. Manag. 2019, 40, 113–127. [Google Scholar] [CrossRef]
- Liu, S.; Luo, J.Y.; Wu, L. Supply Chain Network Location and Enterprise Production Efficiency: Perspective of Social Network Analysis. Ind. Econ. Rev. 2024, 15, 21–44. [Google Scholar]
- Chen, W.; Fan, Y.Z. Firm Perception of Supply Chain Risk and Stability of Cooperation. J. Manag. World 2024, 40, 209–228. [Google Scholar]
- Xu, M.; Yu, D.D. An empirical analysis on supply chain risk contagion effects. J. Xidian Univ. (Soc. Sci. Ed.) 2016, 26, 13–21. [Google Scholar]
- Kahneman, D.; Tversky, A. Prospect Theory: An Analysis of Decision under Risk. Econometrica 1979, 47, 263–291. [Google Scholar] [CrossRef]
- Shao, P.; Zhang, Y.Y.; Ma, B. Integration of Resources or Competition? Influence Mechanism of Competition and Cooperation Network Characteristics on Enterprise Green Innovation. Innov. Sci. Technol. 2022, 22, 70–82. [Google Scholar]
- Wang, X.Y. Research on the impact of performance expectation gaps on the innovation behavior of manufacturing enterprises: Test based on different expected reference levels. Ind. Econ. Res. 2021, 6, 129–142. [Google Scholar]
- Liu, Q.L.; Zhang, Y.; Lei, Y.Y.; Chen, G.J. Research on process, logic and implementation mechanism of digital enabling enterprise innovation. Stud. Sci. Sci. 2022, 40, 150–159. [Google Scholar]
- Yang, T.T.; Xu, B.T. Green innovation in manufacturing enterprises and digital transformation. Econ. Anal. Policy 2025, 85, 571–578. [Google Scholar]
- Gilsing, V.; Nooteboom, B.; Van, H.W. Network Embeddedness and the Exploration of Novel Technologies: Technological Distance, Betweenness Centrality and Density. Res. Policy 2008, 37, 1717–1731. [Google Scholar] [CrossRef]
- Chen, Y.H.; Zhang, Z.G.; Huang, L. Exploring the Mechanisms and Paths of Manufacturing Digital Enablement on Business Model Innovation. Chin. J. Manag. 2021, 18, 731–740. [Google Scholar] [CrossRef] [PubMed]
- Jian, G.Q.; Guo, Y.Y. Can Supply Chain Network Locations of SRDI Enterprises Boost Stock Returns? Financ. Theory Pract. 2024, 9, 107–118. [Google Scholar]
- Yang, Z.N.; Hou, Y.F.; Li, D.H.; Wu, C. The Balancing Effect of Open Innovation Networks in the “Dual Circulation” of Chinese Enterprises: An Investigation Based on Digital Empowerment and Organizational Flexibility. J. Manag. World 2021, 2022, 194–205. [Google Scholar] [CrossRef]
- Gao, J.; Zhang, W.; Guan, T.; Feng, Q.; Mardani, A. The effect of manufacturing agent heterogeneity on enterprise innovation performance and competitive advantage in the era of digital transformation. J. Bus. Res. 2023, 155, 113387. [Google Scholar] [CrossRef]
- Alduais, F.; Nashat, A.A.; Airout, R. The moderating effect of corporate governance on corporate social responsibility and information asymmetry: An empirical study of chinese listed companies. Economies 2022, 10, 280. [Google Scholar] [CrossRef]
- Nel, G.F.; Smit, E.; Brummer, L.M. The link between internet investor relations and information asymmetry. S. Afr. J. Econ. Manag. Sci. 2018, 21, 1–10. [Google Scholar] [CrossRef]
- Zhao, M.; Wang, S.; Xia, T. The social welfare effect of e-commerce product reputation information asymmetry from the perspective of network externality. PLoS ONE 2025, 20, e0313852. [Google Scholar] [CrossRef]
- Minghui, N.; Wenbo, B.; Xudong, Q.; Fengmin, Y. CSR input and recycling decisions for closed-loop supply chain with asymmetric demand information. Systems 2025, 13, 432. [Google Scholar] [CrossRef]
- Luo, D.L.; Luo, J.; Miao, L.Q. Shareholder Relationship Network, Information Transparency and the Dynamic Adjustment of Enterprise Capital Structure. Nankai Bus. Rev. 2024, 1–25. Available online: https://link.cnki.net/urlid/12.1288.f.20240912.1141.002 (accessed on 10 August 2025).
- Li, C.T.; Yan, X.W.; Song, M.; Yang, W. Fintech and Corporate Innovation—Evidence from Chinese NEEQ-Listed Companies. China Ind. Econ. 2020, 1, 81–98. [Google Scholar]
- Wu, X.H.; Guo, X.D.; Qiao, Z. Institutional Investor Network Centrality and Stock Market Information Efficiency. Bus. Manag. J. 2020, 42, 153–171. [Google Scholar]
- Chen, S.K.; Zhao, B. R,D Investment, Venture Capital and Financial Constraints: Evidence from the Listed Manufacturers in China. Manag. Rev. 2019, 31, 110–123. [Google Scholar]
- Zhen, H.X.; Wang, X.; Fang, H.X. Administrative Protection of Intellectual Property Rights and Corporate Digital Transformation. Econ. Res. J. 2023, 58, 62–79. [Google Scholar]
- Burt, R.S. Structural Holes: The Social Structure of Competition; Harvard University Press: Cambridge, MA, USA, 1992. [Google Scholar]


Disclaimer/Publisher’s Note: The statements, opinions and data contained in all publications are solely those of the individual author(s) and contributor(s) and not of MDPI and/or the editor(s). MDPI and/or the editor(s) disclaim responsibility for any injury to people or property resulting from any ideas, methods, instructions or products referred to in the content. |
© 2025 by the authors. Licensee MDPI, Basel, Switzerland. This article is an open access article distributed under the terms and conditions of the Creative Commons Attribution (CC BY) license (https://creativecommons.org/licenses/by/4.0/).