Abstract
While the corporate adoption of artificial intelligence (AI) is accelerating, its environmental consequences remain insufficiently understood, particularly in absolute firm-level energy consumption. The main objective of this study is to empirically determine the causal impact of AI adoption on absolute firm-level energy consumption in Chinese publicly listed companies, with a particular focus on the mediating role of green innovation and the moderating role of digital capabilities. This study provides the first large-scale micro-level evidence on how AI adoption shapes corporate energy use, drawing on panel data from Chinese non-financial listed firms during 2011–2022. We construct a novel AI adoption index via Word2Vec-based textual analysis of annual reports and estimate its impact using firm fixed effects, instrumental variables, mediation models, and multiple robustness checks. Results show that AI adoption significantly reduces total energy consumption, with a 1% increase in AI intensity associated with an estimated 0.48% decrease in energy use. Green innovation emerges as a key mediating channel, while the energy-saving benefits are amplified in firms with advanced digital transformation and IT-oriented executive teams. Heterogeneity analyses indicate more substantial effects among large firms, private enterprises, non-energy-intensive sectors, and firms in digitally lagging regions, suggesting capability-driven and context-dependent dynamics. This study advances the literature on digital transformation and corporate sustainability by uncovering the mechanisms and boundary conditions of AI’s environmental impact and offers actionable insights for aligning AI investments with carbon reduction targets and industrial upgrading in emerging economies.
1. Introduction
Over the past decade, artificial intelligence (AI) has rapidly permeated corporate operations, transforming how firms automate processes, analyze information, and make strategic decisions [1,2,3]. While widely celebrated for its productivity and cost-saving potential, AI’s environmental implications remain contentious. On one hand, AI-enabled optimization can reduce waste, streamline production, and lower resource intensity. Conversely, large-scale deployment of AI infrastructure, such as high-performance computing, data centers, and advanced connectivity, has been associated with surging electricity and cooling demands [4,5]. Whether AI mitigates or exacerbates corporate energy use is thus an open empirical question with profound policy relevance.
Existing studies predominantly rely on energy intensity and energy use per output unit to assess environmental performance [6]. However, such relative measures risk obscuring the absolute environmental burden, particularly under rebound effects where efficiency gains induce higher total consumption. For decarbonization policy, total energy consumption offers a more direct and actionable indicator, capturing operational efficiency and overall environmental impact [7]. Yet, firm-level evidence on how AI adoption influences absolute energy use is scarce, mainly due to disclosure limitations and measurement challenges. This absence of high-resolution, micro-level analysis leaves a critical blind spot in both the AI and sustainability literatures.
China offers a rare empirical setting to address this gap. Listed firms increasingly disclose multi-source energy use data, spanning electricity, coal, natural gas, gasoline, diesel, water, and centralized heating, across annual reports, CSR/ESG disclosures, and sustainability appendices. Using official national coefficients, these can be converted into standardized units (tons of coal equivalent, tce), enabling consistent measurement across firms and years. Figure 1 illustrates the evolution of aggregate and firm-level energy consumption among Chinese A-share listed companies from 2012 to 2022. Despite continuous technological upgrading, absolute energy demand has exhibited a persistent upward trajectory, underscoring the need to assess AI’s impact in absolute, not just intensity-adjusted, terms.

Figure 1.
Aggregate and Firm-Level Energy Consumption Trends of Chinese Listed Firms (2012–2022). Source: Authors’ calculation based on firm-level energy use data from annual reports of Chinese A-share listed companies, converted to ktce/Mtce using national energy conversion coefficients published by the National Bureau of Statistics of China.
We conceptualize AI adoption as a green-enabling dynamic capability that reconfigures operational processes and fosters environmentally sustainable practices. Drawing on the resource-based view and dynamic capability theory, we argue that AI can reduce total energy use directly via process optimization and indirectly via green innovation. Empirically, we develop a novel AI adoption index through a Word2Vec-enhanced keyword dictionary applied to annual reports and Management Discussion and Analysis (MD&A) sections, and compile firm-level energy consumption data from multiple public sources, harmonized to tce. We employ firm- and year-fixed effects models, instrumental variable estimation, mediation analysis, and placebo tests to identify the causal impact of AI adoption on energy consumption. The primary objective of this study is to empirically identify whether and how AI adoption affects absolute firm-level energy consumption in Chinese listed companies, explicitly considering green innovation as a mediator and internal digital capabilities as moderators.
This study makes three contributions: (1) It offers the first micro-level causal identification of AI’s effect on firms’ total energy consumption, moving beyond relative efficiency measures to provide policy-relevant insights for decarbonization strategies. (2) It identifies and empirically validates green innovation as a key mechanism, reframing AI from a productivity enhancer to a sustainability-enabling capability. (3) It advances measurement methodology by integrating multi-source corporate energy data with NLP-based AI adoption metrics, enabling high-resolution analysis in an emerging market context.
The remainder of the research follows: Section 2 reviews the literature and develops hypotheses. Section 3 describes the data and methodology. Section 4 presents the main results and robustness checks. Section 5 explores mechanisms and heterogeneity. Section 6 concludes with theoretical and practical implications.
2. Literature Review
2.1. Theoretical Foundations
The relationship between artificial intelligence (AI) adoption and corporate energy consumption, the total amount of energy a firm uses within a given period, is grounded in two complementary theoretical perspectives: the resource-based view (RBV) and dynamic capability theory. These frameworks jointly explain how firms acquire, deploy, and reconfigure digital resources to achieve sustainability objectives under environmental uncertainty and regulatory pressure [8,9].
From the RBV perspective, sustained competitive advantage derives from resources that are valuable, rare, inimitable, and non-substitutable (VRIN). AI technologies, machine learning, predictive analytics, and intelligent automation fit these criteria by enabling advanced decision-making, operational optimization, and adaptive energy management [10]. Unlike energy intensity (energy per unit of output), which reflects relative efficiency, energy consumption measures the absolute environmental burden of a firm’s operations, capturing both scale and efficiency effects. This distinction is critical in sustainability analysis: even if energy intensity declines, total consumption may rise due to the rebound effect [11], undermining carbon mitigation goals.
The RBV suggests that AI-enabled systems can improve real-time monitoring, reduce redundancies, and minimize waste, thus lowering absolute energy consumption [12]. However, the RBV alone provides a static view of resource possession and does not fully capture adaptive responses to evolving environmental mandates. Dynamic capability theory [13] complements this by emphasizing how firms sense, seize, and reconfigure resources in response to environmental changes. From this perspective, AI serves as a valuable resource and a transformative enabler of environmental sensing, predictive analytics, and real-time process adjustment [14], key aspects of environmental dynamic capability.
Theoretically, the net impact of AI on energy consumption is ambiguous. While AI can reduce consumption by streamlining operations, its deployment may also raise total energy demand via energy-intensive digital infrastructure such as data centers [15]. This ambiguity motivates investigating the mechanisms and organizational contingencies determining whether AI adoption results in net energy savings. By integrating RBV and dynamic capability theory, this study frames AI adoption as a dual-purpose strategic lever: enabling immediate reductions in total energy use through digital optimization (RBV) and facilitating longer-term sustainability transitions via adaptive reconfiguration (dynamic capability theory).
2.2. AI Adoption and Corporate Energy Consumption
In response to intensifying climate challenges and tightening environmental regulations, firms worldwide are undergoing digital transformation to align economic performance with sustainability imperatives [16]. Among digital technologies, AI stands out for its capacity to enable intelligent, adaptive, and resource-efficient production and operations management. While much of the literature documents AI’s productivity and economic gains [17,18], its environmental consequences remain underexplored, especially in terms of absolute corporate energy consumption.
Most prior studies rely on energy intensity as a proxy for environmental performance [19]. While useful for benchmarking efficiency, intensity-based measures may obscure absolute energy demand, particularly when efficiency gains lead to expanded production (the rebound effect) [20]. For policy-making, especially in the context of China’s “dual-carbon” strategy, absolute energy consumption offers a more direct and policy-relevant measure. Yet, firm-level energy consumption data in many countries are unavailable or inconsistent, limiting empirical research. China presents a unique opportunity: listed firms are increasingly required to disclose multi-source energy use data (e.g., electricity, coal, natural gas, oil products, steam, and heating) in annual reports, CSR/ESG statements, and sustainability appendices. These can be standardized into tons of coal equivalent (tce) using official conversion coefficients, enabling consistent cross-firm and longitudinal analysis.
Existing studies often aggregate AI with broader digital technologies (e.g., Industry 4.0, automation, IT infrastructure), obscuring AI’s unique cognitive and adaptive features [21,22]. Moreover, much of the evidence is based on macro-level or industry-level data, neglecting firm-level heterogeneity, adoption mechanisms, and contextual moderators. Moreover, much of the evidence is based on macro-level or industry-level data, neglecting firm-level heterogeneity, adoption mechanisms, and contextual moderators. For example, recent evidence links green finance to AI-driven improvements in energy efficiency at the urban level [23], yet such studies remain largely aggregate in scope. Critical methodological issues, such as endogeneity, reverse causality, and selection bias, are rarely addressed. This leaves a crucial empirical gap: Does AI adoption causally reduce firms’ total energy consumption, and under what conditions is this effect amplified or diminished?
To address this, we apply the RBV and dynamic capability theory. The RBV frames AI technologies, predictive analytics, intelligent control systems, and machine learning platforms, as VRIN resources that enable precise monitoring, optimization, and waste reduction [8,10]. Dynamic capability theory extends this view by highlighting AI’s role in allowing firms to sense environmental signals, seize sustainability opportunities, and reconfigure energy-intensive routines in real time [13]. In China’s carbon neutrality policy landscape, AI-driven operational reconfiguration exemplifies environmental dynamic capability, allowing firms to simultaneously balance economic and environmental objectives.
Methodologically, we contribute by constructing a novel text-based AI adoption measure from annual reports using a Word2Vec-enhanced dictionary [24,25] and compiling standardized firm-level energy consumption data from multi-source disclosures. Combined with fixed-effects panel regression and advanced identification strategies, this dataset enables micro-level causal identification of AI’s impact on energy consumption, moving beyond the correlational evidence and relative metrics prevalent in prior research. We formally hypothesize:
H1.
Artificial intelligence (AI) adoption is negatively associated with firm-level energy consumption.
2.3. Green Innovation as a Mediating Mechanism
While AI may directly reduce energy consumption through real-time monitoring and optimization, its most profound sustainability effects are likely realized via green innovation [26]. Green innovation refers to developing environmentally oriented technologies, processes, and products that lower ecological footprints while sustaining or enhancing competitiveness [27]. In the digital sustainability literature, AI is increasingly recognized as a catalyst for eco-innovation, enabling advanced sensing, process automation, and the cross-functional integration of sustainability knowledge [28,29]. Yet, the role of green innovation as a causal conduit between AI adoption and reduced absolute energy consumption, as opposed to relative efficiency gains, remains theoretically posited but empirically under-validated.
The logic aligns with the Porter Hypothesis, which posits that environmental challenges spur innovation, improving both environmental and economic outcomes [30]. Within this framework, AI functions not merely as a cost-reduction tool, but as a strategic enabler that empowers firms to design cleaner technologies, re-engineer processes, and proactively adapt to sustainability constraints. Specifically, AI facilitates real-time energy data collection, anomaly detection, scenario simulation for energy demand, and design optimization—capabilities that can substantially expand a firm’s innovation frontier toward low-energy solutions.
From a dynamic capability perspective [9], AI adoption enhances a firm’s ability to sense ecological risks, seize green innovation opportunities, and reconfigure R&D routines toward sustainable objectives. For example, AI-enabled simulation can replace energy-intensive prototype testing; machine learning can extract environmental trends from patent and customer data; and large language models can parse regulatory texts to identify compliance pathways [31]. These functions reduce the cost, uncertainty, and lead time in developing green innovations, thereby increasing the agility and precision of environmental R&D investments.
While emerging evidence suggests this mechanism, rigorous empirical validation is rare. Li et al. (2024) find that digital technology adoption increases green patenting among Chinese firms [32], and Wei et al. (2024) report that intelligent manufacturing boosts investment in environmentally friendly products [33]. Xu et al. (2023) observe that digital transformation enhances responsiveness to regulatory complexity, reinforcing eco-innovation orientation [29]. However, most existing work treats green innovation as an outcome rather than a formal mediator, and few apply multi-stage regressions or bootstrapped indirect-effect models to establish a transparent causal chain from AI adoption to environmental performance outcomes such as energy consumption.
Another limitation is the treatment of digital transformation as a “black box”, conflating AI with broader IT or ERP systems. This risks underestimating AI’s distinctive cognitive, adaptive, and learning capacities, particularly relevant features for driving innovation under sustainability constraints [17]. Moreover, many studies rely on input-oriented indicators (e.g., environmental R&D expenditure), which may not fully capture realized innovation. In contrast, output-based measures, such as green patent counts classified under recognized IPC categories, offer more objective and replicable proxies [34].
This study explicitly models green innovation as a mediating mechanism in the AI-energy consumption nexus to bridge these gaps. We develop a theoretically coherent and empirically testable framework by integrating the RBV, dynamic capability theory, and the Porter Hypothesis. AI adoption enhances firms’ capacity for green innovation, reducing total energy consumption through cleaner technologies, optimized processes, and more energy-efficient production strategies. This leads to the hypothesis:
H2.
Green innovation mediates the relationship between AI adoption and energy consumption.
2.4. The Moderating Role of Internal Digital Capabilities
While AI adoption holds substantial potential to lower energy consumption, its effectiveness depends on firms’ internal capabilities. In particular, digital capabilities—both structural and cognitive—may moderate how effectively AI translates into tangible energy savings. We focus on two moderators: (1) digital transformation intensity, reflecting the maturity of technological infrastructure, and (2) top executive IT background, reflecting managerial cognitive readiness. These factors shape a firm’s absorptive capacity to harness AI for sustainability.
Structurally, firms with high digital transformation intensity are more likely to possess complementary technologies, such as IoT, cloud computing, and enterprise-wide data platforms, that facilitate seamless AI integration [35]. Such infrastructure supports AI-driven energy monitoring, predictive analytics, and cross-functional optimization. In contrast, low digital maturity can result in fragmented data systems, integration delays, and reduced responsiveness, weakening AI’s potential to reduce absolute energy consumption. While prior studies show that digital maturity amplifies AI’s benefits in logistics and productivity [36], its moderating effect on environmental outcomes remains largely unexplored.
Cognitively, managerial readiness is equally critical. According to upper echelons theory [37], executives’ professional and educational backgrounds shape how they perceive and implement emerging technologies. Leaders with IT-related backgrounds are more likely to understand AI’s technical affordances, anticipate implementation challenges, and align AI initiatives with long-term sustainability goals [38]. They can foster cross-departmental collaboration and a data-driven energy management culture. Although prior research has linked executive digital expertise to innovation outcomes [39], few studies assess its role in enabling AI’s energy-saving potential.
The technology–organization–environment (TOE) framework [40] offers a unifying lens for these contingencies: technological outcomes depend not just on the technology, but also organizational enablers. In this view, AI adoption alone is insufficient; firms need both the structural infrastructure and the cognitive leadership to integrate AI into energy management. High digital intensity and digitally literate executives enhance the assimilation of AI into operational processes, while firms lacking these may fail to achieve meaningful energy reductions despite similar adoption levels.
Yet, empirical tests of these moderating effects are scarce. Most AI-sustainability studies assume uniform implementation capacity, overlooking variance in digital preparedness—especially pronounced in emerging economies. Recent evidence contradicts this assumption: Wang et al. (2022) show that digital exposure strengthens responsiveness to environmental policy [41], and Muawanah et al. (2024) find that managerial digital literacy magnifies AI’s innovation effects [42]. However, few apply formal interaction models to test whether digital capabilities condition AI’s impact on energy consumption. To address this, we propose:
H3.
The negative effect of AI adoption on energy consumption is stronger for firms with higher digital transformation intensity.
H4.
The negative effect of AI adoption on energy consumption is more substantial for firms with IT-oriented top executives.
The reviewed literature suggests a conceptual framework in which AI adoption affects firm-level energy consumption directly and indirectly through green innovation, and where the strength of this relationship depends on internal digital capabilities. Figure 2 summarizes these hypothesized relationships and informs our empirical design.
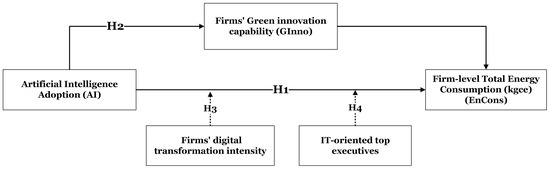
Figure 2.
Conceptual Framework and Research Hypotheses.
3. Methodology
3.1. Research Design
This study employs a multi-stage empirical strategy to investigate how the adoption of artificial intelligence (AI) affects firm-level energy consumption in Chinese listed companies. The analysis explicitly examines (a) the direct effect of AI adoption on total energy consumption, (b) the mediating mechanism of green innovation, and (c) the moderating influence of internal digital capabilities. The methodological framework integrates theory-driven hypotheses, comprehensive variable construction, and advanced panel econometric techniques. Figure 3 presents an overview of the conceptual and empirical roadmap, including research questions, variable operationalization, and identification strategies.
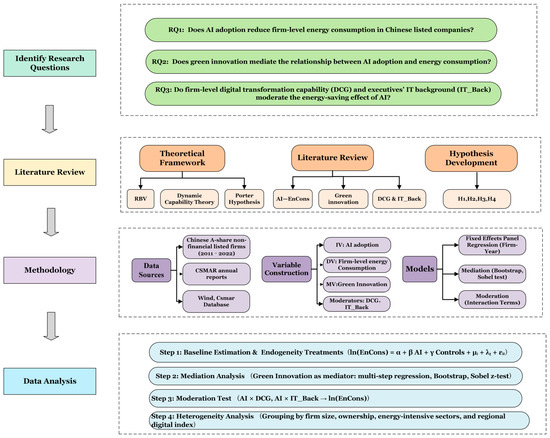
Figure 3.
Research Framework and Technical Roadmap. (This figure illustrates the sequential stages of the study, including research questions, theoretical development, empirical model specification, and analytical strategy for identification and validation.).
3.2. Data and Variable Construction
3.2.1. Sample and Data Sources
The empirical analysis is based on an unbalanced panel dataset of Chinese A-share non-financial listed companies, the sample covers 2011–2022 due to consistent data availability, as post-2022 firm-level AI and energy disclosures are not yet fully released. The sample selection is guided by industry relevance, data availability, and AI observability. Financial firms (banks and insurers) are excluded due to their distinct business models and environmental metrics. Companies with missing key financial data, invalid annual report texts, or insufficient AI disclosure are also omitted. The final sample includes more than 3800 firms and over 36,000 firm-year observations. To gauge disclosure-driven selection, we compare the universe of non-financial A-share firm-years (2011–2022) with AI-measurable observations. Out of 36,955 potential firm-years, 36,353 have valid AI text measures; the disclosure-related attrition is 602 firm-years (≈1.63%), indicating that AI non-disclosure is limited in magnitude. Firm-level financial data, including size, leverage, profitability, growth, cash flow, and firm age, are collected from the CSMAR database. Data on energy consumption are meticulously extracted from company annual reports, CSR/ESG disclosures, and, where available, company websites and local environmental bureau micro-databases. Regional digital economy indices are sourced from official statistical bulletins.
3.2.2. Energy Consumption Calculation
Total energy consumption is constructed by aggregating multiple primary energy sources, following national standards and best practices. Energy sources include water, electricity, raw coal, natural gas, gasoline, diesel, and district heating. Units: All quantities are reported in 10,000 units (e.g., 10,000 kWh, 10,000 metric tons) to align with disclosure practices. Each source is converted to tons of standard coal equivalent (tce) using official national conversion coefficients, as shown in Table 1:

Table 1.
Official Conversion Coefficients for Energy Sources to Tons of Standard Coal Equivalent (tce).
The total annual energy consumption for each firm is calculated as:
The main dependent variable, energy consumption (EnCons), is the sum of all converted sources (tce), log-transformed for regression analyses: .
3.2.3. AI Adoption Intensity
AI adoption intensity (AI) is measured through a multi-stage natural language processing (NLP) pipeline applied to the full text of annual reports [43], as follows: (1) Text Extraction: Obtain the full text of annual reports, including Management Discussion & Analysis and CSR sections, from WIND and CSMAR databases. (2) Preprocessing: Remove tables, figures, and non-standard formatting; segment text into sentences. (3) Keyword Matching: Apply a curated AI keyword dictionary (see Appendix A.3 Table A3 for the full English list), covering terms such as “artificial intelligence”, “machine learning”, “deep learning”, “neural network”, and “intelligent algorithm”. Keyword matching is enhanced using Word2Vec models to capture semantic variations. (4) Frequency Normalization: Count the total frequency of AI-related keywords per firm-year and normalize by report length (e.g., per 10,000 words). (5) Log Transformation: Compute the natural logarithm of the normalized frequency to produce the final AI intensity indicator: . (6) Transparency: The full keyword list and coding scripts are provided in the Appendix A.3 Table A3 for reproducibility.
Figure 4 visualizes this measurement pipeline, showing the sequential stages from the raw annual report corpus to the final AI_intensity indicator. The diagram highlights key NLP procedures, text preprocessing, sentence extraction, AI keyword construction with embedding enhancement, and term frequency normalization, ensuring clarity and transparency in transforming textual data into a standardized firm-year AI adoption measure.
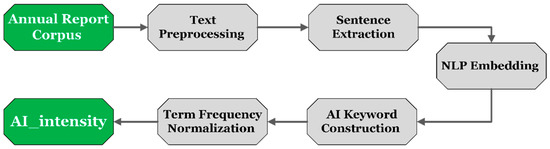
Figure 4.
Construction Process of the AI_Intensity Variable from Annual Report Textual Data.
To ensure the robustness of our AI-technology measure, we implement a comprehensive set of validation tests, the details of which are reported in Appendix B. Validity Tests of the AI-Technology Measure. Specifically, we benchmark the word-frequency–based proxy against authoritative external lists of AI-leading firms (e.g., CCID Top 100 AI enterprises and iFinD AI concept stocks), and we also compare it with alternative proxies such as AI-related patents and job postings. In addition, we conduct cross-checks with expert evaluations of randomly selected firms. Across these tests, firms with higher levels of AI engagement consistently show significantly greater AI-related textual frequencies, which confirms both the reliability and construct validity of our measure.
3.2.4. Other Variables
Green Innovation (GInno): Natural log of the number of green inventions and utility model patents per firm-year, classified using IPC Green Technology codes (WIPO/OECD).
Digital Transformation Intensity (DCG): Measured by the frequency (log-transformed) of 76 digital economy-related keywords (e.g., “digitalization”, “cloud computing”, “big data”) in firm reports. This index reflects a firm’s engagement in digital transformation and infrastructure building.
Executive IT Background (IT_Back): The proportion of top executives and board members with formal education in IT-related majors (e.g., computer science, information systems) or prior experience in digital transformation, ERP, or tech-related industries. Data are collected manually and coded per individual year.
Controls: Following prior literature, we include a comprehensive set of firm-level controls: size (Size), profitability (ROA), leverage (leverage), growth (Growth), firm age (FirmAge), and cash flow intensity (Cashflow).
All models include year-fixed effects and, where specified, firm-fixed effects to control for time-specific shocks and unobserved heterogeneity. Table 2 summarizes the definitions, measurement approaches, and data sources of all key variables used in this study, including the independent, dependent, mediating, and moderating constructions.
Table 2.
Variable Definitions and Measurement.
3.3. Empirical Model Specification and Identification Strategy
We employ panel data regression models that account for firm-level heterogeneity and temporal variation to test the proposed hypotheses empirically. The analysis proceeds in three stages: (1) estimation of the main effect of AI adoption on energy consumption (H1); (2) examination of the mediating role of green innovation (H2); and (3) evaluation of the moderating effects introduced by internal digital capabilities (H3 and H4). All models include year and firm fixed effects, and standard errors are clustered at the firm level to account for autocorrelation and heteroskedasticity.
3.3.1. Main Effect (H1)
The primary relationship of interest is whether AI adoption is associated with reduced energy consumption at the firm level. Our baseline fixed-effects model is specified as follows:
where, is the natural logarithm of total energy consumption for firm in year , is the AI adoption intensity (independent variable). is a vector of control variables, including firm size, profitability, leverage, growth, board size, cash flow intensity, and firm age. and represent firm and year-fixed effects, respectively. is the idiosyncratic error term. A negative and statistically significant coefficient on supports H1, indicating that AI adoption contributes to improvements in energy consumption.
3.3.2. Mediation Analysis (H2)
To test the mediating role of green innovation, we follow a multi-step procedure consistent with Baron and Kenny (1986) [45], complemented by bootstrapped indirect effects and Sobel tests. The two-step approach is:
First-stage:
Second-stage:
Partial or full mediation is confirmed if and are significant, the coefficient is reduced in magnitude compared to the main effect model, the indirect effect is statistically significant based on bootstrapping or Sobel statistics.
3.3.3. Moderation Analysis (H3, H4)
To examine the conditional nature of the AI–energy relationship, Hypotheses H3 and H4 introduce moderating variables capturing internal digital capability: (1) digital transformation intensity () and (2) managerial IT background (. The moderation model is:
The coefficient represents the interaction effect. A significantly negative implies that AI adoption is more effective in reducing energy use when internal digital capabilities are higher. This interaction-based approach follows the logic of contingency theory, in which organizational outcomes depend on the organization’s internal readiness.
3.3.4. Comprehensive Endogeneity Controls
To enhance the causal identification and address potential endogeneity concerns, such as reverse causality, omitted variable bias, or selection into AI adoption, we employ four complementary strategies:
- (1)
- Instrumental Variable (IV) Approach: Use lagged AI adoption and industry-average AI (excluding the focal firm) as instruments; test for relevance (first-stage F-statistic) and overidentification (Hansen J).
- (2)
- Control Function Method: First, regress AI on instruments, then include the residual in the main model to correct for endogeneity in flexible panel settings [46].
- (3)
- Placebo (Falsification)Test: Randomly assign 50% of the sample as “pseudo-AI adopters” to ensure observed effects are not due to spurious correlations or unobserved shocks.
- (4)
- Propensity Score Matching Difference-in-Differences (PSM-DID): Construct treatment and control groups using quasi-experimental settings, such as regional AI pilot zones or smart manufacturing policies. Employ matching and DID estimation to enhance comparability and infer causality.
These strategies, integrated with a robust fixed-effects panel framework, allow us to isolate the effect of AI adoption on firm energy consumption, while minimizing bias from confounding factors. Figure 5 below summarizes the empirical model structure, fixed-effects approach, and identification toolkit deployed in this study. This comprehensive approach ensures that our findings reflect the actual impact of AI adoption on corporate energy consumption, while addressing key empirical challenges highlighted in the literature.

Figure 5.
Empirical Model and Identification Strategy.
4. Empirical Results
4.1. Descriptive Statistics, Correlation Matrix, and Multicollinearity Diagnostics
Table 3 reports the descriptive statistics for the key variables. The dependent variable—firm-level energy consumption (EnCons)—is measured in kilograms of coal equivalent (kgce), following national energy statistical conventions and allowing cross-firm comparability in absolute physical units. The mean EnCons is 1512 kgce, with a standard deviation of 300.6, indicating substantial heterogeneity in absolute energy use across firms. Unlike the relative measure of energy intensity used in prior studies, this absolute consumption metric captures the total environmental burden of firm operations, which is directly relevant for carbon neutrality targets and avoids the masking effects of output expansion or rebound effects.
Table 3.
Descriptive Statistics.
The AI adoption index averages 0.837, but the median is 0, revealing a pronounced skew: while many firms report no AI-related disclosure, a smaller subset exhibits intensive AI engagement. This heterogeneity is typical of emerging technologies and foreshadows the need for subgroup and heterogeneity analyses in later sections. Firm size (Size), proxied by the log of total assets, centers at 22.17, indicating a sample composed mainly of large listed enterprises. Financial indicators—return on assets (ROA) at 4.25% and leverage (Lev) at 41.3%—align with sectoral norms, while growth rate (Growth), board size (Board), and firm age (FirmAge) exhibit variation consistent with the composition of China’s A-share market. The distribution of EnCons shows no extreme outliers, confirming that the dependent variable is statistically well-behaved for regression analysis.
Table 4 presents the Pearson correlation coefficients. As expected, AI is negatively correlated with ln (EnCons) (r = −0.281, p < 0.01), providing preliminary support for our central hypothesis that AI deployment reduces absolute energy consumption. Firm size and firm age are positively associated with EnCons, consistent with the idea that larger and older firms typically operate at higher production scales and thus consume more total energy. In contrast, ROA and board size correlate negatively with EnCons, suggesting that more profitable and better-governed firms may be more energy-conscious. Multicollinearity diagnostics show no immediate concerns: all Variance Inflation Factors (VIFs) are well below the conventional threshold of 10, with the highest (leverage) at 1.67 and an average of 1.26 (Appendix A.1 Table A1). This indicates that the independent variables are sufficiently orthogonal to allow precise estimation of the AI–energy consumption relationship.
Table 4.
Correlation Coefficient.
Overall, the descriptive statistics and diagnostics validate the variable construction and confirm the appropriateness of using fixed-effects panel regressions. The observed negative bivariate link between AI and absolute energy consumption offers preliminary evidence of the hypothesized effect, which will be examined in depth through multivariate analyses that control for firm-specific heterogeneity and time-varying macroeconomic shocks.
4.2. Baseline Regression Results
Table 5 presents the baseline panel regression results linking AI adoption to absolute firm-level energy consumption. Column (1) reports the parsimonious model that includes only the AI variable and year-fixed effects. The coefficient on AI is negative and highly significant (β = −0.001, t = −4.08), indicating that AI adoption is associated with reduced energy consumption, which provides initial support for Hypothesis 1 (H1). Column (2) introduces firm-level control variables. The coefficient on AI remains negative and statistically significant (β = −0.001, t = −4.20), indicating that the effect of AI is robust to the inclusion of firm characteristics such as size, profitability, leverage, growth, board composition, and firm age. Among the controls, return on assets (ROA) exhibits a negative association with energy use, implying that more profitable firms tend to consume less energy, consistent with the efficiency hypothesis. Leverage is also negatively related to energy consumption, albeit at a weaker significance level. In Column (3), we further incorporate industry-fixed effects to control for unobserved sector-specific characteristics that may influence AI deployment and energy intensity. The AI coefficient remains stable (β = −0.001, t = −2.47), suggesting the observed relationship is not driven by industry composition.
Table 5.
Baseline Regression Results.
Finally, Column (4) adds firm-fixed effects and year-fixed effects and adjusts standard errors for clustering at the firm level. This model specification captures within-firm variation over time and accounts for unobservable firm-specific heterogeneity. The AI coefficient remains negative and statistically significant at the 1% level (β = −0.001, t = −2.63), reinforcing the interpretation that increases in AI engagement are associated with reductions in energy consumption over time. This model serves as our preferred specification for subsequent mediation and moderation analyses.
The adjusted R-squared increases sharply to 0.954 in Column (4), reflecting the explanatory power of fixed effects. While the numerical magnitude of the AI coefficient appears small, its economic significance is meaningful given the log-log specification and the large scale of energy consumption in the sample. These results consistently prove that AI adoption contributes to lower absolute energy consumption, a key policy-relevant metric for achieving carbon neutrality, rather than merely improving relative efficiency measures. This distinction is central to our contribution, addressing a measurement gap in the AI-sustainability literature.
4.3. Robustness Checks
To confirm the robustness of our findings, we conduct five complementary checks addressing measurement validity, dynamic effects, potential simultaneity, and omitted variables (Table 6).
Table 6.
Robustness Checks.
Measurement validity: In Column (1), the baseline AI measure is replaced with an alternative index (ai) based solely on AI-related keyword frequencies in the MD&A section of annual reports. The negative and significant coefficient (β = −0.001, t = −2.48) confirms that the observed energy-saving effect is not dependent on a specific AI measurement choice.
Dynamic effects and temporal sequencing: Column (2) lags AI by one year (L.AI) to mitigate reverse causality concerns, aligning with the sequence of technology investment and subsequent energy impact. The lagged AI coefficient remains negative and significant (β = −0.001, t = −2.58). Column (3) introduces a forward-lag of ln (EnCons) to capture persistence in total energy use. AI remains significantly negative (β = −0.001, t = −2.55), suggesting that AI adoption today predicts lower absolute energy consumption in the following year.
Sectoral and macro shocks: Column (4) incorporates fixed effects, absorbing any sector-wide macroeconomic or policy shocks. The AI effect persists (β = −0.001, t = −2.60), ruling out coincidental sectoral dynamics as the main driver.
Extended firm characteristics: Column (5) controls for additional governance and valuation variables (Top5 ownership concentration, book-to-market ratio, and management shareholding), which could jointly influence AI adoption and energy strategies. The AI coefficient remains negative and significant (β = −0.001, t = −2.50), alleviating omitted-variable concerns.
Across all specifications, the magnitude and direction of the AI coefficient remain stable and significant at conventional levels. Adjusted R-squared values stay high (≥0.94), indicating that the models explain substantial within-firm variation in energy use. Collectively, these robustness checks strengthen the causal interpretation that AI adoption leads to absolute reductions in firm-level energy consumption, a more stringent and policy-relevant sustainability outcome than improvements in intensity metrics.
4.4. Endogeneity Test
Given the potential for endogeneity, stemming from reverse causality, omitted variables, or measurement concerns, we conduct identification strategies explicitly focusing on absolute energy consumption rather than intensity. This choice is central to our contribution: while intensity measures may underestimate environmental impact when output expands, absolute energy consumption directly reflects the environmental burden and is a more policy-relevant outcome.
4.4.1. Instrumental Variable (IV) Approach
We first adopt a two-stage least squares (2SLS) IV strategy (Table 7), instrumenting AI adoption with two theoretically grounded variables:
- (1)
- the lagged firm-level AI index (L.AI) and
- (2)
- the industry-average AI adoption level (meanAI_ind),
following best practice in technology diffusion research. The lagged value captures persistence in technology deployment, while the industry mean reflects peer effects and sectoral technological trends—both plausibly exogenous to firm-specific short-term energy shocks.
The first-stage regression (Column 1) shows both instruments are strong predictors of AI adoption: L.AI (β = 0.855, t = 248.53) and mean AI_ind (β = 0.184, t = 30.70) are highly significant. The Cragg–Donald Wald F-statistic (5.1 × 10⁴) far exceeds weak-instrument thresholds; the Stock–Yogo statistic (19.93) confirms identification strength; and the Sargan overidentification test (χ2 = 3.45, p > 0.05) supports instrument exogeneity.
In the second stage (Column 2), the predicted AI variable retains a negative and statistically significant effect on ln (EnCons) (β = −0.001, t = −2.76). This stability in sign and magnitude relative to OLS results suggests that AI adoption causally reduces absolute energy consumption, not merely correlating due to unobserved factors. Control variables behave similarly to baseline models, and the high R2 (0.943) indicates strong model fit.
These IV results bolster our causal claim: AI adoption drives real reductions in firm-level energy use, supporting the theoretical link between digital transformation and sustainability outcomes in heavy energy-using sectors.
Table 7.
Endogeneity Test: Instrumental Variable Approach.
Table 7.
Endogeneity Test: Instrumental Variable Approach.
| (1) First_Stage | (2) Second_Stage | |
|---|---|---|
| Variables | AI | ln_EnCons |
| L.AI | 0.855 *** | |
| (248.53) | ||
| meanAI_ind | 0.184 *** | |
| (30.70) | ||
| AI | −0.001 *** | |
| (−2.76) | ||
| Controls | YES | YES |
| Year | YES | YES |
| Id | YES | YES |
| Constant | −0.063 | 7.556 *** |
| (−0.88) | (1289.56) | |
| Anderson canon. Corr. LM statistic | 2.4 × 10⁴ | |
| Cragg-Donald Wald F statistic | 5.1 × 10⁴ | |
| Stock-Yogo weak | 19.93 | |
| Sargan statistic | 3.450 | |
| Observations | 30,632 | 30,632 |
| R-squared | 0.789 | 0.943 |
t-statistics in parentheses *** p < 0.01.
4.4.2. Additional Endogeneity Tests
This study further deploys three complementary strategies (Table 8) to verify that the negative AI–energy consumption link is not driven by residual endogeneity:
Table 8.
Additional Endogeneity Tests.
Control Function (CF) Approach: We decompose AI into its IV-predicted value (AI_hat) and residual (AI_resid) from the first stage. Column (1) shows AI_hat remains significantly negative (β = −0.032, t = −3.15), while AI_resid is also significant (β = −0.001, t = −2.54), confirming endogeneity and validating the correction.
Placebo Falsification Test: We randomly assign a fictitious “AI pilot” treatment (placebo_DID) and re-estimate the DID model. As expected, the placebo coefficient is statistically insignificant (β = 0.001, t = 1.05; Column 2), ruling out spurious correlation driven by chance grouping.
PSM–DID Quasi-Experiment: We match firms in AI pilot zones or under smart manufacturing policies with similar untreated firms using propensity scores, then apply DID estimation. Column (3) shows the DID interaction term remains negative and significant (β = −0.003, t = −2.21), indicating that policy-induced AI adoption leads to larger post-treatment reductions in absolute energy consumption.
Probability Weighting (IPW) Approach: We further apply the Inverse Probability Weighting (IPW) approach to re-estimate the baseline specification. Column (5) in Table 8 reports that the AI coefficient remains significantly negative (β = −0.001, t = −1.67), consistent with the unweighted baseline. This result reinforces that our findings are not driven by sample imbalance and confirms the robustness of the AI–energy consumption nexus.
Across all methods, the estimated effect of AI adoption remains negative, statistically significant, and economically meaningful. The convergence of results from IV, CF, placebo, and PSM–DID strengthens the internal validity of our findings and underscores their policy relevance: AI adoption is a robust driver of reducing absolute energy use in Chinese listed firms.
5. Mechanism Analysis: Mediation and Moderation Effects
To further unpack how AI adoption reduces absolute energy consumption, we examine two mechanisms: (1) an indirect pathway through corporate green innovation, and (2) moderation by firm-level digital capabilities. These analyses provide theoretical depth and reinforce the policy relevance of AI-driven decarbonization.
5.1. Mediation Analysis: The Role of Green Innovation
A core channel is green innovation, R&D activities explicitly targeting environmental technologies. The Porter Hypothesis posits that environmental innovation can simultaneously enhance competitiveness and resource efficiency. Combined with dynamic capability theory, we expect AI to enable advanced analytics, automation, and process optimization, which, in turn, stimulate eco-oriented innovation and reduce energy use.
This research operationalizes GreenInno as the annual number of green patent applications (weighted by IPC green technology codes) filed by each firm. The mediation analysis follows a multi-step regression approach:
Step 1 (Path a): Column (1) of Table 9 shows AI adoption positively affects green innovation (β = 0.003, t = 3.00, p < 0.01), consistent with the view that AI augments innovation capabilities.
Step 2 (Path b): Column (2) shows that, controlling for AI and covariates, green innovation significantly reduces ln_EnCons (β = −0.006, t = −2.09, p < 0.05).
Step 3 (Indirect effect): Sobel Z-test (Z = −2.369, p < 0.05) and 1000-replication percentile bootstrap (95% CI: −0.00055 to −0.00033) both confirm statistical significance.
The AI coefficient remains negative and significant after including green innovation, indicating partial mediation. This implies that AI adoption has a direct energy-saving effect and indirectly reduces consumption by fostering environmental innovation, supporting H2.
Table 9.
Mediation Effect of Green Innovation.
Table 9.
Mediation Effect of Green Innovation.
| Variables | (1) GreenInno | (2) ln_EnCons |
|---|---|---|
| AI | 0.003 *** | −0.001 ** |
| (0.001) | (−2.54) | |
| GreenInno | −0.006 ** | |
| (−2.09) | ||
| Controls | YES | YES |
| Constant | 0.039 | 7.297 *** |
| (0.027) | (348.49) | |
| Sobel Z | −2.369 ** | |
| Bootstrap (95% conf. interval) | [−0.00055, −0.00033] | |
| Observations | 35,795 | 32,212 |
| R-squared | 0.001 | 0.960 |
| Number of stkcd | 4885 | |
Standard errors in parentheses *** p < 0.01, ** p < 0.05.
5.2. Moderation Analysis: Digital Capabilities as Amplifiers
Even when firms adopt AI, the realized energy benefits may depend on internal readiness to exploit it. We consider two moderators:
- (1)
- Digital Transformation Capability (DCG)—a structural measure of a firm’s digital infrastructure, systems integration, and platform connectivity.
- (2)
- IT-related Executive Background (IT_Back)—a cognitive measure reflecting the proportion of top executives with IT education or professional experience.
Grounded in resource complementarity theory, we expect higher DCG to amplify the AI–energy efficiency link, as robust digital infrastructure maximizes AI’s operational optimization potential. From an upper echelons perspective, IT-aware executives should better align AI deployment with sustainability goals. Regression results are shown in Table 10.
Table 10.
Moderating Effect of Digital Capabilities.
Baseline: Column (1) confirms AI reduces ln_EnCons (β = −0.002, p < 0.01).
Structural moderator: Adding AI × DCG (Column 2) yields a significantly negative interaction (β = −0.001, p < 0.01), confirming H3: firms with higher DCG realize more substantial energy savings from AI.
Cognitive moderator: Column (3) shows AI × IT_Back is significantly negative (β = −0.014, p < 0.01), supporting H4: executive IT literacy enhances AI’s sustainability impact.
These findings underline that digital readiness—both infrastructural and managerial—is crucial for translating AI adoption into measurable energy consumption reductions. Firms lacking these complementary assets may underperform in realizing AI’s green potential.
5.3. Heterogeneity Analysis
To test the external validity of our main findings and identify the boundary conditions under which AI adoption influences absolute energy consumption, we conduct heterogeneity analyses along four theoretically motivated dimensions: (1) firm size, (2) ownership type, (3) industry energy intensity, and (4) regional digital economy development. This design enables us to reveal how internal capabilities and external environments jointly shape AI’s energy-saving potential. Figure 6 illustrates the coefficient patterns; full regression results are provided in Appendix A.2 Table A2.
- (1)
- Firm size: Resource endowment effect
Drawing on the resource-based view [8], large firms are more likely to possess the complementary digital infrastructure and skilled workforce required to exploit AI for operational optimization fully. Consistent with this, AI adoption significantly reduces ln_EnCons among large firms (β = −0.002, p < 0.01), but the effect is statistically insignificant for small firms. This asymmetry suggests that resource constraints may limit smaller firms’ ability to translate AI tools into tangible energy savings.
- (2)
- Ownership type: Governance and flexibility
Separating state-owned enterprises (SOEs) from private firms reveals that AI reduces energy consumption in both groups, but the magnitude is slightly larger for private firms (β = −0.001, p < 0.01). This aligns with ownership theory, which holds that private firms—facing stronger market discipline and performance pressure—may implement AI-driven sustainability practices more efficiently, while SOEs’ bureaucratic processes could slow adaptive responses.
- (3)
- Industry energy intensity: Technological inertia in heavy sectors
Based on policy definitions and industry codes, we classify industries as energy-intensive or non-energy-intensive. The energy-reducing effect of AI is significant only in non-energy-intensive sectors (β = −0.002, p < 0.01). The coefficient is positive but insignificant in energy-intensive sectors, suggesting that technological inertia and rigid production processes in heavy industries may dampen AI’s integration into energy management systems.
- (4)
- Regional digital economy development: Leapfrogging potential
Using the provincial Digital Economy Index (DEI), we classify regions into “high-DEI” and “low-DEI” groups. Interestingly, the AI effect is more potent in the low-DEI regions (β = −0.002, p < 0.01) than in the high-DEI regions (p < 0.10). This pattern is consistent with the leapfrogging hypothesis: in less digitally mature areas, AI adoption may deliver larger marginal gains by substituting for missing infrastructure, whereas in already advanced regions, incremental benefits are smaller
These results demonstrate that the energy-saving benefits of AI are context-dependent. Internally, firm size and ownership structure influence the resources and governance agility available for AI deployment. Externally, industry structure and regional digital maturity condition the ease with which AI can be integrated into operations. The findings underscore the need for tailored policy instruments—for instance, targeted subsidies for AI adoption in small or energy-intensive firms, and infrastructure investment in low-DEI regions—to maximize AI’s contribution to corporate and societal sustainability goals.

Figure 6.
Heterogeneity in the Impact of AI Adoption on Firm-Level Energy Consumption. (Estimated coefficients from subgroup regressions indicate that AI adoption significantly reduces energy consumption in large firms, private enterprises, non-energy-intensive industries, and provinces with lower digital economy development (Low DEI). Effects are weaker or statistically insignificant in small firms, SOEs, energy-intensive sectors, and high-DEI regions. Coefficients represent marginal effects of AI within each subgroup, with 95% confidence intervals).
6. Discussion and Conclusions
6.1. Discussion of Empirical Findings
This study offers the first large-scale, micro-level causal identification of how artificial intelligence (AI) adoption affects firm-level energy consumption. This absolute metric reflects environmental burden and avoids the masking effect inherent in relative measures such as energy intensity. Using multi-method identification strategies, we find robust evidence that AI adoption significantly reduces firms’ total energy use [8]. This finding extends the resource-based view (RBV) by showing that AI functions as a valuable, rare, and inimitable capability that enhances operational productivity and delivers measurable environmental returns. Mechanistically, AI-enabled automation, real-time monitoring, and intelligent process scheduling reduce avoidable energy waste embedded in production routines, consistent with prior evidence on smart energy systems [47,48].
Our mediation analysis demonstrates that green innovation is a critical transmission channel. AI adoption stimulates environmentally oriented R&D, captured by increased green patenting, which drives down energy consumption. This pathway aligns with dynamic capability theory [9] by highlighting the role of AI in reconfiguring technological and organizational resources toward environmental objectives. It also supports the Porter Hypothesis [30], confirming that environmental performance and innovation are complementary rather than conflicting. By integrating AI into R&D strategies, firms can develop energy-saving processes and low-carbon products, thereby achieving a dual digital–ecological transformation [49].
The moderation results indicate that the environmental impact of AI is conditional on complementary organizational capabilities. Firms with higher digital transformation intensity exhibit more substantial energy-saving effects from AI, in line with the Technology–Organization–Environment (TOE) framework [40], which emphasizes the role of technological readiness in realizing innovation benefits. Similarly, top executives with IT-related backgrounds amplify AI’s environmental benefits, consistent with Upper Echelons Theory (Hambrick & Mason, 1984) [37]. Managerial digital literacy appears crucial for aligning AI applications with sustainability objectives.
Heterogeneity tests further reveal boundary conditions. Large firms derive greater benefits from AI, likely due to superior resource endowments and structured innovation teams. Private firms show slightly stronger effects than SOEs, suggesting greater agility and market-driven incentives in aligning AI with sustainability goals. AI reduces energy use in non-energy-intensive sectors but has no significant impact in energy-intensive industries, possibly due to technological inertia and rigid production processes. Geographically, the AI effect is more pronounced in low–digital economy index (DEI) provinces, consistent with a “leapfrogging” mechanism where AI substitutes for underdeveloped digital infrastructure. These patterns underscore that AI’s environmental benefits are not uniform, but contingent on firm-level capabilities and contextual conditions.
6.2. Theoretical and Practical Implications
First, this study extends the RBV by positioning AI as a strategic enabler of environmental performance, moving beyond its conventional framing as a purely operational or financial asset [50]. By focusing on energy consumption, we address a critical yet underexplored dimension of corporate sustainability, offering direct implications for climate policy. Second, we bridge digital transformation and environmental strategy through the lens of dynamic capabilities, showing that AI adoption facilitates a dual transition, digital and ecological, by fostering green innovation. This integrates innovation-based ESG research with technology management literature, introducing green dynamic capabilities as a measurable outcome of AI resource orchestration.
Third, we uncover contingent effects of internal digital readiness and managerial cognition, contributing to the emerging literature on digitally enabled sustainability transitions [51,52]. We show that AI’s environmental benefits materialize only when supported by interoperable digital infrastructure and IT-literate leadership.
Finally, by incorporating heterogeneity in ownership, industry type, and regional digital maturity, we provide contextualized evidence from China, where energy consumption data availability and policy environments differ markedly from those in developed economies, adding an essential international comparative dimension.
From a managerial perspective, AI adoption should be embedded within green performance management systems, with explicit carbon-reduction KPIs and green R&D targets. Senior executives should ensure cross-functional collaboration among IT, sustainability, and operations teams, and prioritize digital literacy training at the leadership level.
From a policy standpoint, generic digital subsidies may be insufficient. Regulators should introduce AI-specific energy efficiency benchmarks and mandate the disclosure of AI-enabled carbon reduction metrics in sustainability reports. ESG-linked tax incentives could be tied to verified green innovation outputs, such as documented reductions in industrial energy consumption or increases in green patent filings. AI could serve as a policy substitute for underdeveloped digital ecosystems in low-DEI regions, warranting targeted public procurement and green credit programs to accelerate AI-based energy solutions.
6.3. Limitations and Future Research
Several limitations point to avenues for future research.
First, AI adoption is measured via text-based frequency extraction, which, while scalable and replicable, may not fully capture the scope, quality, or integration stage of AI deployment. In particular, disclosure practices vary across firms, and the reliance on annual report narratives may either understate or overstate the actual “intensity” of AI adoption. To refine this measure, future work could combine textual indicators with survey-based evidence or in-depth case studies, thereby validating the extent and depth of AI application at the operational level. Additional proxies such as machine-level investment data or implementation audits would also help strengthen construct validity.
Second, although we employ multiple causal identification strategies (IV, CF, placebo, PSM-DID), unobserved time-varying shocks may remain. Exploiting policy discontinuities or staggered rollouts could further strengthen causal claims.
Third, while we focus on energy consumption, AI may also affect sustainability dimensions such as waste reduction, emissions control, and social governance. Future studies could adopt a multidimensional ESG framework or dynamic panel models to examine long-term environmental outcomes.
Finally, comparative research across countries with varying institutional contexts could test the generalizability of our findings and explore how policy regimes mediate the AI-sustainability relationship.
Author Contributions
Conceptualization, W.B. and Y.Z.; methodology, Y.Z.; software, Y.Z.; validation, W.B., Y.Z.; formal analysis, Y.Z.; investigation, Y.Z.; resources, Y.Z.; data curation, Y.Z.; writing—original draft preparation, Y.Z.; writing—review and editing, W.B.; visualization, Y.Z.; supervision, W.B.; project administration, W.B.; funding acquisition, W.B. All authors have read and agreed to the published version of the manuscript.
Funding
This research received no external funding.
Conflicts of Interest
The authors declare no conflict of interest.
Appendix A
Appendix A.1
Table A1.
Variance Inflation Factors (VIFs).
Table A1.
Variance Inflation Factors (VIFs).
| Variable | VIF | 1/VIF |
|---|---|---|
| Lev | 1.670 | 0.599 |
| Size | 1.500 | 0.667 |
| ROA | 1.360 | 0.737 |
| Growth | 1.110 | 0.905 |
| Board | 1.090 | 0.917 |
| FirmAge | 1.060 | 0.948 |
| AI | 1.040 | 0.966 |
| Mean | VIF | 1.260 |
Appendix A.2
Table A2.
Regression Results of Heterogeneity Analysis.
Table A2.
Regression Results of Heterogeneity Analysis.
| (1) | (2) | (3) | (4) | (5) | (6) | (7) | (8) | |
|---|---|---|---|---|---|---|---|---|
| Variables | Big Firms | Small Firms | State-Owned | Private-Owned | Energy-Intensive | Non-Energy | High DEI Region | Low DEI Region |
| AI | −0.002 *** | −0.001 | −0.001 | −0.001 ** | 0.001 | −0.002 *** | −0.001 * | −0.002 *** |
| (0.001) | (0.001) | (0.001) | (0.001) | (0.001) | (0.000) | (0.001) | (0.001) | |
| Controls | YES | YES | YES | YES | YES | YES | YES | YES |
| Constant | 7.332 *** | 7.214 *** | 7.264 *** | 7.305 *** | 7.312 *** | 7.286 *** | 7.350 *** | 7.244 *** |
| (0.036) | (0.040) | (0.040) | (0.026) | (0.048) | (0.024) | (0.032) | (0.035) | |
| Observations | 17,203 | 14,768 | 11,227 | 21,058 | 6093 | 26,237 | 15,631 | 15,763 |
| R-squared | 0.956 | 0.964 | 0.962 | 0.957 | 0.961 | 0.959 | 0.952 | 0.957 |
Robust standard errors in parentheses *** p < 0.01, ** p < 0.05, * p < 0.1.
This table presents the results of subgroup regressions examining the heterogeneous impact of AI adoption on energy consumption. Subsamples are split by firm size (Columns 1–2), ownership type (Columns 3–4), industry energy intensity (Columns 5–6), and regional digital development index (Columns 7–8). Robust standard errors are clustered at the firm level.
Appendix A.3
Table A3.
Artificial Intelligence Keyword Dictionary.
Table A3.
Artificial Intelligence Keyword Dictionary.
| Machine Learning | AI Products | AI Chips | Machine Translation | Computer Vision |
| Machine learning | AI product | AI chip | Machine translation | Computer vision |
| Deep learning | Smart banking | Deep learning | Neural network | Image recognition |
| Data mining | Smart insurance | AI processor | Speech synthesis | Feature recognition |
| Autonomous driving | Smart healthcare | Deep neural network | Natural language processing | Biometric identification |
| Pattern recognition | Smart customer service | LSTM | Voice synthesis | Edge intelligence |
| Cloud computing | Smart retail | Big data analytics | Question answering | Facial recognition |
| Speech recognition | Smart education | Smart home | Recurrent neural network | Knowledge graph |
| Feature extraction | Smart driving | Intelligent chip | Reinforcement learning | Intelligent agent |
| Big data processing | Smart accounting | SVM | Distributed computing | Voice interaction |
| Knowledge representation | Smart taxation | NLP | Big data operations | Intelligent assessment |
| Robotics | Smart logistics | Intelligent sensor | Smart perception | Virtual reality |
| Smart manufacturing | Smart mailbox | Smart dialogue | Environmental intelligent network | Augmented reality |
| Smart flow control | Smart medical | Augmented intelligence | Cloud service | Big data analytics |
| Smart evaluation | Smart finance | Intelligent diagnosis | Intelligent analysis | Intelligent transportation |
Note: This dictionary includes major artificial intelligence keywords commonly used in the field of corporate AI adoption research. The keywords span technologies and applications such as machine learning, deep learning, computer vision, natural language processing, AI chips, smart manufacturing, robotics, autonomous driving, intelligent customer service, cloud computing, big data analytics, and more. The frequency (or logged frequency) of these keywords appearing in annual reports and MD&A sections is used as a quantitative measure of firm-level AI adoption.
Appendix B. Validity Tests of the AI-Technology Measure
We adopt three approaches to examine the relationship between the AI-related word frequency in firms’ annual reports and their actual AI technology level, in order to validate that the textual AI measure is a reliable proxy for firms’ AI intensity.
- (1)
- Validity Tests of the AI-Technology Measure
We benchmark our measure against authoritative external sources, including the 2019 CCID Top 100 AI Enterprises report (see: https://www.cbinsights.com/research/2019-top-100-ai-startups-where-are-they-now/, accessed on 26 May 2025) and the AI-concept stock list from iFinD. The 2019 CCID Top 100 AI Enterprises report evaluates firms’ comprehensive AI capability, market competitiveness, innovation capability, and industry influence. Firms included in these lists are widely recognized as leaders in the AI industry. We compare the AI-related word frequency of listed firms that appear on these lists with those that do not.
Table A4 and Table A5 show the results based on the full annual reports (Words). The mean word frequency of CCID-listed firms is 69.387, significantly higher than that of non-CCID firms (2.245). Similarly, AI concept firms also exhibit substantially higher AI word frequencies than non-concept firms, with a mean difference of 19.723.
Table A4.
Descriptive Statistics and Mean Difference Tests_Words (Full Annual Report).
Table A4.
Descriptive Statistics and Mean Difference Tests_Words (Full Annual Report).
| Variable | Sample | N | Mean | Std. Dev. | Min | Median | Max |
|---|---|---|---|---|---|---|---|
| Words | All firms | 28,866 | 2.979 | 12.349 | 0 | 0 | 321 |
| Words | CCID Top 100 | 75 | 69.387 | 80.467 | 0 | 34 | 246 |
| Words | Non-CCID firms | 28,791 | 2.806 | 11.171 | 0 | 0 | 246 |
| Words | AI Concept Firms | 1075 | 21.967 | 38.863 | 0 | 4 | 246 |
| Words | Non-Concept Firms | 27,791 | 2.245 | 9.249 | 0 | 0 | 246 |
Table A5.
Words Mean Differences.
Table A5.
Words Mean Differences.
| Sample | N | Mean | MeanDiff |
|---|---|---|---|
| CCID Top 100 | 75 | 69.387 | 66.581 * |
| Non-CCID Firms | 28,791 | 2.806 | — |
| AI Concept Firms | 1075 | 21.967 | 19.723 * |
| Non-Concept Firms | 27,791 | 2.245 | — |
Robust standard errors in parentheses * p < 0.1.
We further test robustness by using AI-related word frequency restricted to the MD&A section of annual reports (Words_MD&A). Table A6 and Table A7 report the descriptive statistics and mean-difference tests. Consistent with the full-report measure, CCID and AI concept firms display significantly higher AI-related disclosures in the MD&A section, supporting the external validity of our textual proxy.
Table A6.
Words_MD&A (MD&A Section Only).
Table A6.
Words_MD&A (MD&A Section Only).
| Variable | Sample | N | Mean | Std. Dev. | Min | Median | Max |
|---|---|---|---|---|---|---|---|
| Words_MD&A | All firms | 28,866 | 1.442 | 5.959 | 0 | 0 | 162 |
| Words_MD&A | CCID Top 100 | 75 | 35.147 | 34.636 | 0 | 26 | 162 |
| Words_MD&A | Non-CCID firms | 28,791 | 1.374 | 5.546 | 0 | 0 | 162 |
| Words_MD&A | AI Concept Firms | 1075 | 10.269 | 16.662 | 0 | 4 | 162 |
| Words_MD&A | Non-Concept Firms | 27,791 | 1.169 | 4.958 | 0 | 0 | 162 |
Table A7.
Words_MD&A Mean Differences.
Table A7.
Words_MD&A Mean Differences.
| Sample | N | Mean | MeanDiff |
|---|---|---|---|
| CCID Top 100 | 75 | 35.147 | 25.972 * |
| Non-CCID Firms | 28,791 | 1.374 | — |
| AI Concept Firms | 1075 | 10.269 | 9.169 * |
| Non-Concept Firms | 27,791 | 1.169 | — |
Robust standard errors in parentheses * p < 0.1. Notes: This appendix validates the AI textual measure by comparing firms recognized in external benchmarks (CCID Top 100 AI firms and AI concept stocks) against non-benchmark firms. Both in the full annual reports and in the MD&A sections, benchmark firms show significantly higher AI-related word frequencies, confirming the construct validity of the textual measure.
- (2)
- Correlation Test of Alternative AI Measures
To further assess the validity of the AI measure, we conduct correlation tests across multiple proxies of firms’ AI intensity. Specifically, we consider four variables: the log-transformed AI-related word frequency in the annual reports (Lnwords), the log-transformed AI-related word frequency in the MD&A section (Lnwords_MD&A), the log of the number of AI-related patents filed by the firm (Lnpatents), and the log of the number of AI-related job advertisements (LnAIad).
These variables capture firms’ AI exposure from three perspectives: (i) textual disclosure in full annual reports, (ii) managerial discussion and analysis, and (iii) innovation output and human capital demand. Together, they provide complementary evidence of firms’ AI technology adoption.
We then perform Pearson correlation tests among these measures. Appendix B Table A8 reports the results. Lnwords is strongly correlated with Lnwords_MD&A (0.909), and also significantly correlated with Lnpatents (0.272) and LnAIad (0.286), all at the 1% significance level. These results indicate that textual AI measures are positively associated with patenting and labor demand, confirming that they capture firms’ AI technology level to a certain extent.
Table A8.
Pearson Correlation Tests.
Table A8.
Pearson Correlation Tests.
| Variable | Lnwords | Lnwords_MD&A | Lnpatents | LnAIad |
|---|---|---|---|---|
| Lnwords | 1 | |||
| Lnwords_MD&A | 0.909 *** | 1 | ||
| Lnpatents | 0.272 *** | 0.282 *** | 1 | |
| LnAIad | 0.286 *** | 0.330 *** | 0.359 *** | 1 |
Notes: This table presents Pearson correlation coefficients among four measures of firms’ AI intensity. Lnwords denotes the natural logarithm of AI-related word frequency in annual reports; Lnwords_MD&A denotes the measure restricted to the MD&A section; Lnpatents is the log number of AI-related patents; and LnAIad is the log number of AI-related job postings. All coefficients are significant at the 1% level, suggesting that textual and non-textual measures are mutually consistent proxies for firms’ AI technology engagement. *** p < 0.01.
- (3)
- Expert Validation through Industry Comparison
To further validate the AI adoption measure, we conducted an expert-based cross-check. We randomly selected 20 annual reports of listed firms and invited two industry professionals with extensive experience in artificial intelligence to independently classify each firm’s AI technological sophistication as either “high” or “low”. We then compared these expert classifications with the frequency of AI-related terms in the annual reports.
As reported in Table A9, firms identified by experts as having a high AI adoption level exhibited an average of 41.70 AI-related words in their annual reports, whereas those identified as low AI adoption showed only 1.40 words on average. The difference between these two groups is substantial and statistically meaningful, indicating that the text-based AI word frequency measure aligns closely with professional evaluations of firms’ AI technological intensity. This comparison strengthens the external validity of our AI adoption measure.
Table A9.
Expert Validation: AI Adoption Scores vs. Annual Report Word Frequencies.
Table A9.
Expert Validation: AI Adoption Scores vs. Annual Report Word Frequencies.
| No. | Stock Code | Year | Expert Rating | AI-Related Word Count | Average |
|---|---|---|---|---|---|
| 1 | 300047 | 2016 | High | 102 | 41.7 |
| 2 | 600448 | 2017 | High | 78 | |
| 3 | 2177 | 2017 | High | 43 | |
| 4 | 300383 | 2014 | High | 40 | |
| 5 | 810 | 2015 | High | 25 | |
| 6 | 2542 | 2016 | High | 83 | |
| 7 | 2177 | 2017 | High | 47 | |
| 8 | 66 | 2016 | High | 13 | |
| 9 | 300688 | 2018 | High | 5 | |
| 10 | 810 | 2014 | High | 17 | |
| 11 | 300161 | 2018 | Low | 2 | 1.4 |
| 12 | 300079 | 2013 | Low | 3 | |
| 13 | 600455 | 2018 | Low | 4 | |
| 14 | 2264 | 2018 | Low | 1 | |
| 15 | 600794 | 2016 | Low | 4 | |
| 16 | 883 | 2012 | Low | 1 | |
| 17 | 600108 | 2017 | Low | 0 | |
| 18 | 300285 | 2016 | Low | 0 | |
| 19 | 899 | 2015 | Low | 0 | |
| 20 | 601999 | 2018 | Low | 3 |
References
- Bai, C.A.; Sarkis, J.; Xue, W. Improving operational efficiency and effectiveness through blockchain technology. Prod. Plan. Control 2024, 35, 857–865. [Google Scholar] [CrossRef]
- Baccour, E.; Mhaisen, N.; Abdellatif, A.A.; Erbad, A.; Mohamed, A.; Hamdi, M.; Guizani, M. Pervasive AI for IoT Applications: A Survey on Resource-Efficient Distributed Artificial Intelligence. IEEE Commun. Surv. Tutor. 2022, 24, 2366–2418. [Google Scholar] [CrossRef]
- Abbasi, M.; Nishat, R.I.; Bond, C.; Graham-Knight, J.B.; Lasserre, P.; Lucet, Y.; Najjaran, H. A review of AI and machine learning contribution in business process management (process enhancement and process improvement approaches). Bus. Process Manag. J. 2024. ahead-of-print. [Google Scholar] [CrossRef]
- Khan, S.U.; Khan, N.; Ullah, F.U.M.; Kim, M.J.; Lee, M.Y.; Baik, S.W. Towards intelligent building energy management: AI-based framework for power consumption and generation forecasting. Energy Build. 2023, 279, 112705. [Google Scholar] [CrossRef]
- Goldman Sachs. AI to Drive 165% Increase in Data Center Power Demand by 2030: Goldman Sachs. 2025. Available online: https://www.publicpower.org/periodical/article/ai-drive-165-increase-data-center-power-demand-2030-goldman-sachs (accessed on 26 May 2025).
- Xing, L.; Wei, T.; Zhuo, Y.; Li, G. Assessment of the optimal rebound effects from energy intensity reduction. J. Clean. Prod. 2020, 251, 119668. [Google Scholar] [CrossRef]
- Manigandan, P.; Alam, S.; Alagirisamy, K.; Pachiyappan, D.; Murshed, M.; Mahmood, H. Realizing the Sustainable Development Goals through technological innovation: Juxtaposing the economic and environmental effects of financial development and energy use. Environ. Sci. Pollut. Res. 2023, 30, 8239–8256. [Google Scholar] [CrossRef]
- Barney, J. Firm resources and sustained competitive advantage. J. Manag. 1991, 17, 99–120. [Google Scholar] [CrossRef]
- Teece, D.J. Explicating dynamic capabilities: The nature and microfoundations of (sustainable) enterprise performance. Strateg. Manag. J. 2007, 28, 1319–1350. [Google Scholar] [CrossRef]
- Bunian, S.; Al-Ebrahim, M.A.A.; Nour, A.A. Role and Applications of Artificial Intelligence and Machine Learning in Manufacturing Engineering: A Review. Eng. Sci. 2024, 29, 1088. [Google Scholar] [CrossRef]
- Schipper, L.; Grubb, M. On the rebound? Feedback between energy intensities and energy uses in IEA countries. Energy Policy 2000, 28, 367–388. [Google Scholar] [CrossRef]
- Kaniappan Chinnathai, M.; Alkan, B. A digital life-cycle management framework for sustainable smart manufacturing in energy intensive industries. J. Clean. Prod. 2023, 419, 138259. [Google Scholar] [CrossRef]
- Teece, D.J.; Pisano, G.; Shuen, A. Dynamic Capabilities and Strategic Management. Strateg. Manag. J. 1997, 18, 509–533. [Google Scholar] [CrossRef]
- Whig, P.; Gupta, S.K.; Nadikattu, R.R.; Sharma, P. Application of AI in Environmental Sustainability. In Artificial Intelligence-Driven Models for Environmental Management; John Wiley & Sons: Hoboken, NJ, USA, 2025; pp. 1–41. [Google Scholar]
- IEA. Energy and AI. 2025. Available online: https://iea.blob.core.windows.net/assets/601eaec9-ba91-4623-819b-4ded331ec9e8/EnergyandAI.pdf (accessed on 25 March 2025).
- Wynn, M.; Jones, P. Digital Technology Deployment and the Circular Economy. Sustainability 2022, 14, 9077. [Google Scholar] [CrossRef]
- Feng, F.F.; Li, J.; Zhang, F.; Sun, J. The impact of artificial intelligence on green innovation efficiency: Moderating role of dynamic capability. Int. Rev. Econ. Financ. 2024, 96, 103649. [Google Scholar] [CrossRef]
- Mikalef, P.; Islam, N.; Parida, V.; Singh, H.; Altwaijry, N. Artificial intelligence (AI) competencies for organizational performance: A B2B marketing capabilities perspective. J. Bus. Res. 2023, 164, 113998. [Google Scholar] [CrossRef]
- Pata, U.K.; Erdogan, S.; Ozkan, O. Is reducing fossil fuel intensity important for environmental management and ensuring ecological efficiency in China? J. Environ. Manag. 2023, 329, 117080. [Google Scholar] [CrossRef]
- Somuncu, T.; Hannum, C. The Rebound Effect of Energy Efficiency Policy in the Presence of Energy Theft. Energies 2018, 11, 3379. [Google Scholar] [CrossRef]
- Koidis, C.; Kalaitzidis, A.; Tsampoulatidis, I.; Makavou, K.; Bantsos, A.; Aptalidis, I.; Achillas, C.; Aidonis, D. Advancing Circularity Through Digital Transformation: Harnessing Life Cycle Assessment. In Supply Chains, PT II, ICSC 2024; Spring: Cham, Switzerland, 2025; pp. 14–25. [Google Scholar]
- Terry, S.; Lu, H.; Fidan, I.; Zhang, Y.; Tantawi, K.; Guo, T.; Asiabanpour, B. The Influence of Smart Manufacturing towards Energy Conservation: A Review. Technologies 2020, 8, 31. [Google Scholar] [CrossRef]
- Zeng, M.; Zhang, W. Green finance: The catalyst for artificial intelligence and energy efficiency in Chinese urban sustainable development. Energy Econ. 2024, 139, 107883. [Google Scholar] [CrossRef]
- Mahadik, S.; Gedam, M.; Shah, D.V. Environment sustainability with smart grid sensor. Front. Artif. Intell. 2025, 7, 1510410. [Google Scholar] [CrossRef] [PubMed]
- Dong, K.; Chen, Q.; Zhu, A.; Yang, Z.; Yang, Z. The Impact of Digital Finance on Carbon Emission Performance -An Empirical Analysis of 261 Cities in China. Pol. J. Environ. Stud. 2025, 34, 4071–4082. [Google Scholar] [CrossRef]
- Xi, K.; Shao, X.F. Impact of AI applications on corporate green innovation. Int. Rev. Econ. Financ. 2025, 99, 104007. [Google Scholar] [CrossRef]
- Yang, C.Y.; Zhu, C.H.; Albitar, K. ESG ratings and green innovation: A U-shaped journey towards sustainable development. Bus. Strategy Environ. 2024, 33, 4108–4129. [Google Scholar] [CrossRef]
- Montresor, S.; Vezzani, A. Digital technologies and eco-innovation. Evidence of the twin transition from Italian firms. Ind. Innov. 2023, 30, 766–800. [Google Scholar] [CrossRef]
- Xu, J.W.; Yu, Y.; Zhang, M.; Zhang, J.Z. Impacts of digital transformation on eco-innovation and sustainable performance: Evidence from Chinese manufacturing companies. J. Clean. Prod. 2023, 393, 136278. [Google Scholar] [CrossRef]
- Porter, M.E.; van der Linde, C. Toward a New Conception of the Environment-Competitiveness Relationship. J. Econ. Perspect. 1995, 9, 97–118. [Google Scholar] [CrossRef]
- Taheri Hosseinkhani, N. Artificial Intelligence and Large Language Models in Energy Systems and Climate Strategies: Economic Pathways to Cost-Effective Emissions Reduction and Sustainable Growth. 2025. Available online: https://papers.ssrn.com/sol3/papers.cfm?abstract_id=5385513 (accessed on 25 May 2025).
- Li, H.; Liu, Z.; Hachard, V. Digital transformation driving green innovation: Evidence from Chinese A-Share firms. Int. Rev. Econ. Financ. 2024, 95, 103487. [Google Scholar] [CrossRef]
- Wei, X.; Jiang, F.; Chen, Y.; Hua, W. Towards green development: The role of intelligent manufacturing in promoting corporate environmental performance. Energy Econ. 2024, 131, 107375. [Google Scholar] [CrossRef]
- Hojnik, J.; Ruzzier, M. What drives eco-innovation? A review of an emerging literature. Environ. Innov. Soc. Transit. 2016, 19, 31–41. [Google Scholar] [CrossRef]
- Devaraj, S.M. Cloud, AI, and Digital Transformation: A Winning Combination. Int. J. Comput. Eng. Technol. 2024, 15, 1020–1032. [Google Scholar]
- Sharma, P.; Angappa, G.; Subramanian, G. Enhancing Supply Chain: Exploring and Exploiting AI Capabilities. J. Comput. Inf. Syst. 2024, 1–15. [Google Scholar] [CrossRef]
- Hambrick, D.C.; Mason, P.A. Upper Echelons: The Organization as a Reflection of Its Top Managers. Acad. Manag. Rev. 1984, 9, 193–206. [Google Scholar] [CrossRef]
- Yu, D.; Zhu, Y. Executives with digital backgrounds and corporate ESG performance: Evidence from China. Res. Int. Bus. Financ. 2025, 75, 102765. [Google Scholar] [CrossRef]
- Zhao, S.; Guan, Y.; Zhou, H.; Hu, F. Making digital technology innovation happen: The role of the CEO’s information technology backgrounds. Econ. Model. 2024, 140, 106866. [Google Scholar] [CrossRef]
- Tornatzky, L.G.; Fleischer, M. The Processes of Technological Innovation Lexington; Lexington Books: Lanham, MD, USA, 1990. [Google Scholar]
- Wang, C.; Liu, T.; Zhu, Y.; Lin, M.; Chang, W.; Wang, X.; Li, D.; Wang, H.; Yoo, J. Digital Economy, Environmental Regulation and Corporate Green Technology Innovation: Evidence from China. Int. J. Environ. Res. Public Health 2022, 19, 14084. [Google Scholar] [CrossRef]
- Muawanah, U.; Marini, A.; Sarifah, I. The interconnection between digital literacy, artificial intelligence, and the use of E-learning applications in enhancing the sustainability of Regional Languages: Evidence from Indonesia. Soc. Sci. Humanit. Open 2024, 10, 101169. [Google Scholar] [CrossRef]
- Chen, W.; Srinivasan, S. Going digital: Implications for firm value and performance. Rev. Account. Stud. 2024, 29, 1619–1665. [Google Scholar] [CrossRef]
- Wu, F.; Hu, H.; Lin, H.; Ren, X. Enterprise digital transformation and capital market performance: Empirical evidence from stock liquidity. Manag. World 2021, 37, 130–144. [Google Scholar]
- Baron, R.M.; Kenny, D.A. The moderator–mediator variable distinction in social psychological research: Conceptual, strategic, and statistical considerations. J. Personal. Soc. Psychol. 1986, 51, 1173–1182. [Google Scholar] [CrossRef]
- Wooldridge, J.M. Control Function Methods in Applied Econometrics. J. Hum. Resour. 2015, 50, 420–445. [Google Scholar] [CrossRef]
- Olawade, D.B.; Fapohunda, O.; Wada, O.Z.; Usman, S.O.; Ige, A.O.; Ajisafe, O.; Oladapo, B.I. Smart waste management: A paradigm shift enabled by artificial intelligence. Waste Manag. Bull. 2024, 2, 244–263. [Google Scholar] [CrossRef]
- Hamade, Y.; Ojo, B.; Ogunrinde, V. Advancing Sustainability and Energy Efficiency in AI-Powered Enterprise Systems. 2025. Available online: https://www.researchgate.net/profile/Victor-Ogunrinde/publication/388856195_Advancing_Sustainability_and_Energy_Efficiency_in_AI-Powered_Enterprise_Systems/links/67aa7345207c0c20fa837f9b/Advancing-Sustainability-and-Energy-Efficiency-in-AI-Powered-Enterprise-Systems.pdf (accessed on 14 April 2024).
- Biggi, G.; Iori, M.; Mazzei, J.; Mina, A. Green intelligence: The AI content of green technologies. Eurasian Bus. Rev. 2025, 1–38. [Google Scholar] [CrossRef]
- Yao, N.; Bai, J.; Yu, Z.; Guo, Q. Does AI orientation facilitate operational efficiency? A contingent strategic orientation perspective. J. Bus. Res. 2025, 186, 114994. [Google Scholar] [CrossRef]
- Han, Y.F.; Zhao, F.; Zhao, B.Y. Navigating a sustainable transition: Green digital finance in manufacturing. Econ. Change Restruct. 2024, 57, 15. [Google Scholar] [CrossRef]
- Pricopoaia, O.; Cristache, N.; Lupașc, A.; Iancu, D. The implications of digital transformation and environmental innovation for sustainability. J. Innov. Knowl. 2025, 10, 100713. [Google Scholar] [CrossRef]
Disclaimer/Publisher’s Note: The statements, opinions and data contained in all publications are solely those of the individual author(s) and contributor(s) and not of MDPI and/or the editor(s). MDPI and/or the editor(s) disclaim responsibility for any injury to people or property resulting from any ideas, methods, instructions or products referred to in the content. |
© 2025 by the authors. Licensee MDPI, Basel, Switzerland. This article is an open access article distributed under the terms and conditions of the Creative Commons Attribution (CC BY) license (https://creativecommons.org/licenses/by/4.0/).