Abstract
The architecture, engineering, and construction (AEC) industry is highly fragmented, yet decisions made during the design phase critically shape downstream sustainability performance. Unlike prior research that primarily weighted interactions by frequency, this study introduces an Interaction-Quality Index that evaluates the quality of design team interactions. This represents a novel approach, as it combines Social Network Analysis with Monte Carlo simulation to quantify how collaboration, coordination, and trust influence sustainable outcomes in construction projects. Through a structured literature review, three systemic interaction drivers; collaboration, coordination, and trust were identified. An interaction-quality index was then formulated, weighting each driver according to its relative impact on sustainable outcomes. Social Network Analysis coupled with Monte Carlo simulation validated the index in a real-world building project, demonstrating its usefulness in identifying critical interaction nodes and highlighting how improvements in collaboration, coordination, and trust can strengthen network cohesion and enhance sustainability-oriented decision-making. The proposed index offers construction managers a quantitative tool to integrate social dynamics into holistic sustainability strategies, advancing practice in line with systems-thinking approaches to sustainable construction management.
1. Introduction
Interaction can be defined as a social exchange occurring between two or more individuals, facilitated by communication, coordination, and collaboration among the primary participants of a team [1]. Recurrent interaction among team members aids in establishing communication channels with a common language [2]. When teams communicate openly, their ability to share important information about the task at hand increases, improving team progress and fostering higher levels of trust [3]. In the architecture, engineering, and construction (AEC) industry, insufficient team interaction can lead to poor performance across each stage of the project (design, construction, maintenance, operation, and deconstruction) as well as throughout its entire life cycle [4]. The design phase holds particular importance within the project life cycle, as decisions made during this phase can significantly influence subsequent phases [5].
To assess the interaction between members of a work team, the technique of social network analysis (SNA) is particularly valuable, as it enables the exploration of both formal and informal structures within the team [5]. Social Network Analysis (SNA) has increasingly been applied in construction management research as a means to examine relational structures within project teams. Rather than focusing solely on individual attributes, SNA emphasizes the patterns of interactions among actors, offering insights into collaboration, coordination, and trust [6]. SNA employs statistical tools to analyze the social structures of a system through networks, with nodes representing parts or members of the team and links representing the relationships or interactions between them [7]. The goal of SNA is to construct a social network empirically based on observed interactions [8]. Most scientific research on social networks has primarily considered the binary state of links, indicating either their presence or absence [9]. However, for a comprehensive description of a social network, it is crucial to consider heterogeneity in interactions between nodes [10]. This entails attributing importance not only to network typology but also to the weights of each link [11].
Several studies have been conducted on the interactions within design teams in building projects. Zhang et al. [12] researched the effect of leadership on knowledge sharing in engineering project design teams, concluding that knowledge sharing depends on knowledge leaders developing a common vision and fostering a trustworthy and collaborative environment. Similarly, du Preez [13] explored contexts in the collaborative information behavior of consulting engineers, finding that different contextual elements become factors that shape the collaborative information behavior of team members. Other studies, in addition to studying the interactions of design teams in building projects, also assign weights to the links. However, these studies assign weights based on the frequency of interaction between people [14,15] rather than the quality of the interactions.
While the aforementioned studies analyze the interactions between professionals in design teams in the AEC industry, no research has been found that identifies the characteristics influencing these interactions or assesses the quality of these interactions. Therefore, the aim of this research is to identify the characteristics affecting the interactions between members of design teams in building projects and to evaluate their quality. Previous studies have weighted links mainly by interaction frequency, overlooking the qualitative dimensions that shape team performance. This study is innovative in that it identifies the core characteristics influencing interaction quality and develops a quantitative index validated through Social Network Analysis and Monte Carlo simulation, thus offering a novel methodological and practical contribution to construction management research.
2. Theoretical Background
SNA has been used widely in studies on the construction industry aiming to identify social relations characteristics that are related to teams‘ performance in design offices as in construction projects [16].
Many of those studies have defined a theoretical background that includes SNA metrics to measure the centrality of the team members, also known as nodes, and the importance of a node based on the number of links (edges) that connect them to other members of the network and the weight of those edges. The edges represent the relationships among nodes, so they are defined by a source and a target node but also by type of communication (directed or undirected), an ID label, weight, and other descriptive information [17].
The weight represents the importance or strength of a relationship between the nodes in the social network and is used to represent aspects of the relationship: the frequency of interaction, the intensity of the connection, or the influence one node exerts on another. Based on the intensity of the relationship, weighted edges can represent weak or strong ties [18]. Also, weight would suggest multiplicities: an edge with multiplicity 3 might be counted as being the equivalent of three edges [19].
Moreover, metrics such as degree centrality, closeness centrality, and eigenvector centrality are usually applied in social network analysis in construction to unveil nodes that have high influence for being information, confidence, or authority hubs [20]. Also, density, diameter, and average path length express the structure and characteristics of a network. Density measures how interconnected a network is, diameter indicates the longest distance between any two nodes, and average path length represents the average distance between all pairs of nodes [17]. High values of density and low values of diameter and average path length are usually related to communication flow ease. Such values may be related to social network members trust relationships, which in turn are related to communication and commitment [21], or the presence of pre-established conditions as in hierarchical organizational structures [22]. When these metrics are calculated based on weighted edges, they are named with the “Weighted” prefix.
Most studies on SNA and its metrics have focused on analyzing the flow of information in construction projects to characterize their organizations and found a relation with their performance [23]. Although the greatest concern of the studies using SNA focuses on the actors and the relationship or relationships defined in them, a few have focused on personal attributes such as trust between network members [24]. However, although various social networks have been analyzed, which are developed based on aspects such as collaboration, leadership, coordination, and cooperation, no attempt has been made to establish the behavior of these characteristics together in the human groups that work in construction. Unlike Herrera et al. [14], which analyzed design networks in terms of interaction frequency, the present study advances this line of research by operationalizing interaction quality through a dedicated index, thereby extending prior findings rather than replicating them.
3. Materials and Methods
To achieve the objective of this work, the research was divided into three stages: (1) characterization of the interactions between members of design teams in the AEC industry, (2) creation of an assessment tool to evaluate the quality of interactions on an individual basis, and (3) definition of the weights of the interaction characteristics in design teams of building projects.
3.1. Characterization of Interactions Between Design Team Members in the AEC Industry
To characterize the interactions between design team members, a literature review was conducted through the Scopus and Web of Science search engines. The search equation was (“team relationship” OR “design team” OR “team interactions” OR “people interactions” OR “person interactions”) AND (“construction industry” OR “architecture” OR “AEC”). Articles from the last 12 years (2013–2025) in English or Spanish were considered. Articles from unrelated subject areas (e.g., physics, astronomy, chemistry, and materials science) were excluded, as well as those containing unrelated keywords (e.g., students, engineering education, curricula, education, and teaching). Finally, articles were selected based on a review of their titles and abstracts, focusing only on those that addressed the relationship between professionals in the AEC industry. In these selected articles, the various characteristics or dimensions affecting interactions were identified. Finally, these findings were validated through a focus group involving six experts (Table 1).

Table 1.
Description of the participants of the expert judgment.
3.2. Creation of an Assessment Tool to Evaluate the Quality of the Interaction Characteristics
To design an assessment tool to measure the characteristics or dimensions affecting interactions, an evaluation rubric was created. One of the main benefits of using rubrics is their formative nature, which allows decision-makers to provide feedback on their strengths and areas for improvement. This enables them to be used as a guide and self-evaluation tool [25]. The rubric presents an ordinal scale of four levels (excellent, good, sufficient, and poor), where each level receives an “α” score (1.0, 0.8, 0.5, and 0.2, respectively), with α being the value of the quality of each characteristic evaluated in the rubric. The decision to utilize an ordinal scale with an even number of levels is based on evidence suggesting that when an odd number of levels are used, the intermediate alternative is chosen between 20% and 50% of the time, which could bias the results [26]. The validation of this instrument was carried out in a second focus group with the experts described in Table 1.
3.3. Weighting of the Characteristics of the Interactions Between Members of a Design Team
The rubric described above enables the assessment of the individual quality of each characteristic or dimension. However, to determine the overall quality of interaction, it is necessary to combine the individual evaluations into a single value that represents the quality of the link between two individuals. For this purpose, Equation (1) was used, serving as a mathematical representation defining the quality of interaction between professionals, where IQI (Interaction Quality Index) represents the quality of the link between two people, αi corresponds to the score of each characteristic obtained in the evaluation rubric, while wi corresponds to the importance or weighting of each characteristic in the interaction process.
To obtain the importance of each characteristic, the analytic hierarchy process (AHP) method was used. This approach enables the evaluation of the consistency in the assignment of weights among the participants (experts), ensuring consistency in the evaluations and avoiding possible discrepancies [27]. Moreover, this method is often used as a tool to weigh the importance of criteria that define a problem [28].
The group of six experts (Table 1) determined the importance or weight of each characteristic by assigning it the value “w.” The Analytic Hierarchy Process (AHP) was implemented following the procedure outlined by Goepel [29]. Experts provide pairwise comparisons to construct the judgment matrix using Saaty’s scale of judgments, ranging from 1 to 9 [30]. The local weights (priorities) are obtained as the principal right eigenvector of this positive, reciprocal matrix. Consistency of expert judgments is assessed using the Consistency Index (CI) (Equation (2)).
where λmax is the maximal eigenvalue and n is the matrix dimension. The Consistency Ratio (CR) is then calculated as Equation (3).
where RI is the average CI of randomly generated matrices of the same order. A matrix is considered acceptably consistent when the CR falls below a standard threshold (typically < 0.10). When this threshold is exceeded, judgments are revised to reduce inconsistency.
To validate the evaluation system, a case study was used. The data for the case study was taken from Herrera et al. [15], specifically the basic design phase of a high-rise building project. The case study used in this research builds upon the work of Herrera et al. [15], which examined interaction requirements in design teams for high-rise building projects. That study provided a detailed network representation of a real design team, offering a robust empirical foundation for the present analysis. By using this case, the current research ensures continuity with validated data while extending the focus toward the development and application of the Interaction Quality Index (IQI). The research encompassed information flow, collaboration, and coordination networks. Figure 1 illustrates the general network, including both information flow and collaboration and coordination among professionals. In addition, several metrics were identified and measured. These are detailed in Table 2, where the first column specifies whether the metric is evaluated at the node level or network level, the second column denotes the name of the metric, and the last column indicates the definition of each metric. The network presented in Figure 1 was derived directly from the design team interactions documented in the case study by Herrera et al. [15]. Each node corresponds to a professional role within the team, while the links represent the interactions identified between them.
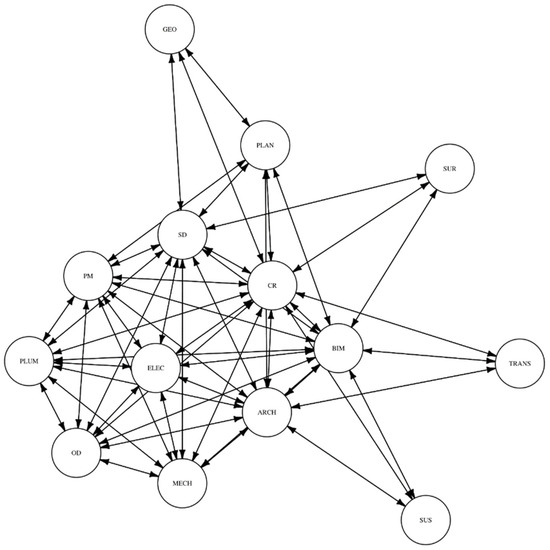
Figure 1.
Social network considering information flow, collaboration, and coordination. Created from [15]. Client representative (CR), Architect (ARCH), Project Manager (PM), Structural Designer (SD), BIM coordinator (BIM), Mechanical designer (MECH), Electrical Designer (ELEC), Plumbing Designer (PLUM), Other designers (OD), Geotechnical (GEO), Surveyor (SUR), Sustainability specialist (SUS), Transport specialist (TRANS), Construction representative planner (PLAN).
Table 2.
Social network metrics.
It is important to note that the Interaction Quality Index (IQI) scores were not empirically collected from the design team members in Herrera et al. [14]. Instead, the scores were assigned within a controlled simulation environment, using the developed rubric as the basis for generating input values. This approach ensured consistency across the analysis and enabled the validation of the proposed index under standardized conditions. Consequently, the reported outcomes should be interpreted as simulation-based rather than as direct measurements from team members. To analyze the case study, first, ideal metrics were calculated, where all existing interactions were rated as “excellent,” corresponding to a score of 1.0 for all linked pairs. Second, a Monte Carlo simulation was performed to examine how the various metrics behave under different levels of quality of the interaction characteristics. To achieve this, random values were assigned to the quality of the interactions (scores associated with the rubric), and utilizing the R software version 4.5.1, 10,000 social networks were created, assuming the existence of interaction between two individuals, as shown in Figure 1.
4. Results and Discussion
4.1. Characterization of Interactions Among Team Members in the AEC Industry
From the literature review, 15 characteristics describing the behavior of professionals in the AEC industry were identified: sympathy, meta-perception, information flow, leadership, friendliness, psychological safety, interdependence, job loyalty, humor, personal values, coordination, space, trust, collaboration, and learning. However, given the specific focus of the research on interaction, only seven characteristics were selected, focusing on relationships between two or more people (Table 3), while the remaining eight centered on individual traits of overall team dynamics. Although the fifteen characteristics identified in the literature are all relevant to team dynamics, only seven were retained for the construction of the Interaction Quality Index. The guiding criterion was whether each characteristic could be operationalized as a direct and quantifiable driver of interaction quality in design teams. For example, while aspects such as sympathy and psychological safety are relational in nature, they were considered contextual enablers that support interaction quality but are difficult to translate into measurable interaction weights. In contrast, learning was retained because it is not merely an individual outcome but a collective capability that emerges from sustained collaboration and coordination, thereby directly influencing team interaction quality. This selection process ensures that the final dimensions included in the index are both theoretically grounded and practically measurable within the scope of Social Network Analysis and simulation. As these characteristics evolve throughout the lifespan of a team, their manifestation can be better understood through the stages of team development described in Section 3.2.
Table 3.
Description of characteristics focused on the interaction between professionals.
4.2. Team Development Stages in the AEC Industry
According to Tuckman [56], design teams go through sequential stages: forming, storming, norming, performing, and adjourning [57]. Each stage is associated with distinct patterns of interaction and emphasis on different team characteristics.
- Forming: members are introduced, the roles are still unclear, and interactions are polite but formal. Characteristics such as leadership and coordination are critical to setting direction and clarifying objectives.
- Storming: Conflicts emerge as individuals assert ideas and challenge approaches. Trust is still developing among team members, and collaboration may be hindered by competing perspectives. Effective leadership and conflict resolution are essential at this stage.
- Norming: Team norms, shared goals, and working relationships are established at this stage. Trust strengthens, collaboration improves, and coordination becomes more efficient.
- Performing: The team operates at a high level of efficiency, with strong interdependence, high trust, and fluid collaboration. Leadership becomes more facilitative than directive.
- Adjourning: The team disbands after objectives are achieved. Interactions focus on closure, knowledge transfer, and recognition of contributions.
Understanding these stages is essential because the presence and intensity of characteristics such as leadership, trust, coordination, and collaboration vary throughout the team’s life cycle. Recognizing these variations is crucial for interpreting the interaction quality assessed in Section 3.3.
4.3. Rubric for Assessing the Quality of Interactions
The assessment rubric enables the evaluation of the seven interaction characteristics within work teams in the AEC industry across four levels: poor, sufficient, good, or excellent. The rubric was created based on a literature review and then validated by a group of experts (Table 1). Table 4 shows the rubric for the evaluation of the quality of interaction characteristics among design team members.
Table 4.
Evaluation rubric for the quality of interaction characteristics among design team members.
4.4. Importance of the Dimensions of Interaction Between Design Team Members
By applying the AHP method, various weights were obtained for each characteristic or dimension. An 87.5% consensus was obtained among the responses of the expert group, which corresponds to a very high level of consensus [58,59]. The characteristic with the greatest importance according to the experts was collaboration (33.0%), followed by coordination (21.3%), trust (16.9%), and information flow (12.4%). This aligns with the findings of Galaz-Delgado et al. [4], who concluded that these characteristics represent the four primary challenges faced by construction project design teams. Considering these values, Equation (4) represents Equation (1), incorporating the importance of each characteristic in the interaction process.
where IQI represents the quality of the link between two people, it corresponds to the value according to the characteristics αi1 “information flow,” αi2 “leadership,” αi3 “interdependence,” αi4 “coordination,” αi5 “trust,” αi6 “collaboration,” and αi7 “learning.”
For the case study, the metrics described in Table 2 were calculated. First, the metrics were calculated for the ideal case, where all seven interaction characteristics are excellent (1.0) among all existing links in the case study. Therefore, Table 5 presents the ideal values for each social network metric. Although the case study network was obtained from a real high-rise design project [14], the IQI scores applied to this network were not measured directly from the project participants. Instead, they were simulated based on the proposed rubric to test the methodological framework under controlled conditions. This distinction is essential, as it emphasizes that the benefits reported in this study stem from a simulation environment rather than from empirical assessments of collaboration, coordination, and trust within the team.
Table 5.
Ideal values for each metric in the case study.
Figure 2 illustrates the representation of node-level metrics across the 10,000 iterations, with varying values of “collaboration” and “coordination.” The histogram reflects random values for all characteristics, while the distribution curves depict the behavior of the metrics with fixed values for collaboration and coordination (1.0, 0.8, 0.5, and 0.2).
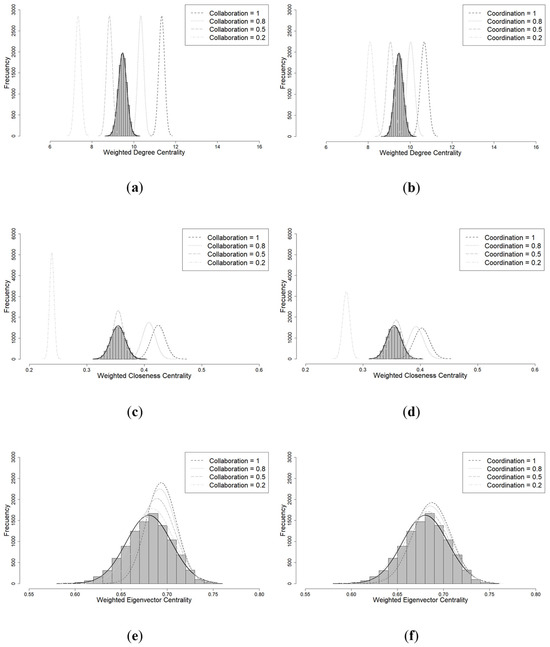
Figure 2.
Graph of node-level metrics: (a) weighted degree centrality: collaboration; (b) weighted degree centrality: coordination; (c) weighted closeness centrality: collaboration; (d) weighted closeness centrality: coordination; (e) weighted eigenvector centrality: collaboration; (f) weighted eigenvector centrality: coordination.
For the analysis, the relative frequency (fr) was used because it enables the expression of the percentage of occurrences of an event relative to the total number of events (in this case, 10,000 iterations). Figure 2a,b depict the weighted degree centrality, with the random data reaching its maximum frequency value at the coordinate (9.4661, fr = 0.1974). As the fixed values of collaboration and coordination quality decrease, the weighted degree centrality decreases. The ideal value of the degree centrality corresponds to 15.1429; with excellent collaboration, 74.9% of the ideal can be reached, while with poor collaboration, only 48.5% is reached. Similarly, when coordination is excellent, 70.5% of the ideal metric is reached, while with poor coordination, 53.5% is reached.
Figure 2c,d show the weighted closeness centrality, with the random data reaching its maximum frequency value at the coordinate (0.3543, fr = 0.1598). As collaboration and/or coordination increases, the closeness centrality will also increase, while the variability of the metric increases simultaneously. The ideal value of closeness centrality corresponds to 0.7305; that is, with the random interaction values, the closeness centrality corresponds to 48.50% of the ideal. When varying the collaboration value, with an excellent collaboration rating, the closeness centrality reaches 58.08% of the ideal value, while with poor collaboration, only 32.71% of the ideal value is reached. Similarly, with perfect coordination, it reaches 55.07% of the ideal, and with poor coordination, only 44.67%.
Figure 2e,f show the centrality of the random data vector, which reaches its maximum frequency value at coordinate (0.6801, fr = 0.1622). As collaboration or coordination increases, the eigenvector centrality increases. The ideal value of the eigenvector centrality corresponds to 0.7001, which means that, on average, with the interaction random values, the eigenvector centrality corresponds to 97% of the ideal. When varying the collaboration values (Figure 2e), the average eigenvector centrality value is 99% and 97% when collaboration corresponds to 1.0 and 0.2, respectively. Similarly, when varying the quality of coordination (Figure 2f), the average value reaches 98% when it is always excellent and 96% when it is always poor. Therefore, it can be concluded that the centrality of the eigenvector is not as sensitive to the quality of a single interaction characteristic, but rather it is sensitive to the complete set.
The weighted degree centrality analysis reveals a clear relationship between the quality of collaboration and coordination and the position of individuals within the team’s social network. Excellent collaboration and coordination show a strong association with higher network centrality, suggesting a higher level of influence and connectedness among team members. Conversely, poor collaboration and coordination result in lower network centrality, indicating a lack of effective communication and cohesion within the team. This is a very important aspect to consider when analyzing the performance of hierarchical structures such as in [22]. Additionally, analysis of weighted closeness centrality shows that as the quality of collaboration and coordination increases, so does closeness centrality, indicating greater connectivity and effective communication among team members. Furthermore, as the quality of collaboration and coordination improves, the variability in closeness centrality also increases, suggesting greater diversity in the levels of closeness among team members. Finally, the analysis of weighted eigenvector centrality reveals that, although this metric is not as sensitive to changes in a single interaction characteristic, an overall improvement in the quality of all interactions can have a positive impact on the position and influence of individuals within the team. There is a slight tendency toward an improvement in eigenvector centrality when collaboration and coordination are excellent compared to when they are poor, suggesting that effective collaboration and coordination can positively influence team cohesion and effectiveness. Maybe because it produces nodes highly connected to other nodes with high levels of influence, as mentioned by [17].
Overall, these findings underscore the importance of promoting a culture of effective collaboration and coordination within design teams in the AEC industry. An improvement in the quality of collaboration and coordination can not only increase the centrality and influence of individuals within the team but also improve the effectiveness and efficiency in the execution of construction projects. These results support the need to implement strategies and practices that foster a culture of teamwork and active collaboration to achieve successful construction project outcomes.
Figure 3 illustrates the network-level metrics of the 10,000 iterations, with varying values of collaboration and coordination. The histogram depicts random values for the characteristics, while the distribution curves show how the metrics behave when collaboration and coordination have fixed values (1.0, 0.8, 0.5, and 0.2).
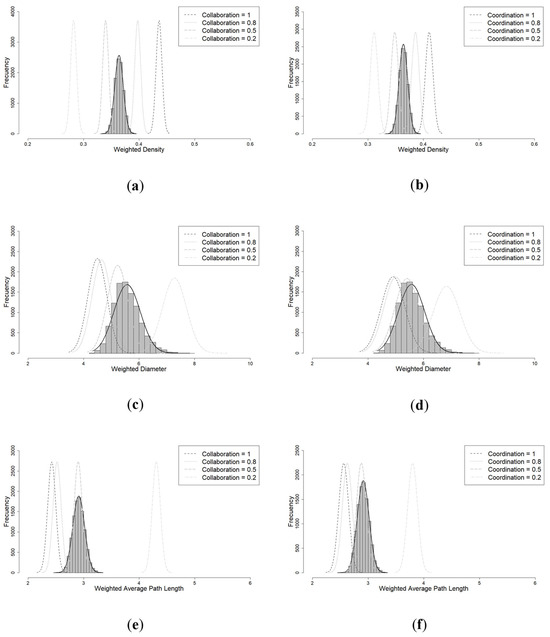
Figure 3.
Graph of network-level metrics: (a) weighted network density: collaboration; (b) weighted network density: coordination; (c) weighted network diameter: collaboration; (d) weighted network diameter: coordination; (e) weighted average path length: collaboration; (f) weighted average path length: coordination.
Figure 3a,b depict the density of the social networks, with the histogram with random data reaching its maximum frequency value at the coordinate (0.3641, fr = 0.2567). The ideal value of the density is 0.5824, indicating that on average, among all random networks, 63.5% of the ideal networks are reached. Varying the collaboration values (Figure 3a), with excellent collaboration, 75% of the ideal value is reached, and with poor collaboration, 48%. Similarly, the coordination values (Figure 3b) reach 70% and 53% of the ideal weighted density value when the density is excellent and poor in all links, respectively.
Figure 3c,d show the diameter for each social network, with the histogram with random data reaching its maximum frequency value at the coordinate (5.5702, fr = 0.1683). The ideal value of the diameter is 2, meaning that on average, the diameter of the network can increase more than twice its ideal value when the quality of interactions changes. Moreover, the diameter of the histogram varies between 4 and 8, indicating that the diameter can double or quadruple when the quality of interactions is not excellent. As shown in Figure 3c,d, the ranges of the network diameter do not vary significantly when changing only the quality of collaboration or coordination. In the case of collaboration quality, we observe diameters close to 3 in the best case, and in coordination, close to 4 in the best case. This shows that the diameter is strongly affected by the quality of interactions globally and that it is very sensitive to quality changes from excellent to good.
Figure 3e,f show the weighted average path length; the histogram with random data reaches its maximum frequency value at the coordinate (2.9127, fr = 0.1882). The ideal value of the weighted average path length is 1.4176. Therefore, when using random values for the quality of interactions, the weighted average path length increases to approximately double. This implies that for a person to succeed in having an interaction with another team member, it requires twice as much effort as if they were working with excellent interaction quality. When varying collaboration (Figure 3e), the average path length is 1.78 times the ideal when collaboration has excellent quality and 3 times the ideal if collaboration quality is poor. Similarly, when varying the coordination (Figure 3f), the value is 1.8 and 2.7 times the ideal when the coordination quality is excellent or poor, respectively.
The analysis of social network density reveals how the quality of collaboration and coordination is related to cohesion and connectivity within the team. It is observed that excellent collaboration and coordination are associated with higher network density, indicating a greater number of connections between team members. By contrast, poor collaboration and coordination mean lower network density, suggesting a lack of effective connections and poor communication among team members. In addition, the analysis of the network diameter provides information on the efficiency and communication distance within the team. It is observed that, when the quality of interactions is excellent, the network diameter tends to be smaller, suggesting shorter communication distances and higher efficiency in information transmission. Conversely, poor interaction quality is associated with an increase in network diameter, indicating longer communication distances and lower information flow efficiency within the team. Complementarily, the analysis of the weighted average path length provides information on the ease of communication and efficiency in the transmission of information within the team. It is observed that excellent collaboration quality and coordination are associated with lower weighted average path length, suggesting greater ease and efficiency in communication among team members, which is supported by [24]. However, both distance metrics (diameter and path length) are less sensitive to changes in a single characteristic, thus implying the need to improve the quality of interactions more generally.
Taken together, these results highlight the importance of promoting a culture of effective collaboration and coordination within design teams in the AEC industry. An increase in the density and efficiency of communication within the team generates improvement in the quality of collaboration and coordination, as established by [45,46,47], but also reduces the distance and difficulty in transmitting information, which can lead to greater effectiveness and efficiency in the execution of construction projects. These findings support the need to implement strategies and practices that foster a culture of teamwork and active collaboration to achieve successful outcomes on construction projects.
5. Conclusions
This research sought to identify which characteristics affect the interactions between design teams, measure the importance of these characteristics, and analyze how the interactions between professionals vary by assigning different levels of quality to the characteristics of the interactions in a case study. An initial literature review identified seven key characteristics on which the interaction between design teams in building projects depends: information flow, leadership, interdependence, trust, learning, collaboration, and coordination. A second literature review revealed that the seven characteristics are not only relevant to design teams but also to work teams in general, suggesting that the information gathered may be useful to other professionals and that the rubric developed can be extrapolated to various industries and work teams. Subsequently, the experts who participated in the focus group highlighted that the most important characteristics of interactions between professionals in a design team are collaboration, coordination, and trust. An evaluation of various social network metrics determined that when the quality of the interaction characteristics improved, the value of the metrics also improved, approaching the ideal values. Metrics like weighted degree centrality, weighted closeness centrality, and weighted density proved most sensitive to changes in the quality of the most important interaction characteristics: collaboration, coordination, and trust. Conversely, weighted eigenvector centrality, weighted diameter, and weighted average path length demonstrated less sensitivity to changes in a single characteristic but rather to the overall improvement of all interaction features.
While this study was limited to the AEC industry in the design stage, parallels were drawn with applied research in fields such as health and politics. These areas also highlight the relevance of certain characteristics studied here for professionals to enhance their work performance. Therefore, this study can serve as a basis for further research assessing the quality of interactions in other sectors. Another limitation was that the case study only considered existing interactions in a design team, without accounting for the removal or absence of certain links, which could yield other behaviors in the social network and its metrics. Therefore, it is recommended that future research analyze different network typologies, considering both the existence and absence of certain links while also taking into account the variability of the quality of interactions. Additionally, it should be noted that the case study was based on a single high-rise building project, considered as a generic example of this type of construction. While the results can be reasonably extrapolated to other design teams working on high-rise building projects, caution is required when generalizing the findings to other types of construction projects. The composition, size, and professional diversity of design teams may differ substantially across sectors, which could influence the dynamics and quality of interactions. Therefore, further research is needed to apply and validate the Interaction-Quality Index in different project typologies to assess its robustness and broader applicability. A promising avenue for future research is the empirical validation of the Interaction-Quality Index. Applying the rubric across multiple real-world project teams and calculating actual IQI scores would allow examining correlations with key performance outcomes such as rework rates, cost overruns, and schedule deviations. Such studies would not only strengthen the robustness of the proposed index but also provide practitioners with actionable evidence to guide design management strategies.
Author Contributions
Conceptualization, M.S.-M. and R.F.H.; methodology, R.F.H.; software, M.S.-M.; validation, R.F.H., T.C. and L.A.S.; formal analysis, M.S.-M. and R.F.H.; investigation, T.C. and L.A.S.; writing—original draft preparation, M.S.-M. and R.F.H.; writing—review and editing, T.C. and L.A.S.; supervision, R.F.H. and L.A.S.; funding acquisition, R.F.H. All authors have read and agreed to the published version of the manuscript.
Funding
This research received ANID Fondecyt Iniciación 11230455.
Conflicts of Interest
The authors declare no conflicts of interest.
Abbreviations
The following abbreviations are used in this manuscript:
| AEC | Architecture, Engineering, and Construction |
| SNA | Social Network Analysis |
| IQI | Interaction Quality Index |
| PhD. | Philosophy Doctorate |
| AHP | Analytic Hierarchy Process |
| BIM | Building Information Modeling |
References
- Schöttle, A.; Haghsheno, S.; Gehbauer, F. Defining Cooperation and Collaboration in the Context of Lean Construction. In Proceedings of the 22nd Annual Conference of the International Group for Lean Construction, Oslo, Norway, 25–27 June 2014; pp. 1269–1280. [Google Scholar]
- Weber, R.A.; Camerer, C.F. Cultural Conflict and Merger Failure: An Experimental Approach. Manag. Sci. 2003, 49, 400–415. [Google Scholar] [CrossRef]
- Buvik, M.P.; Rolfsen, M. Prior Ties and Trust Development in Project Teams—A Case Study from the Construction Industry. Int. J. Proj. Manag. 2015, 33, 1484–1494. [Google Scholar] [CrossRef]
- Galaz-Delgado, E.I.; Herrera, R.F.; Atencio, E.; Muñoz-La Rivera, F.; Biotto, C.N. Problems and Challenges in the Interactions of Design Teams of Construction Projects: A Bibliometric Study. Buildings 2021, 11, 461. [Google Scholar] [CrossRef]
- Herrera, R.F.; Mourgues, C.; Alarcón, L.F.; Pellicer, E. Comparing Team Interactions in Traditional and BIM-Lean Design Management. Buildings 2021, 11, 447. [Google Scholar] [CrossRef]
- Herrera, R.F.; Alarcón, L.F. Social Network Analysis to Support Implementation and Understanding of Lean Construction. In Lean Construction 4.0-Driving a Digital Revolution of Production Management in the AEC Industry; González, V.A., Hamzeh, F., Alarcón, L.F., Eds.; Routledge: London, UK, 2022; pp. 157–172. [Google Scholar]
- Kereri, J.O.; Harper, C.M. Trends in Social Network Research in Construction Teams: A Literature Review. In Proceedings of the Construction Research Congress 2018, New Orleans, Louisiana, 2–4 April 2018; American Society of Civil Engineers: Reston, VA, USA, 2018; pp. 115–125. [Google Scholar]
- Hickethier, G.; Tommelein, I.D.; Lostuvali, B. Social Network Analysis of Information Flow in an IPD-Project Design Organization. In Proceedings of the 21st Annual Conference International Group for Lean Construction, Fortaleza, Brazil, 29 July 2013; pp. 315–324. [Google Scholar]
- Newman, M.E.J. Analysis of Weighted Networks. Phys. Rev. E 2004, 70, 056131. [Google Scholar] [CrossRef]
- Bellingeri, M.; Bevacqua, D.; Scotognella, F.; Alfieri, R.; Nguyen, Q.; Montepietra, D.; Cassi, D. Link and Node Removal in Real Social Networks: A Review. Front. Phys. 2020, 8, 228. [Google Scholar] [CrossRef]
- Barthélemy, M.; Barrat, A.; Pastor-Satorras, R.; Vespignani, A. Characterization and Modeling of Weighted Networks. Phys. A Stat. Mech. Its Appl. 2005, 346, 34–43. [Google Scholar] [CrossRef]
- Zhang, L.; Cheng, J. Effect of Knowledge Leadership on Knowledge Sharing in Engineering Project Design Teams: The Role of Social Capital. Proj. Manag. J. 2015, 46, 111–124. [Google Scholar] [CrossRef]
- du Preez, M. Exploring Contexts in Consulting Engineers’ Collaborative Information Behaviour. J. Librariansh. Inf. Sci. 2019, 51, 643–653. [Google Scholar] [CrossRef]
- Herrera, R.F.; Mourgues, C.; Alarcón, L.F.; Pellicer, E. Understanding Interactions between Design Team Members of Construction Projects Using Social Network Analysis. J. Constr. Eng. Manag. 2020, 146, 04020053. [Google Scholar] [CrossRef]
- Herrera, R.F.; Galaz-Delgado, E.I.; Atencio, E.; Muñoz-La Rivera, F.; Castillo, T. Assessment Model of Interactions Required in Design Teams in High-Rise Building Projects. Mathematics 2023, 11, 3073. [Google Scholar] [CrossRef]
- Kereri, J.O.; Harper, C.M. Social Networks and Construction Teams: Literature Review. J. Constr. Eng. Manag. 2019, 145, 10. [Google Scholar] [CrossRef]
- Cherven, K. Mastering Gephi Network Visualization, 2nd ed.; Packt Publishing: Birminham, UK, 2015; ISBN 978-1783987344. [Google Scholar]
- Easley, D.; Kleinberg, J. Networks, Crowds, and Markets: Reasoning About a Highly Connected World; Cambridge University Press: New York, NY, USA, 2010; ISBN 9780521195331. [Google Scholar]
- Scott, J. Social Network Analysis, 3rd ed.; SAGE Publications Inc.: Thousand Oaks, CA, USA, 2013; ISBN 978-1446209042. [Google Scholar]
- Pryke, S. Social Network Analysis in Construction; Wiley-Blackwell: Chichester, UK, 2012; ISBN 978-1-118-34391-3. [Google Scholar]
- Zeffane, R.; Tipu, S.A.; Ryan, J.C. Communication, Commitment & Trust: Exploring the Triad. Int. J. Bus. Manag. 2011, 6, 77–87. [Google Scholar] [CrossRef]
- Jaramillo, K.; Castillo, T.; Zarate, A.; Andrade, A.; Herrera, R. Statistics on Small Networks in Construction Design Offices. Civ. Eng. J. 2025, 11, 818–833. [Google Scholar] [CrossRef]
- Castillo, T.; Herrera, R.F.; Alarcón, L.F. The Quality of Small Social Networks and Their Performance in Architecture Design Offices. J. Constr. Eng. Manag. 2023, 149, 04022162. [Google Scholar] [CrossRef]
- Alarcón, D.M.; Alarcón, I.M.; Alarcón, L.F. Social Network Analysis: A Diagnostic Tool for Information Flow in the Aec Industry. In Proceedings of the 21st Annual Conference of the International Group for Lean Construction (IGLC 2013), Fortaleza, Brazil, 29 July–2 August 2013; Formoso, C.T., Tzortzopoulos, P., Eds.; pp. 947–956. [Google Scholar]
- Masero Moreno, I.C.; Camacho Peñalosa, M.E.; Vázquez Cueto, M.J. Cómo evaluar conocimientos y competencias en la resolución matemática de problemas en el contexto económico a través de rúbricas. Rev. Electron. Interuniv. Form. Profr. 2018, 21, 51–64. [Google Scholar] [CrossRef]
- Johns, R. One Size Doesn’t Fit All: Selecting Response Scales For Attitude Items. J. Elect. Public Opin. Parties 2005, 15, 237–264. [Google Scholar] [CrossRef]
- Sanz, B.; Sanz, M.; Zapata, R.; Encinas, M. Aplicación de técnicas AHP para la optimización de un modelo de evaluación de la gestión metrológica. In Proceedings of the XIII Congreso de Ingeniería de Organización (CIO 2009), Terrassa, Spain, 2–4 September 2009; pp. 143–148. [Google Scholar]
- Mayor, J.; Botero, S.; González-Ruiz, J.D. Modelo de decisión multicriterio difuso para la selección de contratistas en proyectos de infraestructura: Caso Colombia. Obras Proy. 2016, 20, 56–74. [Google Scholar] [CrossRef]
- Goepel, K.D. Implementing the Analytic Hierarchy Process as a Standard Method for Multi-Criteria Decision Making in Corporate Enterprises—A New AHP Excel Template with Multiple Inputs. In Proceedings of the International Symposium on the Analytic Hierarchy Process, Kuala Lumpur, Malaysia, 19–23 June 2013. [Google Scholar]
- Saaty, T.L. The Analytic Hierarchy Process; McGraw-Hill: New York, NY, USA, 1980. [Google Scholar]
- de Andrade, R.L.; Rêgo, L.C. The Use of Nodes Attributes in Social Network Analysis with an Application to an International Trade Network. Phys. A Stat. Mech. Its Appl. 2018, 491, 249–270. [Google Scholar] [CrossRef]
- Newman, M.E.J. Scientific Collaboration Networks. II. Shortest Paths, Weighted Networks, and Centrality. Phys. Rev. E 2001, 64, 016132. [Google Scholar] [CrossRef] [PubMed]
- Bihari, A.; Pandia, M.K. Eigenvector Centrality and Its Application in Research Professionals’ Relationship Network. In Proceedings of the 2015 International Conference on Futuristic Trends on Computational Analysis and Knowledge Management (ABLAZE), Noida, India, 25–27 February 2015; IEEE: Piscataway, NJ, USA; pp. 510–514. [Google Scholar]
- Hanneman, R.A.; Riddle, M. Introduction to Social Network Methods; University of California, Riverside: Riverside, CA, USA, 2005. [Google Scholar]
- Al Hattab, M.; Hamzeh, F. Using Social Network Theory and Simulation to Compare Traditional versus BIM–Lean Practice for Design Error Management. Autom. Constr. 2015, 52, 59–69. [Google Scholar] [CrossRef]
- Barrat, A.; Barthélemy, M.; Pastor-Satorras, R.; Vespignani, A. The Architecture of Complex Weighted Networks. Proc. Natl. Acad. Sci. USA 2004, 101, 3747–3752. [Google Scholar] [CrossRef]
- Pomim Valentim, M.L. Ambientes y Flujos de Información En Contextos Empresariales. Ibersid Rev. De Sist. De Inf. Y Doc. 2009, 3, 55–60. [Google Scholar] [CrossRef]
- Ramirez, A. Metodología para la mejora continua (Shingo) del sistema de construcción con prefabricados de concreto. Bachelor´s Thesis, Universiad Nacional de Ingeniería, Lima, Peru, 2014. Available online: http://hdl.handle.net/20.500.14076/4398 (accessed on 16 July 2025).
- Falbe, C.M.; Yukl, G. Consequences for Managers of Using Single Influence Tactics and Combinations of Tactics. Acad. Manag. J. 1992, 35, 638–652. [Google Scholar] [CrossRef]
- Kotter, J.P. El liderazgo de Matsushita: Lecciones del Empresario más Destacado del Siglo XX; Ediciones Granica S.A.: Buenos Aires, Argentina, 1998; ISBN 978-950-641-264-7. [Google Scholar]
- Elforgani, M.S.A.; Alabsi, A.A.N.; Alwarafi, A. Strategic Approaches to Design Teams for Construction Quality Management and Green Building Performance. Buildings 2024, 14, 2020. [Google Scholar] [CrossRef]
- Keyton, J.; Beck, S.J. Team Attributes, Processes, and Values: A Pedagogical Framework. Bus. Commun. Q. 2008, 71, 488–504. [Google Scholar] [CrossRef]
- Wageman, R. Interdependence and Group Effectiveness. Adm. Sci. Q 1995, 40, 145. [Google Scholar] [CrossRef]
- Morgeson, F.P.; Humphrey, S.E. The Work Design Questionnaire (WDQ): Developing and Validating a Comprehensive Measure for Assessing Job Design and the Nature of Work. J. Appl. Psychol. 2006, 91, 1321–1339. [Google Scholar] [CrossRef]
- Malone, T.W.; Crowston, K. What Is Coordination Theory and How Can It Help Design Cooperative Work Systems? In Proceedings of the 1990 ACM Conference on Computer-Supported Cooperative Work—CSCW ’90, Los Angeles, CA, USA, 7–10 October 1990; ACM Press: New York, NY, USA, 1990; pp. 357–370. [Google Scholar]
- Malone, T.W.; Crowston, K. The Interdisciplinary Study of Coordination. ACM Comput. Surv. 1994, 26, 87–119. [Google Scholar] [CrossRef]
- Herrera, R.; Castañeda, K. Development of a Collaborative Design Management System for Enhancing Building Project Efficiency. Rev. Ing. De Construcción 2024, 39, 1–12. [Google Scholar] [CrossRef]
- Demir, M.; McNeese, N.J.; Gorman, J.C.; Cooke, N.J.; Myers, C.W.; Grimm, D.A. Exploration of Teammate Trust and Interaction Dynamics in Human-Autonomy Teaming. IEEE Trans. Hum. Mach. Syst. 2021, 51, 696–705. [Google Scholar] [CrossRef]
- Doloi, H. Relational Partnerships: The Importance of Communication, Trust and Confidence and Joint Risk Management in Achieving Project Success. Constr. Manag. Econ. 2009, 27, 1099–1109. [Google Scholar] [CrossRef]
- Ding, Z.; Fai Ng, F.; Wang, J. The Mediation Role of Trust in Knowledge Sharing. Eng. Constr. Archit. Manag. 2013, 20, 604–619. [Google Scholar] [CrossRef]
- Manyathi, R.; Terblanche, R. Team Dynamics and Its Effect on the Design Process Within the Construction Industry. In Advances in Engineering Management, Innovation, and Sustainability, Proceedings of the 13th International Conference on Engineering, Project, and Production Management, Auckland, New Zealand, 29 November–1 December 2023, Volume 1; Rotini, J.O.B., Shahzad, W.M., Sutrisna, M., Kahandawa, R., Eds.; Lecture Notes in Civil Engineering, Volume 480; Springer: Cham, Switzerland, 2024; pp. 37–50. [Google Scholar]
- Camarinha-Matos, L.M.; Abreu, A. Performance Indicators for Collaborative Networks Based on Collaboration Benefits. Prod. Plan. Control 2007, 18, 592–609. [Google Scholar] [CrossRef]
- Bayhan, H.G.; Mollaoglu, S.; Frank, K.A. Team Collaborations during Times of Disruption: Transaction Costs and Social Network Perspective with Hierarchical Linear Modeling. In Proceedings of the Construction Research Congress 2024, Des Moines, IA, USA, 20–23 March 2024; American Society of Civil Engineers: Reston, VA, USA, 2024; pp. 701–710. [Google Scholar]
- Gambo, N.; Musonda, I.; Zadawa, A.N. Effects of Social Media Learning Environments on AEC Learning Process among University Students in Nigeria. Int. J. Constr. Educ. Res. 2023, 19, 99–127. [Google Scholar] [CrossRef]
- Wilson, R.A.; Keil, F.C. (Eds.) The MIT Encyclopedia of the Cognitive Sciences (MITECS); The MIT Press: Cambridge, MA, USA, 1999; ISBN 9780262338165. [Google Scholar]
- Tuckman, B.W. Developmental Sequence in Small Groups. Psychol. Bull. 1965, 63, 384–399. [Google Scholar] [CrossRef] [PubMed]
- Tuckman, B.W.; Jensen, M.A.C. Stages of Small-Group Development Revisited. Group Organ. Stud. 1977, 2, 419–427. [Google Scholar] [CrossRef]
- Goepel, K.D. Group Consensus Cluster Analysis Using Shannon Alpha and Beta Entropy. Preprint. 2022. Available online: https://bpmsg.com/wordpress/wp-content/uploads/2022/04/Goepel-Consensus-preprint.pdf (accessed on 20 August 2025).
- Goepel, K.D. Implementation of an Online Software Tool for the Analytic Hierarchy Process (AHP-OS). Int. J. Anal. Hierarchy Process 2018, 10, 469–487. [Google Scholar] [CrossRef]
Disclaimer/Publisher’s Note: The statements, opinions and data contained in all publications are solely those of the individual author(s) and contributor(s) and not of MDPI and/or the editor(s). MDPI and/or the editor(s) disclaim responsibility for any injury to people or property resulting from any ideas, methods, instructions or products referred to in the content. |
© 2025 by the authors. Licensee MDPI, Basel, Switzerland. This article is an open access article distributed under the terms and conditions of the Creative Commons Attribution (CC BY) license (https://creativecommons.org/licenses/by/4.0/).