Presentation of the Modal Analysis of the Integrated Vehicle-Seat-Virtual Mannequin (Operator) Assembly
In the present research, the analysis of the vibrational behavior of the self-propelled electric agricultural tractor, model TE-0, represents a critical step in evaluating the impact of vibrations on the operator.
Figure 1 shows the TE-0 electric tractor during operation on unprocessed grass-covered terrain, a typical agricultural work environment, which was used in the advanced, complex simulation. This advanced simulation enables the investigation of the interaction between vehicle-generated vibrations and their effects on operator comfort and health, contributing significantly to the advancement of more efficient and ergonomic solutions for electric agricultural vehicles [
41].
The selection of a grass-covered terrain for the vibration tests conducted in this study, as illustrated in
Figure 1, was based on both practical and statistical considerations, grounded in the predominant characteristics of surfaces commonly encountered in agricultural activities, such as greenhouses and farm fields. Grass-covered or short-vegetation terrains—similar to those found in protected agricultural environments (e.g., greenhouses)—provide a natural testbed that realistically simulates the operational conditions of a self-propelled agricultural vehicle (tractor type) used in delicate field operations.
According to several studies in the literature, grass-covered surfaces tend to generate lower levels of vibration, primarily due to the vegetation layer acting as a natural damping medium. Compared to hard surfaces such as asphalt or gravel, grass-covered terrain is capable of absorbing a significant portion of the vibrational energy, thereby reducing the transmission of vibrations to the vehicle and, consequently, to the operator.
For the purpose of this study, an uneven dirt road covered with grass was selected, characterized by a surface roughness value—determined using the sand patch method (Height of Sand, HS)—falling within the range of [0.2–0.6 mm]. This corresponds to a satisfactory rolling surface condition for conducting the experimental tests.
This electric tractor, a prototype developed by the research team of the National Institute of Agricultural Machinery (INMA) in Bucharest, was selected to explore the vibrational dynamics of electric vehicles in the context of emerging technologies and the transition toward more sustainable transport solutions.
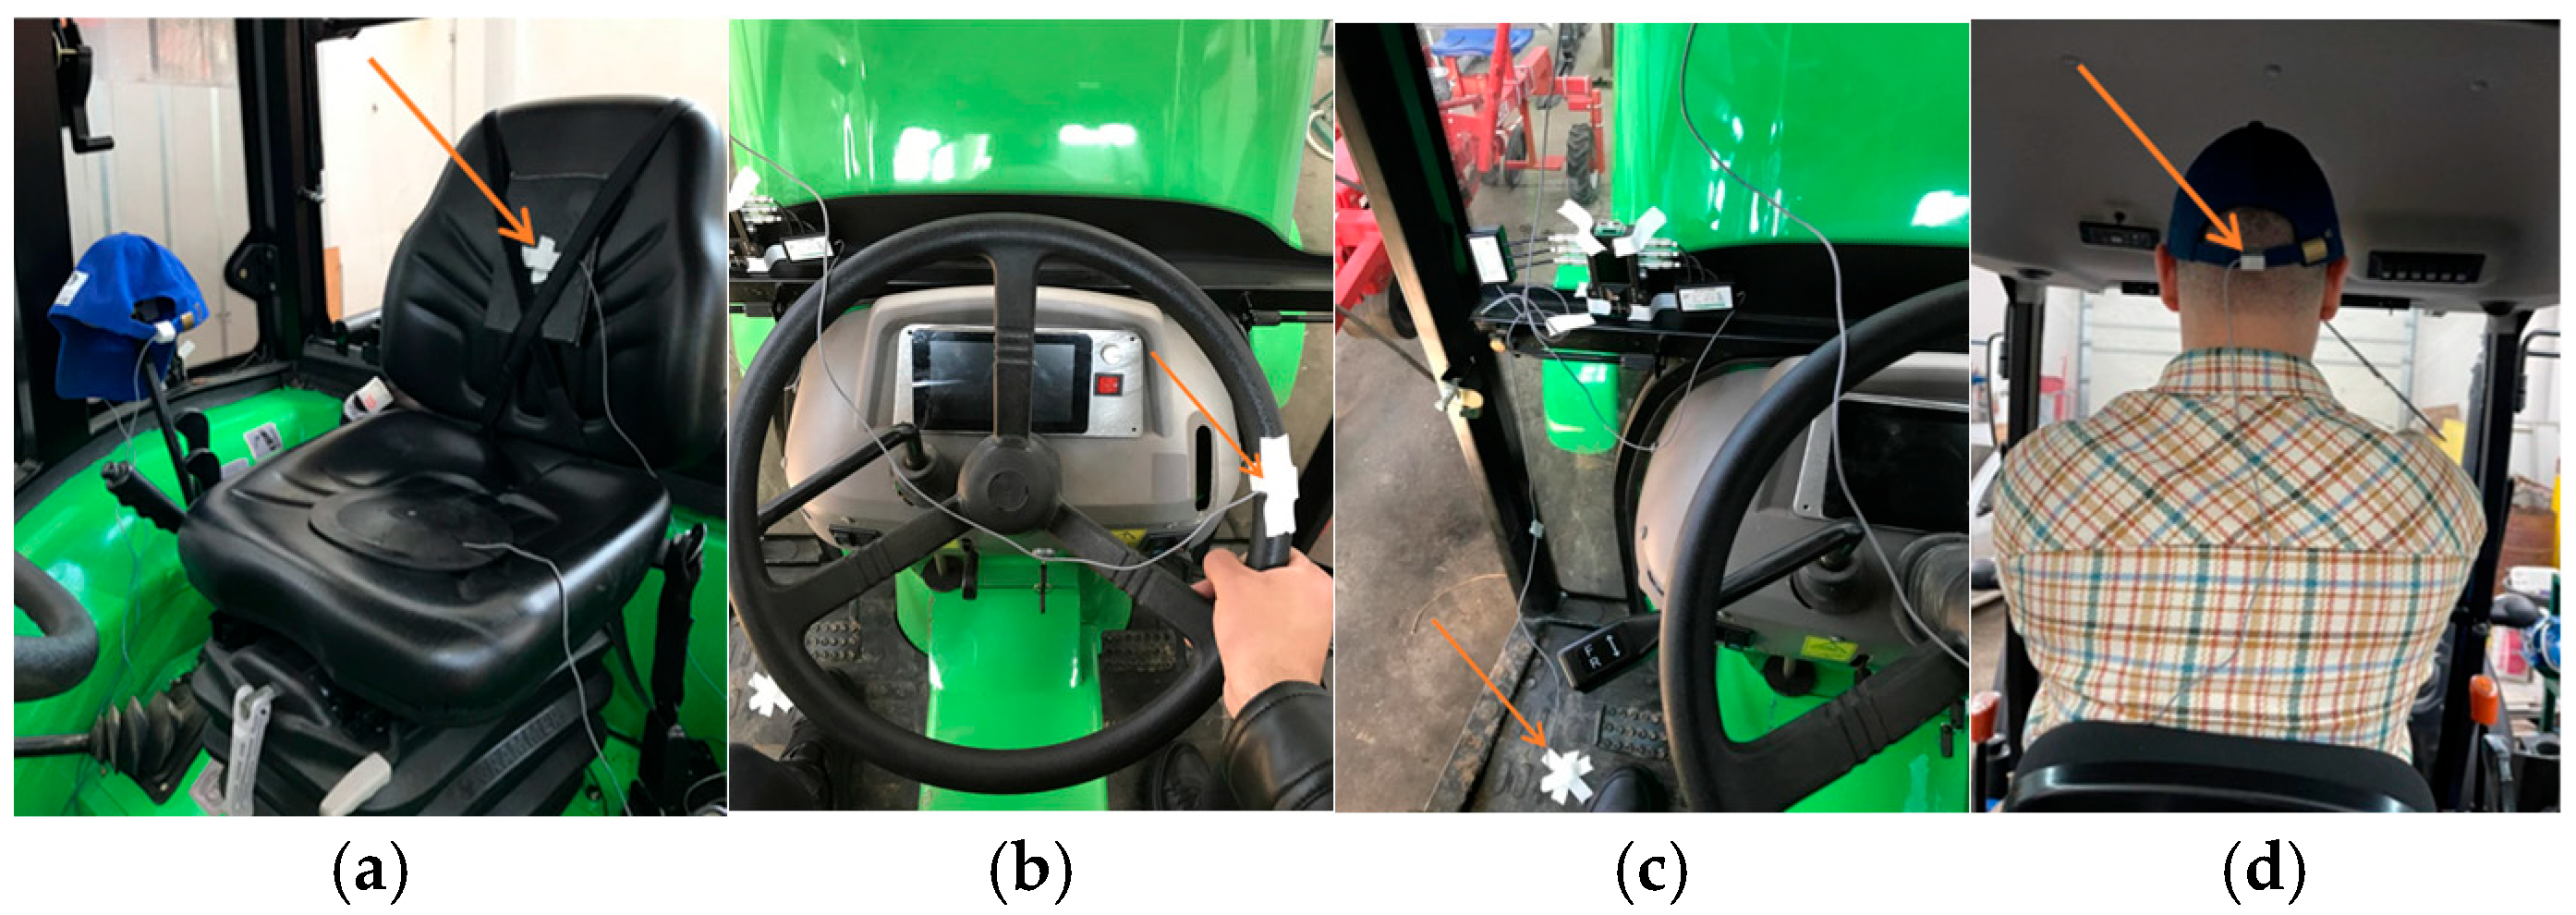
Physical measurements were conducted on unprocessed soil terrain covered with grass, at a constant travel speed of 7 km/h, using triaxial accelerometer sensors mounted at the seat cushion level, seat backrest, tractor steering wheel, cabin floor, and operator’s head, as shown in
Figure 2.
The TE-0 electric tractor model was created using SolidWorks software [
42], and upon completion of the design process, it was imported into the advanced simulation software Altair Sim Solid [
43].
The modal analysis of the TE-0 electric tractor model was selected in order to understand and evaluate the vibrational behavior of this vehicle in the context of operator exposure to mechanical vibrations. Given current technological trends and the transition toward electric vehicles, it is essential to investigate how the TE-0 electric tractor behaves from a vibrational standpoint, in order to identify the natural frequencies and vibration modes that may affect the comfort and health of the driver.
This type of analysis allows for the identification of potential resonance phenomena and amplification effects that could increase the risk of discomfort and musculoskeletal disorders, thus providing a foundation for optimizing the vehicle design and protecting the operator.
The TE-0 electric tractor was designed using SolidWorks software.
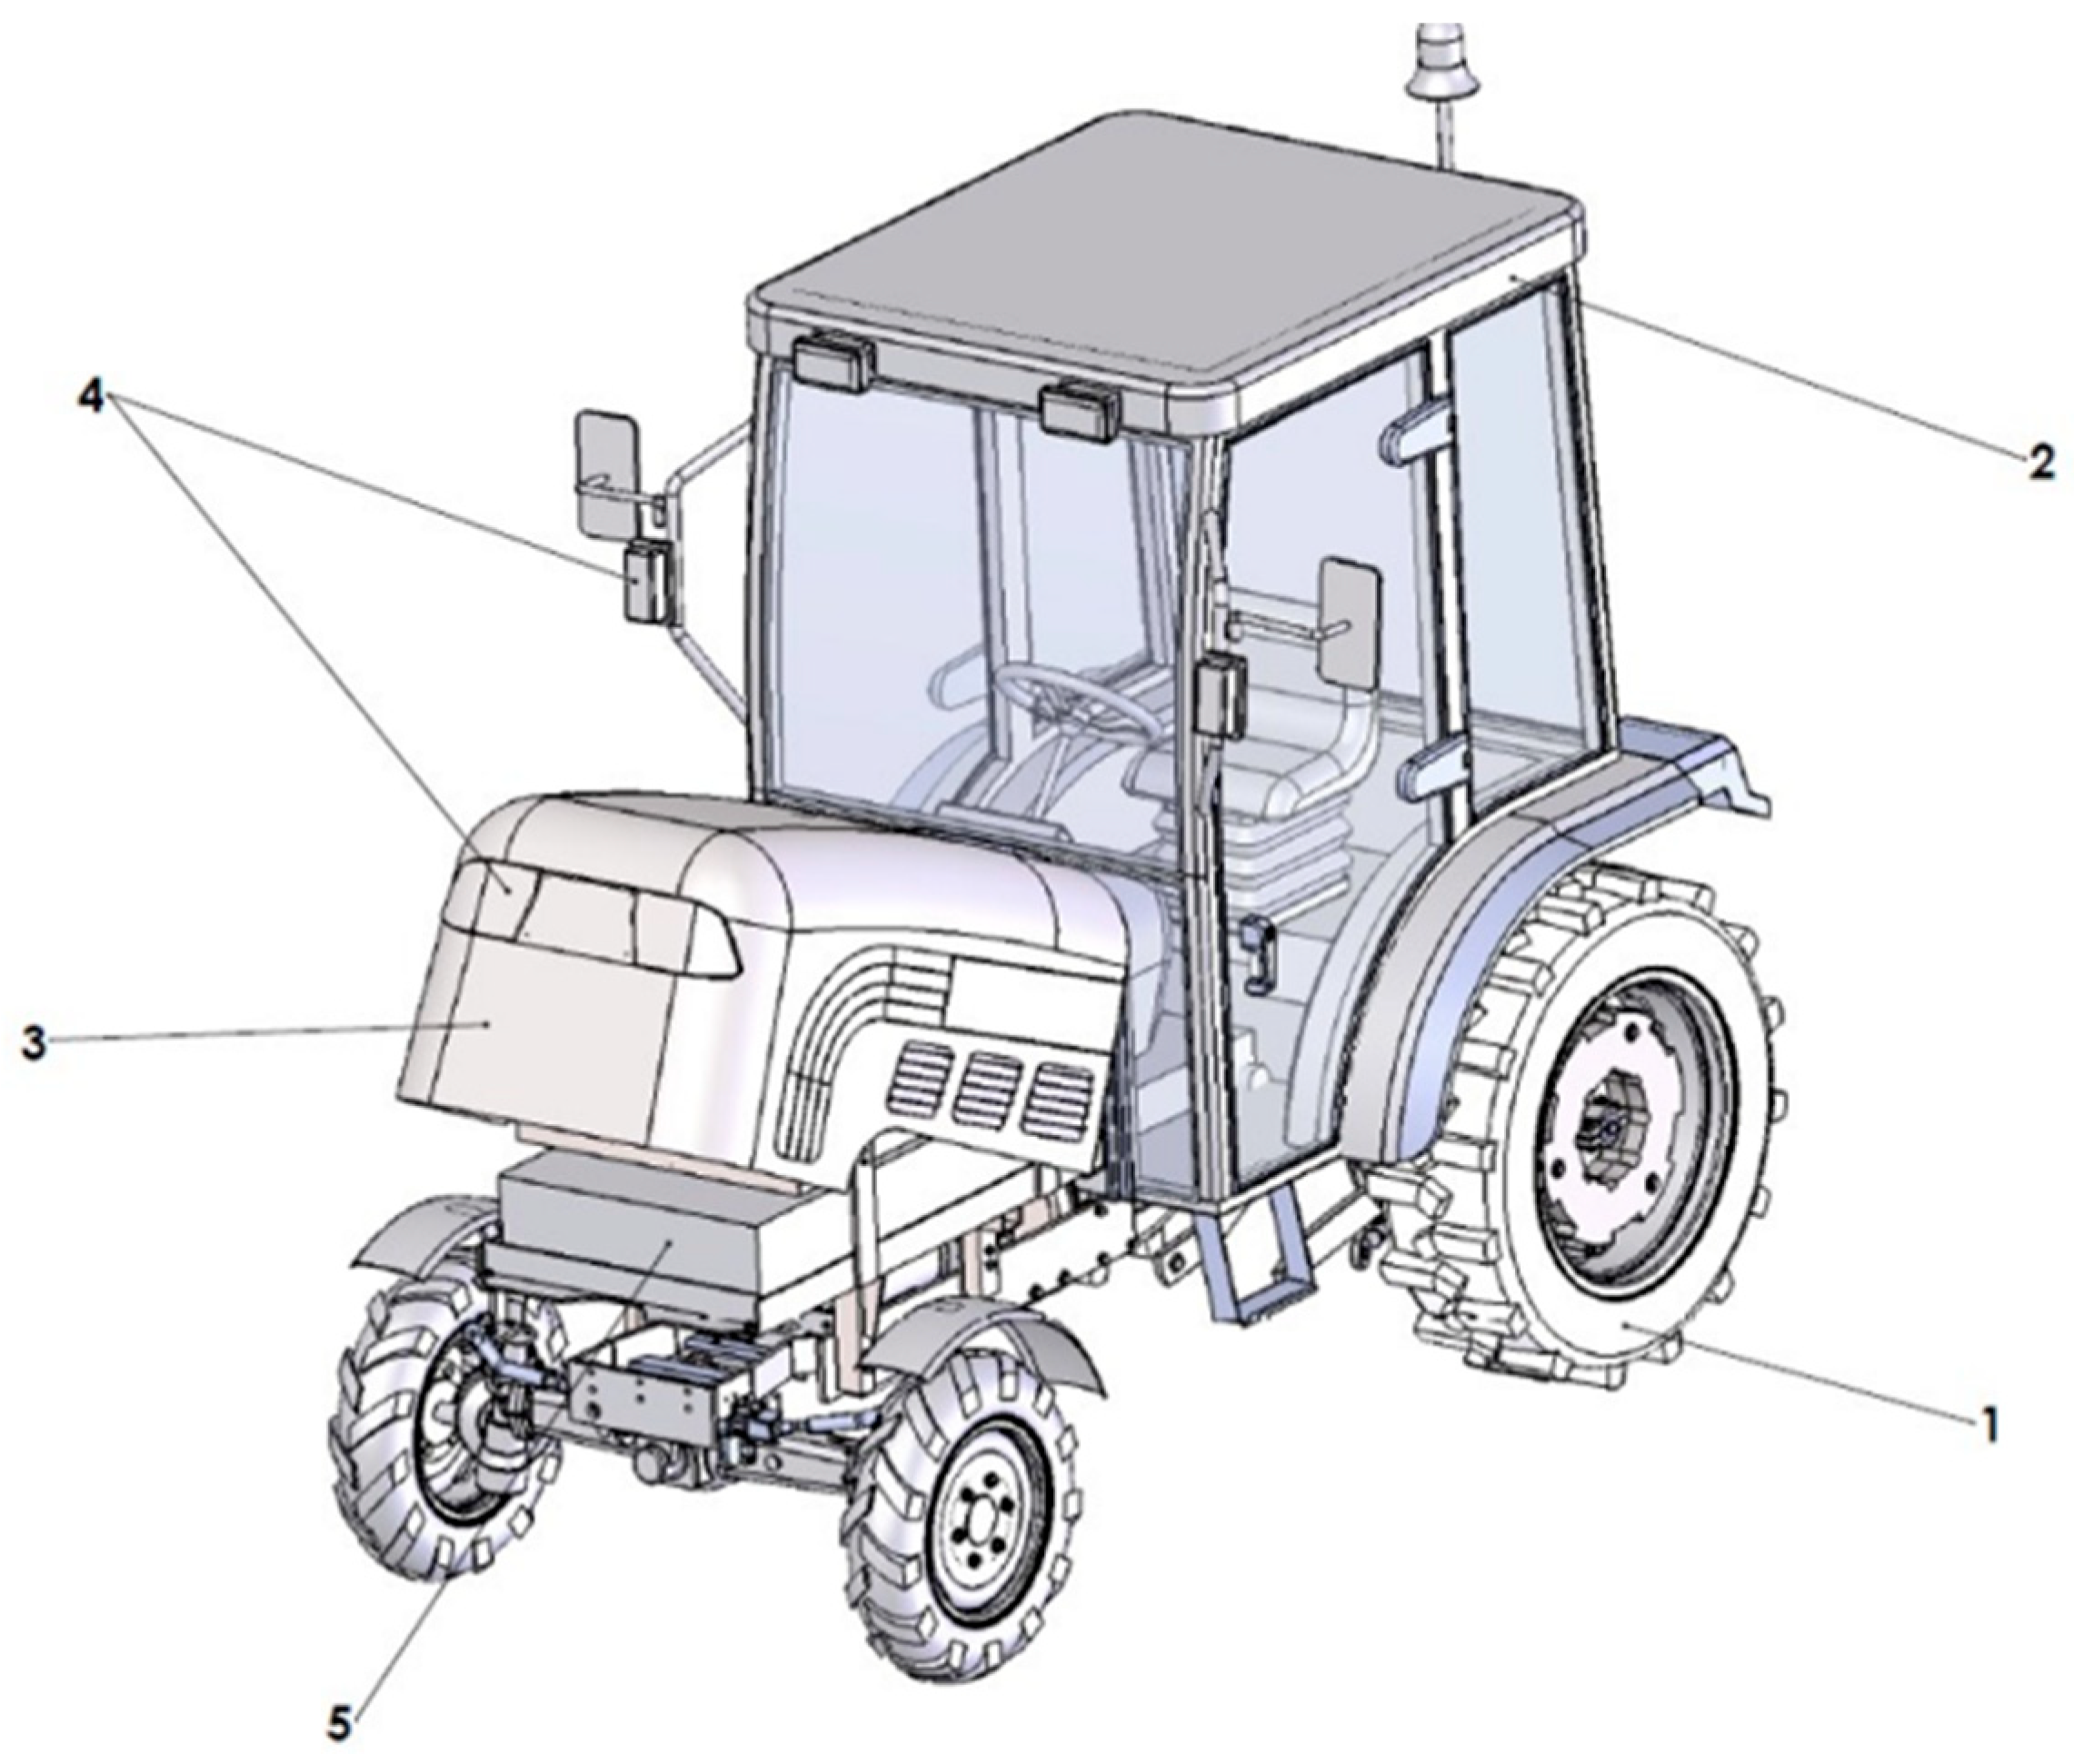
The main assemblies of the electric tractor are shown in
Figure 3, as follows:
1—Running gear; 2—Cabin; 3—Engine hood; 4—Lighting and signaling system; 5—Electric drive system.
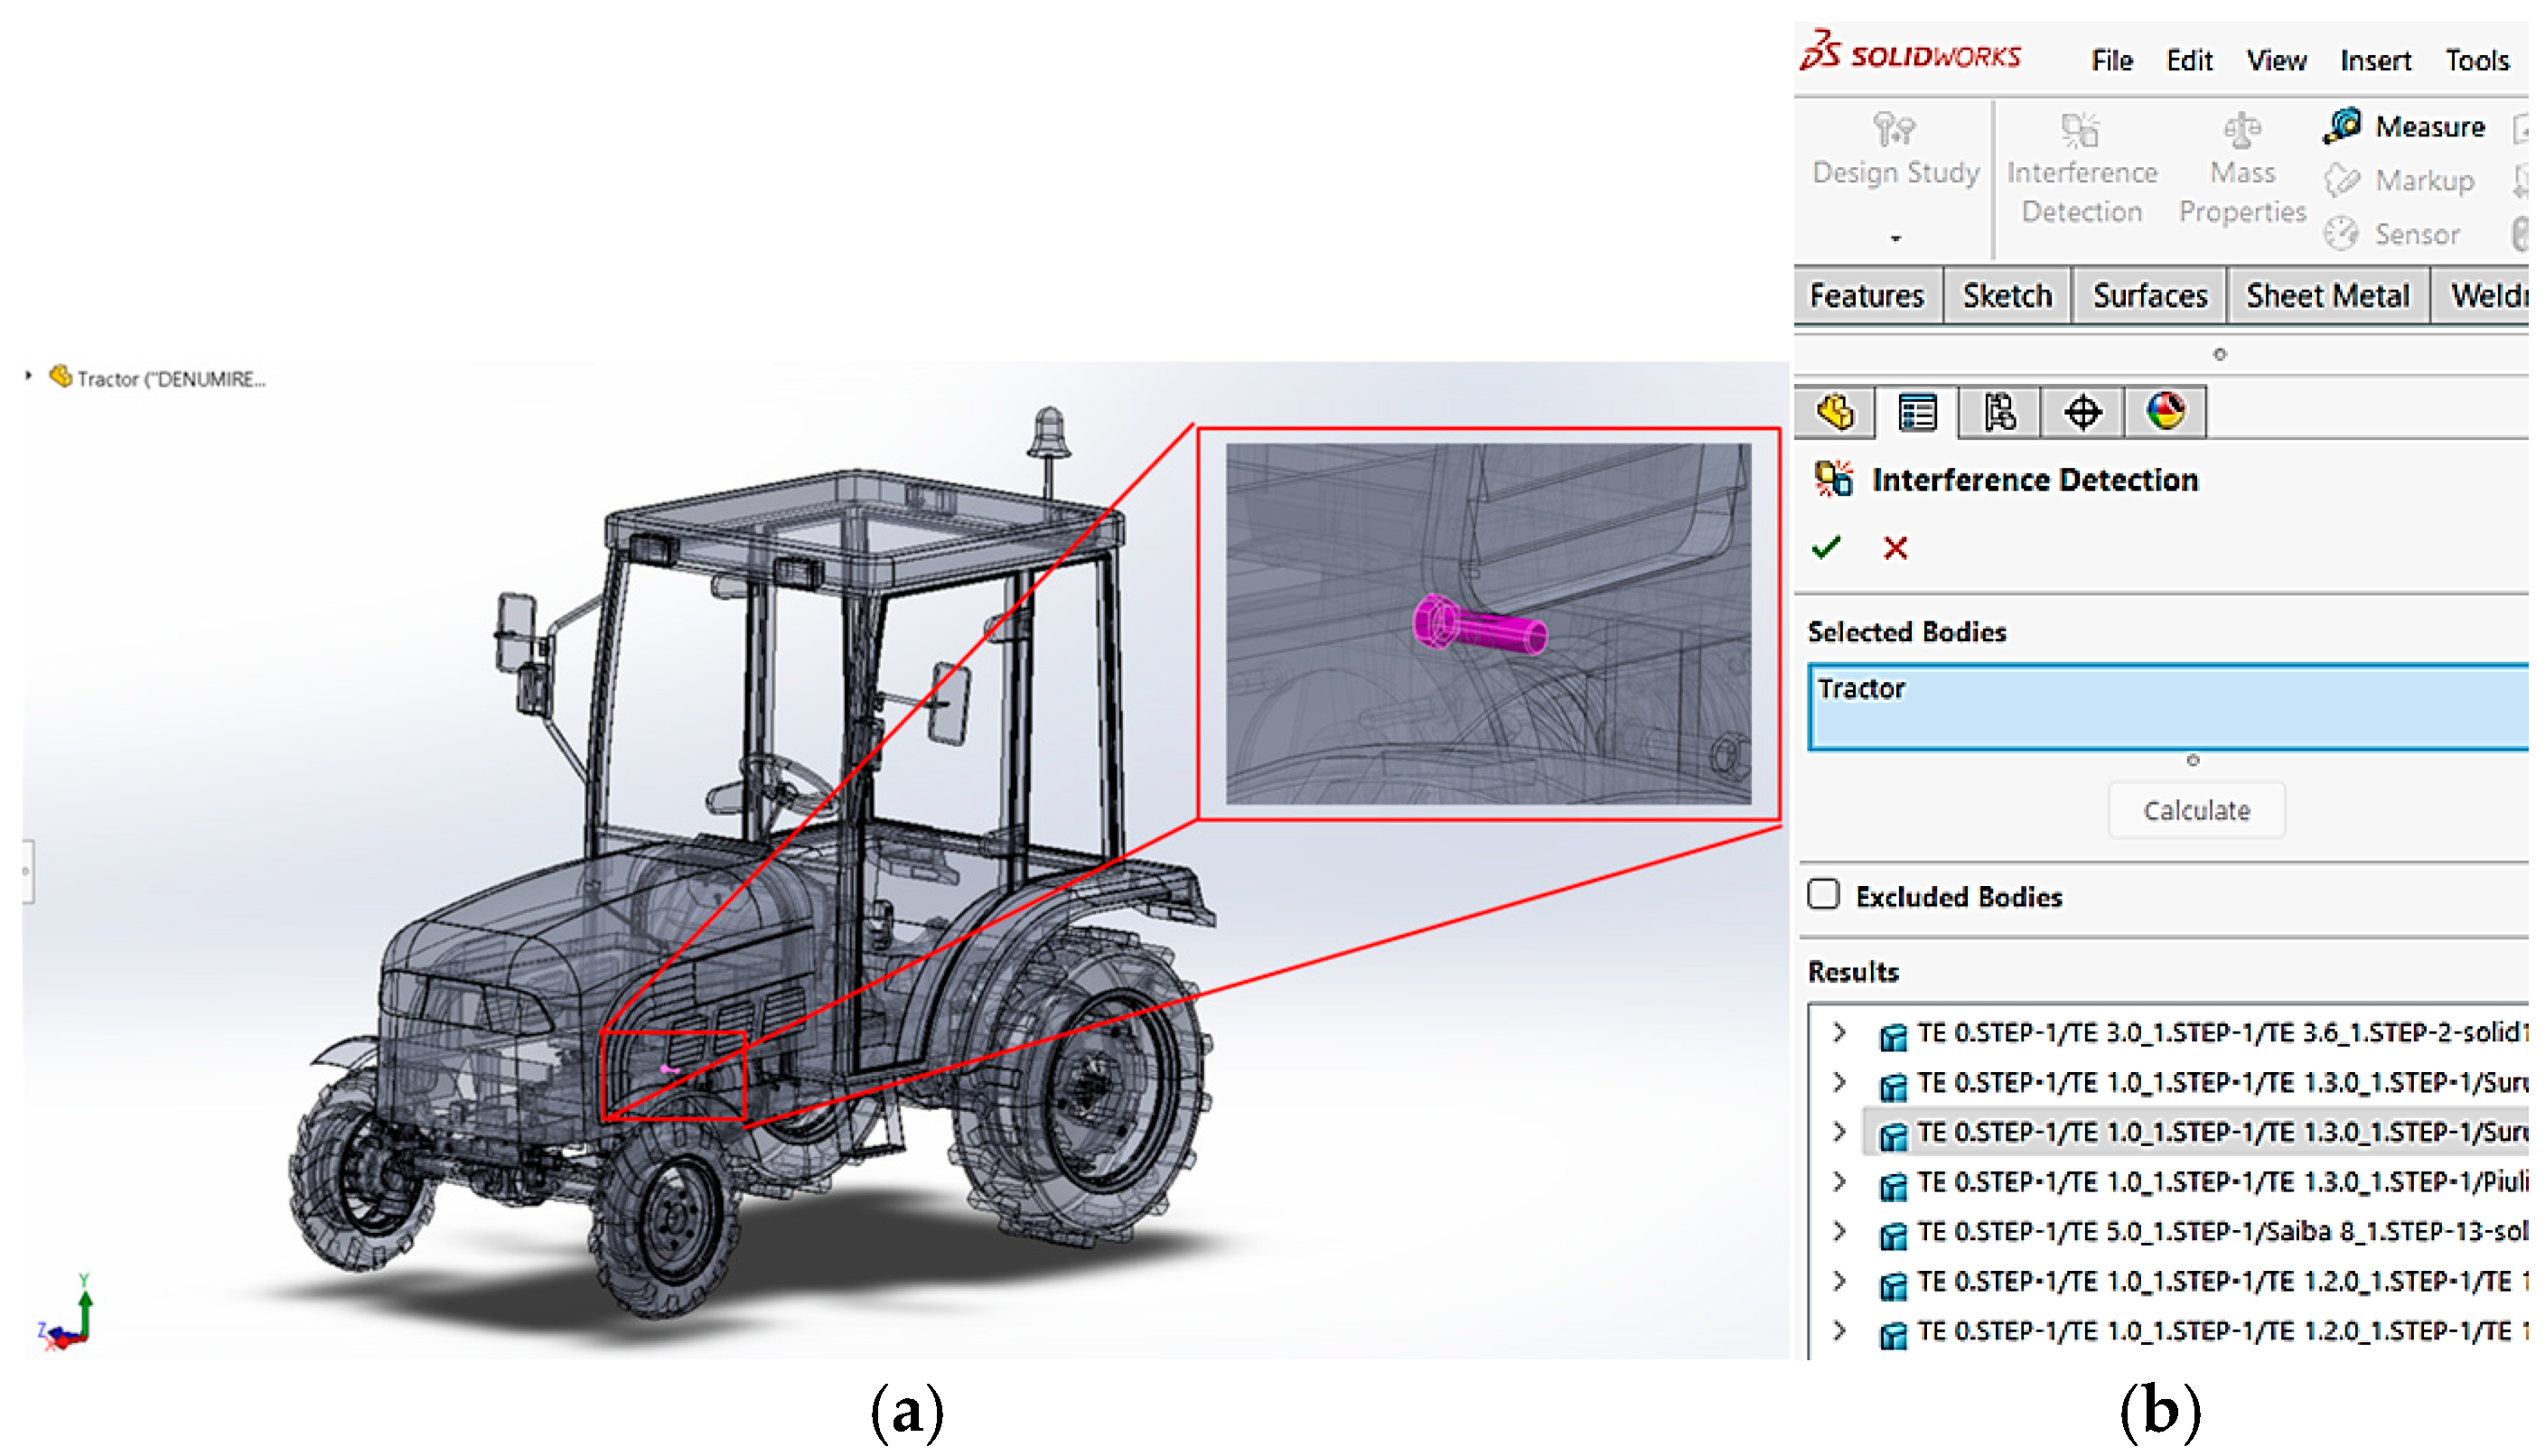
To initiate the modal analysis, the electric tractor model was carefully checked for interferences and clearances between parts in SolidWorks using the “Evaluate” tab, specifically the “Interference Detection” and “Clearance Verification” tools.
An example of interference detection is shown in
Figure 4, where (a) illustrates the interference detection result, and (b) shows the selection of the part for which the interference check was performed.
Minor errors identified in the model were corrected, and certain components—such as window seals, glass elements, and headlamp lenses—were excluded from the analysis. These components were omitted in order to avoid post-processing errors and to reduce the overall processing time, without compromising the accuracy of the results.
The virtual model of the TE-0 electric tractor was exported from SolidWorks to Altair Sim Solid, one of the most advanced simulation platforms based on the finite element method, recently developed by Altair.
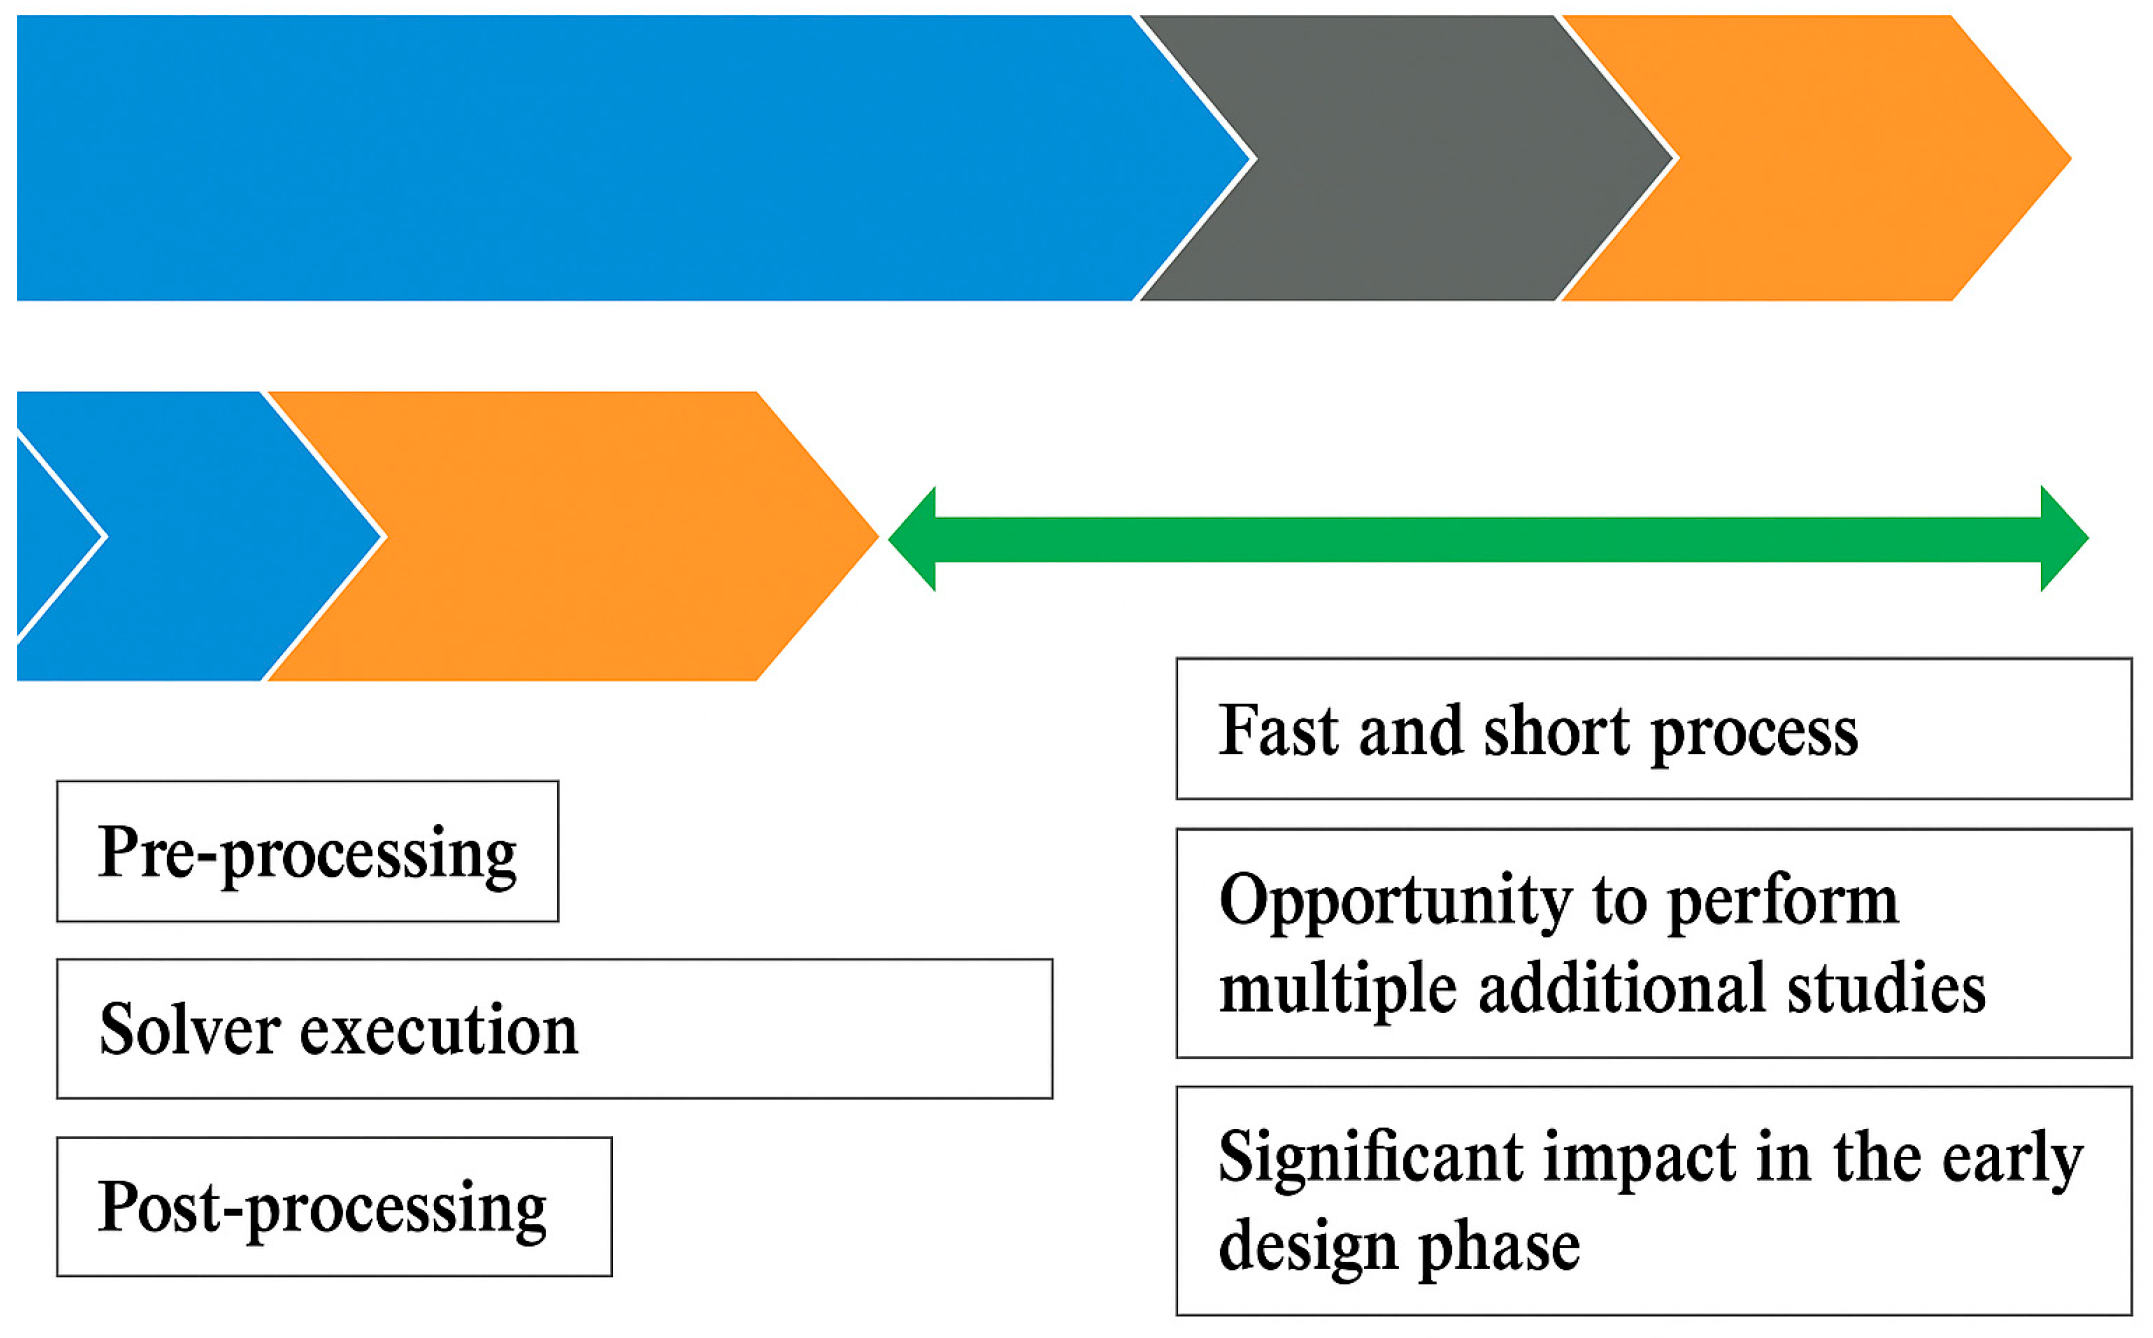
This modern solution enables accurate and efficient analyses without the need for generating a traditional finite element mesh, thus allowing fast and complex simulations of large structures and detailed geometries.
Altair Sim Solid is an advanced simulation software capable of performing static, dynamic, and thermal analyses of complex structural systems. Unlike traditional methods, Sim Solid works directly with fully detailed solid geometry models, eliminating the need for geometry simplification and the generation of a finite element mesh.
The computational algorithm used by Altair Sim Solid is illustrated in
Figure 5 and is based on innovative extensions of the theory of external approximations, which represents an advanced generalization of the finite element method (FEM) because:
Arbitrary geometric shapes can be used as “finite elements.”
After a brief functional description,
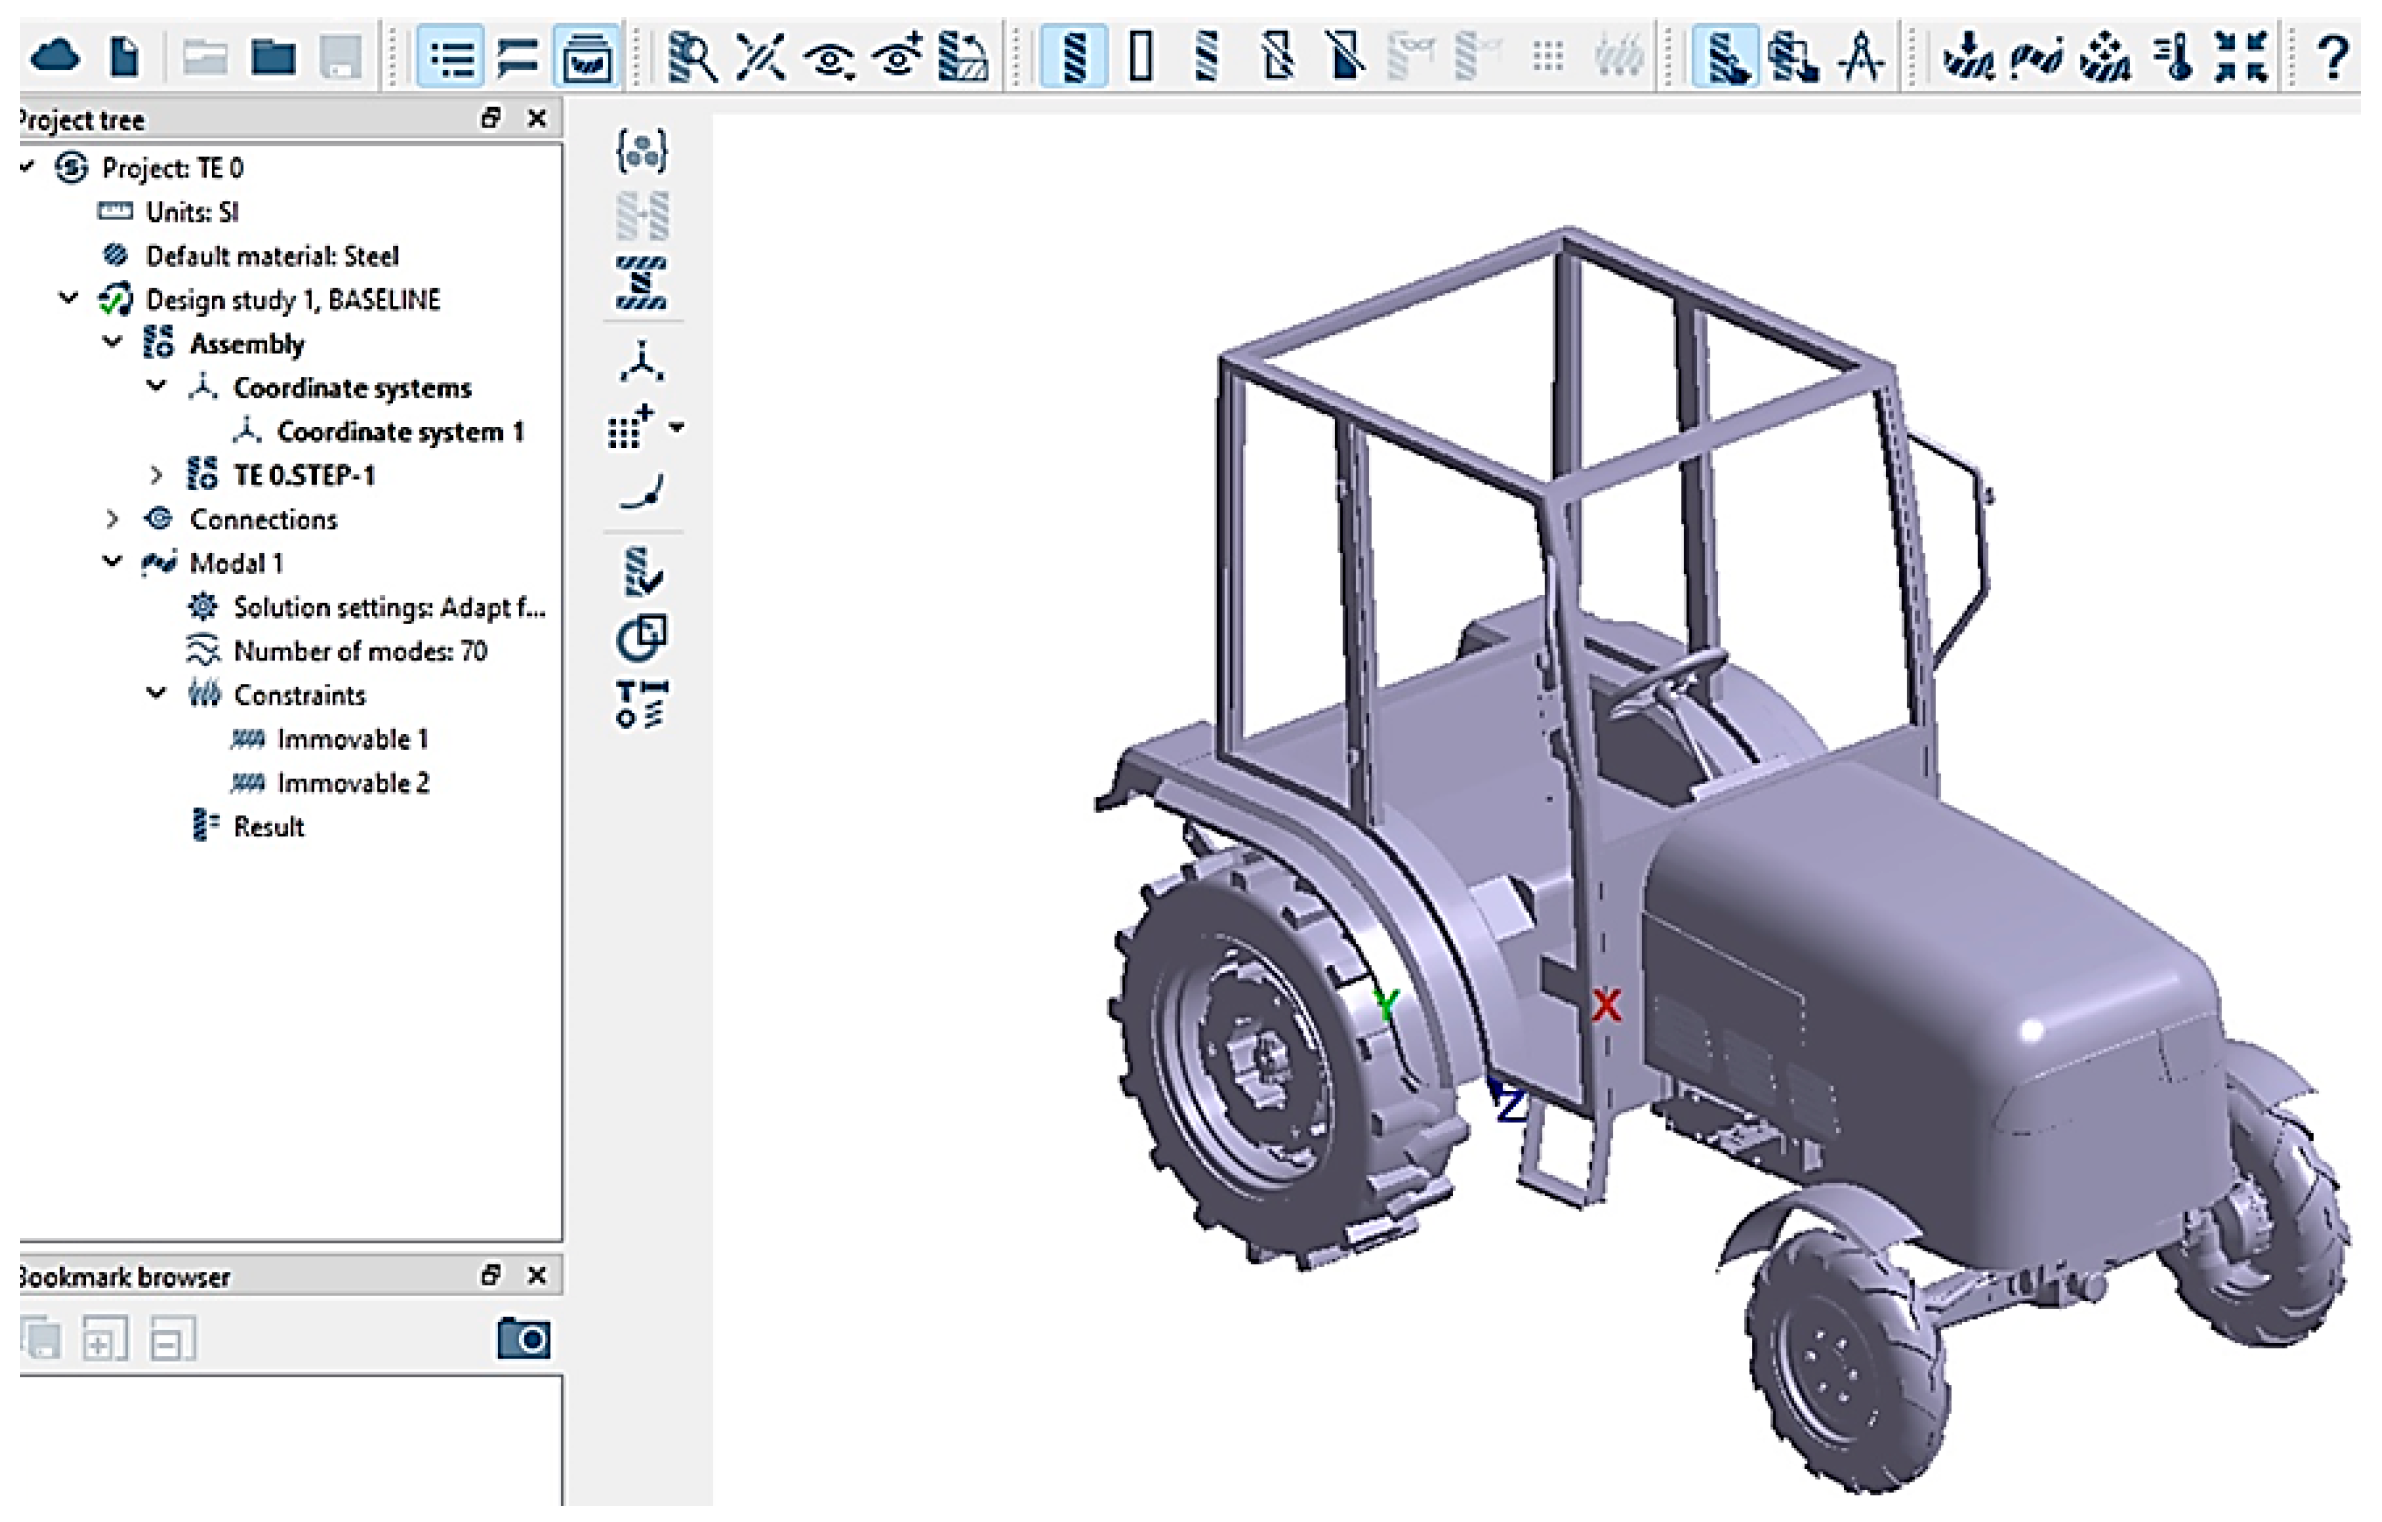
Figure 6 illustrates the practical application of the Altair Sim Solid software, highlighting the essential elements of the user interface. These illustrations present the main functionalities, including the main menu structure, the project tree, and the user interaction workflow within the simulation environment, providing a clear understanding of the simulation setup and execution process.
The definition and analysis of connections is a crucial step in ensuring the structural integrity and coherence of the virtual model of the electric tractor. During this process, all components of the assembly are analyzed to determine the mechanical interactions between them. A total of 2480 connections were identified and verified, ensuring that each part of the model functions correctly within the context of the simulations.
In
Figure 7, the Altair Sim Solid software displays the visualization of all connections within the TE-0 electric tractor assembly.
This graphical representation allows the user to quickly and efficiently verify how the tractor components are interconnected and to identify potential critical points or structural inconsistencies.
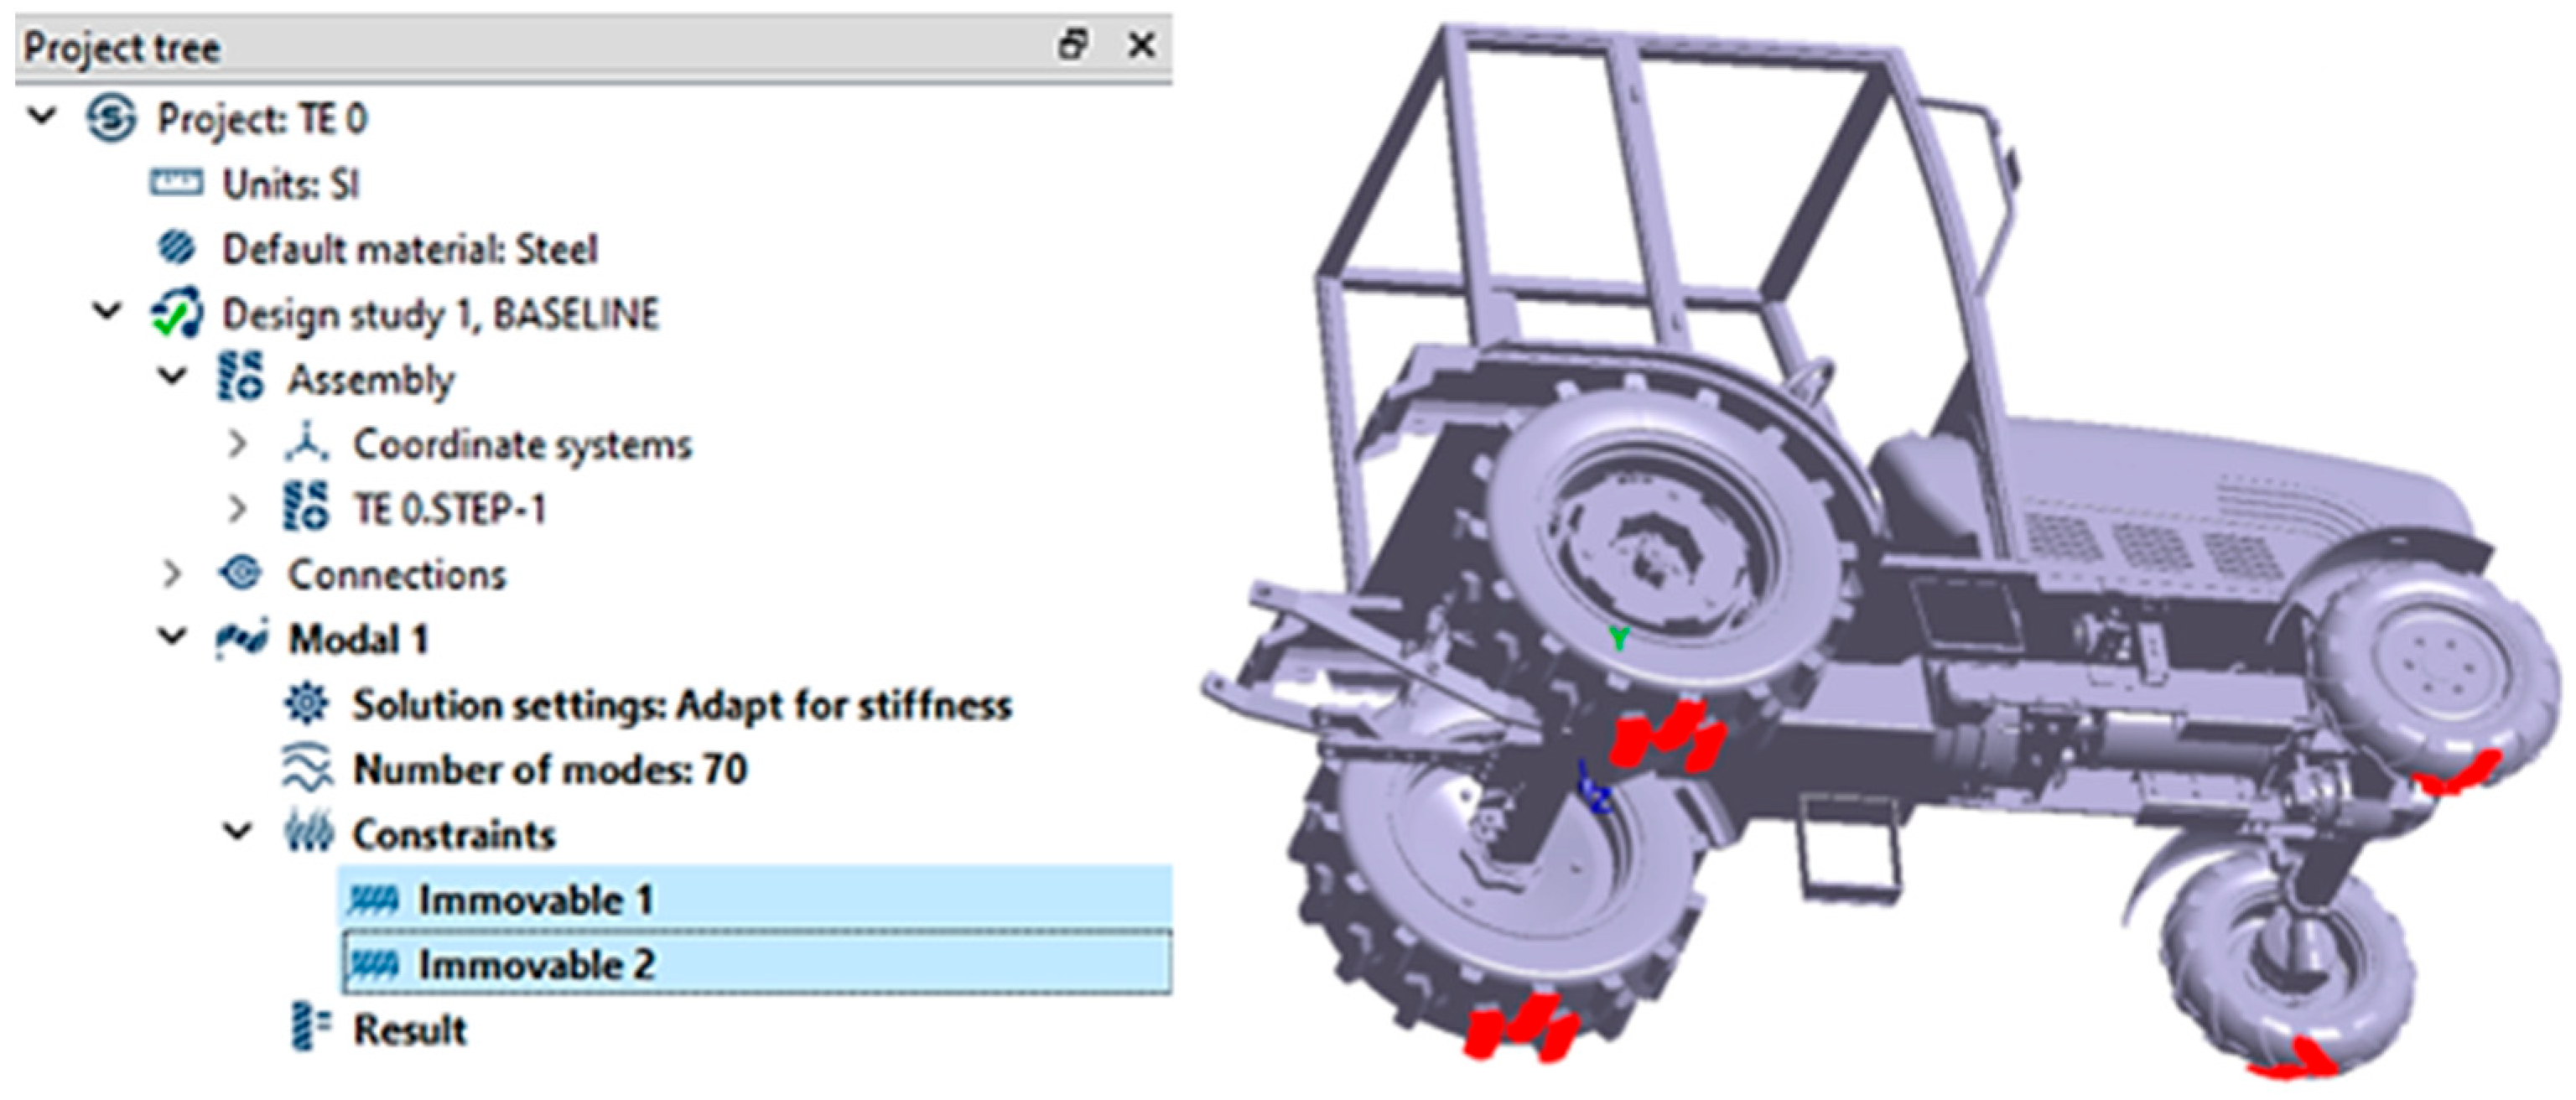
The definition of constraints was carried out under stationary conditions, simulating the position of the tractor on a virtual horizontal plane representing the ground. In this context, fixed supports were assigned to each tire at the contact points with the ground, in order to accurately reflect the real operating conditions of the tractor. This step is essential for ensuring the stability of the model and enabling an accurate modal analysis.
Figure 8 illustrates the placement of these constraints within the simulation environment.
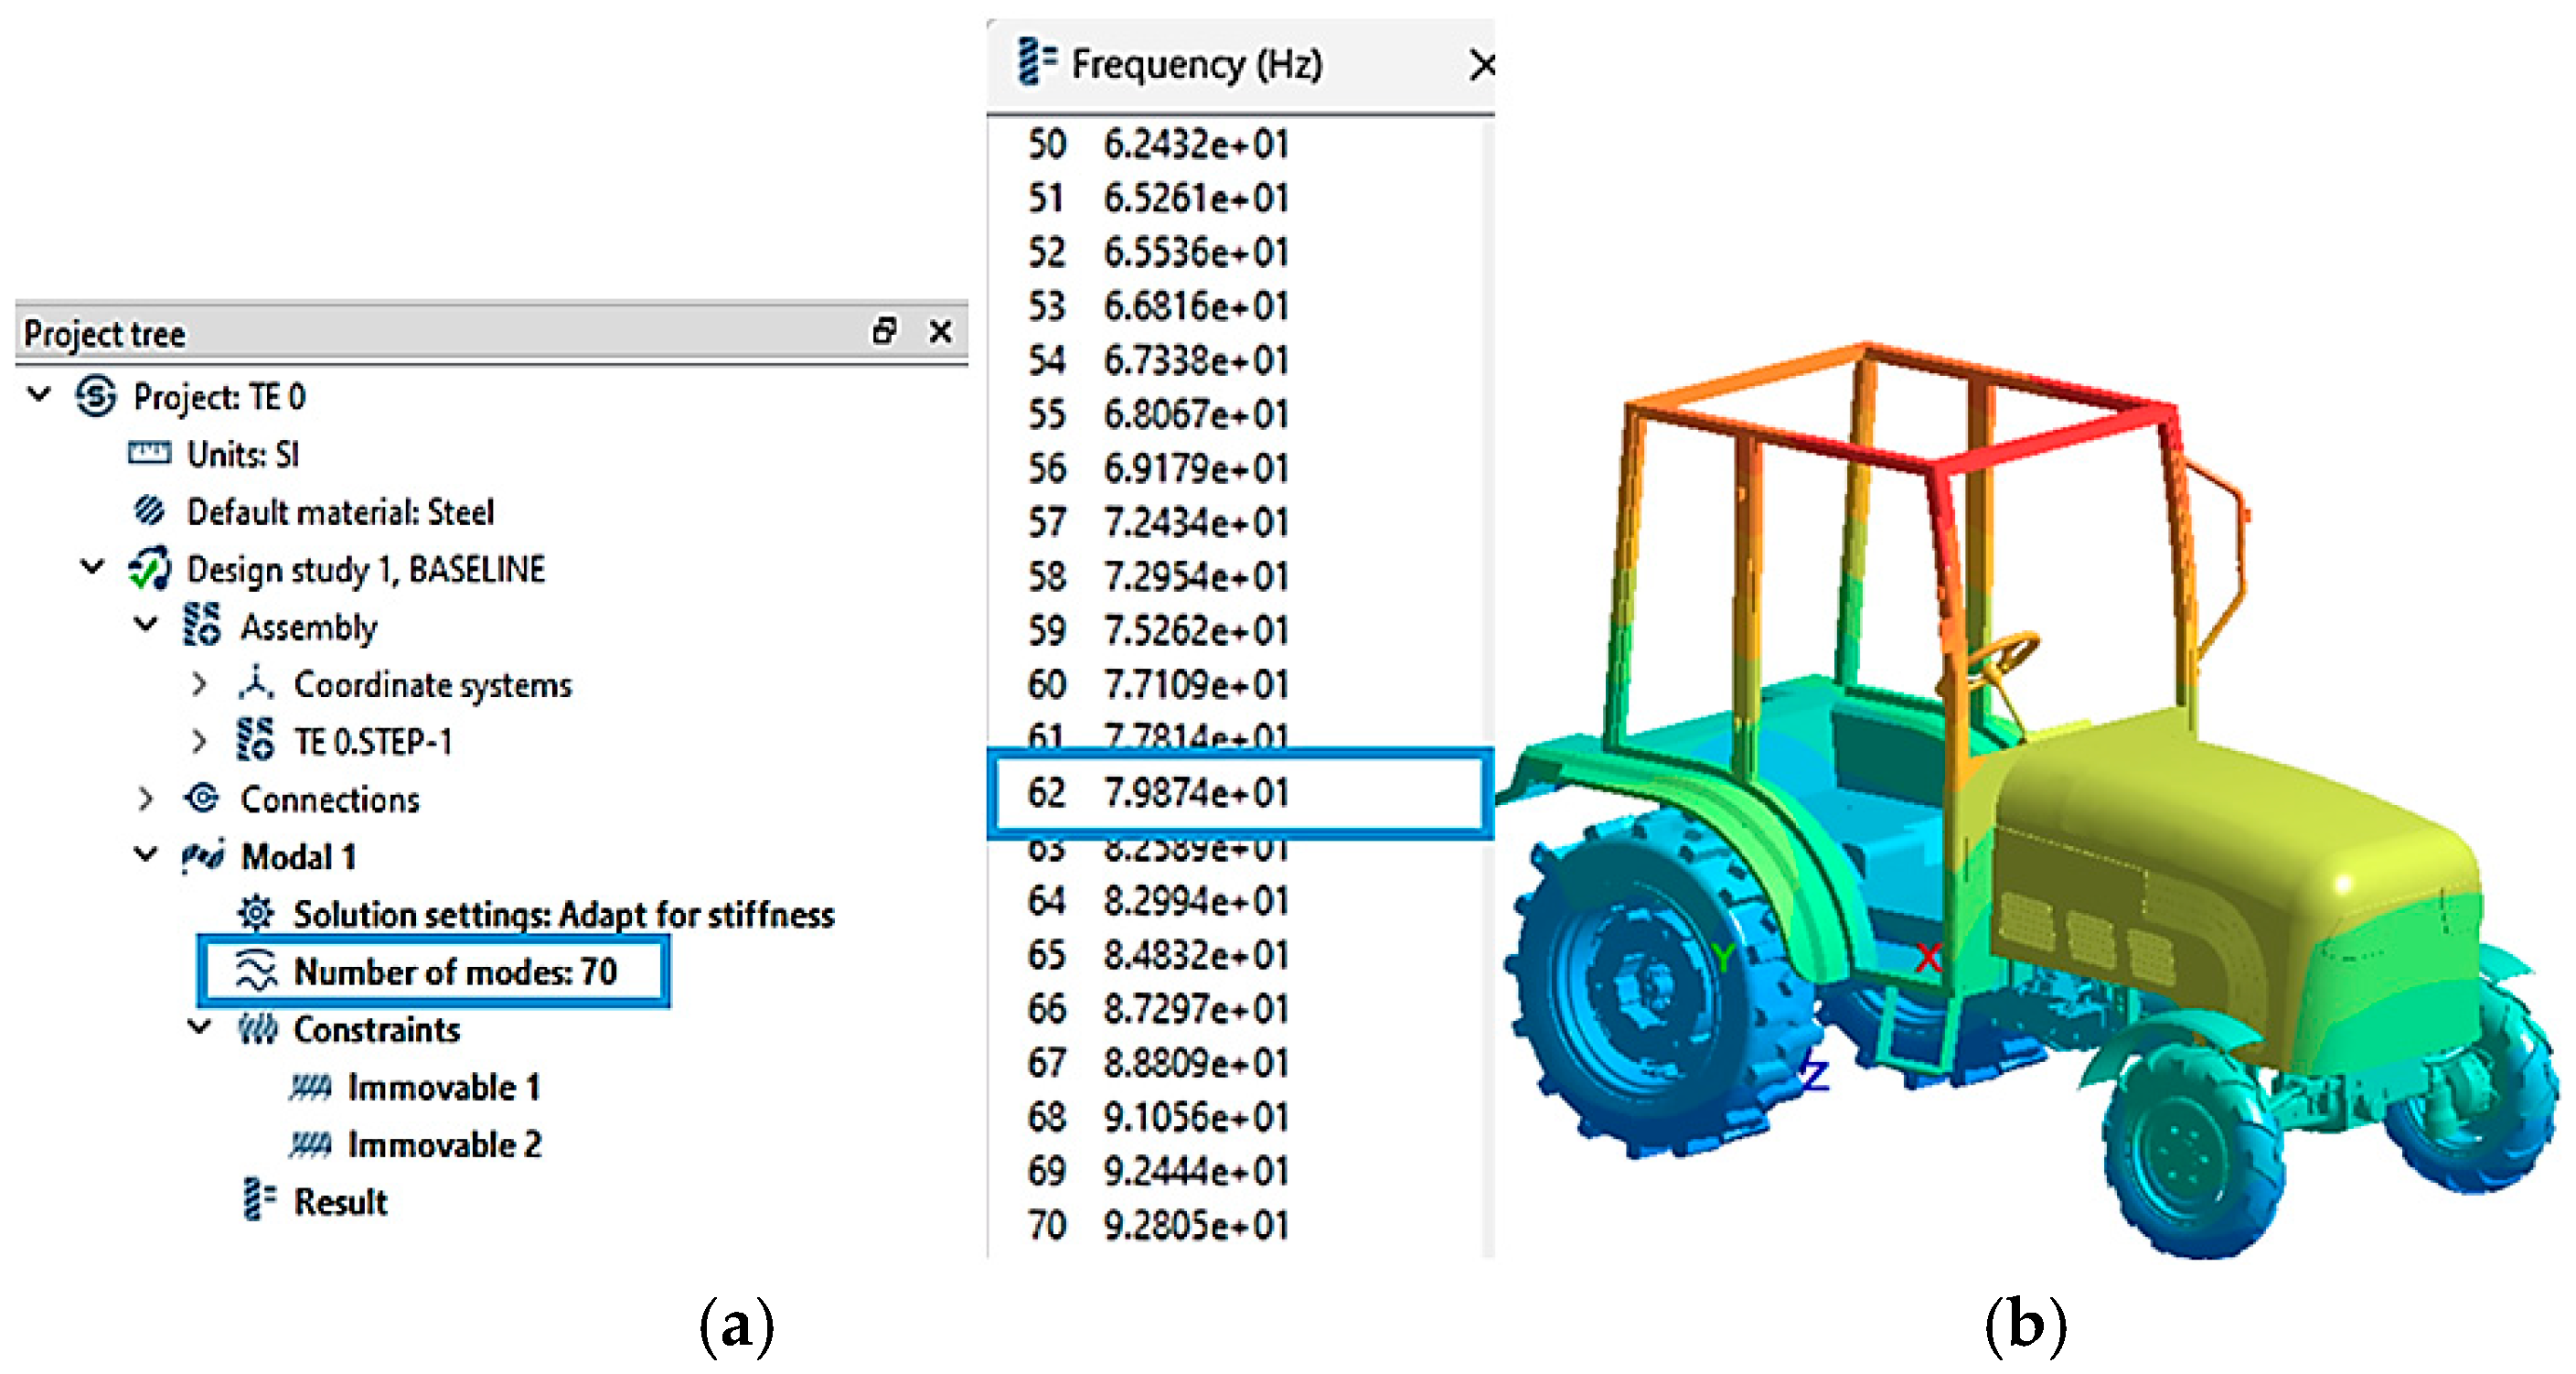
For the modal simulation of the TE-0 electric tractor, a maximum of 70 vibration modes was selected in Altair Sim Solid, within a frequency range of [0–80] Hz, in accordance with ISO 2631-1. As a result of the modal analysis performed within this frequency interval, 62 distinct vibration modes were identified and are presented in
Figure 9.
This selection is essential for evaluating the natural frequencies of the tractor and understanding how it responds to external excitations. Identifying the vibration modes allows for a detailed understanding of the dynamic behavior of the tractor and helps prevent resonance phenomena, thereby minimizing the vibrations transmitted to the operator.
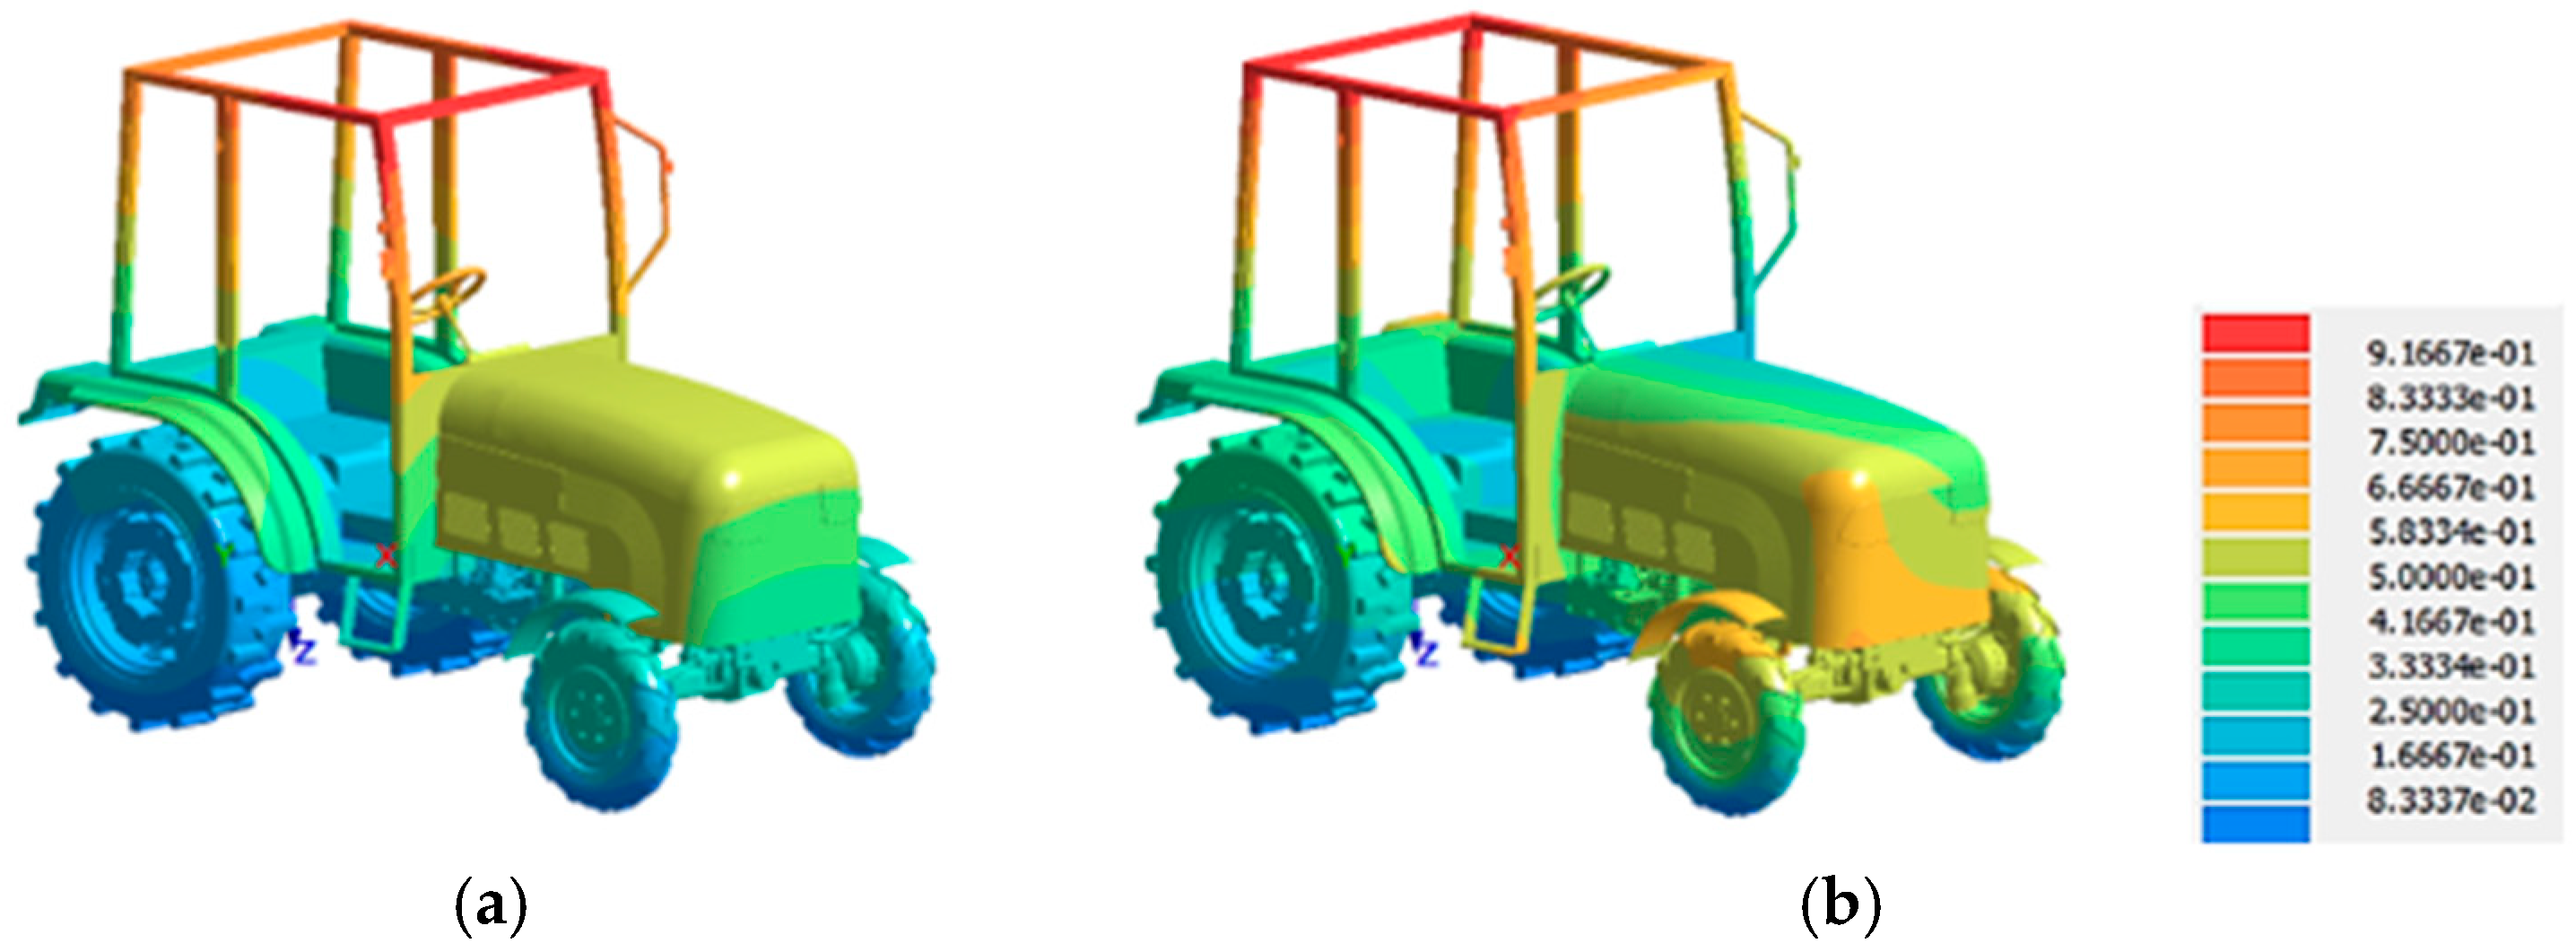
The most relevant vibration modes of the TE-0 electric tractor model are presented in
Figure 10, representing the distinct vibration patterns exhibited by the tractor structure at its natural frequencies, which may have a significant impact on the operator’s health.
This methodological approach enabled the identification of natural frequencies and vibration modes that affect operator comfort, playing an important role in preventing resonance phenomena and reducing vibrations transmitted to the operator’s seat. Furthermore, the detailed vibrational analysis of the TE-0 electric tractor supports the optimization of vehicle design to ensure ergonomic and safe operating conditions, which are essential for the development of high-performance and sustainable autonomous systems in the agricultural sector.
This first stage of the vibrational analysis of the TE-0 electric tractor is closely connected to the following stage, which will involve a detailed modal analysis of the tractor seat, an essential component in assessing the operator’s level of vibration exposure.
In this study, the second stage focuses on the detailed modal analysis of the electric tractor seat, an essential component of the operator-vehicle assembly, for the purpose of assessing the impact of vibrations on the operator. The 3D virtual model of the seat, available in the online library Grabcad.com, is named “Grammer Cabin Seat,” and is designed for off-road vehicles [
44]. It consists of a robust steel structure, rubber-foam elements for vibration damping, and plastic components that provide comfort and functionality. These components are illustrated in
Figure 11.
The experimental protocol specifies the type of seat suspension, which is mechanical, with adjustable suspension height. For the test case, the suspension was set to its maximum height (S2), corresponding to 20 cm, as illustrated in
Figure 12a. Additionally, the seat backrest was adjusted to a right angle of 90 degrees.
To acquire the necessary data, two accelerometer sensors were mounted on the seat surface and on the seat backrest, as shown in
Figure 12b. During the entire test, the operator remained in continuous contact with both sensors—mounted at the base of the seat and on the backrest, respectively
Figure 12c—in accordance with the specifications of ISO 2631-1. This setup ensured a detailed and accurate analysis of the vibrations transmitted to the human operator.
The calculation and numerical simulation of the seat suspension behavior were carried out in SolidWorks by accurately assigning material properties to each component of the 3D model. The total mass of the seat was estimated at 27.553 kg, based on the density and volume of the modeled components.
Figure 13 illustrates the mass properties of the assembly, including total volume, surface area, center of gravity coordinates, and moments of inertia along the X, Y, and Z axes of the coordinate system.
The suspension stiffness of the seat was experimentally determined for the configuration used in the vibration analysis, defined as a “rigid suspension.”
Table 1 summarizes all relevant parameters obtained through physical testing, including applied forces, resulting displacements, and stiffness coefficients, which are essential for the dynamic characterization of the suspension system in this study.
“A” represents the distance from the ground to the base of the seat when the suspension is “rigid” and the operator is seated.
“B” represents the distance from the ground to the base of the seat when the suspension is “soft” and the operator is seated.
“C” represents the distance from the ground to the base of the seat when no operator is seated.
For each of the A, B, and C conditions, five measurements were performed. The values recorded in
Table 1 represent the arithmetic mean of the five measurements.
A rigid suspension tends to transmit vibrations more directly to the vehicle structure and the operator, providing better stability on uneven terrain but at the cost of reduced comfort. In contrast, a soft suspension absorbs a greater portion of the vibrations, thereby reducing the discomfort experienced by the operator, although it may compromise stability under certain operating conditions.
By applying a linear interpretation of the system’s vibration response, it is possible to assess how each suspension type influences the transmission of vibrations to the vehicle structure and, consequently, to the operator.
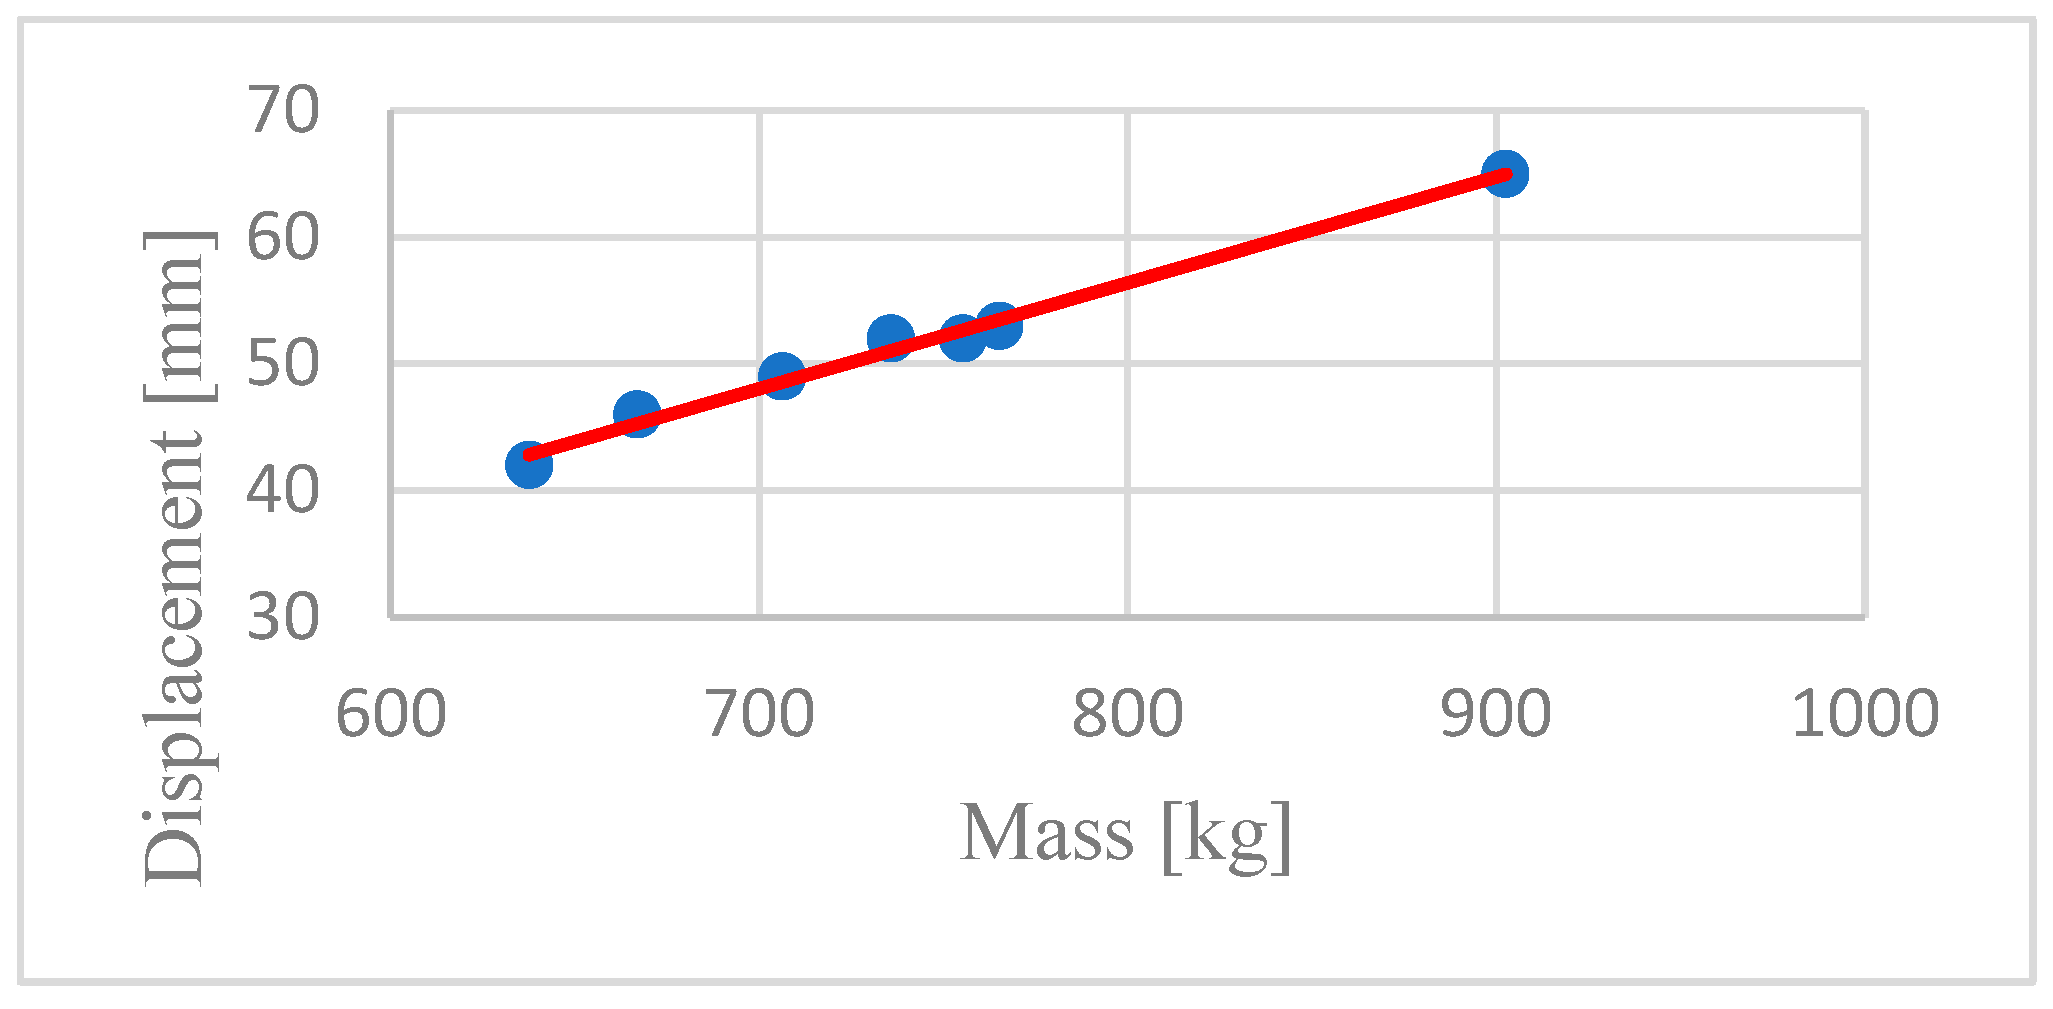
The linear interpolation of the suspension is illustrated in
Figure 14, based on the data collected from the sample of human subjects who participated in the experimental vibration tests.
Using the data from
Table 1, it can be observed that the suspension exhibits linear behavior, and the equation derived from relation (1) shows a precision of 99%.
where:
A = −1.96637, B = 0.06855, X = operator’s weight expressed in [N]
The suspension stiffness is calculated as:
Thus, the maximum suspension stiffness is:
15.0 N/mm
In order to account for the damping of the seat suspension, the mathematical calculation of the natural frequency of the seat suspension was carried out using the standard formula for the natural frequency of a mass–spring system. This formula allows for the determination of the natural frequency, which is essential for evaluating the dynamic behaviour of the suspension and for preventing resonance phenomena, which could amplify the vibrations transmitted to the operator.
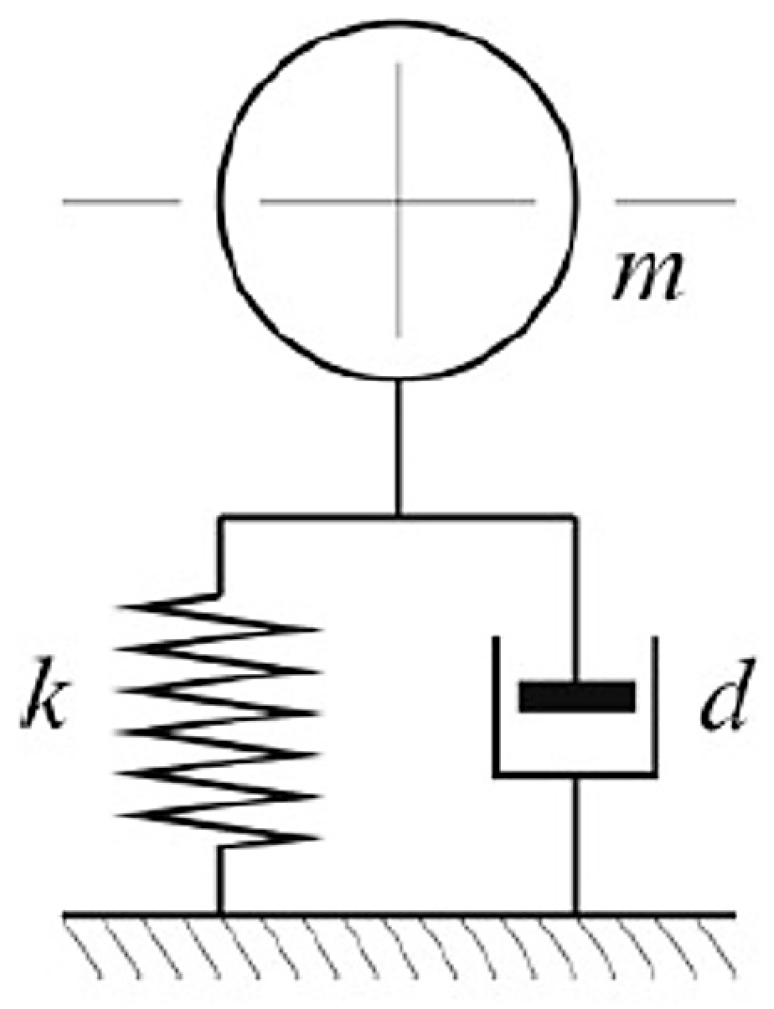
Figure 15 presents a schematic model of the suspension adopted for this study.
For the mathematical calculation of the natural frequency of Suspension, the frequency was determined using the formula given in Equation (2):
where:
f is the natural frequency of the damped harmonic oscillator, expressed in hertz [Hz];
k is the stiffness constant of the system, expressed in [N/m];
m is the mass of the object, expressed in [kg];
d is the damping coefficient, expressed in [Ns/m];
π is the mathematical constant pi (approximately 3.14159);
k = 15 [N/mm] = 15.000 [N/m];
d = 0.6 [Ns/mm] = 600 [Ns/m];
m = 27.53 [kg].
Thus, Equation (3) represents the value of the natural frequency of the seat suspension:
In our research, the seat was mounted on the TE-0 electric tractor used for experimental vibration analyses. The modal analysis of the seat was performed to evaluate its vibrational behavior under the actual operating conditions of the electric tractor. The seat plays an important role in transmitting vibrations to the operator, and identifying its natural frequencies and vibration modes is essential for understanding how these factors influence operator comfort and safety. In this context, the modal analysis of the seat is directly related to the main objective of our research, which focuses on evaluating the dynamic behavior of the operator-vehicle assembly and identifying optimal solutions for protecting the operator from harmful vibrations.
The seat mounted on the TE-0 electric tractor is a key factor in the development of sustainable and ergonomic design solutions for electric agricultural vehicles. The data obtained from this modal analysis are fundamental for optimizing the seat design, thus contributing to reducing the operator’s risk of exposure to harmful vibrations. After processing the model in SolidWorks software, it was exported to the advanced simulation software Altair Sim Solid, which enabled a precise finite element analysis.
The model preparation, meshing strategies, and boundary condition settings for the tractor seat in the simulation software followed the same steps as those used for modeling the electric tractor. In
Figure 16a, Altair Sim Solid highlights all connection analyses within the seat assembly, while
Figure 16b shows the virtual model of the seat with all connection points between its constituent components.
These connections play a critical role in the structural behavior of the seat under vibrational and mechanical loads. They determine how forces and vibrations are distributed and absorbed by the seat components, thereby influencing the durability, stability, and comfort provided to the operator.
In the modal analysis of the seat, 8 relevant vibration modes were identified within the [0–80] Hz frequency range, in accordance with ISO 2631-1 standards, with a maximum of 10 vibration modes selected.
This selection is essential for capturing the vibration modes that could significantly affect seat performance and comfort, thereby playing a key role in the comprehensive and rigorous evaluation of its dynamic behavior. This aligns with the article’s objective of assessing and optimizing operator exposure to vibrations during the operation of electric agricultural tractors. The distribution of the seat’s vibration modes within the specified frequency range is presented in
Figure 17 and illustrates the different vibration patterns the seat may exhibit depending on its natural frequencies.
Following the first stage of vibrational analysis of the TE-0 electric tractor, in which the vehicle’s vibration modes were identified, the second stage of the analysis focused on the tractor seat. The modal analysis of the seat was conducted to identify the vibration modes within the [0–80] Hz frequency range, providing a detailed understanding of the seat’s vibrational behavior and its interaction with the vehicle. Participation factors were determined along the three axes (X, Y, Z), and cumulative participation factors were obtained by aggregating them. A high value of these factors indicates the significant importance of the corresponding vibration modes, highlighting those that have a major impact on the dynamic behavior of the seat and, consequently, on operator comfort.
It is essential to verify the seat’s modal frequencies in correlation with the modal frequencies of the tractor and those of the virtual mannequin, which represents the operator seated on the seat. The overlap of these frequencies can lead to the phenomenon of resonance, a process that amplifies the vibrations transmitted to the operator. Resonance is particularly important, as it can have significant effects on the operator’s health by increasing the risk of discomfort and the development of musculoskeletal disorders.
At a frequency of 23.77 Hz, the third vibration mode exhibits a total participation factor of 0.33, as shown in
Figure 18. This mode is of particular interest due to its relatively high frequency, indicating a faster seat movement, but with lower influence compared to the first vibration modes. Frequencies above 20 Hz are essential for characterizing the vibrational behavior at higher speeds or when operating on uneven terrain.
Thus, the modal analysis of the seat is a key factor in understanding the dynamics of the operator-seat-vehicle assembly and in reducing the risks of exposure to harmful vibrations. This stage of seat modal analysis is directly connected to the first stage, in which the vibrational behavior of the TE-0 electric tractor was analyzed, and it serves as the foundation for the next stage of the research—the comprehensive analysis of the electric tractor-seat-virtual mannequin (operator) assembly.
In the third stage of our research, a modal analysis of the virtual mannequin (operator) seated on the electric tractor model TE-0 was conducted to evaluate the behavior of the human body under the influence of vibrations transmitted through the seat during operation.
Considering the aim of the article and the overall focus of the study, this simulation allows for an accurate representation of how vibrations affect different parts of the operator’s body. The modal analysis of the virtual mannequin is essential for understanding the impact of vibrations on operator health and comfort, complementing the vibrational analysis of the vehicle and the seat from the previous stages of the research.
To ensure the accuracy of the virtual mannequin model, average anthropometric dimensions of the subjects were used in accordance with the experimental protocol, as presented in
Table 2.
In the development of the virtual human operator model, in addition to the dimensional parameters derived from the anthropometric data presented in
Table 2, a validated biomechanical human model was integrated to enhance the accuracy of the vibration analysis simulation. This biomechanical model, designed with nine degrees of freedom, was specifically developed and validated to enable both static and dynamic testing in the context of operator interaction with an agricultural vehicle of the tractor type.
The model enables the simulation of the complex three-dimensional behavior of the human body in a seated posture on the vehicle seat and accurately reflects the interactions between body segments and the seat suspension system.
The nine biomechanical segments—head (m1), neck (m2), torso (m3), upper arms (m4), forearms (m5), hands (m6), thighs (m7), lower legs (m8), and feet (m9)—are modeled as lumped masses connected by spring–damper elements, which simulate the mechanical characteristics of human tissues and joints. The vehicle seat is modeled as a separate mass (ms), directly interacting with the human model.
The dynamic parameters and mechanical properties of this model are presented in
Table 3 and were selected based on validated biomechanical data and relevant literature, in order to ensure high fidelity in the simulation of the operator’s vibrational response during the operation of the TE-0 electric vehicle.
Figure 19 presents the equivalent system of the biomechanical model of the seated driver. The segments comprising the model are denoted as [m
1 − m
9 + m
seat]. Each segment of the human body is associated with a system consisting of springs and dampers, labeled K
i and C
i, respectively. These elements are placed beneath each mass to represent the deformable properties of the body segments, as well as to simulate the vibrations transmitted from the floor through the seat to the entire body. The total mass of the model is 75 kg.
Based on the development of the biomechanical model of the seated vehicle operator, designed with nine degrees of freedom, an advanced and detailed analysis of the dynamic behavior of the human body was made possible, particularly regarding the manner in which vibrations are transmitted through the vehicle seat during motion. This biomechanical model—composed of body segments represented by lumped masses interconnected via spring–damper elements—enabled a three-dimensional simulation of the operator’s vibrational response under real working conditions.
The integration of these features into the virtual model, constructed using average anthropometric dimensions of the vehicle operator, led to a realistic and rigorous representation of the interaction between the operator, the seat, and the tractor.
Consequently, the analysis became more comprehensive, providing relevant results for identifying the natural vibration modes that may directly influence the comfort, health, and safety of the operator during operation on unprepared terrain.
SolidWorks provides a clear and methodical framework for accurately modeling the central segment of the human body, commonly referred to as the torso. The modeling process is structured into several essential stages, each playing an important role in ensuring the geometrical and functional accuracy of the torso, which is a critical component in the structure of the virtual mannequin.
Figure 20 presents an exploded view of the virtual mannequin, offering a detailed visual representation of each individual component and their assembly. This graphical representation visually separates the main components—such as the head, torso, arms, legs, and other body segments—highlighting their interconnection within a coherent assembly.
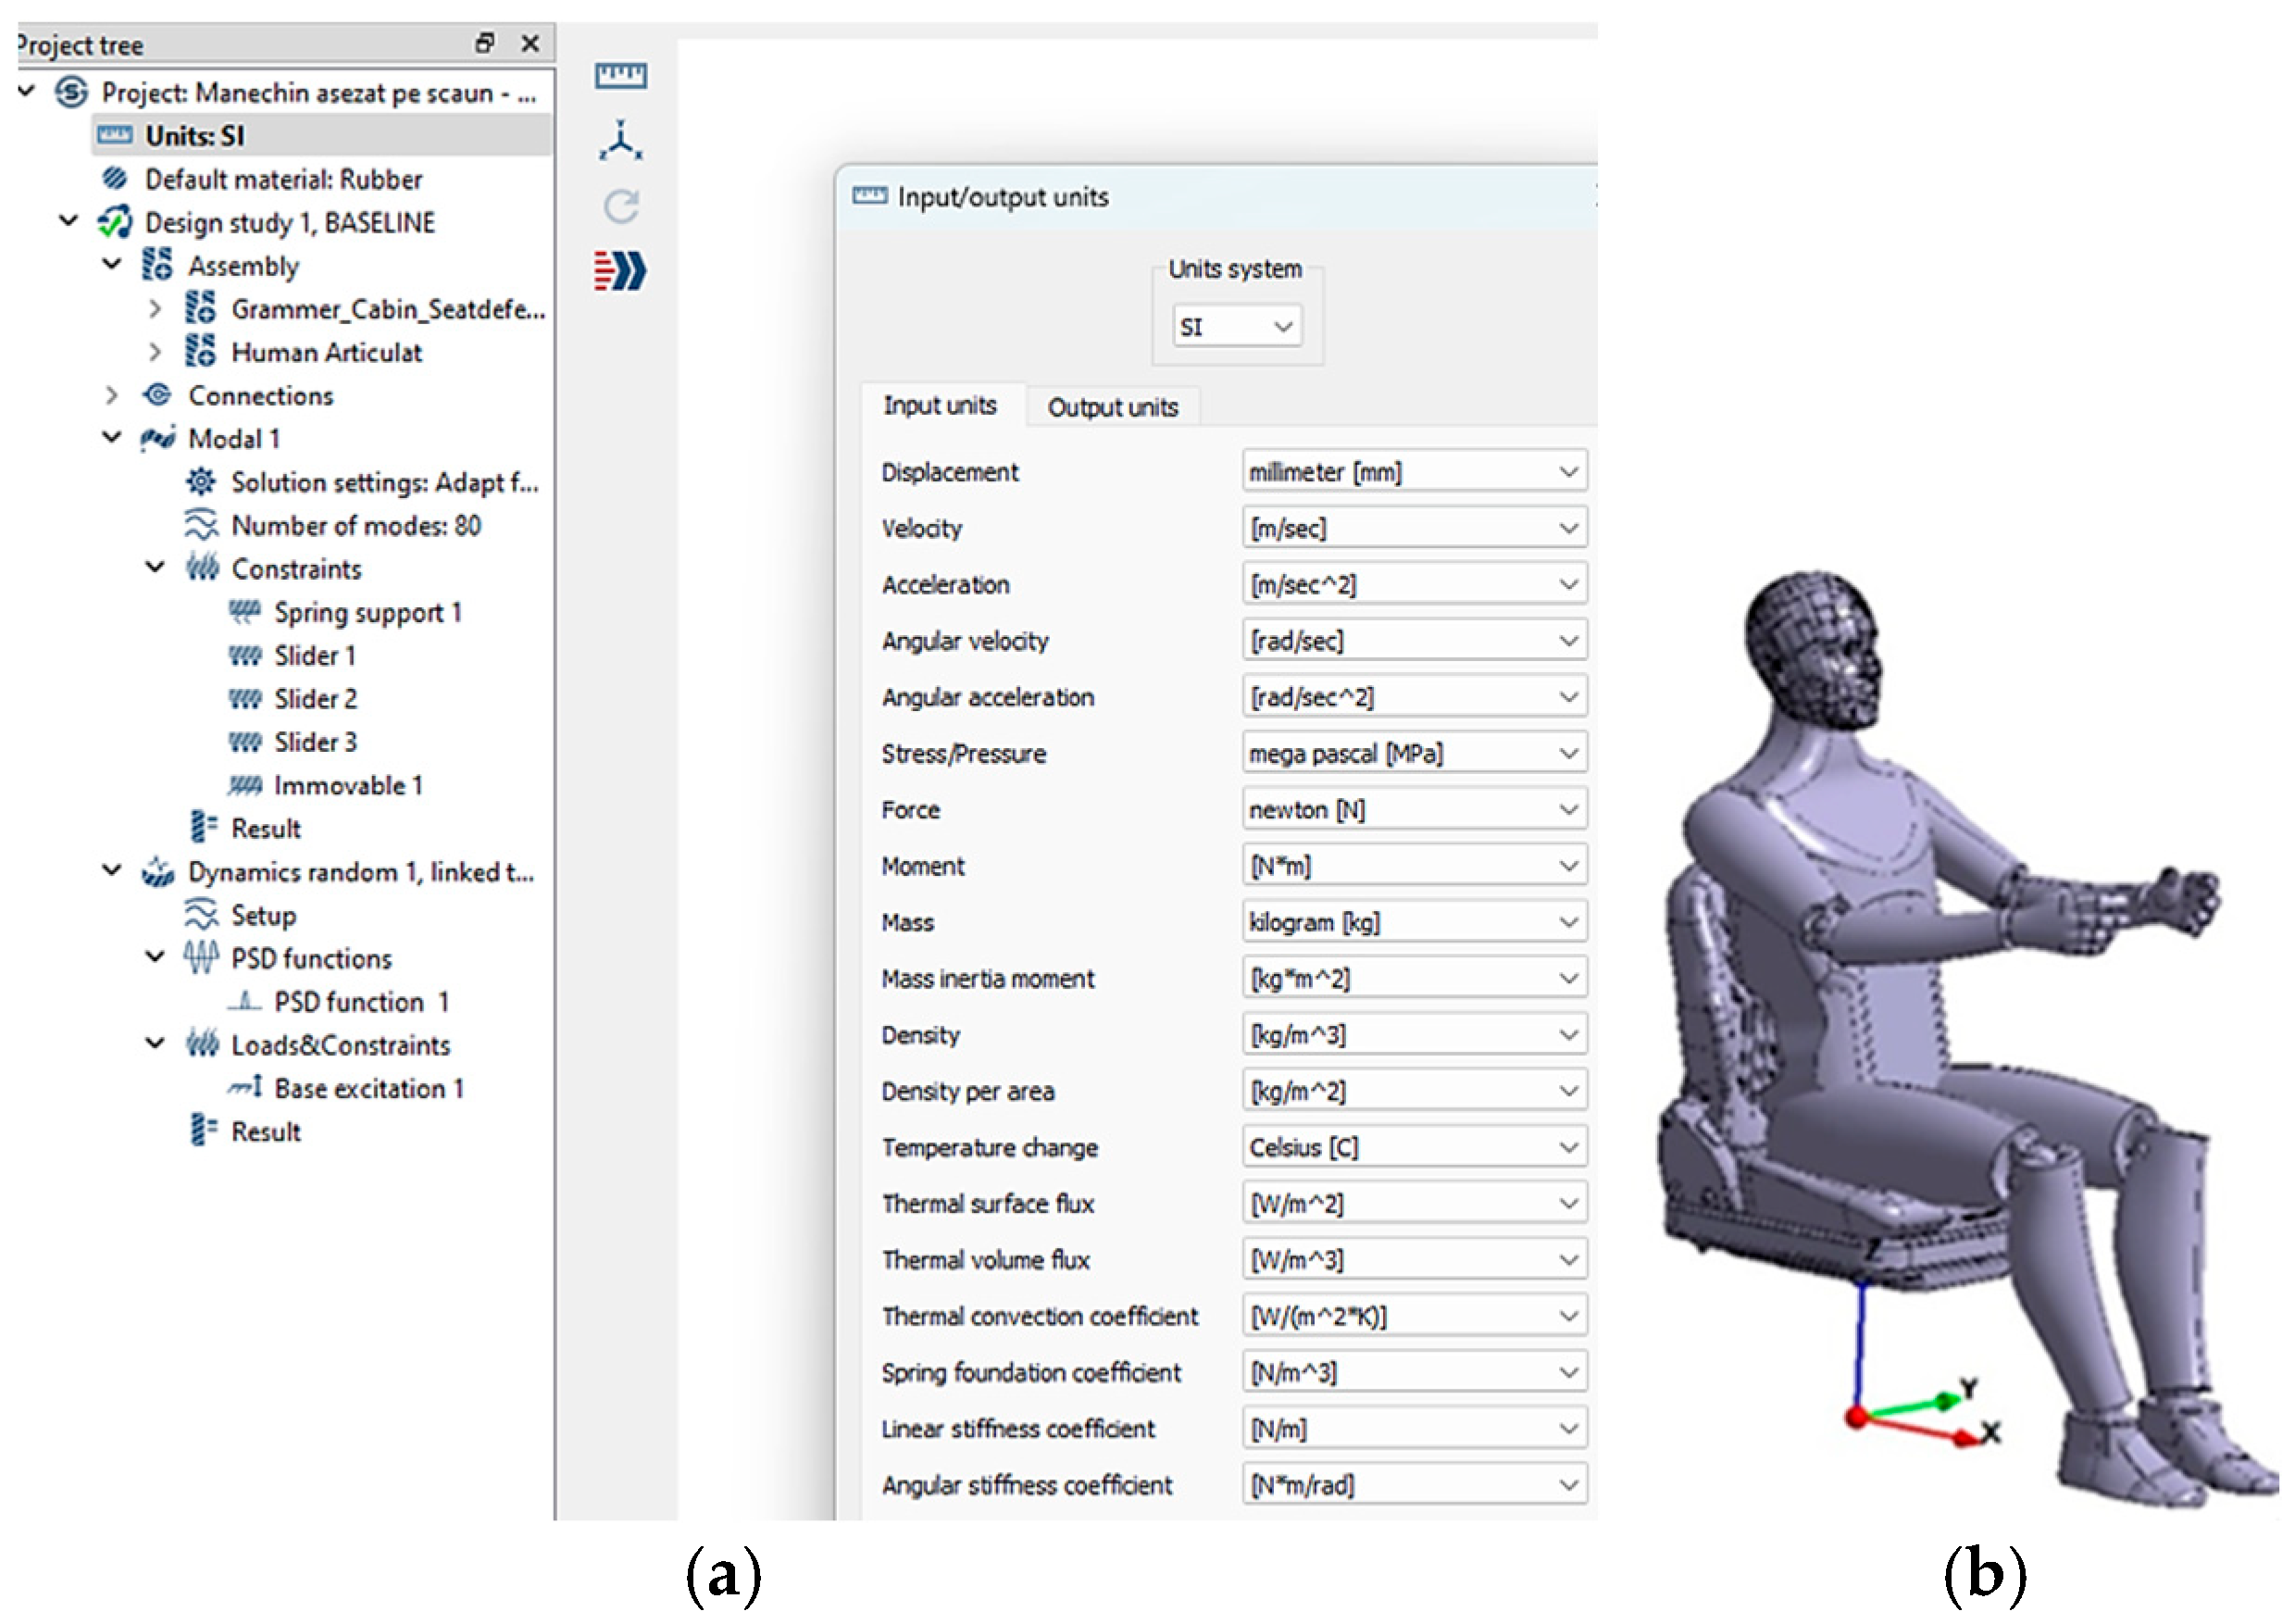
The metric system is selected by default to ensure the consistency and accuracy of all numerical values used in the analysis, as illustrated in
Figure 21a. The main coordinate system is attached to the center of mass of the mannequin, with the
X-axis oriented longitudinally, the
Y-axis transversely, and the
Z-axis vertically, as shown in
Figure 21b.
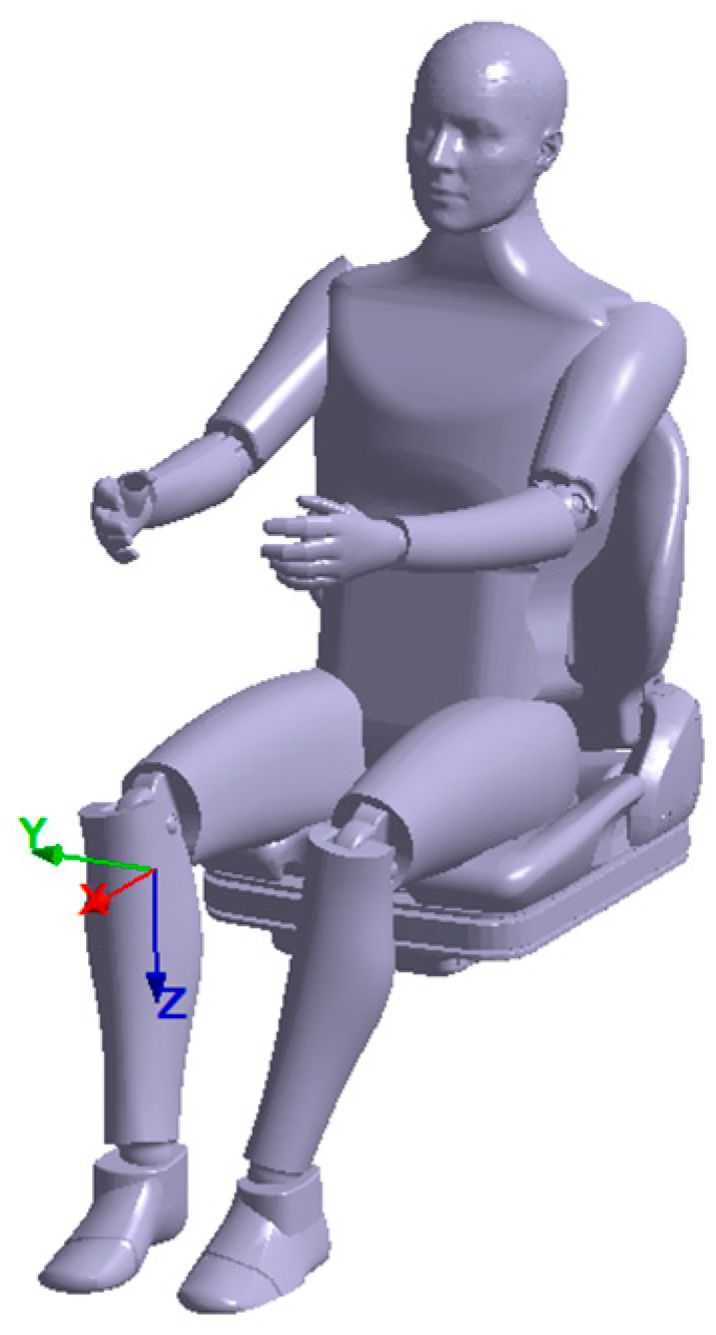
The model is graphically represented in
Figure 22, providing a detailed visualization of the human body structure in the context of vibrational analysis. This simulation stage is in full alignment with the objective of our article, which focuses on analyzing the dynamic interaction between the operator, the seat, and the electric vehicle. It contributes significantly to the development of more efficient and ergonomic design solutions aimed at protecting operators from the harmful effects of vibrations under real operating conditions.
Altair Sim Solid allows for the detailed visualization and management of all connections (joints, contact surfaces, or other types of mechanical interfaces), as shown in
Figure 23a, ensuring that all physical interactions between components are accurately considered in order to obtain precise and reliable results in simulating the dynamic behavior of the mannequin seated on the chair under vibrational conditions.
In
Figure 23b, Altair Sim Solid highlights the virtual model of the mannequin seated on the chair, showing all connection points between its constituent components.
The modal analysis of the mannequin seated on the chair was configured to display all natural frequencies and vibration modes within the [0–80] Hz range, in accordance with ISO 2631-1. Within this frequency range, a total of 80 vibration modes were identified.
In
Figure 24a, the software displays the total number of vibration modes of the mannequin, while
Figure 24b shows the virtual model of the mannequin with the corresponding natural frequencies highlighted for each vibration mode.
To simulate the seat suspension, an elastic support with a vertical (
Z-axis) stiffness of 15 N/mm was applied at the base of the seat. The longitudinal and transverse axes at the base of the seat were considered fixed. The tractor floor was simulated by applying a “slider” support to the flat surface of the mannequin’s feet. An “immovable” support was applied to the palms of the mannequin, thus simulating a fixed contact between the palm surfaces and the steering wheel, as shown in
Figure 25.
This detailed modal analysis, along with comparative discussions of the vibration modes and frequency values, enables a deeper understanding of how each vibration mode contributes to the dynamic behavior of the mannequin.
The participation factors calculated for each vibration mode provide essential insights into the influence of each frequency on the overall operator-seat-vehicle system. Through this process, critical frequencies can be identified which, in the event of resonance, may amplify vibrations and lead to operator discomfort or health risks.
Thus, the analysis of vibration modes is a fundamental component in the comprehensive assessment of the impact of vibrations on the operator and in optimizing the design of the electric vehicle to ensure safe and ergonomic operating conditions.
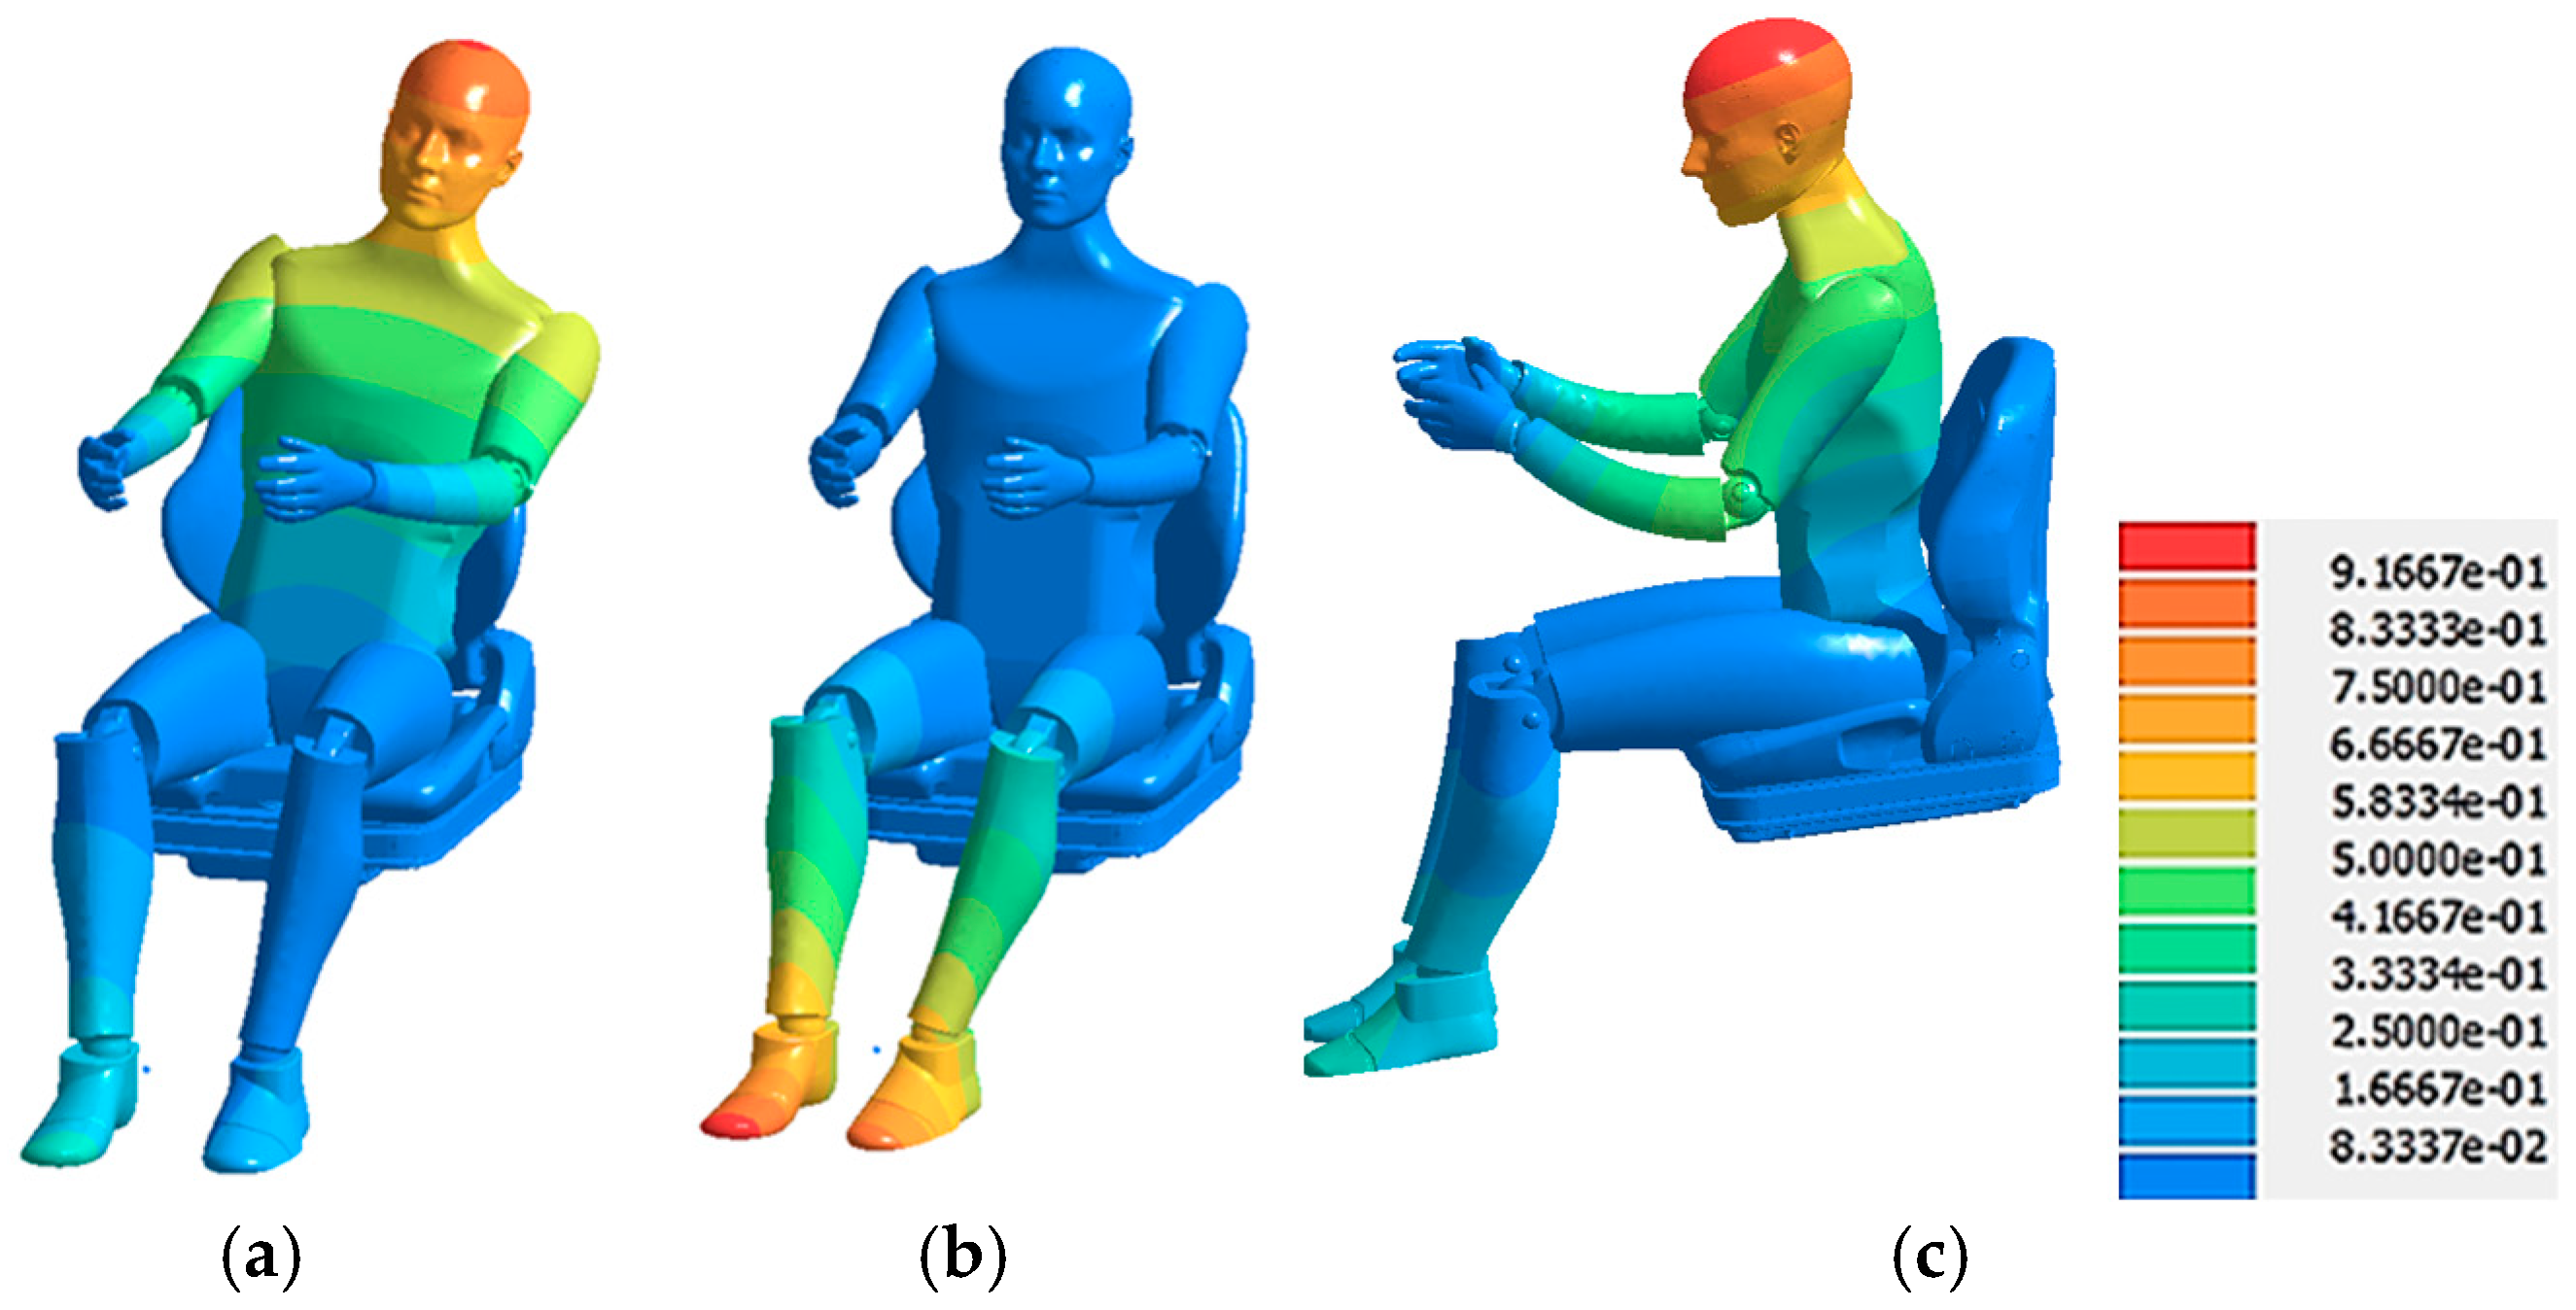
The most important and relevant vibration modes of the mannequin seated on the chair are shown in
Figure 26, specifically modes 2, 3, and 5.
Vibration mode 2, at a frequency of 2.80 Hz with a participation factor of 62.12, shows a decrease in influence compared to the first mode, but still plays a significant role in vibration transmission, indicating its importance in the assessment of comfort and the mannequin’s dynamic behavior. Vibration mode 3, at 2.99 Hz with a participation factor of 39.88, reflects a gradual reduction in the influence of the modes on the overall response of the mannequin. Vibration mode 5, at 4.03 Hz with a participation factor of 70.55, indicates a resurgence in modal influence, suggesting a strong interaction with vibrational excitations.

