Abstract
To address the insufficient utilization of network model features and low search efficiency in kill chain analysis for Weapon System of Systems (WSoS), a complex network model of WSoS based on OODA loop was constructed, which converts the indicator system into attribute features embedded in network nodes, and analyzes the kill chain mode through the metapath. Subsequently, a Depth First Search (DFS) algorithm combined with Graph Attention Network (GAT) is proposed for kill chain search evaluation. The algorithm utilizes GAT to extract topological information and node attribute features from graph data to obtain node-embedding vectors, and optimizes the DFS algorithm process by computing the cosine similarity of node-embedding vectors. Simulation results demonstrated that the proposed algorithm achieves high search efficiency and accuracy, providing robust support for combat decision-making.
1. Introduction
Due to the rapid development of new-generation science and technology, such as artificial intelligence, information warfare is evolving towards intelligent warfare [1,2,3]. This new form of warfare is characterized by its large scale, high tempo, and complex operational styles, which demand accurate and rapid combat decisions [4]. The Weapon System of Systems (WSoS) is a high-level complex system composed of different weapons, equipment, and combat elements [5]. Consequently, the WSoS presents significant research challenges, including complex modeling, difficult analysis, and a high level of abstraction. Effective modeling of WSoS is crucial for enabling system analysis and evaluation. The ability to rapidly identify all available and optimal kill chains within the system is instrumental in evaluating its combat effectiveness and accelerating decision-making. Therefore, it is necessary to study how to effectively construct a weapon system model and conduct a kill chain search.
In recent years, the expansion and application of network modeling of WSoS have become a research hotspot [6]. Most of them are based on complex network theory and Observe–Orient–Decide–Act (OODA) modern loop theory. Reference [7] combines OODA loop theory with the concept of the kill chain to model and realize the evaluation of network node importance. Reference [8] proposes an algorithm for generating system functional network based on OODA. By calculating the maximum eigenvalue of the adjacency matrix, the number of activity cycles of the blue and red sides is evaluated to estimate the ability to destroy enemy units. Reference [9] constructs a network model of drone swarm air combat system. Based on OODA, the network edge relationship is divided into command coordination, information sharing, and attack coordination. Reference [10] constructs a time combat network TCN and uses OODA loop theory to analyze and optimize the network dynamic characteristics and decision-making process, thereby optimizing the contribution of key equipment in combat missions. The team led by Professor Tan Yuejin has significantly contributed to the field of complex network modeling and analysis for systems, proposing the concept of the “combat loop” based on the OODA loop theory [11]. The WSoS model constructed with a combat ring can more effectively describe the influence of a topological structure.
According to the descriptions in references [12,13], it is difficult to calculate the statistical combat link in the WSoS. Reference [12] uses the combat loop to model the system and converts the combat loop recommendation problem into a mathematical model based on multi-warehouse path planning. It uses an integrated improved ant colony algorithm to optimize and recommend the combat loop. For similar path planning problems, there are different applicable methods under different constraints and tasks. Among them, Depth First Search (DFS) is one of the main methods for judging whether there is a loop and connectivity in the graph [14], and it has been widely used in many fields. Reference [15] uses the node2vec algorithm combined with the DFS strategy to construct the GEMimp algorithm to solve the problem that the analysis of microbiome data is often subject to inherent sparsity. Reference [16] combines DFS with dynamic optimization. By constructing a tree structure, preferentially expanding high-weight nodes, pruning irrelevant nodes, and calculating in the encrypted domain, the efficiency of cloud data multi-keyword sorting search is improved, the computing overhead is reduced, and privacy protection is enhanced. Based on literature reviews and an analysis of actual combat scenarios, problems such as combat planning and kill chain search can be reformulated as path search or connectivity detection problems within the domain of path planning.
Most network models of WSoS are analyzed from the perspective of network structure [17]. After embedding the indicator parameters or equipment node performance parameters into the network node attributes, the similarity between the WSoS network model and the multi-agent model can be improved [18]. At the same time, the complexity of the system network is also increased. In recent years, graph neural networks have developed rapidly. Their ability to capture topological information in irregular graph data has attracted the attention of researchers and has been widely used in many fields. For example, references [19,20,21,22] show that graph neural networks are used in natural language processing, signal processing, fault diagnosis, and military operations research, mainly for learning graph structure data to complete pattern recognition applications. In recent years, graph neural networks have developed many variants. The classic improved variant is graph convolutional neural network (GCN). GCN use the Laplacian matrix to complete convolution operations on the graph and aggregates neighbor nodes to process node information, reducing network parameters and training difficulty. However, when processing node neighborhood information, it often uses fixed or degree-based weights, which cannot fully capture the complex dependencies between nodes. In particular, it performs poorly when processing complex graph data and has poor generalization performance [23]. Graph Attention Network (GAT) [24], proposed in 2018, effectively addressed the shortcomings of GCN by introducing attention mechanism and adaptive weight allocation.
The networked model of the WSoS containing node attributes can be mapped to complex graph data. Therefore, it is necessary to study how to build the WSoS model more effectively. Although previous studies have utilized network models, there is still a gap in making full use of weapon and equipment attribute data and optimizing the statistical search process to improve efficiency and accuracy. This study aims to directly address these challenges. Based on complex network analysis, a networked model containing the WSoS is constructed. A DFS search algorithm based on GAT is proposed to solve the application difficulties of DFS in the equipment system network, improve the efficiency of the combat kill chain search, path semantic expression ability, and feature utilization of the networked model of the WSoS. The main contributions of this paper are as follows:
- Unlike most equipment system graph models, this paper embeds indicator information into the graph model nodes to construct a WSoS network model with richer information.
- Through GAT learning to encode node attributes and network topology information, the embedded information is used as inspiration information to guide the search direction of DFS, expanding the research field of graph data mining and analysis of WSoS network models.
- The simulation experiment covers the complete process from modeling and analysis to kill chain assessment, forming an “end-to-end” assessment process. The effectiveness of the proposed method is verified through comparison and experimental analysis.
2. WSoS Network Model Based on OODA Loop
2.1. WSoS Modeling
To effectively model and analyze the operational flow of a WSoS, this paper draws upon the OODA loop theory. This theory, which describes the information processing and decision-making cycle in a conflict environment, provides a foundational framework for deconstructing and understanding the kill chain. Based on the OODA loop theory, American scholar Jeffery R Cares [25] proposed an information age engagement model. He divided the combat forces on the battlefield into reconnaissance entities (S) that perform reconnaissance, early warning and monitoring tasks, decision-making entities (D) that perform command and mission decisions, influence entities (I) that perform fire strike tasks, and enemy targets (T) according to the different roles played by combat forces on the battlefield.
The network model of the WSoS is a description of the hierarchical structure and relationship between the various components in the combat system [26]. The equipment elements in the system constitute the network node set , and the edges formed by various relationships between the equipment elements are the edge set . Therefore, the WSoS can be expressed as .
His paper adopts a heterogeneous network form for network modeling. The node elements in the network are the mapping of weapon equipment entities in the network, and the mapping function is
The edge elements in the network are the mapping of the link relationship between weapon equipment entities in the network, and the mapping function is
In the above two Equations (1) and (2), and represent the weapon equipment entities and the link relationship between them, respectively. Different types of weapon equipment entities are represented by specific node elements, and the node type set is represented by . According to the equipment entity type defined by Jeffery R Cares, the edges between different types of entities represent different link relationships, and the edge type set is represented by . For a heterogeneous network, the following conditions must be met:
This paper describes the edge relationship types of different node types from the perspective of information and energy transmission, as shown in Table 1.

Table 1.
The type of network edge.
Some of the aforementioned edge types occur with relatively low frequency in actual combat operations. To more effectively analyze the system network, the kill chain is mapped with equipment entities. The kill chain primarily consists of six stages: Reconnaissance–Location–Tracking–Decision–Strike–Assessment [27], and the mapping between equipment entities and the kill chain is illustrated in Figure 1.
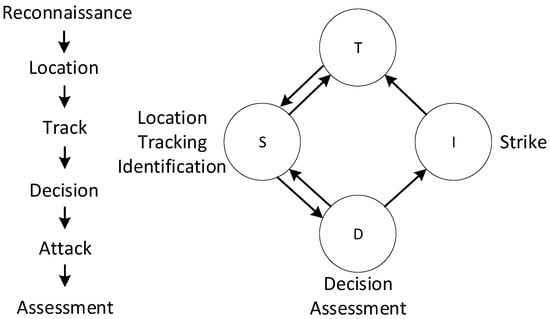
Figure 1.
Equipment entities map to kill chains. Arrows indicate information flow.
This paper introduces the metapath concept to conduct more detailed analysis of the network structure damage to the system. The metapath is defined as an isomorphic network pattern that describes a path connecting different node types in the network. The connection type is converted into a metapath representation.
Based on metapath analysis, the mapping between the vulnerability chain and the network model nodes constructed in this paper can be represented as
In actual combat, the transmission forms of information flow and energy flow are different in the kill chain representation. This paper analyzes and summarizes various forms of kill chains and their meanings. The results are shown in Table 2.

Table 2.
Kill chain element path and meaning.
An example of the networked model of the WSoS constructed based on the above analysis is shown in Figure 2.
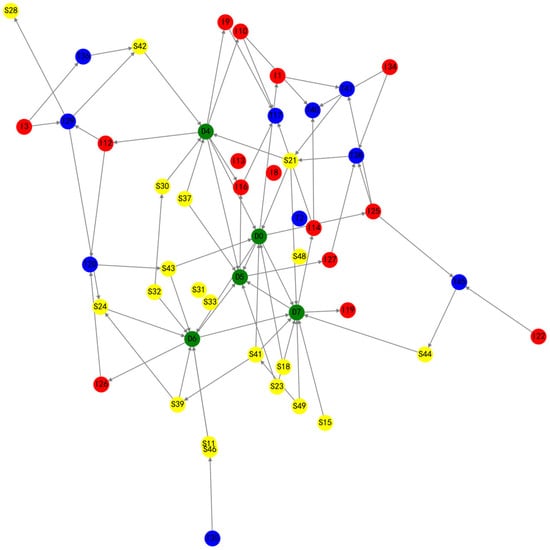
Figure 2.
Graphical example of a network model of a WSoS. S-type nodes are yellow, D-type nodes are green, I-type nodes are red, and T-type nodes are blue.
2.2. Capability Index System of WSoS
In view of the characteristics of WSoS effectiveness, this paper combines the characteristics of network models and the kill chain representation to construct a capability index system of WSoS, and expresses the effectiveness of the WSoS by aggregating the capabilities of single kill chain weapons and equipment [28]. The index system is shown in Figure 3.
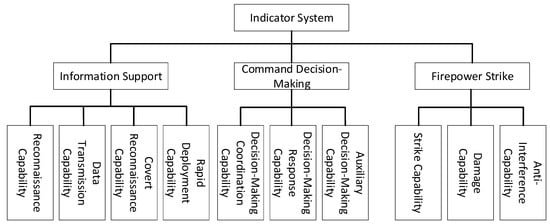
Figure 3.
Effectiveness index system of WSoS.
Information support capability is the ability to obtain battlefield situation through various sensors and provide information support for command decision-making and firepower strikes; the command decision-making capability is the ability to implement combat command, deployment, and evaluation based on battlefield information analysis; the firepower strike capability is the ability to execute strike missions according to combat plans and achieve target destruction and anti-interference capabilities.
2.3. Embedding of Indicators and Attributes of WSoS Nodes
Traditional network models often focus on topological structure, overlooking the performance variations among individual equipment nodes. To construct a more information-rich model that realistically reflects the combat potential of WSoS, this section maps and embeds the capability index system from Section 2.2 into specific node attributes. This approach ensures that the subsequent kill chain search can not only follow the network’s structure but also perceive the intrinsic performance of nodes, laying the groundwork for optimizing search efficiency and evaluating kill chain effectiveness.
In order to embed the various capabilities in the indicator system into the node attributes of the system network model, the system indicators and the node attributes of the system network model need to be mapped. This paper combines public data analysis to map representative performance parameters with indicator capability values. In the subsequent calculation of the kill chain effectiveness, numerical conversion is performed to facilitate weighted summation. The detailed mapping relationship is shown in Table 3.

Table 3.
The mapping relationship between the indicator system and the attribute value of the indicator.
According to Table 3, the attribute characteristics of different types of nodes can be defined when constructing the network model of the weapon equipment system to improve the simulation degree of the model.
3. Search Evaluation Algorithm Based on GAT-DFS
3.1. Limitations of the DFS Algorithm
The DFS algorithm traverses the tree nodes in depth along the data structure tree. The specific steps are as follows:
- Step 1: First visit vertex , where is the number of a node in the graph;
- Step 2: Calculate the adjacent nodes of node , traverse all adjacent nodes, and search along the connected paths to ensure that all vertices are visited;
- Step 3: Ensure that all vertices in the graph are visited, and repeat Step 1 and Step 2 from the vertices that have not been visited until all vertices are visited. The DFS algorithm can be understood in conjunction with the Fibonacci sequence, which is shown in Formula (4).
The calculation of each value of the Fibonacci sequence depends on the previous two values and forms a recursive stack. The DFS algorithm also searches through recursion and explicit stacks and then backtracks to continue searching. The time complexity of the two is different. The time complexity of the Fibonacci sequence is and the space complexity is . The complexity of the DFS algorithm is , where is the number of vertex nodes and is the number of edges.
As a standard algorithm for traversing graphs or tree structures, DFS cannot directly search for specific patterns like kill chains. Therefore, this paper introduces metapath patterns, node-embedding vectors, and cosine similarity calculation to enable DFS to be more effectively applied to kill chain search.
3.2. Design of GAT-DFS Algorithm
This paper adopts the GAT network to obtain the embedded representation of nodes. Assuming that a weapon system network model has been processed to obtain a representation graph , the weapon system network node has a -dimensional feature vector . GAT calculates the attention coefficient between each pair of connected nodes and through Formula (5).
where , the LeakyReLU activation function allows a small, non-zero constant gradient when the input is less than zero. is the linear transformation matrix, and represents the transpose of the weight vector . The attention coefficients of all neighbor nodes of are calculated and normalized. The normalization formula is shown in Formula (6).
where is the normalized attention coefficient and performs a weighted summation of neighbor node information to update the representation of node . The calculation formula is shown in Formula (7).
where is a nonlinear activation function. In order to improve the expressiveness of the model, GAT also introduces a multi-head attention mechanism, which introduces independent attention heads and then concatenates or averages them to update the node representation, as shown in Formula (8).
where is the node-embedding vector of node in the weapon system after being updated by the attention mechanism.
The node-embedding vector is a low-dimensional vector representation of the node [29], which can fully describe the node features and structural information in the graph and provide support for downstream tasks. This paper converts the GAT model trained according to the node classification application into debugging mode to output the node-embedding vector, and optimizes the DFS algorithm in combination with the node-embedding vector. The specific process is as follows:
- Step 1: Process the network model of the WSoS and convert the model into graph data that can be read by GAT;
- Step 2: Read the WSoS graph data , and use GAT to extract node feature vectors.
- Step 3: Determine the kill chain metapath as the graph path pattern, such as ;
- Step 4: Find the vertex through the graph path pattern, such as the node with node type is the current path pattern vertex;
- Step 5: Traverse the nodes that are vertices in the graph and select one of the vertices to search deeply;
- Step 6: Calculate the edge adjacent nodes of the node that meets the path pattern position currently searched to form a list;
- Step 7: Index the calculated node-embedding vector similarity matrix to sort the adjacent node list. The calculation formula of cosine similarity is shown in Formula (9);where represents the inner product of node-embedding vectors and , and represent the modulus of node-embedding vectors, and and represent the component of node-embedding vectors and . In this paper, similarity is calculated in advance to form a similarity matrix, and Step 6 is completed through index query to reduce the amount of search calculation.
- Step 8: If a node that meets the path pattern is found, add the node to the current search path and search for the next node until the path pattern is fully met and finally return to the starting vertex to save the searched path;
- Step 9: Repeat Step 4–Step 7 until all nodes that meet the vertex conditions of the graph path pattern are traversed and the final searched path is output;
- Step 10: Perform performance calculation and output the effectiveness evaluation results of the searched kill chain.
The GAT-DFS algorithm designed in this paper utilizes a GAT network to extract node-embedding vectors. The similarity between these vectors is then used to optimize the node sorting during the DFS search process. The DFS algorithm is applied to the weapon system kill chain search application, which can be extended to the analysis and optimization of heterogeneous weapon system network models with complex node attributes, and the path search of specific patterns in large-scale networks. This approach of guiding the pattern analysis process with data features is central to addressing complex system problems. For example, reference [30] uses a dynamic feedback mechanism to adjust the prediction model in real time according to the multi-stage degradation characteristics of the system, thereby improving the accuracy and adaptability of the prediction. Therefore, the method proposed in this study also provides a novel and effective way to implement pattern analysis in complex networks.
4. Example Analysis
4.1. Construction of WSoS Network
The simulation experiment in this paper was based on a real combat scenario and randomly generates a WSoS network according to the statistical factors such as the number of weapons and equipment. First, a scale-free directed network with nodes and priority connections was constructed, and the sum of the node in-degree and out-degree was calculated to form a sorted list. The in-degree formula is shown in the following Formula (10).
Then, command and control type nodes were assigned first, other types were assigned randomly, and, finally, the edges with few connections in reality were deleted according to the metapath type.
First, we constructed a WSoS network G with , , in which the ratio of the number of nodes of each type was S:D:I:T = 4:1:3:2. The network visualization is shown in Figure 4.
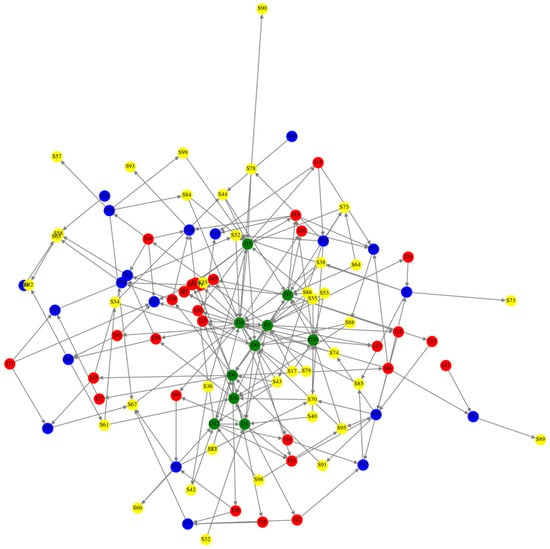
Figure 4.
A WSoS network (N = 100). Arrows indicate information flow.
In this paper, the simulation used node types to represent reconnaissance intelligence, command and control, firepower strike, and strike targets, corresponding to S, D, I, and T. In the process of constructing the network, it is necessary to count the distribution of node types and edge types in the network to observe whether the network construction is reasonable. The statistical results are shown in Figure 5.
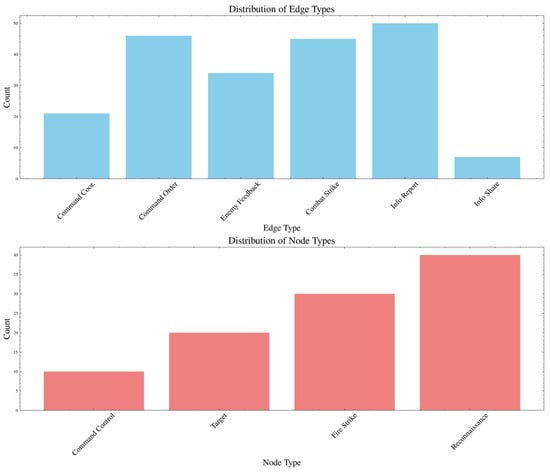
Figure 5.
Statistics on network node types and edge types.
It can be seen from Figure 5 that the node types are strictly divided according to the preset ratio. According to the literature [17], in addition to heterogeneity, the weapon equipment system network also has a scale-free characteristic, that is, the node degree distribution in the network follows a power-law distribution. To verify that the generated model exhibits scale-free properties, we analyzed its degree distribution. The logarithmic scale statistics of the degree distribution and the node degree distribution statistics are shown in Figure 6 and Figure 7.
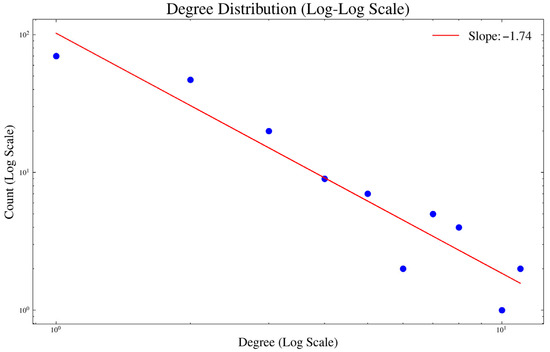
Figure 6.
Degree distribution (logarithmic scale).
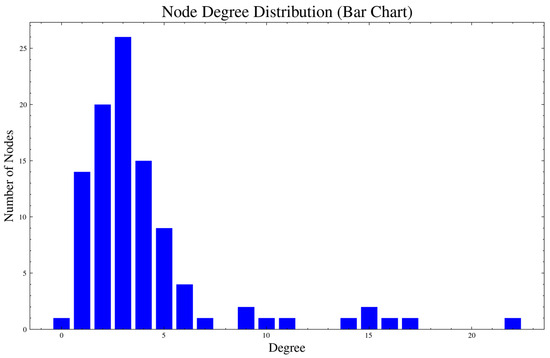
Figure 7.
Node distribution statistics.
It can be seen from Figure 7 that a few nodes have a large degree distribution. Figure 6 shows the degree distribution drawn on a logarithmic scale using least-squares fitting. The slope of the degree distribution is −1.74, indicating that the network conforms to a power-law distribution and possesses scale-free characteristics.
4.2. Graph Dataset Construction
In order to extract the node-embedding vector, the weapon equipment system network model needs to be converted into a data set available to GAT. First, the Max-Min normalization was used to normalize the numerical node index attributes to 0–1 to eliminate the dimension effect. The Max-Min normalization is shown in Formula (11).
where and are the maximum and minimum values of the same indicator attribute of the same category of nodes.
For the index attributes of fuzzy comment nodes, the following formula is used for numerical conversion.
where represents the uniform distribution of values from to . Then, an N-dimensional unit matrix is constructed, each row of which represents the One-Hot coded feature vector of the node. The node indicator attribute feature vector matrix and the One-Hot coded feature vector matrix are concatenated to obtain the final data.
4.3. Obtaining Node-Embedding Vectors
This paper constructed a GAT network consisting of two GATConv layers. The first GATConv layer contained eight attention heads as the graph attention convolution layer of the input data. The activation function used the ReLU activation function for linear transformation. The second GATConv layer contained one attention head, and the output node feature dimension was four. AdamW was used as the learning rate optimization model, with an initial learning rate of 0.1 and 400 iterations. The training loss graph is shown in Figure 8.
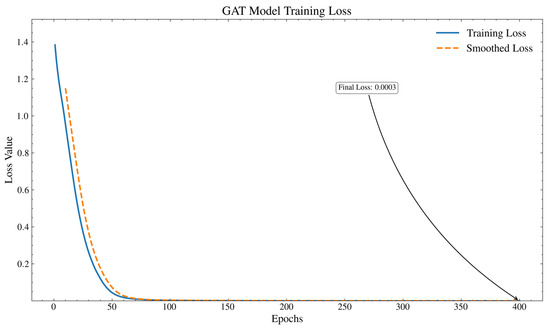
Figure 8.
GAT network training loss graph.
The figure shows that for a 100-node network, the GAT loss decreases steadily, and the classification accuracy can reach 99.65% in 100 iterations, converging steadily in the later stage. After the training is completed, the node-embedding vectors are obtained. Some node-embedding vectors are shown in Table 4. All the obtained node-embedding vectors are visualized using t-SNE, as shown in Figure 9.

Table 4.
Some nodes embed feature vectors.
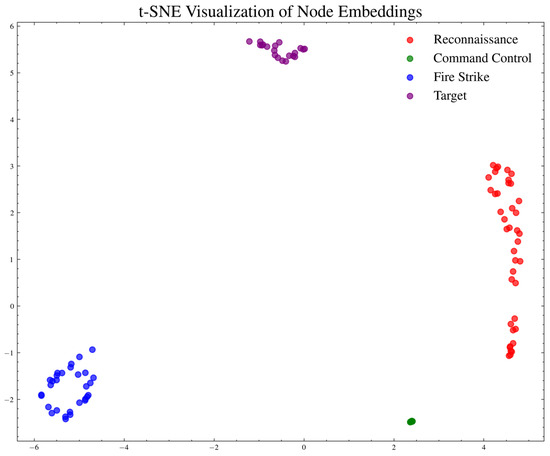
Figure 9.
Nodes are embedded in t-SNE clustering graphs.
4.4. Kill Chain Search and Effectiveness Evaluation
This paper selected the typical pattern kill chain as the search target to verify the search performance and accuracy of GAT-DFS. is the foundational pattern from which more complex kill chains can be derived, and is therefore an ideal benchmark case for validating the effectiveness of our algorithm. The performance calculation was performed using weighted summation, and the modified Max-Min normalization formula was used to scale all indicators to the interval (1,10), as shown in Formula (13).
where represents the upper limit of the interval and represents the lower limit of the interval.
The edge weight was set to 1, and the weighted summation method is shown in Formulas (14) and (15).

Table 5.
Kill chain search results.
When comparing the GAT-DFS algorithm with the original DFS algorithm, to ensure the consistency of the experimental comparison, the original DFS algorithm still used the algorithm logic of this paper for the specific search scenario of the weapon system, and only removed the GAT-related content. The kill chain searched during the algorithm operation was compared with the kill chain searched in the past, and the highest efficiency of the kill chain searched was recorded. The statistical results are shown in Figure 10.
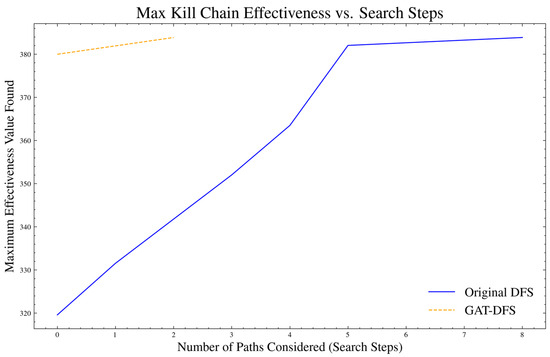
Figure 10.
Comparison of kill chain performance during search.
According to Figure 10, when only the kill chain mode is set, the GAT-DFS algorithm first finds the kill chain with higher efficiency during the search process. This is because GAT-DFS combines the node-embedding vector extracted by GAT to optimize the node search order during the search process. This shows that the DFS algorithm based on GAT can find the most efficient kill chain faster while ensuring the algorithm running time and the number of kill chains, proving the effectiveness of the method proposed in this paper.
To further verify the algorithm’s performance on large-scale networks, this paper selected the common adjacency matrix calculation method and the Breadth-First Search (BFS) algorithm for comparison. This comparison was specifically designed to benchmark our attribute-aware GAT-DFS against these standard, attribute-unaware traversal methods, thereby isolating and quantifying the efficiency gains derived directly from using node attribute features. To ensure a fair comparison of traversal speed, the adjacency matrix and BFS algorithms were reproduced and applied using the same fundamental search logic designed in this paper. By constructing weapon equipment system networks with five different node sizes (200, 300, 400, 500, and 600), the algorithm running time was statistically calculated. The statistical results are shown in Table 6 and Figure 11.

Table 6.
Algorithm search time at different node sizes.
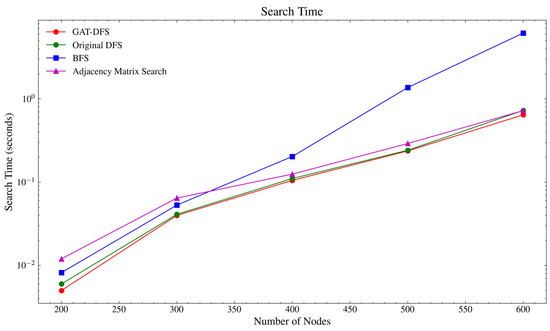
Figure 11.
Algorithmic search time statistics curve.
From Table 6, we can see that GAT-DFS takes the shortest time to search on a larger graph, and maintains a relatively stable search time difference compared with the original DFS. This time difference stems from the additional processing GAT-DFS performs to optimize node sorting. Even though the adjacency matrix calculation method adopted some optimization processing methods to facilitate the adaptation calculation when searching for application adaptation, the overall time is still significantly different from the GAT-DFS algorithm time. As the node scale increases, the search time of the four algorithms increases accordingly. The level-by-level traversal mechanism of the BFS algorithm results in higher computational time, particularly on larger graphs. The search time of GAT-DFS increases steadily and still maintains a certain time difference with the original DFS and adjacency matrix calculation methods. In comparison, GAT-DFS reduces the search time by optimizing node sorting within the DFS process, which also enables it to find the most effective kill chain more quickly. Compared with other methods, it has certain advantages in search performance.
5. Discussion and Conclusions
This paper addressed the issues of low search efficiency and insufficient feature utilization in traditional kill chain analysis for weapon systems. Based on the OODA loop theory, a heterogeneous complex network model was constructed to convert and embed the indicator system into node attributes, thereby obtaining a graph model with more information. By building a graph attention neural network model to learn node-embedding vectors, cosine similarity calculation was introduced to optimize the DFS search steps, and then the kill chain search was completed. The simulation results demonstrated the effectiveness of the proposed method. Specifically, they proved that the node-embedding vectors, learned via a GAT that captures both topological structure and attribute characteristics, can be effectively applied to enhance the kill chain search process. The experimental analysis revealed that the key to the GAT-DFS algorithm lies in its methodology: it first mines the network’s topological information and the attribute features of each node. Subsequently, it uses this information to optimize the node search order for the DFS process. The results demonstrate that this strategy enables the algorithm to locate more effective combat links in fewer search steps, thereby efficiently improving the search for critical kill chains without introducing other complex intelligent algorithms. A comparative analysis showed that, compared with the original DFS algorithm, the GAT-DFS algorithm can continuously identify the kill chain with the highest effectiveness value with fewer search steps. In addition, when tested on a larger network, GAT-DFS maintained a significant performance advantage in search time over traditional DFS-, BFS-, and adjacency matrix-based methods.
Although this study confirms the feasibility of the GAT-DFS algorithm, future research can expand its functionality. As mentioned above, the algorithm can be further optimized by designing search-pruning operations based on node-embedding similarity to reduce the amount of computation in very large networks. In addition, refining the capability indicator system with more granular data and enhancing the effectiveness calculation formula would increase the model’s accuracy and practical applicability.
In summary, this paper presents an ‘end-to-end’ experimental framework for WSoS effectiveness evaluation, from modeling to analysis. This framework is replicable and provides effective support for combat decision-making. In addition, this paper also provides a new solution for analyzing complex WSoS networks by combining graph neural networks with classic search algorithms.
Author Contributions
Conceptualization, Y.Y. and X.Z.; methodology, Y.Y. and H.H.; software, Y.Y.; validation, H.H.; formal analysis, X.Z.; investigation, X.Z.; resources, X.Z.; data curation, Y.Y.; writing—original draft preparation, X.L.; writing—review and editing, Y.Y.; visualization, Q.Z.; supervision, Q.Z.; project administration, X.L. All authors have read and agreed to the published version of the manuscript.
Funding
This research received no external funding.
Data Availability Statement
This study was conducted based on the simulation data of the construction, and the detailed construction details have been described in the paper.
DURC Statement
Current research is limited to systems engineering and artificial intelligence, which is beneficial for research in data mining on complex system network graphs and does not pose a threat to public health or national security. The authors acknowledge the dual use potential of the research involving the modeling and analysis of weapon system of systems and confirm that all necessary precautions have been taken to prevent potential misuse. As an ethical responsibility, authors strictly adhere to relevant national and international laws about DURC. The authors advocate for responsible deployment, ethical considerations, regulatory compliance, and transparent reporting to mitigate misuse risks and foster beneficial outcomes.
Conflicts of Interest
The authors declare no conflicts of interest.
References
- Rashid, A.B.; Kausik, A.K.; Al Hassan Sunny, A.; Bappy, M.H. Artificial Intelligence in the Military: An Overview of the Capabilities, Applications, and Challenges. Int. J. Intell. Syst. 2023, 8676366. [Google Scholar] [CrossRef]
- Sharma, P.; Sarma, K.K.; Mastorakis, N.E. Artificial Intelligence Aided Electronic Warfare Systems-Recent Trends and Evolving Applications. IEEE Access 2020, 8, 224761–224780. [Google Scholar] [CrossRef]
- Chin, W. Technology, War and the State: Past, Present and Future. Int. Aff. 2019, 95, 765–783. [Google Scholar] [CrossRef]
- Maurer, J.D. The Future of Precision-Strike Warfare. Nav. War Coll. Rev. 2023, 76, 13–38. [Google Scholar]
- Chen, Z.; Hong, D.; Cui, W.; Xue, W.; Wang, Y.; Zhong, J. Resilience Evaluation and Optimal Design for Weapon System of Systems with Dynamic Reconfiguration. Reliab. Eng. Syst. Saf. 2023, 237, 109409. [Google Scholar] [CrossRef]
- Li, J.; Tan, Y.; Yang, K.; Zhang, X.; Ge, B. Structural Robustness of Combat Networks of Weapon System-of-Systems Based on the Operation Loop. Int. J. Syst. Sci. 2017, 48, 659–674. [Google Scholar] [CrossRef]
- Chen, D.; Chen, C.; Zhou, C. Importance Evaluation of Kill Web Nodes Based on OODA Loop. Acta Armamentarii 2024, 45, 363–372. [Google Scholar] [CrossRef]
- Shu, Z.; Jia, Q.; Li, X.; Wang, W. An OODA Loop-Based Function Network Modeling and Simulation Evaluation Method for Combat System-of-Systems; Springer: Singapore, 2016; pp. 393–402. [Google Scholar]
- Li, J.; Fu, C.; Chen, Y.; Yang, K.; Zhang, X. An Operational Efficiency Evaluation Method for Weapon System-of-Systems Combat Networks Based on Operation Loop; IEEE: New York, NY, USA, 2014; pp. 219–223. [Google Scholar]
- Li, J.; Zhao, D.; Jiang, J.; Yang, K.; Chen, Y. Capability Oriented Equipment Contribution Analysis in Temporal Combat Networks. IEEE Trans. Syst. Man Cybern. Syst. 2018, 51, 696–704. [Google Scholar] [CrossRef]
- Tan, Y.; Zhang, X.; Yang, K. Research on Networked Description and Modeling Methods of Armament System-of-Systems. J. Syst. Manag. 2012, 21, 781–786. [Google Scholar]
- Li, J.; Tan, Y. Operation Loop Recommendation Method Based on Integrated Improved Ant Colony Algorithm. Syst. Eng. Electron. 2024, 46, 2002–2012. [Google Scholar]
- Zhao, D.; Tan, Y.; Li, J.; Dou, Y.; Li, L.; Liu, J. Research on Structural Robustness of Weapon System-of-Systems Based on Heterogeneous Network. Syst. Eng.-Theory Pract. 2019, 39, 3197–3207. [Google Scholar]
- Tarjan, R.E.; Zwick, U. Finding Strong Components Using Depth-First Search. Eur. J. Comb. 2024, 119, 103815. [Google Scholar] [CrossRef]
- Sun, Z.; Song, K. GEMimp: An Accurate and Robust Imputation Method for Microbiome Data Using Graph Embedding Neural Network. J. Mol. Biol. 2024, 436, 168841. [Google Scholar] [CrossRef]
- Joshi, N.S.; Sambrekar, K.P.; Patankar, A.J.; Jadhav, A.; Khadkikar, P.A. Enhancing Performance and Privacy on Cloud-Based Multi-Keyword Ranked Search Encryption Using Greedy Depth-First Encryption. Int. J. Fuzzy Log. Intell. Syst. 2024, 24, 416–427. [Google Scholar] [CrossRef]
- Zhang, Q.; Li, J.; Shen, D.; Ma, C. Research on Network Modeling and Optimization of Operation System of Systems Based on Complex Network. Syst. Eng. Electron. 2015, 37, 1066–1071. [Google Scholar]
- Zhao, D. Research on Contribution Rate of Weapon and Equipment System Evaluation Method Based on Heterogeneous Net-Work; National University of Defense Technology: Changsha, China, 2019. [Google Scholar]
- Onan, A.; Alhumyani, H. Knowledge-Enhanced Transformer Graph Summarization (KETGS): Integrating Entity and Discourse Relations for Advanced Extractive Text Summarization. Mathematics 2024, 12, 3638. [Google Scholar] [CrossRef]
- Xiao, Z.; Wang, Y.; Tan, G.; He, D.; Li, J.; Zhou, W. SCML-GNN: A Graph Neural Network Model Leveraging Sensor Causality and Meta-Learning for Mechanical Fault Classification. Int. J. Pattern Recognit. Artif. Intell. 2024, 38, 2456011. [Google Scholar] [CrossRef]
- Xu, S.; He, Q. Spatio-Temporal Dynamic Graph Attention Network-Based Detector for Sea-Surface Small Targets. IEEE Trans. Aerosp. Electron. Syst. 2024, 1–12. [Google Scholar] [CrossRef]
- Wang, X.; Zhang, L.; Jiang, Y.; Zhao, H. Optimizing Military Target Recognition in Urban Battlefields: An Intelligent Framework Based on Graph Neural Networks and YOLO. Signal Image Video Process. 2025, 19, 6. [Google Scholar] [CrossRef]
- Zhou, Y.; Zheng, H.; Huang, X.; Hao, S.; Li, D.; Zhao, J. Graph Neural Networks: Taxonomy, Advances, and Trends. ACM Trans. Intell. Syst. Technol. (TIST) 2022, 13, 1–54. [Google Scholar] [CrossRef]
- Veličković, P.; Cucurull, G.; Casanova, A.; Romero, A.; Lio, P.; Bengio, Y. Graph Attention Networks. arXiv 2017, arXiv:1710.10903. [Google Scholar]
- Cares, J.R.; Dickmann, J.Q., Jr. Operations Research for Unmanned Systems; John Wiley & Sons: Hoboken, NJ, USA, 2016; ISBN 1-118-91894-0. [Google Scholar]
- Peng, L.; Jichao, L.; Boyuan, X.; Danling, Z.; Yuejin, T. Weapons Equipment Portfolios Selection Based on Equipment System Contribution Rates. J. Syst. Eng. Electron. 2021, 32, 584–595. [Google Scholar] [CrossRef]
- Liu, P.; Zhu, L.; Zhou, Z.; Xiao, H. Research on Kill Chain Analysis Method Based on Template-Bayesian Network; IEEE: New York, NY, USA, 2021; pp. 972–976. [Google Scholar]
- Wang, S.; Du, Y.; Zhao, S.; Hao, J.; Gan, L. Research on the Construction of Weaponry Indicator System and Intelligent Evaluation Methods. Sci. Rep. 2023, 13, 19370. [Google Scholar] [CrossRef]
- Piaggesi, S.; Khosla, M.; Panisson, A.; Anand, A. Dine: Dimensional Interpretability of Node Embeddings. IEEE Trans. Knowl. Data Eng. 2024, 36, 7986–7997. [Google Scholar] [CrossRef]
- Wang, C.; Sun, J.; Meng, X.; Zhang, Y.; Li, H. Multi-Stage Degradation Feature with Dynamic Feedback Mechanism for Remaining Useful Life Prediction. Nondestruct. Test. Eval. 2025, 1–34. [Google Scholar] [CrossRef]
Disclaimer/Publisher’s Note: The statements, opinions and data contained in all publications are solely those of the individual author(s) and contributor(s) and not of MDPI and/or the editor(s). MDPI and/or the editor(s) disclaim responsibility for any injury to people or property resulting from any ideas, methods, instructions or products referred to in the content. |
© 2025 by the authors. Licensee MDPI, Basel, Switzerland. This article is an open access article distributed under the terms and conditions of the Creative Commons Attribution (CC BY) license (https://creativecommons.org/licenses/by/4.0/).