Abstract
We investigate whether China’s Value-Added Tax (VAT) Credit Refund policy influences firms’ sustainable development capability (SDC), which reflects innovation-driven growth and green development. Exploiting the 2018 implementation of the VAT Credit Refund policy as a quasi-natural experiment, we employ a difference-in-differences (DID) approach and find causal evidence that the policy significantly enhances firms’ SDC. This suggests that fiscal instruments like VAT refunds are valued by firms as drivers of long-term sustainable and high-quality development. Our mediating analyses further reveal that the policy promotes firms’ SDC by strengthening artificial intelligence (AI) capabilities and facilitating intelligent transformation. This mechanism “AI Capability Building—Intelligent Transformation” aligns with the socio-technical systems theory (STST), highlighting the interactive evolution of technological and social subsystems in shaping firm capabilities. The heterogeneity analyses indicate that the positive effect of VAT Credit Refund policy on SDC is more pronounced among small-scale and non-high-tech firms, firms with lower perceived economic policy uncertainty, higher operational diversification, lower reputational capital, and those located in regions with a higher level of marketization. We also find that the policy has persistent long-term effects, with improved SDC associated with enhanced ESG performance and green innovation outcomes. Our findings have important implications for understanding the SDC through the lens of STST and offer policy insights for deepening VAT reform and promoting intelligent and green transformation in China’s enterprises.
1. Introduction
Sustainable development, aimed at addressing economic, social, and environmental challenges, has remained a central theme on global agendas [1]. It also serves as a vital driver of green development, reflecting the harmonious integration of economic growth and environmental protection. In this context, sustainable development not only functions as a new engine of economic expansion but also fosters the formation of a high-quality, green, and modern industrial system [2]. The 2023 Global Sustainable Development Report emphasized the need to boost industrial innovation through science and technology, especially by using disruptive and frontier technologies to create new industries, business models, and growth drivers, which supports the development of SDC. However, disruptive innovation typically demands substantial capital investment [3], while enterprises often face liquidity constraints due to the accumulation of input VAT credits, which tie up considerable financial resources. The VAT credit refund policy returns unreimbursed input tax credits to firms in advance, helping to unlock tied-up funds and strongly supporting disruptive innovation. As key players in the market economy, enterprises are essential to the development and strengthening of SDC. Accelerating the growth of enterprise-level SDC is not only critical for capturing emerging opportunities and fostering sustainable development but also for optimizing economic structures and enhancing national competitiveness [4]. Therefore, thoroughly investigating how VAT credit refunds affect the development of firms’ SDC is of great significance. Such analysis contributes to improving the effectiveness of policy implementation, supports enterprise transformation and green sustainable development, and offers valuable insights for promoting China’s high-quality economic growth.
According to China’s Provisional Regulations on VAT, a VAT credit balance arises when a firm’s input VAT exceeds its output VAT. In recent years, China has implemented multiple rounds of VAT reform aimed at continuously enhancing the tax system. These reforms have brought tax cuts across all industries, easing corporate tax burdens, enhancing investment efficiency, and promoting economic growth. [5]. Furthermore, the VAT refund policy has played a pivotal role in reducing corporate financial fraud. By easing motivational pressures, limiting opportunities for fraudulent activity, and diminishing the rationalizations that firms might use to justify such behavior, the policy addresses the core elements of the fraud triangle, thereby reducing the risk of financial misconduct [6]. In addition, the VAT credit refund alleviates firms’ cash flow pressures, reduces operational costs, and enhances the return on investment. It also strengthens international competitiveness—particularly for export-oriented enterprises—by improving liquidity and operational efficiency [7]. Together, these effects show that VAT credit refunds significantly influence corporate development in various ways.
A review of the existing literature reveals that SDC, as a significant concept, has attracted considerable attention from scholars. Building on a comprehensive interpretation of its theoretical foundations, several studies have examined SDC through the lens of high-quality economic development and the pursuit of common prosperity [8]. Concurrently, other research has focused on developing measurement frameworks to assess the level and evolution of SDC across various regions and industries [9]. In addition, a growing body of literature has begun to explore the driving forces behind the development of SDC. For instance, recent studies suggest that the pilot implementation of China’s Emissions Trading Scheme has contributed to the establishment of a carbon market, thereby enhancing firms’ capacity for sustainable development [10]. Other findings demonstrate that media attention can significantly promote the sustainable development of industrial enterprises. Specifically, the impact of media attention on economic performance is found to be greater than its influence on firms’ social and environmental performance, and the effect of non-negative media coverage on sustainability is more pronounced than that of negative media coverage [11]. Despite the extensive academic discourse on both VAT credit refunds and SDC, a notable research gap remains: Few studies have directly examined the linkage between the two. This gap gives rise to several important and underexplored questions: Can the VAT credit refund policy effectively promote the development of firms’ SDC? Through what mechanisms—such as an AI empowerment chain composed of AI capability building and intelligent transformation—does this policy exert its influence? Furthermore, how does the impact of VAT credit refunds on SDC vary under different contextual conditions? Addressing these questions is crucial for advancing theoretical understanding and informing the design of sound policies.
To address the research gap identified in prior literature, this study adopts the STST framework and utilizes panel data from A-share-listed companies in Shanghai and Shenzhen for the period 2014–2023. Drawing on the concept of an AI empowerment chain, a chained mediation model is employed to empirically examine the impact of VAT credit refunds on the firm-level development of SDC. The heterogeneity analysis explores how the effects of VAT credit refunds differ under various conditions. From the perspective of internal firm characteristics, we assess the moderating roles of reputational capital and the degree of operational diversification. From the perspective of the external environment, we examine the influence of perceived economic policy uncertainty and the regional level of marketization. These contextual dimensions enable a comprehensive evaluation of how the relationship between VAT credit refunds and SDC is shaped by both internal and external factors. Furthermore, in the further analysis, we investigate whether the development of SDC contributes to improved corporate ESG performance and fosters green innovation. We also examine whether the VAT credit refund policy exerts a sustained, long-term impact on the enhancement of firms’ SDC.
The contributions of this research can be summarized along three key dimensions, each framed through the lens of STST: First, this study clarifies the causal mechanisms through which VAT credit refunds promote the development of SDC. By integrating the STST perspective, it emphasizes that capability enhancement is not merely a function of resource accumulation or optimization, but rather the outcome of a dynamic co-evolution between technological systems and social systems. The interplay between the two systems helps explain how financial relief from policies drives sustainable transformation in firms. Second, the study deepens the understanding of the specific pathways through which VAT credit refunds influence SDC. Utilizing a chained mediation model and introducing the concept of the AI empowerment chain, it uncovers the underlying mechanisms linking the policy to enterprise-level SDC. This approach reflects a core principle of STST: that technological innovation yields sustainable outcomes only when it is integrated with social systems, including employee competencies, decision-making processes, and organizational learning. The AI empowerment chain thus exemplifies how socio-technical integration mediates the relationship between external policy interventions and internal sustainable development processes. Third, through heterogeneity analysis conducted from both internal and external perspectives, the study demonstrates that the effectiveness of the VAT credit refund policy in enhancing SDC is context dependent. Specifically, the policy shows greater efficacy in firms with low perceived economic policy uncertainty, high levels of diversification, low reputational capital, and in regions with a higher level of marketization. These findings highlight that the effectiveness of policy tools depends on the alignment between external factors and a firm’s technological and social setup. By revealing these contextual differences, the study adds to our understanding of the conditions shaping the mechanisms behind SDC.
2. Literature Review and Research Hypotheses
2.1. Literature Review
2.1.1. Socio-Technical Systems Theory
The STST, first introduced by Cherns in 1976, underscores the necessity of aligning social and technical components within organizational systems [12]. This foundational concept was later expanded by Bostrom and Heinen, who framed the theory around three core elements: individuals, technology, and the nature of tasks [13]. A substantial body of existing research grounded in STST has focused on the implementation of specific technologies or tools—such as work systems and mobile applications—to improve organizational functioning [14]. This theoretical framework has been widely employed to analyze the development of emerging technologies that facilitate new forms of social interaction, ultimately enhancing efficiency, convenience, and collaboration in both professional and everyday settings. In our study on VAT credit refunds and enterprises’ SDC, STST offers a useful framework to understand how fiscal policy can promote technological upgrades (e.g., AI development and intelligent transformation) and shape organizational behavior (e.g., sustainable development capability). Rather than viewing VAT credit refunds solely as financial incentives, we interpret them as catalysts for socio-technical transformation, encouraging firms not only to adopt intelligent technologies but also to restructure internal processes and enhance workforce capabilities accordingly.
According to STST, the social and technical subsystems do not operate in isolation; rather, they co-construct the structure and function of the broader organizational system through dynamic and bidirectional interactions [15]. Among these subsystems, the social system is particularly crucial to the functioning of the technical system. The design, implementation, and evolution of technologies are invariably embedded within specific social structures, organizational routines, and cultural values. The influence of the social system on the technical system can occur through several mechanisms—for instance, through demand—and problem-driven innovation processes, where societal needs and operational challenges shape the direction of technological development, and through organizational constraints, where existing management rules may either hinder technological effectiveness or stimulate adaptive changes in technology [16]. At the same time, the technical system exerts a reciprocal influence on the social system. However, this influence is bounded by the adaptive capacity of the social system, which can either facilitate or limit technological integration. Achieving optimal performance thus requires joint optimization of both subsystems; otherwise, systemic failure may occur [17]. From this socio-technical perspective, improvements in firms’ SDC—reflected in enhanced ESG performance, intelligent transformation, and green innovation—should not be understood as the result of isolated technological upgrades alone. Rather, they emerge from the interdependent evolution of social and technical systems in response to policy stimuli [18]. This integrated perspective offers a deeper understanding of how macroeconomic instruments, such as VAT credit refunds, can reshape firm-level production systems and promote high-quality, sustainable economic growth.
2.1.2. Sustainable Development Capability
Sustainable enterprise development extends beyond the survival and success of individual firms—it plays a vital role in driving economic growth and promoting social progress. According to the Report on the Sustainable Development of Chinese Enterprises published by the United Nations Development Programme (UNDP), businesses must align their strategies with the Sustainable Development Goals (SDGs) to secure a viable future for life on Earth, highlighting the critical importance of sustainability in corporate practices [10]. Extensive research shows that sustainable enterprise development is crucial for long-term economic benefits, necessary for economic sustainability, and a strategic route to enduring business success. [19]. In the corporate context, sustainability entails the integration of economic, social, and environmental considerations into daily operations and strategic decision-making. To remain viable and competitive in the long term, firms must make meaningful contributions to broader societal sustainability goals [20]. Sustainable enterprise development involves embedding the principles of sustainable growth across all dimensions of business operations and decisions. Stakeholder theory offers a valuable theoretical lens through which to analyze and guide this process. It advocates that firms should consider and address the diverse interests of all stakeholders—including investors, employees, customers, local communities, and the environment [21]. Balancing these sometimes competing interests enables enterprises to align financial performance with broader social and ecological priorities, forming the cornerstone of long-term sustainable development.
However, while stakeholder theory captures the normative dimensions of corporate responsibility, it does not fully explain the mechanisms through which structural and policy interventions facilitate sustainable transformation within firms. To address this limitation, STST provides a complementary perspective. STST emphasizes the interdependence between technological and social systems, positing that sustainable transformation emerges through the co-evolution of both [22]. Within this integrated framework, sustainable enterprise development is understood as both an objective and an ongoing process. It is shaped not only by internal corporate values and external stakeholder expectations but also by the design and implementation of public policy instruments—such as VAT credit refunds—that can induce structural changes across both social and technical dimensions of organizations [23]. This integrated theoretical perspective offers a robust foundation for understanding how fiscal policy can support innovation-driven, sustainable growth.
2.1.3. VAT Credit Refunds
Article 4 of the Provisional Regulations on Value-Added Tax of the People’s Republic of China stipulates: “In cases where output VAT for the current period is lower than input VAT, the surplus input VAT may be carried forward to the subsequent period for continued credit application.” The portion by which a firm’s input VAT exceeds its output VAT and remains uncredited is defined as the VAT credit balance. In 2018, Document Caishui [2018] No. 70 identified 18 major industrial sectors, along with power grid enterprises, as eligible for the VAT credit refund policy. Subsequently, in 2019, Announcement No. 39—jointly issued by the Ministry of Finance, the State Taxation Administration, and the General Administration of Customs—specified the conditions under which taxpayers may apply to the competent tax authorities for a refund of excess input VAT credits. In 2022, the policy was further extended to allow eligible small and micro-sized enterprises to apply for refunds of incremental input VAT credits. The accumulation of VAT credit balances can be attributed to a variety of factors, broadly categorized into policy-related and firm-specific causes. Policy-related factors include China’s multi-tiered VAT rate system, government-imposed price controls, and national reserve policies. Firm-specific factors refer to long production cycles (e.g., in heavy machinery and infrastructure), substantial initial capital investments in some manufacturing sectors, and seasonal business patterns in certain industries. These factors frequently result in enterprises having lower output VAT credits relative to input VAT, leading to the accrual of credit balances. While these balances can be offset against future output VAT credits during the interim period between their creation and eventual utilization, they are effectively immobilized. This immobilization restricts their use as working capital, increasing the cost of capital and imposing an implicit tax burden on enterprises [6]. Consequently, this dynamic affects China’s overall business environment. To address this, the Chinese government has introduced and gradually expanded the VAT credit refund policy to reduce firms’ costs and support structural transformation and high-quality development of the real economy.
The existing literature has investigated the implementation effects of the VAT credit refund policy. In terms of corporate investment, the policy has been found to significantly increase environmental protection expenditure, particularly among firms subject to stricter environmental regulations, with greater development potential, and operating at a larger scale [24]. Furthermore, empirical studies reveal that pilot enterprises experienced notable productivity gains following the implementation of the policy. These gains are primarily attributed to improved operating cash inflows, enhanced incentives for innovation, and increased investment in highly educated human capital [25]. Notably, both environmental expenditure and production efficiency are considered core dimensions of SDC. In addition, some studies have identified a significant relationship between taxation and progress toward the SDGs. They argue that the achievement of SDGs in emerging economies is largely contingent upon the design of tax rates and fiscal policy frameworks [26]. Moreover, several scholars have emphasized the importance of cultivating a supportive tax and business environment to foster sustainable growth and enhance firm capacity, particularly within the Chinese context [27]. Despite its relevance, VAT credit refunds have received limited direct academic attention with respect to their impact on SDC. Most existing research has either focused on the broader effects of taxation systems on sustainable development or explored the influence of VAT credit refunds on specific dimensions of SDC. Building on these insights, this study offers both theoretical and empirical analyses of the causal relationship between VAT credit refund policies and firms’ SDC. It further explores the underlying mechanisms and heterogeneity in the policy’s effects and provides empirical evidence to support the continued refinement and optimization of VAT credit refund policies.
2.2. Theoretical Mechanism
Grounded in STST, this study investigates how the VAT refund policy enhances firms’ SDC by facilitating the co-evolution of social and technical subsystems. STST suggests that organizational advancement stems from the dynamic interaction between the social subsystem—including institutions, talent, and culture—and the technical subsystem—including technology, digital tools, and innovation processes. [28]. Embedded in the social system, the VAT refund policy not only redistributes financial resources and improves operational conditions but also acts as a strategic tool to enhance innovation, resilience, and long-term firm performance.
Specifically, the VAT refund policy reinforces the technical subsystem through two primary mechanisms: alleviating financial constraints and delivering strong institutional signals. Research and development (R&D) activities are typically marked by high uncertainty, long time horizons, and frequent market failures. By refunding previously immobilized tax credits, the policy significantly improves internal cash flows, reduces firms’ reliance on costly external financing [29], and provides stable funding for high-risk technological innovation [30]. Effectively, it establishes a form of funding interest-free that supports sustained investment in innovation. Moreover, the policy transmits a clear directional signal, encouraging firms to align their R&D agendas with national sustainability objectives, particularly in green and low-carbon technologies [31,32]. These signaling effects help redirect technological trajectories, aligning with STST’s emphasis on the guiding role of institutional frameworks.
Concurrently, the policy enhances the social subsystem by optimizing human capital structures, a critical component of socio-technical systems [33]. The liquidity gains from VAT refunds enable firms to offer higher compensation to R&D personnel, thereby improving their capacity to attract and retain top-tier talent in a competitive labor market. This not only reinforces the psychological contract between employers and employees—boosting organizational commitment and engagement in innovation [34]—but also contributes to the long-term stability of human resources. Additionally, the policy facilitates investment in interdisciplinary talent development, which promotes cross-domain knowledge integration. This form of knowledge synergy is regarded by STST as a fundamental driver of systemic innovation and enduring transformation.
Taken together, the VAT refund policy contributes to firms’ SDC by strengthening innovation ecosystems, optimizing talent configurations, and reducing structural financial constraints. These enhancements improve not only short-term innovation outcomes but also the foundational capacities required for sustained competitive advantage and long-term organizational success. In this regard, the policy functions as a transformative tool that reshapes the internal dynamics of the socio-technical system. It establishes a resilient and adaptive structure through which firms can enhance their SDC amid increasingly uncertain market and environmental conditions. Based on the above theoretical reasoning, we propose the following hypothesis:
Hypothesis 1 (H1).
The VAT credit refund policy significantly promotes the development of firms’ sustainable development capacity (SDC).
Within the socio-technical systems framework, AI technologies have emerged as a critical bridge connecting external policy incentives with internal technological upgrading. AI enhances firms’ adaptive capacity and responsiveness in complex and dynamic environments, positioning it as a key enabler of intelligent transformation [35]. However, while the VAT refund policy alleviates short-term liquidity constraints, the extent to which this increased liquidity translates into sustained AI investment depends heavily on internal organizational alignment.
According to STST, institutional incentives promote long-term technological advancement only when they align with a firm’s internal structure and innovation logic. The VAT refund policy enhances resource allocation flexibility, allowing enterprises to redirect financial resources toward strategic priorities [36]. Importantly, rather than channeling liquidity into non-productive or short-term expenditures, many firms opt to invest in AI technologies, both because such investments are consistent with national policy directions and because they support long-term market competitiveness. The policy itself delivers a powerful institutional signal indicating that innovation—especially AI-enabled and green innovation—is not only encouraged but actively rewarded [37,38,39]. This signaling effect mitigates information asymmetry and policy uncertainty, prompting firms to realign their internal strategies accordingly.
As a result, an increasing number of firms allocate surplus liquidity toward the technical subsystem, with a particular focus on building AI capabilities and facilitating intelligent transformation [37]. This forms a structured AI empowerment chain [39], which also functions as a feedback mechanism: AI implementation enhances data integration, decision-making efficiency, and overall operational performance, thereby further strengthening firms’ innovation capacity. In parallel, AI contributes to green transformation through its applications in eco-design, energy optimization, and sustainable supply chain management, all of which improve firms’ environmental performance [39]. Given the growing emphasis on high-quality development, the AI empowerment chain becomes a critical pathway through which policy-induced liquidity is translated into substantive technological progress [40]. In this transformation, firms evolve from passive recipients of policy benefits to proactive agents of innovation, thereby enhancing not only their innovation outputs and long-term performance but also their SDC [41]. Drawing upon the preceding analysis, this study proposes the following hypothesis:
Hypothesis 2 (H2).
The VAT credit refund policy promotes the enhancement of firms’ sustainable development capacity (SDC) through the AI empowerment chain.
According to the STST, firms operate within a complex, multi-layered structure composed of technological infrastructure, institutional arrangements, cultural norms, and organizational routines [42]. The effectiveness of policy instruments, such as the VAT credit refund, varies across enterprises and depends on the configuration and interplay of these subsystems. For policy incentives to effectively foster SDC, firms must demonstrate adequate absorptive capacity within the technical subsystem and be embedded within a supportive and adaptive social environment. Within this framework, several firm-level and regional factors—including perceived economic policy uncertainty, operational diversification, reputational capital, and regional marketization—function as moderators that influence this process and are important.
First, perceived economic policy uncertainty captures the stability of the broader institutional environment. Elevated uncertainty diminishes the effectiveness of policy incentives by disrupting decision-making processes within the social subsystem. From a supply-side perspective, uncertainty exacerbates information asymmetry, increases default risk, and constrains credit accessibility [43]. On the demand side, it prompts precautionary behaviors among managers, who tend to hoard cash and avoid long-term commitments [44,45]. Under such conditions, even firms with improved liquidity may hesitate to allocate resources toward innovation-related investments. Conversely, firms operating under lower levels of perceived uncertainty are better positioned to interpret policy signals confidently and reconfigure resources accordingly, thereby more effectively channeling VAT refunds into sustainable innovation. Hence, the impact of policy on SDC is amplified in firms experiencing lower economic policy uncertainty.
Second, operational diversification reflects a firm’s internal flexibility and structural adaptability within the socio-technical system. Firms with diversified operations typically span multiple sectors and product lines, which cushions them against market volatility and facilitates dynamic resource reallocation. These firms often possess more complex technological systems and exhibit stronger demand for innovation, rendering them more responsive to VAT refund-induced liquidity [26]. STST posits that the transformative capacity of the technical subsystem is enhanced when the organizational structure supports differentiated innovation pathways. Accordingly, diversified firms are more likely to translate fiscal incentives into targeted investments that advance SDC [46,47].
Third, reputational capital constitutes an external social asset embedded within the institutional subsystem. Firms endowed with high reputational capital generally benefit from greater stakeholder trust, easier access to financing, and enhanced visibility of their innovation outputs [48]. While such firms may already have structural advantages enabling investments in sustainable technologies, those with lower reputational capital often face significant resource constraints and limited external support. In these instances, the VAT credit refund acts as a compensatory institutional mechanism, mitigating deficiencies within the social subsystem and unlocking innovation potential. From an STST standpoint, policy interventions can temporarily bolster both the external legitimacy and internal capacity of low-reputation firms, thereby amplifying their responsiveness to innovation.
Finally, the level of regional marketization reflects the maturity and openness of the institutional environment in which firms operate. Regions characterized by high marketization typically exhibit more efficient capital markets, reduced information asymmetry, and stronger enforcement of policy frameworks [49]. These features facilitate the integration of policy instruments within both social and technical subsystems, enhancing firms’ capabilities to convert VAT-induced liquidity into productive, innovation-driven outcomes. STST emphasizes that a well-functioning external environment fosters the co-evolution of firm-level systems, positioning marketization as a crucial moderator of policy effectiveness.
In summary, these moderating factors shape how VAT credit refunds interact with firm-level socio-technical configurations, either enabling or constraining the translation of fiscal incentives into SDC. Based on the theoretical foundation outlined above, the following hypothesis is proposed:
Hypothesis 3 (H3).
The lower the firm’s economic policy uncertainty is perceived, the more effective VAT credit refunds are in promoting its sustainable development capacity (SDC).
Hypothesis 4 (H4).
The higher the firm’s degree of operational diversification, the more effective VAT credit refunds are in promoting its sustainable development capacity (SDC).
Hypothesis 5 (H5).
The lower the firm’s reputational capital, the more effective VAT credit refunds are in promoting its sustainable development capacity (SDC).
Hypothesis 6 (H6).
The higher the level of marketization in the region where the firm is located, the more effective VAT credit refunds are in promoting its sustainable development capacity (SDC).
The conceptual model in this research is shown in Figure 1.
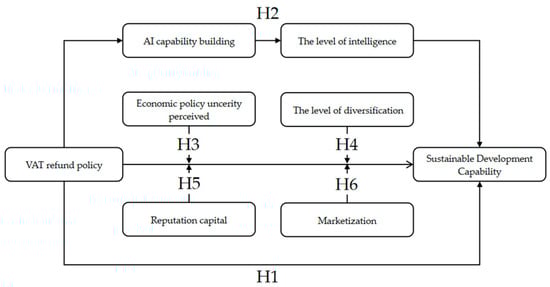
Figure 1.
Conceptual model.
3. Empirical Strategy
3.1. Selection of Sample and Data Sources
To further investigate the impact of the VAT credit refund policy on SDC, this study focuses on the industries specified in Circular No. 70 [2018] issued by the Ministry of Finance and the State Administration of Taxation. The year 2018 is selected as the policy intervention point, and a traditional DID approach is employed to identify the effect of the VAT credit refund policy on corporate sustainable development. This methodological choice is based on the following considerations:
First, the issuance of Caishui [2018] No. 70 marked the initial systematic implementation of the VAT credit refund policy, explicitly designating 18 major industry categories along with power grid enterprises as eligible beneficiaries. This policy introduction constituted a significant institutional shift from a previously non-existent framework, thereby serving as a distinct exogenous shock suitable for causal inference. Subsequent developments—such as Announcement No. 39 in 2019, which refined the application procedures and eligibility criteria, and the 2022 expansion of the policy to include small and micro enterprises—are regarded as incremental policy adjustments or extensions. These follow-up measures lack distinct shock characteristics and staggered implementation; thus, they are unsuitable for a staggered DID design.
Second, from a methodological perspective, the traditional DID model offers greater interpretability when treatment and control groups are delineated and the timing of policy intervention is uniform. In contrast, a multi-period DID framework requires the assumption that treatment is administered at different times across entities in an exogenous manner—an assumption that does not hold in the context of this policy. To ensure the validity of causal inference and consistency with the actual implementation logic of the VAT refund policy, this study adopts the traditional DID model as the primary empirical strategy.
Firm-level data are obtained from the China Stock Market and Accounting Research (CSMAR) database. To ensure the robustness and reliability of the empirical results, the following sample selection and data processing procedures are implemented: (1) Firms with abnormal trading status during the sample period (i.e., ST, *ST, or PT) are excluded; (2) enterprises with substantial data omissions are removed from the sample; (3) to mitigate the influence of extreme values, all continuous variables are winsorized at the 5th and 95th percentiles.
3.2. Model Construction
According to Circular No. 70 [2018], in this study, the pilot enterprises are assigned to the treatment group, while the remaining enterprises are categorized as the control group. A DID model is employed to conduct the empirical analysis, aiming to examine whether the VAT credit refund policy enhances the level of SDC in firms. The model is specified as follows:
where the dependent variable () represents enterprise i’s SDC in year t; the core independent variable () captures the impact of the VAT credit refund policy; controls represent the collection of control variables; represents the error term; , are associated with firm fixed effects and year fixed effects, respectively. The regression coefficient of the core independent variable reflects the effect of the VAT credit refund policy on SDC, which constitutes the primary empirical result of interest in this study.
3.3. Variable Definitions
3.3.1. Dependent Variable
Sustainable development capability (SDC) reflects a firm’s ability to achieve long-term growth while balancing economic, environmental, and social goals. Based on prior studies [50,51,52], this paper measures SDC through three key dimensions: sustainable laborers, sustainable labor objects, and sustainable labor materials. The entropy method is employed for measurement, and the resulting index is denoted as SDC. The detailed measurement indicators are outlined in Table 1.

Table 1.
Indicators of firms’ sustainable development capability.
3.3.2. Independent Variable
VAT Credit Refund Policy (). This study adopts a DID approach and defines two key independent variables, and . is a policy dummy variable. It takes a value of 1 if the firm belongs to one of the 18 major industries or the power grid enterprises listed in Circular No. 70 [2018] of the Ministry of Finance and the State Administration of Taxation, and 0 otherwise. In cases where a firm’s industry classification changes during the sample period, manual screening is performed to exclude such observations. is a time dummy variable. It takes a value of 1 for the years 2018 and thereafter (after the implementation of the VAT credit refund policy), and 0 otherwise.
3.3.3. Mediating Variable
AI Empowerment Chain: The AI empowerment chain comprises two components: AI capability building and the degree of intelligent transformation. The measurement of AI capability building follows the approach of prior studies [53]. Specifically, based on the item descriptions and amounts of fixed assets and intangible assets disclosed in the notes to listed companies’ financial statements, we manually identify the portions of investments related to artificial intelligence. The sum of these AI-related investments is then divided by the firm’s total annual assets to measure the level of AI capability building.
The degree of intelligent transformation is assessed using a dataset constructed through Python-based text analysis of the annual reports of listed companies. Keywords associated with intelligent technologies are identified, matched, and their frequencies are counted. These frequency counts are then classified according to key technological domains and aggregated into a composite measure. The natural logarithm of the total keyword frequency is subsequently taken to construct a firm-level index of intelligent transformation [54].
3.3.4. Control Variables
This paper incorporates controls for a range of firm-specific characteristics, including firm size (Size), leverage (Lev), return on assets (Roa), asset turnover ratio (ATO), cash flow ratio (Cashflow), firm age (FirmAge), growth (Growth), management shareholding ratio (Mshare), and institutional investor ownership (INST), including year fixed effects and firm fixed effects. The definitions of these variables are provided in Table 2.
Table 2.
Variable definitions.
3.4. Descriptive Statistics
Table 3 presents the descriptive statistics of the key variables. The minimum value of firms’ SDC is 0.030, while the maximum reaches 0.350, indicating substantial heterogeneity in SDC levels across firms. The mean value of Treat is 0.620, suggesting that the number of firms covered by the VAT credit refund policy exceeds those not covered. This reflects the broad applicability of the policy and underscores its practical necessity.
Table 3.
Descriptive statistics of main variables.
Both the mean and median values of AI capability building are 0, with a standard deviation of 0.01 and a maximum value of only 0.02. This suggests that most firms have not yet undertaken systematic investments in AI-related infrastructure. For the degree of intelligent transformation (It), the maximum value is 3.580 and the minimum is 0, with a standard deviation of 1.160. These figures indicate considerable variation in the extent of intelligent transformation across firms.
4. Empirical Results and Analysis
4.1. Test for Parallel Trends
The validity of the DID model hinges on the parallel trends assumption, which requires that the treatment and control groups exhibit similar trends before the implementation of the policy. Theoretically, the impact of the VAT credit refund policy on firms’ SDC should only emerge after the policy is introduced; thus, there should be no significant divergence in the pre-policy SDC trends between the two groups.
To test this assumption, an event study approach is employed using the period pre1 as the benchmark. A regression analysis is conducted to estimate the dynamic treatment effects. As shown in Figure 2, the estimated coefficients for the pre-policy dummy variables (pre) exhibit relatively small fluctuations, with their corresponding confidence intervals generally encompassing zero. Although the coefficient for pre2 shows a slight increase, it does not reach statistical significance. This suggests that, before policy implementation, the treatment and control groups followed comparable developmental trajectories, thereby supporting the validity of the parallel trends assumption.
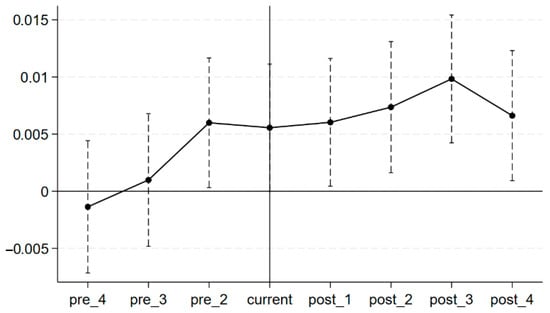
Figure 2.
Parallel trend test.
In the post-treatment period, the estimated coefficients for the dummy variables (post1 to post4) display a general upward trend, peaking in the post3 period. This pattern indicates that the policy may have exerted a positive effect on the treatment group. While the confidence intervals for post1 to post4 still include zero—implying that individual period effects may not reach conventional significance thresholds—the overall trajectory of the coefficients provides suggestive evidence of a policy impact. In summary, the parallel trends assumption is empirically validated, and the observed post-policy dynamics are consistent with theoretical expectations. These results establish a credible foundation for causal inference based on the DID methodology.
4.2. Baseline Regression Analysis
As a key policy instrument in economic management, the VAT credit refund policy alleviates the tax burden on enterprises, enhances liquidity, reduces financing constraints, and fosters corporate growth and expansion. In doing so, it continuously injects momentum into economic development and creates a favorable environment for enhancing firms’ SDC. Accordingly, this study employs a DID approach to examine the effect of the VAT credit refund policy on firms’ SDC. The regression results are presented in Table 4. Column (1) reports the estimation results without control variables but accounting for year and firm fixed effects. The coefficient for the VAT credit refund policy on SDC is 0.006, and it is statistically significant at the 1% level. Column (2) includes control variables while still controlling for year and firm fixed effects. The coefficient remains at 0.006 and continues to be significant at the 1% level. These results indicate that the VAT credit refund policy has a significant positive impact on firms’ SDC, thereby providing empirical support for Hypothesis H1.
Table 4.
Regression results.
Meanwhile, the DID model assumes that the treatment and control groups are randomly assigned. Although the implementation of the VAT credit refund policy is driven by exogenous policy factors, it may still be influenced by certain firm-specific characteristics. To mitigate potential selection bias arising from omitted variables, this study follows the approach of He [55,56,57] and adopts a propensity score matching difference-in-differences (PSM-DID) approach to construct a control group that closely resembles the treatment group. Regression estimation is then conducted on the matched sample. Firm-level control variables from the baseline regression are used as covariates, and a Logit model is employed to estimate propensity scores. A 1:1 nearest neighbor matching method is applied to pair firms participating in the VAT credit refund pilot program with the most similar non-participating firms. Balance tests are conducted to assess sample comparability before matching, as illustrated in Figure 3.
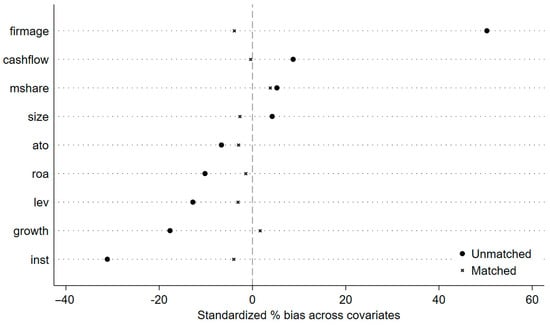
Figure 3.
Propensity Score Matching.
Subsequently, regression analysis is performed on the matched sample, and the results are reported in Column (3) of Table 4. The estimated coefficient after matching remains significantly positive at the 1% level, indicating that the VAT credit refund policy significantly enhances firms’ SDC and plays a constructive role in promoting enterprise development.
4.3. Robustness Test
4.3.1. Placebo Test
Given the possibility that unobservable, time-varying omitted variables may bias the estimation of policy effects, this study conducts a placebo test to rule out potential interference from such factors. By randomly assigning firms to a treatment group, the analysis performs 500 rounds of random sampling, re-estimating the regression each time with firms’ SDC as the dependent variable. If the interaction term derived from the randomly assigned treatment group is statistically insignificant, this suggests that the simulated treatment group has no effect on SDC, thereby supporting the validity of the actual policy impact. Using this random sampling framework, the study constructs an estimation distribution plot to visualize the distributional characteristics of the estimated coefficients. As shown in Figure 4, the coefficients from the placebo regressions are predominantly clustered around zero. The probability of obtaining a coefficient as large as 0.006, as reported in the baseline regression, is extremely low. This finding suggests that the model specification does not suffer from omitted variable bias and that potential unobserved confounders are unlikely to distort the estimation results. Therefore, the placebo test results demonstrate the robustness of this study’s findings and provide further evidence that the observed effect of the VAT credit refund policy on enhancing firms’ SDC is genuine rather than spurious.
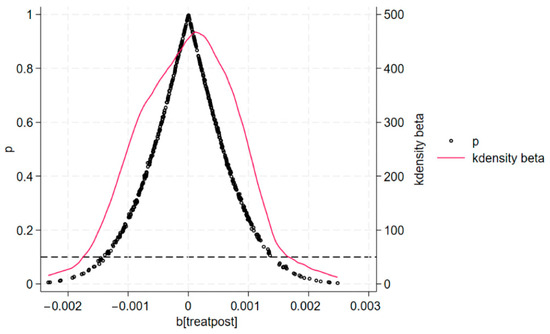
Figure 4.
Placebo test.
4.3.2. Increased High-Dimensional Interaction Fixed Effects
To address potential endogeneity arising from unobserved variables, this study employs a high-dimensional interaction fixed effects model. By introducing interaction terms between time and region, the model accounts for factors that vary simultaneously across temporal and geographical dimensions. Specifically, incorporating fixed effects for both year–region interactions allows for more precise control over potential confounding variables, thereby enhancing the model’s robustness. The objective of this approach is to improve the model’s explanatory power, reduce estimation bias, and reinforce the credibility of causal inference. As reported in Column (1) of Table 5, the estimated coefficient remains positive and statistically significant at the 1% level. This result indicates that, even after accounting for unobserved time-varying and region-specific factors, the effect of the VAT credit refund policy on firms’ SDC remains robust, further confirming that the policy plays a meaningful role in promoting improvements in SDC.
Table 5.
Robustness test.
4.3.3. Exclusion of Special Samples Test
Given that the sample period covers years following 2020, the global COVID-19 pandemic is regarded as an unexpected external shock impacting corporate operations. Ignoring this factor may lead to endogeneity issues. Therefore, this study excludes special samples from 2020 and onward and re-estimates the regression. If the significance of the core independent variables remains consistent with previous conclusions under this condition, it suggests that the results are robust. According to the regression results presented in Column (2) of Table 5, the regression coefficient for the core independent variable is 0.004, and it remains statistically significant at the 5% level, indicating that the findings of this study demonstrate strong robustness.
4.3.4. Substitution of Dependent Variables
Some dependent variable indicators rely solely on a binary classification of whether the executive team possesses a digital background, lacking standardized quantitative criteria. While the entropy weighting method assigns weights based on data variability, it may fail to capture the underlying economic significance of the indicators. In contrast, total factor productivity (TFP), which is derived from observable input and output data, minimizes the bias introduced by subjective indicator selection [58]. Therefore, this study replaces SDC with TFP, estimated using the Levinsohn–Petrin (LP) method. As shown in Column (3) of Table 5, the estimated coefficient is positive and statistically significant at the 1% level.
To further verify the robustness of the results, this study incorporates additional components into the dependent variable. In the environmental dimension, indicators include environmental management targets, energy use monitoring, and climate change management systems; in the social dimension, indicators cover human capital, product responsibility, and social contribution. The expanded SDC index offers a more comprehensive representation of firms’ environmental and social performance [59]. As reported in Column (4) of Table 5, the coefficient of the independent variable remains positive and statistically significant. These findings confirm that the study’s main conclusions are robust to alternative measurements of the dependent variable.
4.4. Mediating Mechanism Test
When the influence mechanism involves multiple layers of mediation, the bootstrap method serves as a robust approach for testing multi-step mediation effects. This study utilizes the PROCESS macro in IBM SPSS Statistics 27, designating the VAT credit refund as the independent variable, SDC as the dependent variable, and AI capability building and the level of intelligent transformation as sequential mediators to conduct the bootstrap test. A 95% confidence level is adopted with 5000 resamples, and the results are presented in Table 6. The findings reveal that the VAT credit refund exerts a positive indirect effect on firms’ SDC through three distinct mediation pathways. As shown in Table 6, the confidence intervals for the coefficients of all three mediation paths exclude zero, indicating that both AI capability building and the level of intelligent transformation act as multiple chain mediators between VAT credit refund and firms’ SDC. These results provide empirical support for Hypothesis H2.
Table 6.
Chain mediation effect regression results.
Specifically, Table 6 shows that the total indirect effect of the VAT credit refund on firms’ SDC is 0.2856. The mediating effect of AI capability building is 0.0109, accounting for 3.81% of the total effect. The mediating effect of the level of intelligent transformation is 0.2555, representing 89.46% of the total. The chain mediating effect—from AI capability building through intelligent transformation—is 0.0192, accounting for 6.72%. The relatively modest share of the AI capability building pathway suggests that Chinese firms currently exhibit limited value creation capacity in AI development. This highlights existing challenges and underscores the importance of improving the efficiency of AI resource deployment. On the other hand, the dominant role of the level of intelligent transformation—accounting for nearly 90% of the total indirect effect—indicates that intelligent transformation is the primary driver of the VAT credit refund’s impact on firms’ SDC.
Moreover, the overall AI empowerment chain exerts a smaller mediating effect than the level of intelligent transformation alone, implying that under the influence of VAT credit refunds, firms still face obstacles in fully converting AI-related investments into meaningful improvements in SDC. This calls for further investigation into the specific mechanisms through which VAT credit refunds enhance corporate sustainability outcomes.
To address potential construct validity concerns associated with the original data, this study refines the measurement of mediating variables within the AI empowerment chain. Specifically, for AI capability building, a composite index is constructed based on the number of independently granted AI-related invention patents and AI utility model patents at the firm level in a given year [60]. These components are weighted and aggregated into a ratio-based index that more comprehensively captures the technological depth and innovation outcomes associated with AI capability accumulation.
For the level of intelligent transformation, the text-mining methodology is enhanced by expanding the keyword dictionary to include terms such as cloud computing, Internet of Things (IoT), and machine learning. This refinement allows for a more accurate representation of the scope and intensity of intelligent technology integration at the firm level [61]. As shown in Table 7, the confidence intervals for the coefficients of all three mediation paths exclude zero, indicating statistical significance. These results reaffirm that both AI capability building and the level of intelligent transformation jointly serve as multiple chain mediators in the relationship between the VAT credit refund policy and firms’ SDC.
Table 7.
Chain mediation effect regression with different measurement approaches.
4.5. Heterogeneity Test
4.5.1. Perception of Economic Policy Uncertainty
To test Hypothesis H3, a perceived economic policy uncertainty index was constructed by analyzing listed firms’ annual reports through Python 3 and Jieba segmentation [62]. Firms with index values above the median were categorized as the high policy uncertainty group, while those below the median were assigned to the low policy uncertainty group. As presented in Table 8 and illustrated in Figure 5, VAT credit refunds significantly enhance SDC in the low uncertainty group; however, this positive effect diminishes under conditions of high uncertainty.
Table 8.
Heterogeneity analysis (1).
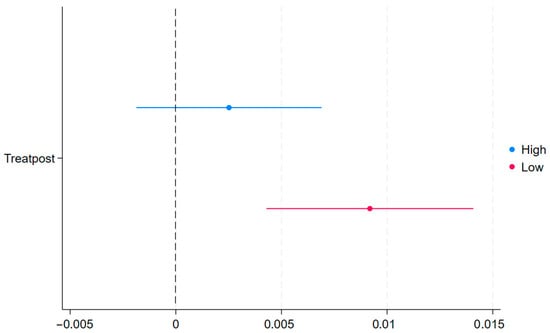
Figure 5.
Heterogeneity test of economic policy uncertainty perception.
Specifically, in Table 8 and Figure 5—particularly in columns (1) and (2)—it is evident that the impact of VAT credit refunds on enterprises’ SDC is more pronounced in the low uncertainty perception group compared to the high uncertainty group. This outcome aligns with the understanding that high economic uncertainty discourages firms from engaging in long-term investments and innovation, due to increased risks and sunk costs [63,64]. From an STST perspective, external incentives such as VAT refunds are more effective when decision-making and organizational change are supported by a stable social system. In the absence of such alignment, technical or financial incentives alone may fail to drive sustainable transformation. Consequently, the influence of VAT credit refunds on SDC is attenuated in firms experiencing higher levels of economic policy uncertainty.
4.5.2. Level of Diversification
As previously discussed, firms with higher diversification experience a stronger impact of VAT credit refunds on their SDC. To test Hypothesis H4, the income entropy index is the proportion of revenue from the i-th industry in total revenue [65,66]. A higher index indicates greater diversification. Firms above the median are classified as the high diversification group, while those below are considered the low diversification group. Regression results in Table 8 and Figure 6, columns 3 and 4, show that VAT credit refunds significantly enhance SDC in highly diversified firms.
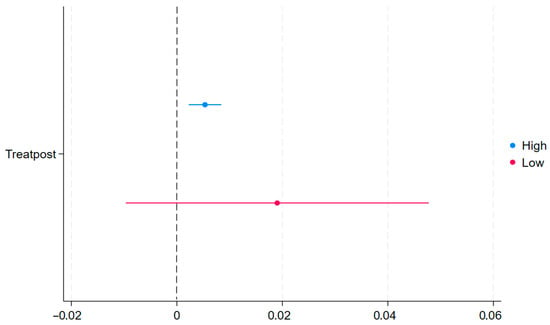
Figure 6.
Heterogeneity test of degree of diversification.
Diversification reduces reliance on a single industry, optimizes resource allocation, and lowers operational risks [67], thereby encouraging long-term technological investment. From the STST perspective, diversification represents a more adaptive socio-technical structure, enabling firms to integrate new technologies—such as those incentivized by VAT refunds—across business units. It also facilitates alignment with policy-targeted sectors, reduces institutional friction [68], and enhances strategic flexibility, amplifying the policy’s effect on SDC.
4.5.3. Reputation Capital
As proposed in Hypothesis H5, VAT credit refunds exert a stronger influence on SDC in firms with lower reputation capital, whereas this effect diminishes in firms with higher reputation capital. To examine this, the study constructs a reputation score based on 12 corporate reputation indicators, ensuring practical applicability, effectiveness, and comprehensive conceptual coverage. Factor analysis was employed to generate scores ranging from 1 to 10, with firms above the median categorized as high reputation and those below as low reputation [69]. The regression results presented in Table 9 (Columns 1 and 2) and Figure 7 confirm that firms with lower reputation capital derive greater benefits from VAT credit refunds in enhancing SDC.
Table 9.
Heterogeneity analysis (2).
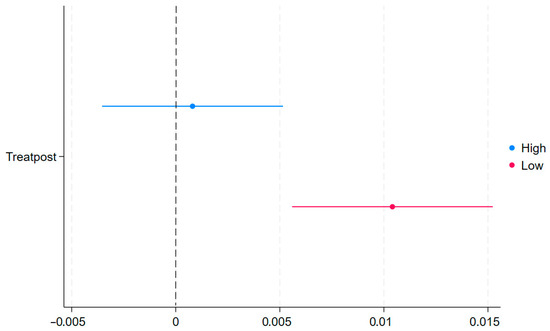
Figure 7.
Heterogeneity test of reputational capital.
Corporate reputation, which reflects stakeholders’ perceptions, functions as a form of social capital that facilitates access to financing, markets, and advanced technologies [70,71]. Firms with weaker reputation capital encounter greater barriers to resource acquisition and thus rely more heavily on external policy support. From the perspective of STST, reputation capital is embedded within the social subsystem, shaping firms’ interactions with stakeholders and institutions. For firms with low reputation capital, VAT credit refunds help mitigate deficiencies in social structures, thereby enabling increased investment in technical systems. This interplay between social and technical subsystems amplifies the policy’s positive effect on SDC.
4.5.4. Level of Marketization
As proposed in Hypothesis H6, VAT credit refunds exert a stronger positive effect on SDC in regions with higher levels of marketization. To test this hypothesis, the study employs a provincial-level marketization index to quantify regional marketization, where higher scores indicate more advanced market-oriented reforms [72,73]. The regression results reported in Table 9 (Columns 3 and 4) and illustrated in Figure 8 demonstrate that the policy’s impact on SDC is significantly greater in highly marketized regions.
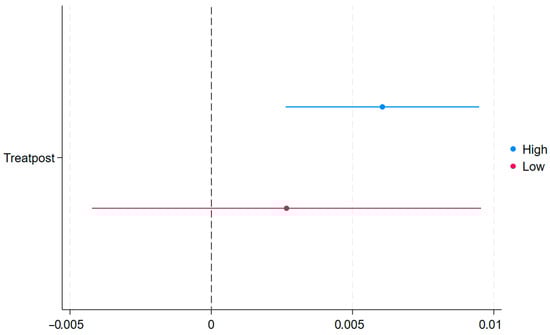
Figure 8.
Heterogeneity test of the degree of marketization.
Marketization reflects the degree of market-oriented reforms and the integration of market mechanisms within a region. In areas with low marketization, weak regulatory frameworks, and underdeveloped capital markets increase firms’ vulnerability to policy uncertainty and financing constraints [74], thereby limiting their capacity to convert VAT refunds into productive capabilities and enhanced SDC. From the perspective of STST, this situation represents a misalignment between social and technical subsystems. Conversely, high marketization fosters stronger coordination among firms, markets, and institutions, establishing a positive feedback loop that enables refunded taxes to be more effectively invested in sustainable technologies and practices [75]. Consequently, the VAT credit refund policy exerts a more pronounced influence on SDC in regions characterized by higher degrees of marketization.
5. Further Analysis
To further investigate the impact of the VAT credit refund policy on SDC, this study extends the analysis to explore its economic consequences, variations across firm size and high-technology status, as well as its long-term effects. While previous analyses have established the policy’s effectiveness and heterogeneity, examining these additional dimensions offers deeper insights into how firms with distinct structural and technological characteristics respond over time, and how enhancements in SDC contribute to broader outcomes such as ESG performance and green innovation.
5.1. Firm-Level Characteristics
5.1.1. Enterprise Scale
Firm scale is measured using total assets and the number of employees. The sample is subsequently divided into large- and small-scale groups based on the industry median for further analysis [76]. The empirical results presented in Columns (1) and (2) of Table 10 indicate that the VAT credit refund policy exerts a significant positive effect on SDC in small-scale firms, whereas the effect is not statistically significant in larger firms. From the perspective of STST, this disparity can be explained by differences in firms’ socio-technical configurations. Large firms generally possess more mature technical systems and stable social subsystems, supported by abundant internal resources and established innovation capabilities. Consequently, they are less reliant on external policy incentives to drive sustainable transformation. Conversely, smaller firms often face more severe financial constraints and weaker technical infrastructures, rendering them more dependent on policy-induced liquidity to support research and development investments and technological upgrades [77]. The VAT credit refund policy helps alleviate these resource limitations, thereby facilitating the co-evolution of their social and technical subsystems and enhancing their SDC.
Table 10.
Enterprise scale and industry type.
5.1.2. Industry Type
According to the classification guidelines issued by the China Securities Regulatory Commission, firms with classification codes within the ranges C25–C27, C37–C40, C42, D44, I63–I65, M73, and N77 are identified as high-tech industry enterprises. The analysis presented in Columns (3) and (4) of Table 10 further reveals that the VAT credit refund policy has a stronger positive effect on non-high-tech enterprises, whereas its impact on high-tech enterprises is comparatively less pronounced. From the perspective of STST, high-tech firms typically possess advanced technical systems and robust social subsystems, including greater access to financing, skilled talent, and innovation networks. These firms often sustain technological development without substantial reliance on external fiscal support. In contrast, non-high-tech enterprises generally lack such advantages and face more significant challenges in resource acquisition and technological upgrading [78]. For these firms, VAT credit refunds function as a crucial external stimulus, alleviating financial constraints and facilitating the integration of new technologies into their production processes. This dynamic interaction fosters the co-evolution of social and technical subsystems, thereby effectively enhancing their SDC.
5.2. Long-Term Effects
To assess the persistence of the policy effects, this study extends the model by incorporating one-, two-, and three-year lags of the treatment variable. This approach is consistent with STST, which posits that organizational transformation and technological upgrading are gradual processes characterized by delayed and cumulative impacts. The empirical results presented in Columns (1), (2), and (3) of Table 11 demonstrate that all lagged terms are statistically significant, indicating that the VAT credit refund policy exerts not only immediate but also sustained effects on firms’ SDC.
Table 11.
Lagged effects and short-term outcomes analysis.
Additionally, this study examines short-term performance metrics, including return on equity (ROE) and gross profit margin (GPM), to determine whether the policy’s impact extends to immediate financial outcomes. Notably, the results in Columns (4) and (5) of Table 11 reveal no statistically significant effects on either ROE or GPM. This absence of short-term performance improvement supports the interpretation that refunded VAT resources are not primarily allocated toward short-term profit maximization. Instead, these resources are directed toward long-term strategic investments, such as the development of artificial intelligence capabilities and sustainable growth initiatives. The sustained significance of the policy over multiple periods suggests a dynamic reinforcement mechanism, whereby benefits materialize progressively through ongoing resource reallocation and capability enhancement. These findings underscore the long-term effectiveness of fiscal policy instruments in promoting structural transformation within socio-technical systems.
5.3. Economic Consequences Test
5.3.1. ESG Performance
SDC embodies a productivity growth model driven by innovation and green development, in contrast to traditional models that depend heavily on high resource inputs and energy consumption. This emerging model supports long-term economic sustainability [51] by steering traditional industries toward emerging sectors and optimizing development patterns [79]. By emphasizing ecological sustainability and harmonizing economic and social objectives, enterprises enhance their ESG performance. Centered on innovation and efficient resource allocation [80], SDC mitigates resource depletion and environmental degradation, thereby promoting high-quality development and reinforcing ecological resilience. Accordingly, this study empirically examines whether SDC contributes to improved ESG performance. Consistent with prior research [81], the Huazheng ESG rating system is employed, which categorizes firms into nine grades ranging from AAA to C; these grades are converted into numerical scores from 9 to 1, with higher scores reflecting superior ESG performance. The relevant regression results, presented in Column (1) of Table 12, indicate that SDC significantly enhances enterprises’ ESG performance.
Table 12.
Economic consequences test.
5.3.2. Green Innovation
SDC represents a paradigm shift driven by technological innovation, digital transformation, and strategic resource optimization. Unlike traditional models that focus solely on economic growth, SDC integrates environmental sustainability and resource efficiency, closely aligning with the principles of green innovation. By enhancing resource utilization, reducing energy consumption, and advancing technological capabilities, SDC provides a robust foundation for accelerating green innovation [82]. The literature widely acknowledges the critical role of SDC in fostering green innovation, facilitating the development of advanced information technologies such as big data and the IoT, supporting smart manufacturing, and elevating the environmental and technological sophistication of production processes. Moreover, SDC reduces research and development (R&D) costs and improves innovation efficiency, enabling firms to pursue green advancements more effectively [83]. Building upon this foundation, we empirically investigate whether SDC promotes corporate green innovation, as measured by the number of authorized green patents [84]. The regression results presented in Column (2) of Table 12 confirm that SDC significantly enhances firms’ green innovation.
6. Conclusions and Policy Recommendations
Based on STST and panel data from Chinese listed firms spanning 2014 to 2023, this study employs a DID approach to investigate the impact of the VAT credit refund policy on firms’ SDC. The findings demonstrate that the policy significantly enhances SDC, primarily through the AI empowerment chain, which includes AI capability building and intelligent transformation. Heterogeneity analyses reveal that this effect is more pronounced in firms with lower perceived economic policy uncertainty, greater operational diversification, weaker reputational capital, and those situated in regions with higher levels of marketization. These results underscore the structural and contextual dependencies highlighted by STST. Further examination indicates that small-scale and non-high-tech firms experience stronger policy effects, suggesting that the VAT credit refund policy serves a compensatory function for firms with limited internal innovation resources. Lagged effect analyses and comparisons with short-term financial performance confirm the policy’s long-term and substantive impact, as improvements in SDC persist over time and translate into enhanced ESG outcomes and green innovation. Collectively, these findings emphasize the role of fiscal policy not merely as a financial stimulus but as a catalyst for the coordinated evolution of social and technical subsystems, thereby promoting sustainable, innovation-driven growth.
Drawing on these insights, this study proposes targeted policy recommendations, supported by specific mechanisms and practical implementation examples:
- (1)
- Optimize the Refund Process to Enhance Policy Implementation Efficiency. Current challenges, such as complex refund procedures and prolonged processing times, can be mitigated by deploying automated approval systems—such as AI-driven tax audit platforms—and intelligent data processing technologies like blockchain-enabled tax refund tracking systems. These innovations not only streamline procedural complexity and accelerate processing but also improve transparency and foster trust between tax authorities and enterprises. For instance, the adoption of blockchain technology by the Shenzhen local tax bureau has already demonstrated substantial reductions in refund delays. Concurrently, shifting the institutional mindset from a “compliance-based review” to a “service-oriented facilitation” approach can enhance organizational adaptability and strengthen enterprises’ perceived benefits, thereby reinforcing the policy’s incentive effect.
- (2)
- Strengthen Policy Support Mechanisms through Institutional Synergy. The effectiveness of VAT credit refunds can be significantly amplified by harmonizing fiscal, financial, and industrial policies. For example, integrating refund data into credit scoring systems used by commercial banks could enable firms to leverage expected refunds as collateral for innovation financing. Establishing inter-agency information-sharing platforms among tax, financial, and industrial bodies can strengthen coordination, minimize administrative fragmentation, and promote an integrated policy framework. This systemic integration aligns closely with STST’s emphasis on structural coordination between social and technical subsystems.
- (3)
- Promote Digital Resource Allocation and Collaborative Innovation within Industrial Chains. Developing open digital platforms—such as cloud-based supply chain management systems—can facilitate data interoperability among upstream and downstream firms, enabling joint R&D initiatives and process innovation. Governments can support small and medium-sized enterprises’ (SMEs) access to these platforms by providing subsidies for digital transformation and organizing matchmaking services to stimulate industrial collaboration. For instance, Zhejiang Province’s “Digital Empowerment Plan” illustrates how local governments can assist SMEs in adopting digital tools and engaging in collaborative innovation networks. This approach not only enhances technical capabilities but also reshapes inter-organizational dynamics, fostering resilient and adaptive socio-technical systems.
- (4)
- Develop a Targeted and Adaptive VAT Credit Refund Policy Framework. To ensure precise stimulation of enterprise SDC, a differentiated policy system should be established. For example, firms heavily engaged in green innovation or AI-driven transformation could benefit from accelerated refund processing or additional financial incentives. Real-time data analytics platforms could monitor the flow and efficacy of refund funds, enabling dynamic adjustments to policy parameters. Furthermore, formalizing institutional collaboration among tax authorities, technology agencies, and financial regulators to implement an “identify–support–feedback–optimize” policy cycle would embody the adaptive and co-evolutionary principles of STST, thereby supporting the optimal allocation of policy resources.
However, this study has certain limitations. First, the analysis is confined to listed firms in China, which may restrict the generalizability of the findings to SMEs or firms operating in other emerging economies. Second, the study focuses primarily on the VAT credit refund policy, leaving unexplored the potential complementary or comparative effects of other fiscal instruments, such as R&D tax credits, green subsidies, or carbon tax rebates. Future research could address these gaps by (1) extending the analysis to additional regional contexts or countries to examine the applicability of the findings across varied institutional environments, and (2) investigating the interactive effects of different fiscal incentives on firms’ sustainable development trajectories. Furthermore, incorporating qualitative case studies could yield deeper insights into the organizational processes driving the observed outcomes.
Author Contributions
Conceptualization, J.S. and M.S.; methodology, M.S. and H.Y.; software, M.S.; validation, M.S. and H.Y.; data curation, M.S. and H.Y.; writing, M.S.; investigation, M.S.; supervision, J.S.; funding acquisition, J.S. All authors have read and agreed to the published version of the manuscript.
Funding
Research on the A Case Study Approach to Innovation and Entrepreneurship under the Rural Revitalization Strategy, grant number H20240073 and the 2025 University-level Special Program—Talent Training Quality Development: Undergraduate Teaching Quality Enhancement (University-level Teaching Reform Project), grant number 00192554213057.
Data Availability Statement
Data will be available from the corresponding author on request.
Conflicts of Interest
The authors declare no conflicts of interest.
References
- Zhang, D.; Lucey, B.M. Sustainable behaviors and firm performance: The role of financial constraints’ alleviation. Econ. Anal. Policy 2022, 74, 220–233. [Google Scholar] [CrossRef]
- Lee, C.-C.; He, Z.-W.; Yuan, Z. A pathway to sustainable development: Digitization and green productivity. Energy Econ. 2023, 124, 106772. [Google Scholar] [CrossRef]
- Wang, C.; Deng, X.; Wang, D.; Pan, X. Financial regulation, financing constraints, and enterprise innovation performance. Int. Rev. Financ. Anal. 2024, 95, 103387. [Google Scholar] [CrossRef]
- Liu, Y.; He, Z. Synergistic industrial agglomeration, new quality productive forces and high-quality development of the manufacturing industry. Int. Rev. Econ. Financ. 2024, 94, 103373. [Google Scholar] [CrossRef]
- Huang, X.; Hu, X.; Huang, B. The effect of enterprise quality management on innovation incentives in enterprises—Based on the reform of China’s value-added tax system. Int. Rev. Econ. Financ. 2024, 94, 103385. [Google Scholar] [CrossRef]
- Yu, W.; Yan, Y.; Zhu, K.; Zhang, P. Can value-added tax refund policy inhibit corporate financial fraud? Evidence from China. Emerg. Mark. Rev. 2024, 63, 101212. [Google Scholar] [CrossRef]
- Pessoa, M. How to Manage Value-Added Tax Refunds; IMF How Notes; International Monetary Fund: Washington, DC, USA, 2021. [Google Scholar] [CrossRef]
- Xue, R.; Chen, J. ESG performance and stability of new quality productivity forces: From perspective of China’s modernization construction. Int. Rev. Econ. Financ. 2025, 98, 103911. [Google Scholar] [CrossRef]
- Yue, S.; Bajuri, N.H.; Khatib, S.F.A.; Lee, Y. New quality productivity and environmental innovation: The hostile moderating roles of managerial empowerment and board centralization. J. Environ. Manag. 2024, 370, 122423. [Google Scholar] [CrossRef] [PubMed]
- Zhou, X.; Zhao, Y.; Chen, D. Emissions trading scheme’s effect on enterprises’ sustainable development in China: A differential game and a quasi-natural experiment. Energy Econ. 2025, 147, 108554. [Google Scholar] [CrossRef]
- Jie, G.; Jiahui, L. Media attention, green technology innovation and industrial enterprises’ sustainable development: The moderating effect of environmental regulation. Econ. Anal. Policy 2023, 79, 873–889. [Google Scholar] [CrossRef]
- Cherns, A. The principles of sociotechnical design. Hum. Relat. 1976, 29, 783–792. [Google Scholar] [CrossRef]
- Bostrom, R.P.; Heinen, J.S. MIS problems and failures: A socio-technical perspective. Part I: The causes. MIS Q. 1997, 1, 17–32. [Google Scholar] [CrossRef]
- Carayon, P.; Karsh, B.-T. Sociotechnical issues in the implementation of imaging technology. Behav. Inf. Technol. 2000, 19, 247–262. [Google Scholar] [CrossRef]
- Klaser, K.; Cuel, R.; Casari, P. The future of hybrid work in Italy: A survey-based socio-technical-system analysis. J. Innov. Knowl. 2023, 8, 100426. [Google Scholar] [CrossRef]
- Andras, P.; Esterle, L.; Guckert, M.; Han, T.A.; Lewis, P.R.; Milanovic, K.; Payne, T.; Perret, C.; Pitt, J.; Powers, S.T.; et al. Trusting intelligent machines: Deepening trust within socio-technical systems. IEEE Technol. Soc. Mag. 2018, 37, 76–83. [Google Scholar] [CrossRef]
- Davis, M.C. Socio-technical systems thinking and the design of contemporary workspace. In Organizational Behaviour and the Physical Environment; Routledge: Abingdon, UK, 2019; pp. 128–146. [Google Scholar] [CrossRef]
- Mumford, E. The story of socio-technical design: Reflections on its successes, failures and potential. Inf. Syst. J. 2006, 16, 317–342. [Google Scholar] [CrossRef]
- Ai, F.Y.; Wang, M.Z. Economic benefit evaluation of industrial enterprises based on bp neural network optimization algorithm. Lat. Am. Appl. Res.-Int. J. 2018, 48, 223–227. [Google Scholar] [CrossRef]
- Matias, D.M.; Kone, M.; Karim, P.G.; San Jose, D.; Mariano, B.J.; Ortiz, A.M.; Dubey, P.K.; Garcia, G. The need for transnational networks and transdisciplinary education for sustainable development in UNESCO biosphere reserves in the global south. Curr. Opin. Environ. Sustain. 2025, 75, 101553. [Google Scholar] [CrossRef]
- Friedman, A.L.; Miles, S. Developing stakeholder theory. J. Manag. Stud. 2022, 39, 1–21. [Google Scholar] [CrossRef]
- Bentley, T.A.; Teo, S.T.T.; McLeod, L.; Tan, F.; Bosua, R.; Gloet, M. The role of organisational support in teleworker wellbeing: A socio-technical systems approach. Appl. Ergon. 2016, 52, 207–215. [Google Scholar] [CrossRef]
- Fuenfschilling, L.; Truffer, B. The interplay of institutions, actors and technologies in socio-technical systems—An analysis of transformations in the australian urban water sector. Technol. Forecast. Soc. Chang. 2016, 103, 298–312. [Google Scholar] [CrossRef]
- Chen, S.; Xiao, Y.; Zhang, Z. Value-added tax credit refund and environmental protection investment: Evidence from chinese heavy-polluting enterprises. J. Clean. Prod. 2024, 450, 141945. [Google Scholar] [CrossRef]
- Liu, L.; Cao, L.; Cao, Y.; Lu, M.; Shan, Y. VAT credit refunds and firm productivity: Evidence from China’s VAT reform. Int. Rev. Financ. Anal. 2024, 93, 103171. [Google Scholar] [CrossRef]
- Zhang, X.; Deng, G.; Chen, L.; Abbass, K. Sustainable development and climate action: The role of tax policy and innovation. J. Environ. Manag. 2025, 389, 126091. [Google Scholar] [CrossRef] [PubMed]
- Chen, W.; Meng, F. Sustainable development, economic policy uncertainty and tax risk. Sustain. Account. Manag. Policy J. 2025, 16, 1–43. [Google Scholar] [CrossRef]
- McMeekin, A.; Southerton, D. Sustainability transitions and final consumption: Practices and socio-technical systems. Technol. Anal. Strateg. Manag. 2012, 24, 345–361. [Google Scholar] [CrossRef]
- Xu, K.; Geng, C.; Wei, X.; Jiang, H. Financing development, financing constraint and r&d investment of strategic emerging industries in China. J. Bus. Econ. Manag. 2020, 21, 1010–1034. [Google Scholar] [CrossRef]
- Schmidt, G.M.; Druehl, C.T. When is a disruptive innovation disruptive? J. Prod. Innov. Manag. 2008, 25, 347–369. [Google Scholar] [CrossRef]
- Liu, Y.; Wang, W.; Liu, C. The effect of a VAT rate reduction on enterprise costs: Empirical research based on China’s VAT reform practice. Front. Environ. Sci. 2022, 10, 912574. [Google Scholar] [CrossRef]
- He, Y. Taxing and trading for a greener future: The impacts of China’s environmental and trade policies on environmental sustainability. J. Environ. Manag. 2024, 372, 123401. [Google Scholar] [CrossRef]
- González, X.; Miles-Touya, D.; Pazó, C. R&D, worker training and innovation: Firm-level evidence. Ind. Innov. 2016, 23, 694–712. [Google Scholar] [CrossRef]
- Fehr, R.; Fulmer, A.; Awtrey, E.; Miller, J.A. The grateful workplace: A multilevel model of gratitude in organizations. AMR 2017, 42, 361–381. [Google Scholar] [CrossRef]
- Geels, F.W. Ontologies, socio-technical transitions (to sustainability), and the multi-level perspective. Res. Policy 2010, 39, 495–510. [Google Scholar] [CrossRef]
- Kim, R.M.; Kaplan, S.M. Interpreting socio-technical co-evolution: Applying complex adaptive systems to IS engagement. Inf. Technol. People 2006, 19, 35–54. [Google Scholar] [CrossRef]
- Bahoo, S.; Cucculelli, M.; Qamar, D. Artificial intelligence and corporate innovation: A review and research agenda. Technol. Forecast. Soc. Chang. 2023, 188, 122264. [Google Scholar] [CrossRef]
- Daly, S.J.; Wiewiora, A.; Hearn, G. Shifting attitudes and trust in AI: Influences on organizational AI adoption. Technol. Forecast. Soc. Chang. 2025, 215, 124108. [Google Scholar] [CrossRef]
- Wang, C.; Yin, X.; Yu, F. The impact of FinTech on corporate green innovation: The case of chinese listed enterprises. J. Environ. Manag. 2025, 392, 126605. [Google Scholar] [CrossRef] [PubMed]
- Paeplow, J.; Schoormann, T.; Möller, F.; Strobel, G. AI startups for good: A taxonomy and archetypes of sustainable business models. J. Clean. Prod. 2025, 520, 146144. [Google Scholar] [CrossRef]
- Duan, D.; Chen, S.; Feng, Z.; Li, J. Industrial robots and firm productivity. Struct. Chang. Econ. Dyn. 2023, 67, 388–406. [Google Scholar] [CrossRef]
- Fairhurst, G.T.; Green, S.; Courtright, J. Inertial Forces and the Implementation of a Socio-Technical Systems Approach: A Communication Study. Organ. Sci. 1995, 6, 168–185. [Google Scholar] [CrossRef]
- Zhang, G.; Han, J.; Pan, Z.; Huang, H. Economic policy uncertainty and capital structure choice: Evidence from China. Econ. Syst. 2015, 39, 439–457. [Google Scholar] [CrossRef]
- Pástor, Ľ.; Veronesi, P. Political uncertainty and risk premia. J. Financ. Econ. 2013, 110, 520–545. [Google Scholar] [CrossRef]
- Demir, E.; Ersan, O. Economic policy uncertainty and cash holdings: Evidence from BRIC countries. Emerg. Mark. Rev. 2017, 33, 189–200. [Google Scholar] [CrossRef]
- Mao, S.; Yang, G. Do diversified M&As improve R&D activity? Evidence from chinese listed companies. Financ. Res. Lett. 2025, 72, 106465. [Google Scholar] [CrossRef]
- Sohl, T.; McCann, B.T.; Vroom, G. Business model diversification: Demand relatedness, entry sequencing, and curvilinearity in the diversification-performance relationship. Long Range Plan. 2022, 55, 102215. [Google Scholar] [CrossRef]
- Xue, X.; Zhang, J.; Liong, W.K.J.; Ali, A. Influence of star employees’ role stress on their unethical pro-organizational behavior: A perspective from the transactional theory of stress and coping. Curr. Psychol. 2024, 43, 17525–17543. [Google Scholar] [CrossRef]
- Ji, D.; Zhang, Q.; Yu, S.; Wan, K. Market concentration construction and high-quality development of enterprises: Empirical evidence from chinese a-share listed companies. Econ. Anal. Policy 2025, 87, 621–641. [Google Scholar] [CrossRef]
- Nie, J.; Shen, J.; Chen, Y. The effect of new quality productivity on port sustainability: Evidence from China. J. Sea Res. 2025, 204, 102575. [Google Scholar] [CrossRef]
- Xu, T.; Yang, G.; Chen, T. The role of green finance and digital inclusive finance in promoting economic sustainable development: A perspective from new quality productivity. J. Environ. Manag. 2024, 370, 122892. [Google Scholar] [CrossRef]
- Liu, H.; Li, X. How digital technology can improve new quality productive forces?—Perspective of total factor agricultural carbon productivity. J. Asian Econ. 2025, 98, 101921. [Google Scholar] [CrossRef]
- Wang, S.; Qu, C.; Yin, L. Digital literacy, labor migration and employment, and rural household income disparities. Int. Rev. Econ. Financ. 2025, 99, 104040. [Google Scholar] [CrossRef]
- Deng, G.; Fu, X.; Zou, J.; Yan, J. Enterprise digitalization and bank-enterprise ESG consistency: Evidence from China. Int. Rev. Financ. Anal. 2025, 103, 104196. [Google Scholar] [CrossRef]
- He, G.; Li, X.; Luo, J. The impact of the shanghai–hong kong stock market connection on corporate innovation: Evidence from mainland china. Int. J. Financ. Econ. 2023, 28, 3132–3161. [Google Scholar] [CrossRef]
- He, G.; Li, A.Z.; Lin, T. Does digitalization imply uncertainty about the future prospects of a firm? Evidence from analyst forecast accuracy. Financ. Rev 2025, fire.70009. [Google Scholar] [CrossRef]
- He, G.; Li, Z.; Yu, L.; Zhou, Z. Contribution to poverty alleviation: A waste or benefit for corporate financing? J. Int. Financ. Mark. Inst. Money 2023, 89, 101875. [Google Scholar] [CrossRef]
- Islam, N.; Dai, E.; Sakamoto, H. Role of TFP in China’s growth. Asian Econ. J. 2006, 20, 127–159. [Google Scholar] [CrossRef]
- Shi, L.; Yang, S.L.; Ma, Y.; Yang, Y. A Novel Method of Combination Weighting for Multiple Attribute Decision Making. J. Syst. Eng. 2012, 27, 481–491. [Google Scholar] [CrossRef]
- Poquet, O.; De Laat, M. Developing capabilities: Lifelong learning in the age of AI. Br. J. Educ. Technol. 2021, 52, 1695–1708. [Google Scholar] [CrossRef]
- Zhai, X.; Chu, X.; Chai, C.S.; Jong, M.S.Y.; Istenic, A.; Spector, M.; Liu, J.-B.; Yuan, J.; Li, Y. A review of artificial intelligence (AI) in education from 2010 to 2020. Complexity 2021, 8812542. [Google Scholar] [CrossRef]
- Li, J.; Nie, H.; Ruan, R.; Shen, X. Subjective perception of economic policy uncertainty and corporate social responsibility: Evidence from China. Int. Rev. Financ. Anal. 2024, 91, 103022. [Google Scholar] [CrossRef]
- Lee, C.-C.; Lee, C.-C.; Xiao, S. Policy-related risk and corporate financing behavior: Evidence from China’s listed companies. Econ. Model. 2021, 94, 539–547. [Google Scholar] [CrossRef]
- Liu, T.; Chen, X.; Yang, S. Economic policy uncertainty and enterprise investment decision: Evidence from China. Pac.-Basin Financ. J. 2022, 75, 101859. [Google Scholar] [CrossRef]
- Lee, J.M. Rethinking the performance implication of regional diversification: The interplay between intra- and inter-regional diversification. J. Bus. Res. 2025, 199, 115519. [Google Scholar] [CrossRef]
- Isogai, A.; Nozaki, M.; Yamamoto, R. ESG business diversification and investment performance. Financ. Res. Lett. 2025, 77, 107132. [Google Scholar] [CrossRef]
- Schneider, B.R. A comparative political economy of diversified business groups, or how states organize big business. Rev. Int. Political Econ. 2009, 16, 178–201. [Google Scholar] [CrossRef]
- Cao, Z.; Chen, S.X.; Lee, E. Does business strategy influence interfirm financing? Evidence from trade credit. J. Bus. Res. 2022, 141, 495–511. [Google Scholar] [CrossRef]
- Lee, P.M.; Pollock, T.G.; Jin, K. The contingent value of venture capitalist reputation. Strateg. Organ. 2011, 9, 33–69. [Google Scholar] [CrossRef]
- Brammer, S.; Millington, A. Corporate reputation and philanthropy: An empirical analysis. J. Bus. Ethics 2005, 61, 29–44. [Google Scholar] [CrossRef]
- Armitage, S.; Marston, C. Corporate disclosure, cost of capital and reputation: Evidence from finance directors. Br. Account. Rev. 2008, 40, 314–336. [Google Scholar] [CrossRef]
- Vu, U.; Tolstoy, D. Examining the complementary roles of market-driven and market-driving orientations in the geographical diversification strategies of e-commerce SMEs. J. Bus. Res. 2025, 194, 115375. [Google Scholar] [CrossRef]
- Li, Y.; Liang, Z.; Pang, S. Comparison between mean-variance and monotone mean-variance preferences in general markets: A new perspective. Oper. Res. Lett. 2025, 61, 107298. [Google Scholar] [CrossRef]
- Pillai, R.; Islam, M.A.; Sreejith, S.; Al-Malkawi, H.A. Comparative analysis of environmental, social and governance (ESG) ratings: Do sectors and regions differ? J. Manag. Gov. 2025, 29, 69–109. [Google Scholar] [CrossRef]
- Wang, X.; Qin, C.; Liu, Y.; Tanasescu, C.; Bao, J. Emerging enablers of green low-carbon development: Do digital economy and open innovation matter? Energy Econ. 2023, 127, 107065. [Google Scholar] [CrossRef]
- Li, J.; Sun, R.; Zhao, M. How mayors’ promotion incentives shape corporate green innovation disclosure? Evidence from China’s new environmental protection law. Int. Rev. Financ. Anal. 2025, 103, 104181. [Google Scholar] [CrossRef]
- Casarin, A.A.; Mercadier, A.; Delfino, M.E. Firm size in gas distribution. Economies of scale, regulatory dynamics, and policy implications. Energy Policy 2024, 193, 114256. [Google Scholar] [CrossRef]
- Smyth, R. Should china be promoting large-scale enterprises and enterprise groups? World Dev. 2000, 28, 721–737. [Google Scholar] [CrossRef]
- Gharbi, S.; Sahut, J.-M.; Teulon, F. R&D investments and high-tech firms’ stock return volatility. Technol. Forecast. Soc. Chang. 2014, 88, 306–312. [Google Scholar] [CrossRef]
- Zou, C.; Li, S.; Xiong, B.; Liu, H.; Ma, F. Revolution and significance of “green energy transition” in the context of new quality productive forces: A discussion on theoretical understanding of “energy triangle”. Pet. Explor. Dev. 2024, 51, 1611–1627. [Google Scholar] [CrossRef]
- Müller, L.; Joubrel, M. A novel approach to sustainable mean-variance portfolio optimization: Accounting for ESG-related uncertainty. Financ. Res. Lett. 2025, 85, 108056. [Google Scholar] [CrossRef]
- Rainville, A.; Dikker, I.; Buggenhagen, M. Tracking innovation via green patent classification systems: Are we truly capturing circular economy progress? J. Clean. Prod. 2025, 486, 144385. [Google Scholar] [CrossRef]
- Liu, P.; Xu, Y.; Lu, J. Air pollution, sustainable development, and corporate R&D: Evidence from emerging countries. J. Environ. Manag. 2024, 369, 122368. [Google Scholar] [CrossRef] [PubMed]
- Rahman, S. The importance of green patents for CDS pricing: The role of environmental disclosures. Energy Econ. 2024, 139, 107905. [Google Scholar] [CrossRef]


Disclaimer/Publisher’s Note: The statements, opinions and data contained in all publications are solely those of the individual author(s) and contributor(s) and not of MDPI and/or the editor(s). MDPI and/or the editor(s) disclaim responsibility for any injury to people or property resulting from any ideas, methods, instructions or products referred to in the content. |
© 2025 by the authors. Licensee MDPI, Basel, Switzerland. This article is an open access article distributed under the terms and conditions of the Creative Commons Attribution (CC BY) license (https://creativecommons.org/licenses/by/4.0/).