Article

Dynamic Evolution and Resilience Enhancement of the Urban Tourism Ecological Health Network: A Case Study in Shanghai, China

1
School of Social Science, Soochow University, Suzhou 215127, China
2
Academy of Culture and Tourism Research, Soochow University, Suzhou 215127, China
*
Author to whom correspondence should be addressed.
Systems 2025, 13(8), 654; https://doi.org/10.3390/systems13080654
Submission received: 3 June 2025 / Revised: 20 July 2025 / Accepted: 31 July 2025 / Published: 2 August 2025
(This article belongs to the Section Complex Systems and Cybernetics)

Abstract

Urban tourism has evolved into a complex adaptive system, where unregulated expansion disrupts the ecological balance and intensifies resource stress. Understanding the dynamic evolution and resilience mechanisms of the tourism ecological health network (TEHN) is essential for supporting sustainable urban tourism as a coupled human–natural system. Using Shanghai as a case study, we applied the “vigor–organization–resilience–services” (VORS) framework to evaluate ecosystem health, which served as a constraint for constructing the TEHN, using the minimum cumulative resistance (MCR) model for the period from 2001 to 2023. A resilience framework integrating structural and functional dimensions was further developed to assess spatiotemporal evolution and guide targeted enhancement strategies. The results indicated that as ecosystem health degraded, particularly in peripheral areas, the urban TEHN in Shanghai shifted from a dispersed to a centralized structure, with limited connectivity in the periphery. The resilience of the TEHN continued to grow, with structural resilience remaining at a high level, while functional resilience still required enhancement. Specifically, the low integration and limited choice between the tourism network and the transportation system hindered tourists from selecting routes with higher ecosystem health indices. Enhancing functional resilience, while sustaining structural resilience, is essential for transforming the TEHN into a multi-centered, multi-level system that promotes efficient connectivity, ecological sustainability, and long-term adaptability. The results contribute to a systems-level understanding of tourism–ecology interactions and support the development of adaptive strategies for balancing network efficiency and environmental integrity.

1. Introduction

Ecosystem health is the ability to maintain structural and functional stability under disturbances while meeting human needs [1,2]. However, the large-scale flow of tourists across various regions, facilitated by roads and waterways, contributes to issues such as greenhouse gas emissions and noise [3,4]. Additionally, this transport network disrupts the elements and functional structure of the ecological land systems it traverses [5], thereby posing an increasing risk to ecosystem health [6]. Against this backdrop, it is essential to develop a spatial network framework that prioritizes ecosystem health while ensuring effective connectivity among tourist attractions, thereby fostering coordination between ecosystem conservation and tourism flows.
Although recent studies increasingly address the environmental impacts of tourism flow networks [7,8], most strategies—such as low-carbon route planning and green mobility optimization—consider ecological factors only as supplementary indicators, without integrating ecosystem health metrics into network construction. At the same time, while ecosystem health is widely used as a comprehensive tool for assessing tourism cities [9], islands [10], and coastal zones [11], this tool remains underutilized in the design and optimization of tourism flow networks.
Frequent disruptions, such as those caused by climate variability and public health emergencies, increase the risk of functional breakdowns, route failures, and regional isolation in tourism flow networks, underscoring the need to improve their capacity to absorb shocks. Resilience, a core metric for evaluating a system’s ability to cope with disturbances [12], continues to attract growing interest in tourism research. However, most existing studies focus on tourism transportation [13] and supply chain networks [14], with limited attention being paid to resilience assessments of integrated tourism–ecology systems.
To address these theoretical and practical knowledge gaps, we propose the concept and analytical framework of the tourism ecological health network (TEHN), defined as a spatially optimized ecological network among tourist destinations operating under ecosystem health constraints. This study integrated three core dimensions—ecosystem health, path modeling, and network resilience—to construct the TEHN. Specifically, the ecosystem health index (EHI) was used to generate a resistance surface, the minimum cumulative resistance (MCR) model was applied to identify ecologically sustainable tourism corridors, and structural and functional resilience indicators were incorporated into the network modeling approach. TEHN was conceptualized as a framework for the coordinated optimization of ecological and tourism systems. It emphasized spatial connectivity, constrained by ecological factors, and served not as a representation of actual tourist flows but as a reference and guidance tool for ecological route planning, aimed at enhancing both ecological carrying capacity and tourism system stability. This study presents a theoretical innovation by introducing the TEHN concept and analytical framework, and, by developing a coupled structural–functional resilience indicator system, it enables a closed-loop approach from network construction to adaptive assessment.
Building on the above theoretical framework, this study addresses two core research questions: (1) How can ecosystem health assessment results be systematically integrated into tourism path modeling to construct an ecologically constrained tourism network? (2) How can a resilience evaluation system be designed to capture both structural stability and functional adaptability, and what practical strategies can enhance resilience and optimize the network? To explore these questions, we took Shanghai, China, as a case study, selecting 2001, 2010, 2020, and 2023 as reference years to analyze the spatiotemporal evolution of the TEHN and explore its resilience levels and enhancement strategies. The objectives of this study are as follows: (1) to examine the spatiotemporal evolution of the TEHN in Shanghai, (2) to assess the resilience evolution of this network, and (3) to propose strategies for enhancing its resilience. Our findings will contribute to the balanced, mutually beneficial, and sustainable development of both tourism and ecological systems.

2. Literature Review

2.1. Construction of Tourism Flow Networks Under Ecological Constraints

With the growing integration of tourism-related elements into urban environments, cities have evolved into systems comprising multiple tourism flow nodes and spatial corridors, enabling cross-regional tourist movements driven by destination attractiveness [15]. Tourism flow is commonly defined as the movement of tourists between origin and destination points based on specific tourism demands [15,16], supported by a network of physical routes [17]. These interconnected routes form tourism flow networks, which current research primarily focuses on in terms of their spatiotemporal dynamics [15,16,18], structural characteristics [15,16,18], and influencing factors [18,19].
While tourism flow reshapes urban tourism patterns, it also exerts significant pressure on ecosystems. Increased traffic, infrastructure development, and crowd concentration intensify the stress put on ecologically sensitive areas [20], potentially leading to declines in ecosystem service capacity and heightened ecosystem health risks [9]. Most tourism flow network optimization studies focus on minimizing time, distance, or economic costs [21,22], with ecological factors rarely being integrated into the modeling process. Although ecological considerations—such as carbon footprint assessments [7] and sustainable mobility policy [8]—have gained attention, they are often addressed through post hoc evaluations or broad strategic recommendations, lacking systematic integration into model design.
Incorporating ecological constraints into tourism flow networks remains a major challenge. Ecological indicators are characterized by spatial heterogeneity and temporal variability, often displaying significant imbalances across regions, scales, and development stages [23,24]. Meanwhile, tourism flow networks are typically constructed using static origin–destination paths or fixed-cost graph models [21,22,25], which fail to reflect the dynamic responsiveness required for ecological modeling. The long-standing separation between ecosystem simulation and tourism path optimization has resulted in a lack of methodological integration and few practical mechanisms for embedding ecological factors. This gap has hindered the effective quantification and dynamic incorporation of ecological constraints during network construction. In ecological connectivity research, the MCR model is widely used to optimize ecological corridors [26,27,28]. It has been applied to ecological network design [27], ecological security pattern identification [26], and wildlife migration path planning [28]. By generating a resistance surface that reflects ecological conditions, the MCR model helps identify ecologically suitable pathways. However, its application in tourism flow network design remains limited. Introducing ecological constraints into the MCR model offers a promising approach to integrating ecological factors into path modeling and supporting the construction of tourism flow networks under ecological constraints.

2.2. Integrating the Ecosystem Health Index into Tourism Systems

Ecosystem health is a fundamental indicator for evaluating the stability, dynamics, and sustainability of ecosystems [1,2]. It is widely used in ecological monitoring and impact assessment in tourism regions and increasingly functions as a key metric for gauging tourism disturbance intensity and ecosystem responsiveness. Previous studies have demonstrated the indicator’s applicability across various spatial contexts, including islands [10], coastal zones [11], and tourism cities [9]. As a quantifiable and integrative metric [1,2,9,10,11,23,29,30,31,32], ecosystem health is commonly assessed using the vigor–organization–resilience (VOR) framework, which has evolved into the vigor–organization–resilience–services (VORS) model with the inclusion of ecosystem service functions [10,23]. This extension enhances both diagnostic comprehensiveness and responsiveness to human needs.
Although the indicator system has been introduced into tourism management and ecological planning, its use remains largely confined to static monitoring and retrospective assessments. Systematic mechanisms for embedding ecosystem health into spatial processes—such as tourism path optimization and tourism flow network modeling—are still lacking. Consequently, the integration and dynamic responsiveness of the EHI in tourism network construction remain limited, which constrains its potential to support coordinated decision-making between ecological conservation and tourism development [11,33]. Incorporating EHI as a core ecological constraint in the MCR model could improve the ecological soundness of path identification and support the practical implementation of the TEHN framework.

2.3. Resilience Assessment Methods in Tourism Ecological Networks

Resilience, first introduced by the ecologist C.S. Holling (1973) [12], refers to a system’s ability to withstand internal and external disturbances, maintain functionality, and transition to a new equilibrium. Since its introduction, resilience theory has been widely applied across fields such as economics, sociology, and transportation, becoming a foundational framework for assessing system vulnerability and recovery potential [34,35,36]. In recent years, its integration with urban network research has drawn growing interest. Scholars apply complex network theory to examine resilience from both structural and functional perspectives. Structurally, urban networks are viewed as spatial topologies of nodes and links, with resilience being assessed through their ability to maintain connectivity and redundancy under disturbance [37,38]. Functionally, networks are interpreted as interrelated systems of social, economic, and cultural processes, evaluated based on their capacity to sustain core services during disruptions [39,40]. As resilience metrics continue to advance, a growing body of research adopts a coupled structural–functional perspective to assess urban ecological networks holistically [41,42]. For example, Li et al. (2024) [42] identified agglomeration and connectivity as structural indicators, and transmissibility and diversity as functional indicators.
Despite the broader application of resilience frameworks in urban ecological contexts, their use in tourism ecological networks remains limited. While resilience has been applied in tourism transport and supply chain studies [13,14], most tourism flow network research has not yet incorporated it into path optimization or network modeling. Consequently, these studies often fail to account for disruptions such as extreme weather events or system shocks in ecologically sensitive areas. Resilience assessment methods that integrate both structural and functional dimensions should be introduced to support the development of TEHNs that are capable of both resisting disturbances and adapting to changing conditions.

2.4. Shortcomings in the Existing Research and Innovations

Although substantial progress has been made in optimizing tourism flow networks, evaluating ecosystem health, and applying resilience theory, notable gaps remain in understanding the tourism–ecosystem coupling dynamic. First, ecological constraints are not systematically integrated into tourism network modeling. Most existing path optimization approaches prioritize time, distance, or economic efficiency, while ecological factors are often treated as secondary indicators. This results in limited dynamic responsiveness and inadequate constraint mechanisms during model construction, leading to weak coupling between ecological and tourism components. Second, the resilience assessment framework for tourism ecological networks remains underdeveloped. Although some studies evaluate network resilience from both structural and functional dimensions, targeted and adaptable indicators for tourism–ecology systems are still lacking.
To address these issues, this study introduced several key innovations. First, we proposed the concept and construction methodology of the TEHN, embedding ecosystem health constraints directly into the tourism path optimization process. This enabled the integrated modeling of ecological carrying capacity and route accessibility, shifting away from traditional efficiency-driven approaches. The framework highlighted the interaction between ecological and tourism factors and adopted a holistic, multidimensional system perspective. Second, we established a resilience indicator system tailored to composite tourism–ecology networks and designed a structural–functional coupled assessment method. Together, these elements formed a closed-loop analytical framework encompassing ecosystem evaluation, path modeling, and resilience assessment.
Theoretically, this study has contributed in two primary ways: (1) it has advanced the TEHN framework, enhancing interdisciplinary integration between tourism geography and ecological modeling while addressing a critical gap in tourism flow network construction under ecological constraints, and (2) it has expanded the application of resilience theory by adapting its metrics to the unique characteristics of tourism–ecology systems, extending its relevance beyond urban and transportation contexts.

3. Study Area and Data

3.1. Study Area

Shanghai, as China’s largest economic hub and a globally renowned tourist destination, possesses a highly developed tourism industry. By August 2024, it offered 143 tourist attractions rated 3A and above, attracting 330.07 million visits in 2023. Its highly developed tourism industry has significantly contributed to its economic growth, while also exerting pressure on the ecological environment. High tourist concentrations at major attractions such as Nanjing Road, the Huangpu River waterfront, and Disneyland contribute to traffic congestion, increased waste generation, and high energy consumption. Additionally, as a coastal city (Figure 1), Shanghai is particularly vulnerable to climate-related disturbances, including haze, typhoons, extreme temperatures, plum rains, and droughts [43]. These challenges underscore the critical need to enhance the resilience of the TEHN. Thus, Shanghai offers a representative case for examining these challenges.

3.2. Data Source

This study utilizes statistical and spatial geographic data from Shanghai, selecting 2001, 2010, 2020, and 2023 as key time nodes to analyze the evolution of the TEHN. The selection of these years is based on significant historical events that shaped the development of the network. In 2001, China’s accession to the World Trade Organization (WTO) created opportunities for Shanghai’s tourism industry to expand internationally. This development initiated the formation of the TEHN. By 2010, the Shanghai World Expo spurred rapid tourism growth, but also led to ecological challenges, highlighting the need to enhance resilience. The COVID-19 pandemic in 2020 disrupted global tourism, challenging the network’s stability. By 2023, tourism rebounded, cross-border travel recovered, and sustainability policies strengthened, marking a phase of adaptive adjustment for the network. These four time nodes represent the formation, expansion, disruption, and recovery of the network, offering valuable insights into its evolution.
In terms of statistical data, tourist attractions rated 3A and above were identified based on annual reports. According to the official website of Shanghai, which lists 5A-level scenic spots (Available online: https://whlyj.sh.gov.cn/5ajjq/20191008/0022-29706.html, accessed on 15 August 2024), 4A-level scenic spots (Available online: https://whlyj.sh.gov.cn/4ajjq/20191008/0022-28627.html, accessed on 15 August 2024), and 3A-level scenic spots (Available online: https://whlyj.sh.gov.cn/3ajjq/20191008/0022-29707.html, accessed on 15 August 2024), there were 143 tourist attractions, including two groups of combined attractions spanning multiple locations, bringing the total to 146. The classification of these attractions follows China’s official tourism rating system, which has been updated in different years. Notably, since the first batch of attraction ratings was announced in 2007, attractions in 2001 were classified according to the 2007 rating standards.
Regarding spatial geographic data, the study area was divided into a 500 m × 500 m grid, comprising 39,147 grid cells to enhance dataset precision. This scale is widely used in urban spatial modeling due to its effective balance between spatial granularity and computational efficiency, providing high adaptability and representativeness [44,45]. Land use and land cover (LULC), the normalized difference vegetation index (NDVI), and road data were collected at the grid level. LULC data were obtained from the annual China Land Cover Dataset produced by the team of Professors Yang and Huang (2021) [46], with a spatial resolution of 30 m. The dataset is accessible at https://zenodo.org/records/12779975 (accessed on 20 August 2024). NDVI data (1 km resolution) was obtained from the Resource and Environmental Science Data Platform (https://www.resdc.cn/Default.aspx, accessed on 20 August 2025). Road network data for 2020 and 2023 were retrieved from OpenStreetMap (https://www.openstreetmap.org, accessed on 20 September 2024). The 2001 and 2010 road datasets were manually digitized, based on the 2001 China provincial highway traffic atlas, as well as traffic and tourism maps.
All input data, except for scenic spot location data, were range-standardized to the (0, 1) interval to ensure comparability. Output indicators derived from models—including those from the VORS model, MCR model, gravity model, and resilience evaluation model—were also re-standardized during the integration process to maintain consistency across all the indicators used in the analysis and evaluation. The TEHN resilience index, as the final output, was not further standardized, as its values reflected the weighted integration of previously standardized sub-dimensions.

4. Methodology

The methodology thus applied consisted of three steps (Figure 2): (1) Assessment of ecosystem health patterns, using the VORS model for Shanghai in 2001, 2010, 2020, and 2023. (2) Construction of a TEHN, using tourist attractions as source patches and the inverse of ecosystem health as the resistance surface. The MCR model identified ecological corridors, linking patches into a network. (3) Resilience was evaluated by converting the network into a topological structure using the gravity model, with patches as nodes and corridors as links. Structural and functional analyses guided strategies to enhance the network and sustain tourist flow.

4.1. Assessment Framework for Ecosystem Health

The EHI is measured based on the VORS framework [1,9,10,23,30,32]. The formula is:
E H I = P H × E S
P H = V × O × R 3
where E H I is the ecosystem health index; P H is ecosystem physical health; E S is ecosystem services; V, O, and R are the indicators of ecosystem vigor, ecosystem organization, and ecosystem resilience. All the above indicators are positive indicators and were standardized prior to use. Higher values indicate stronger performance levels.

4.1.1. Vigor

Vigor is generally characterized through vegetation productivity indicators, commonly represented by ecosystem metabolism or net primary productivity [1,32]. In this study, the NDVI was chosen to represent ecosystem vigor due to its close link to net primary productivity and its widespread use in assessing ecosystem vitality [1,2,30].

4.1.2. Organization

Organization refers to the stability of the ecosystem structure [29], which is typically measured by landscape pattern indices reflecting heterogeneity and connectivity [1,2,30]. Heterogeneity was calculated using Shannon’s diversity index and the area-weighted mean patch fractal dimension. Connectivity was assessed using the landscape fragmentation index and landscape contagion index for three types of ecological land use: forest, water, and grassland. Based on the ecosystem resilience coefficient (ERC) and ecosystem services coefficient (ESC) methods proposed by Huang et al. (2024) [23], using China’s land use data (Table 1), these three land use types were found to demonstrate notable ecological advantages and were, therefore, incorporated into the connectivity indicator. Index weights were assigned based on relevant studies [30]. The formula is:
O = 0.35 L H + 0.35 L C + 0.30 I C = 0.25 S H D I + 0.10 A W M P F D + 0.25 F N 1 + 0.10 C O N T ) + ( 0.07 F N 2 + 0.03 C O H E S I O N 1 + 0.07 F N 3 + 0.03 C O H E S I O N 2 + 0.07 F N 4 + 0.03 C O H E S I O N 3 )
where O is ecosystem organization; L H represents landscape heterogeneity; L C represents landscape connectivity; I C denotes the patch connectivity index of the important ecosystem (forest, water and grass land); S H D I denotes Shannon’s diversity index; A W M P F D represents the area-weighted mean patch fractal dimension index; F N 1 represents the landscape fragmentation index; C O N T represents the landscape contagion index; F N 2 , F N 3 , F N 4 are the fragmentation index of forest, water and grass land, respectively; C O H E S I O N 1 , C O H E S I O N 2 , C O H E S I O N 3 are the patch cohesion index of forest, water, and grassland, respectively.

4.1.3. Resilience

Resilience reflects the ability of an ecosystem to maintain its original structure and function when exposed to external disturbances [1,23]. Land use plays a crucial role in ecosystem resilience. In this study, it was quantified by summing the area-weighted resilience coefficients of all land-use types [1,23,30]. The formula is:
R = i = 1 n ( A i × E R C i )
where R is ecosystem resilience; A i is the area ratio of land use type i ; n is the number of land use types; E R C i represents the resilience coefficient, with coefficient values assigned according to Table 1.

4.1.4. Ecosystem Services

Ecosystem services refer to the capacity of ecosystems to provide products and services to human society [30]. The quantity and sustainability of ecosystem services are key indicators for evaluating ecosystem health, and regional ecosystem services can be transferred across adjacent spatial areas [2,31]. Therefore, the measurement of the ecosystem service index needs to account for both intrinsic effects and the influence of adjacent spatial areas. The formula is:
E S = ( j = 1 m E S C j × ( 1 + S N E j ) ) / m
where E S is ecosystem service; E S C i represents the ecosystem services coefficient of the land cover type associated with pixel j ; S N E j represents the sum of the ecosystem service coefficients of the four adjacent pixels (top, bottom, left, and right) surrounding pixel j ; m is the number of pixels. The ecosystem service coefficients for land use types were adopted from the values established by Huang et al. (2024) [23], based on land-use conditions in China (Table 1).

4.2. Construction of Tourism Ecological Health Network

The MCR model represents the total resistance that a species must overcome when moving from a source point to a target location [26,27,31]. In this study, tourist attractions rated 3A and above were designated as source patches, and the inverse value of the EHI (1/EHI) was used as the resistance coefficient. Using this model, we calculated the least-cost path, which was then used to establish the TEHN by connecting these source patches through corridors. In this network, source patches act as nodes, and corridors serve as network links. The calculation formula is derived from the work of Cao et al. (2024) [26]. The formula is:
M C R = m i n q = μ y = θ D q y × F q
where M C R represents the minimum cumulative resistance value; D q y represents the spatial distance of a species from source patch q to target unit y ; μ is the total number of source patches; θ is the total number of target units; F q represents the resistance coefficient of source patch q , representing the resistance coefficient of the source patch. As a positive indicator, the EHI reflects better ecological conditions with higher values. Therefore, when 1/EHI is used as the resistance coefficient, a higher regional EHI corresponds to a lower resistance coefficient, resulting in a higher priority for path selection.

4.3. Evaluation Method for the Resilience of the Tourism Ecological Health Network

4.3.1. Gravity Model

The gravity model measures the interaction strength between source patches [47,48]. A higher interaction force between source patches indicates greater corridor importance [48]. The gravity model quantified interactions between source patches, transforming the complex relationships within the TEHN into a topological structure to support resilience analysis. The calculation formula is derived from the work of Zhao et al. (2019) [48]. The formula is:
G q y = L m a x 2 I q I y L e s 2 P q P y
where G q y represents the ecological connection between source patch q and source patch y , with higher values indicating stronger ecological linkage between the two locations; I q and I y represent the areas of source patches q and y , respectively; P q and P y denote the resistance values of source patches q and y , respectively; L q y refers to the minimum cumulative resistance value from source patch q to source patch y ; L m a x represents the highest minimum cumulative resistance value among all source patches.

4.3.2. Assessment Framework for the Resilience of the Tourism Ecological Health Network

This study developed a TEHN resilience evaluation model by integrating structural and functional resilience, considering both node and network elements. Resilience assessment of the TEHN involves evaluating its structural robustness under external disturbances [37,38] and its functional contribution to the broader urban system [39,40].
Indicator weight coefficients were determined using the analytic hierarchy process (AHP) [49]. The procedure included the following steps. First, all resilience evaluation indicators were range-standardized to remove dimensional discrepancies. Second, six experts in tourism ecology were invited to conduct pairwise comparisons of indicator importance using a nine-point scale to construct a judgment matrix. The relative weights of the indicators were then derived using the eigenvector method, as shown in Table 2. Finally, a consistency test was conducted. The consistency index (CI) was calculated as 0.038, and the corresponding random index (RI) was set at 1.260, resulting in a consistency ratio (CR = CI/RI) of 0.030. Since the CR was below the threshold of 0.1, the indicator weights were deemed consistent and valid. The formula is:
T E H N R = 0.088 N O R + 0.140 N E R + 0.394 T O U + 0.283 E C O + 0.059 I N T + 0.036 C H O
where T E H N R represents the resilience of the TEHN; N O R is node robustness; N E R is network robustness; T O U represents the node tourism effect; E C O represents the node ecological effect; I N T is network integration;  C H O is network choice. All indicators are positive, with higher values reflecting stronger performance. The TEHNR was derived as a composite resilience index through weighted integration and was not further standardized, whereas all sub-indicators were standardized prior to aggregation.
  • Node robustness
Node robustness refers to the average node connectivity after the removal of edges under both targeted and random attacks [50]. By calculating node robustness, we assess the ability of the TEHN to maintain internal connectivity in the face of external disturbances. The formula is:
N O R = 1 g t = 1 g S t
S t = c m a x / c
where N O R is node robustness; S t represents the node connectivity at the t attack; c m a x represents the number of nodes in the largest connected subgraph; c is the total number of nodes in the initial network; g is the number of attack iterations.
  • Network robustness
Network robustness is defined as the average network efficiency after edge removal under both targeted and random attacks [50]. By calculating network robustness, we reveal the ability of the TEHN to maintain flow efficiency in the face of disruptions. The formula is:
N E R = 1 g t = 1 g E t
E t = α β 1 d α β / c ( c 1 )
where N E R is network robustness;  E t represents the network efficiency at the t attack; d α β is the shortest path between nodes α and β in the network.
  • Node tourism effect
The node tourism effect is quantified by multiplying its degree centrality by its tourism rank, reflecting the functional role of each tourist attraction within the TEHN. While tourism rank indicates the intrinsic appeal and potential of an attraction [51], it does not capture its interactive capacity within the network. Degree centrality, defined as a node’s direct connections, represents connectivity within the network [52]. By incorporating degree centrality, the individual characteristics of nodes were integrated into the network, highlighting the fact that tourist attractions not only had dense ecological connections with other sites but also played a crucial role in facilitating tourist flow. The formula is:
T O U = w = 1 c ( D C E w × D R A w ) / c
D C E w = z / ( c 1 )
where T O U represents the node tourism effect; D C E w denotes the degree centrality of node w ; D R A w refers to the tourism rank of node w ; z represents the total number of nodes that are directly interconnected with node w .
  • Node ecological effect
The node ecological effect is quantified by multiplying the node’s degree centrality with its ecosystem service level, reflecting the ecological functional contribution of each tourist attraction within the TEHN. While ecosystem service level reflects the ecological supply capacity of individual attractions [30], it is insufficient to indicate the propagation effect of the attraction within the ecological network. Incorporating degree centrality identifies key nodes that enhance ecological connectivity and diffusion. This enables a more comprehensive assessment of the ecological effect of tourist attractions within the network. The formula is:
E C O = w = 1 c ( D C E w × E S w ) / c
where E C O is node ecological effect; E S w denotes the ecosystem service level of node w , calculated as the average ecosystem service level of the pixels occupied by the tourist attraction, as determined by Equation (5).
  • Network integration
Network integration indicates the dispersion of elements and reflects spatial accessibility and connectivity within the network [20,53]. In this study, network integration was introduced to embed the TEHN into the overall road system, aiming to ensure that tourists could achieve accessible and seamless movement between tourist attractions via ecologically sustainable travel routes within the actual transportation network. The calculation steps were as follows:
First, overall urban road integration was calculated based on spatial syntax theory [20,53]. The formula is:
R I N T r o a d = R A / R R A
R A = 2 ( M D 1 ) v 2
R R A = 2 v log 2 v + 2 3 1 + 1 ( v 1 ) ( v 2 )
M D = d = 1 s d × N d v 1
where R I N T r o a d represents the integration of the urban road system; R A is the relative asymmetry; R R A is the real relative asymmetry; v represents the number of roads; M D is the average depth; d indicates the depth from a particular unit to other ones, with a minimum depth of 1 and a maximum depth of s ; N d stands for the number of units with the same depth as this unit.
Second, based on the work of Li et al. (2022) [24], who identified 50 m as a suitable width for recreational corridors, a 25-m buffer zone analysis was conducted on the GIS 10.7 platform to extract those roads intersecting the TEHN buffer zone. Since the buffer was applied symmetrically on both sides of the TEHN centerline, the 25 m setting effectively simulates a 50-m-wide corridor, which is consistent with the referenced standard. Meanwhile, to assess the robustness of the analysis results to different buffer distance settings, we conducted a sensitivity analysis of network integration using multiple scales, including 10 m, 50 m, 75 m, and 100 m. As shown in Figure 3, although indicator values showed slight fluctuations with increasing buffer width, the ranking and overall trends of integration across the years remained consistent, indicating strong stability in the choice of buffer parameters.
Third, the average integration value of the extracted roads was used to compute the network integration index.
  • Network choice.
Network choice measures how often a node appears in the shortest path, indicating its role in facilitating movement [53,54]. It was additionally incorporated into the road system framework to reflect the likelihood that tourists would choose ecologically sustainable routes when navigating the actual transportation network. The calculation steps were as follows. First, the overall road choice was calculated using spatial syntax theory [53,54]. Second, a 25-m buffer zone analysis was conducted on the GIS 10.7 platform to extract those roads intersecting the network buffer zone. To validate this selection, results from multiple buffer distances (Figure 3) showed that network choice values varied minimally between 0.01 and 0.02, with no significant fluctuations, confirming the robustness of the 25-m buffer distance. Third, the average choice values of the extracted roads yielded the network choice index. The formula for calculating the choice index in the first step is as follows:
R C H O r o a d = h k d h k o d h k ( h < k )
where R C H O r o a d represents the choice of the urban road system; d h k refers to the shortest path between line h and line k ; d h k o refers to the shortest path containing line o between line h and line k .

5. Results

5.1. Dynamic Evolution of the Tourism Ecological Health Network

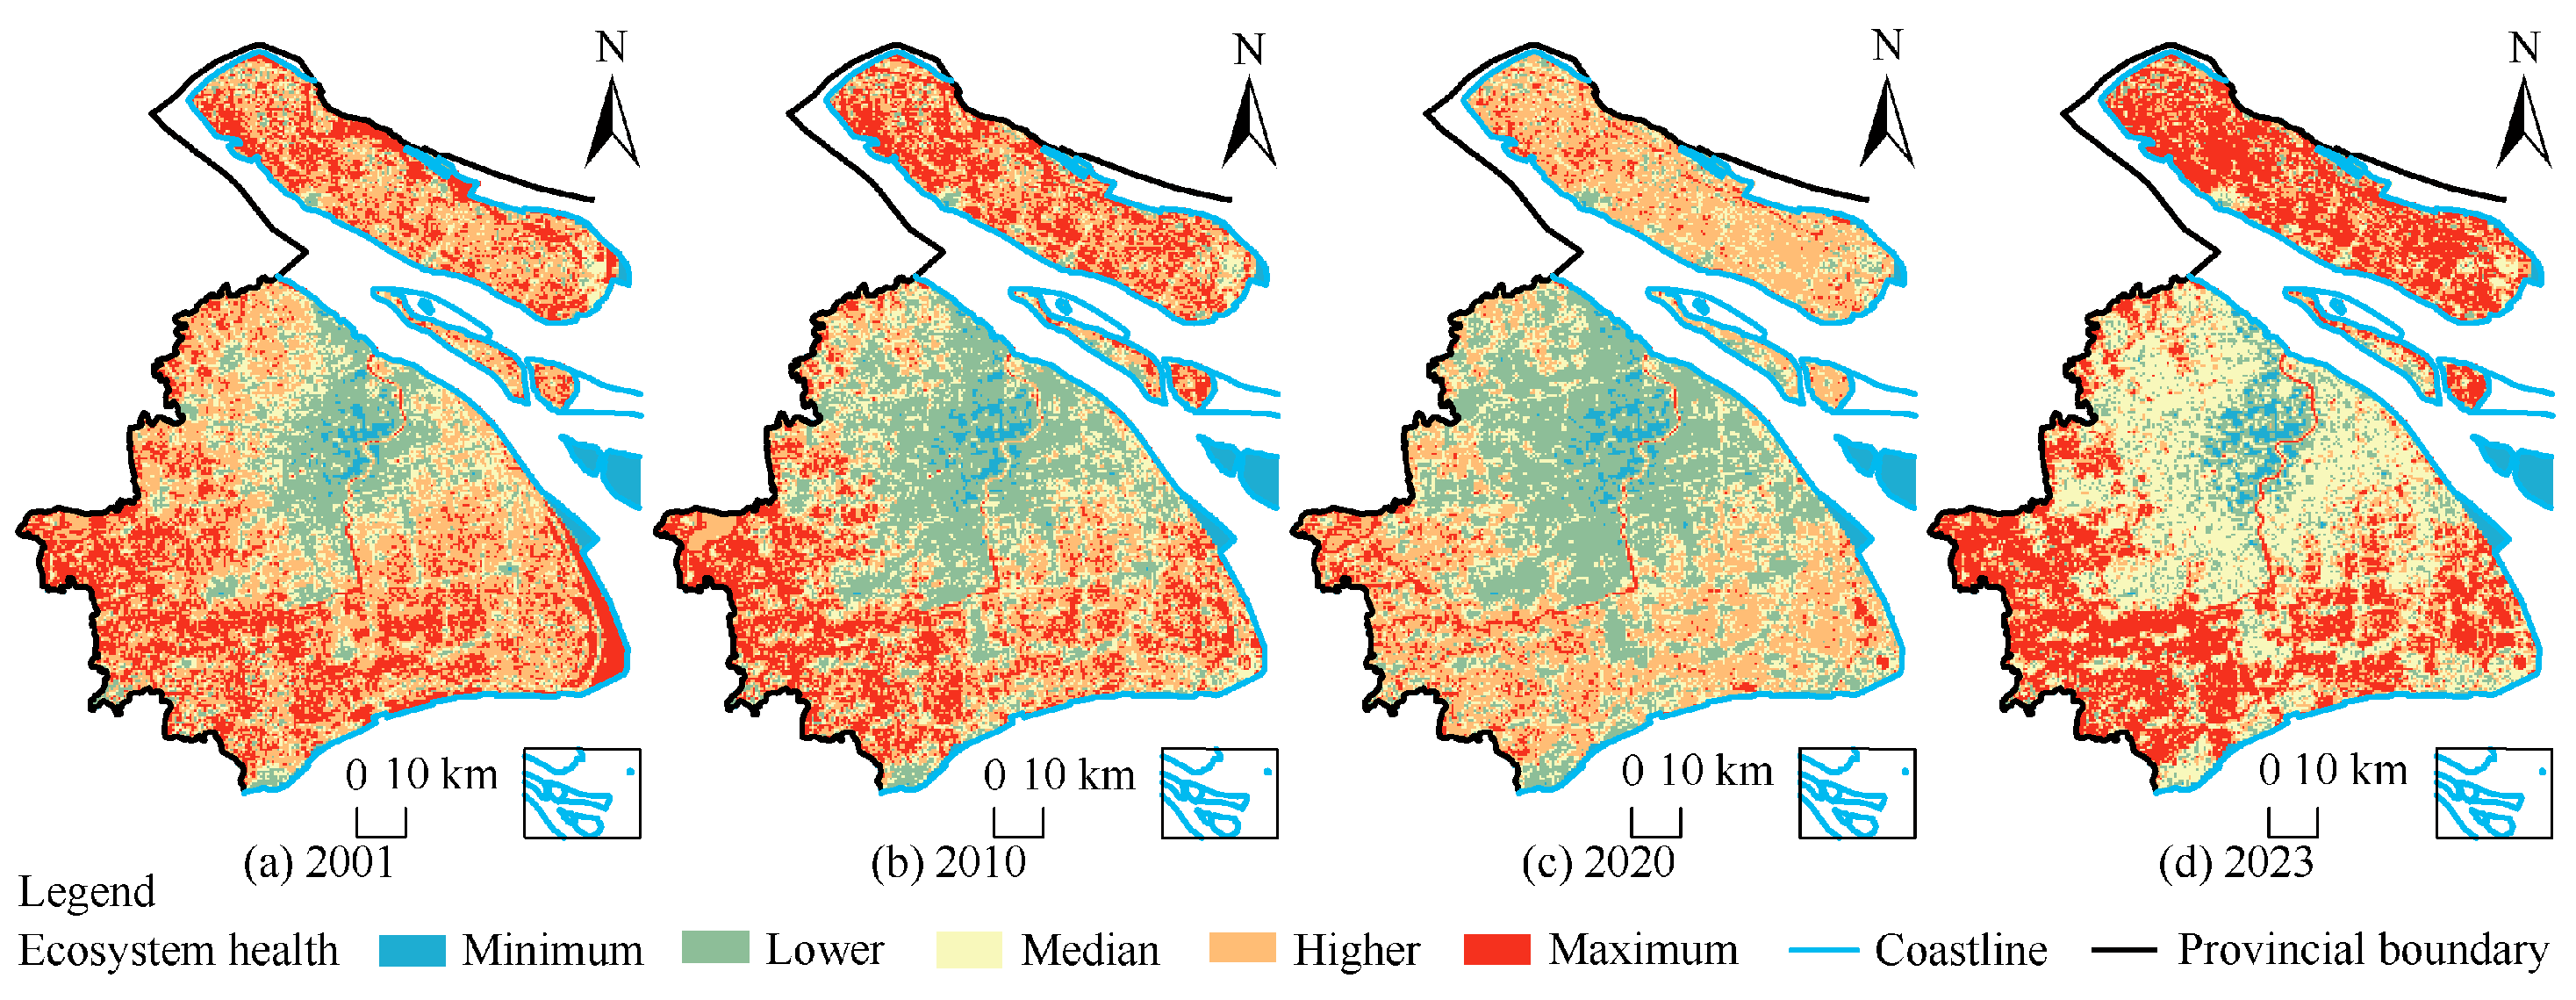
5.1.1. Evolution Characteristics of Ecosystem Health

VORS ecosystem health assessment framework, the ecosystem health patterns of Shanghai in 2001, 2010, 2020, and 2023 were assessed at a 500-m grid scale (Figure 4). Changes in the city’s EHI are divided into two stages: a decline phase and a restoration phase.
From 2001 to 2020, the EHI consistently declined from 0.570 to 0.507. As shown in Figure 4a–c, low ecosystem health values were concentrated in the central urban regions and expanded outward. This suggests that the central urban areas were affected by increased building density, industrial park development, and road infrastructure expansion, which disrupted the original ecosystems. In contrast, higher values were observed in the outer districts, including Chongming, Qingpu, Songjiang, Jinshan, and Fengxian, though the extent of these high-value areas gradually diminished. These regions, rich in wetlands, water systems, and green spaces, experienced a reduction in ecological space due to urban expansion, weakening ecosystem health functions.
From 2020 to 2023, the EHI increased from 0.507 to 0.559, reflecting a broad improvement in ecosystem health (Figure 4d). Low-value areas were limited to small regions in the city center, while medium and high-value areas expanded. This indicates that recent ecological restoration and green development policies in Shanghai, such as the “Shanghai 2021–2023 Ecological Environment Protection and Construction Three-Year Action Plan,” significantly improve urban environmental governance and restoration efforts.

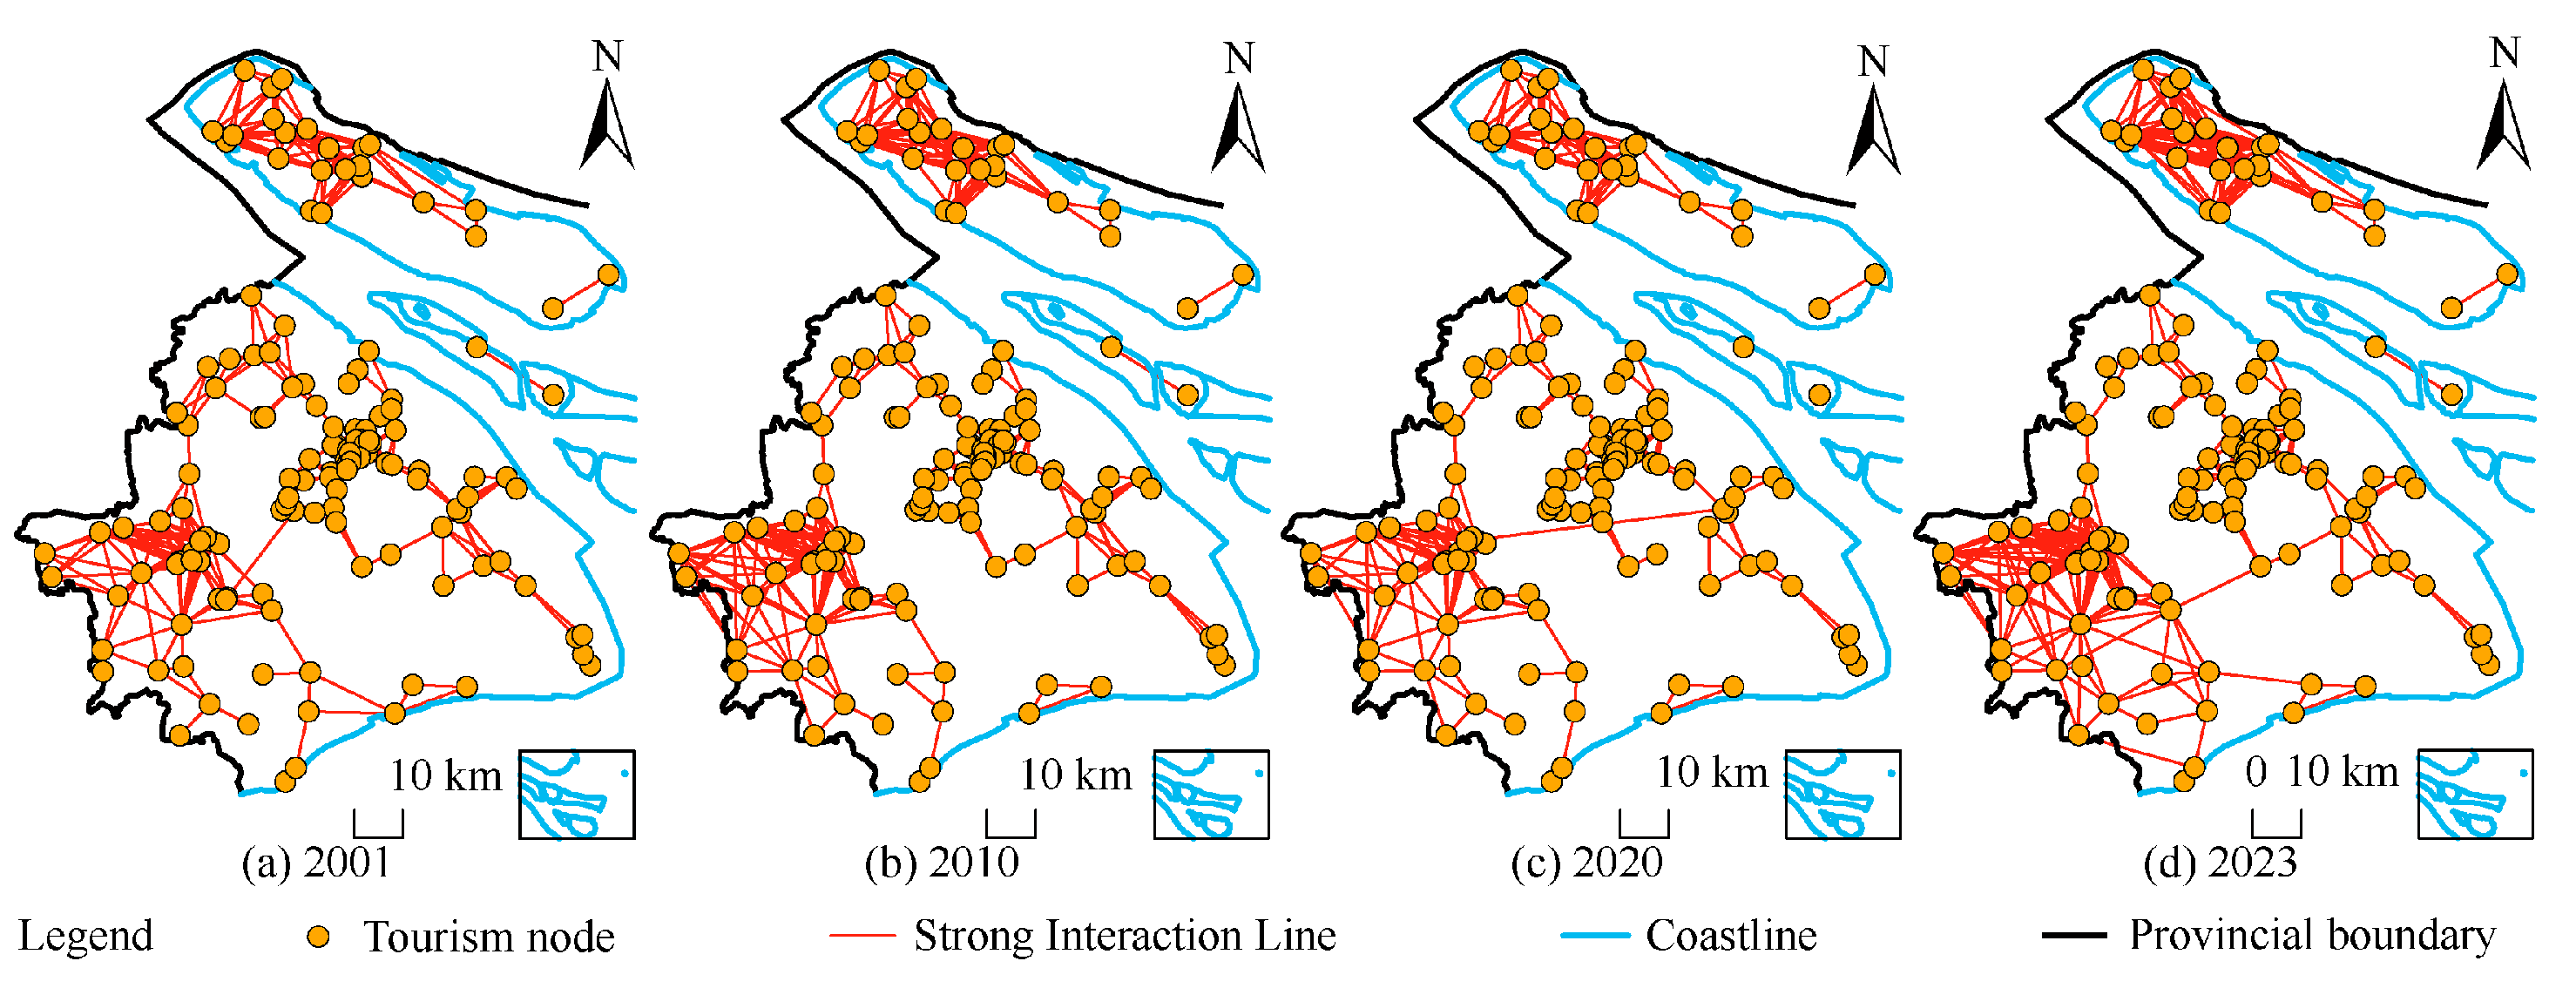
5.1.2. Evolution Characteristics of the Tourism Ecological Health Network

Using 3A-level and above tourist attractions in Shanghai as source patches and the inverse values of ecosystem health as resistance surfaces, this study applied the MCR model to extract tourism ecological health corridors, forming a TEHN that integrated both source patches and corridors (Figure 5). Kernel density estimation was then used to visualize the spatial distribution and variability of the network (Figure 6).
The TEHN in Shanghai exhibits an islandization phenomenon, particularly in the northern Chongming District. As shown in Figure 5, Chongming, the third-largest island in China and the largest sand island, is surrounded by water and lacks direct land connectivity with the southern part of Shanghai. This geographic isolation makes it a relatively independent “island” in the TEHN. Such a location presents challenges to the network’s connectivity and integrity, potentially hindering the collaborative optimization of regional tourism ecology.
The TEHN in Shanghai has shifted from a dispersed to a more concentrated pattern, with a higher concentration in the city center and more fragmented coverage in the periphery. As shown in Figure 6, in 2001, areas with medium to high kernel density in the network were distributed across the city. By 2010, peripheral density declined, while city center concentration increased, a trend that persisted in 2020 and 2023. This shift indicates that the EHI declined from 2001 to 2020, resulting in higher resistance values and changes in the MCR path calculated by the MCR model. With higher resistance values in the peripheral areas, tourism ecological health corridors connecting the periphery to the city center prioritized corridors passing through the city center. Additionally, the city center’s higher density of attractions and corridors further concentrated the network. Although the EHI showed some recovery in 2023, significant ecological degradation in previous years meant that while the ecosystem health in the far suburbs improved, the near suburbs remained at a moderate level (Figure 4a,d). Consequently, some tourism ecological health corridors still favored passing through the city center to connect attractions, maintaining the network’s concentration in the city center.

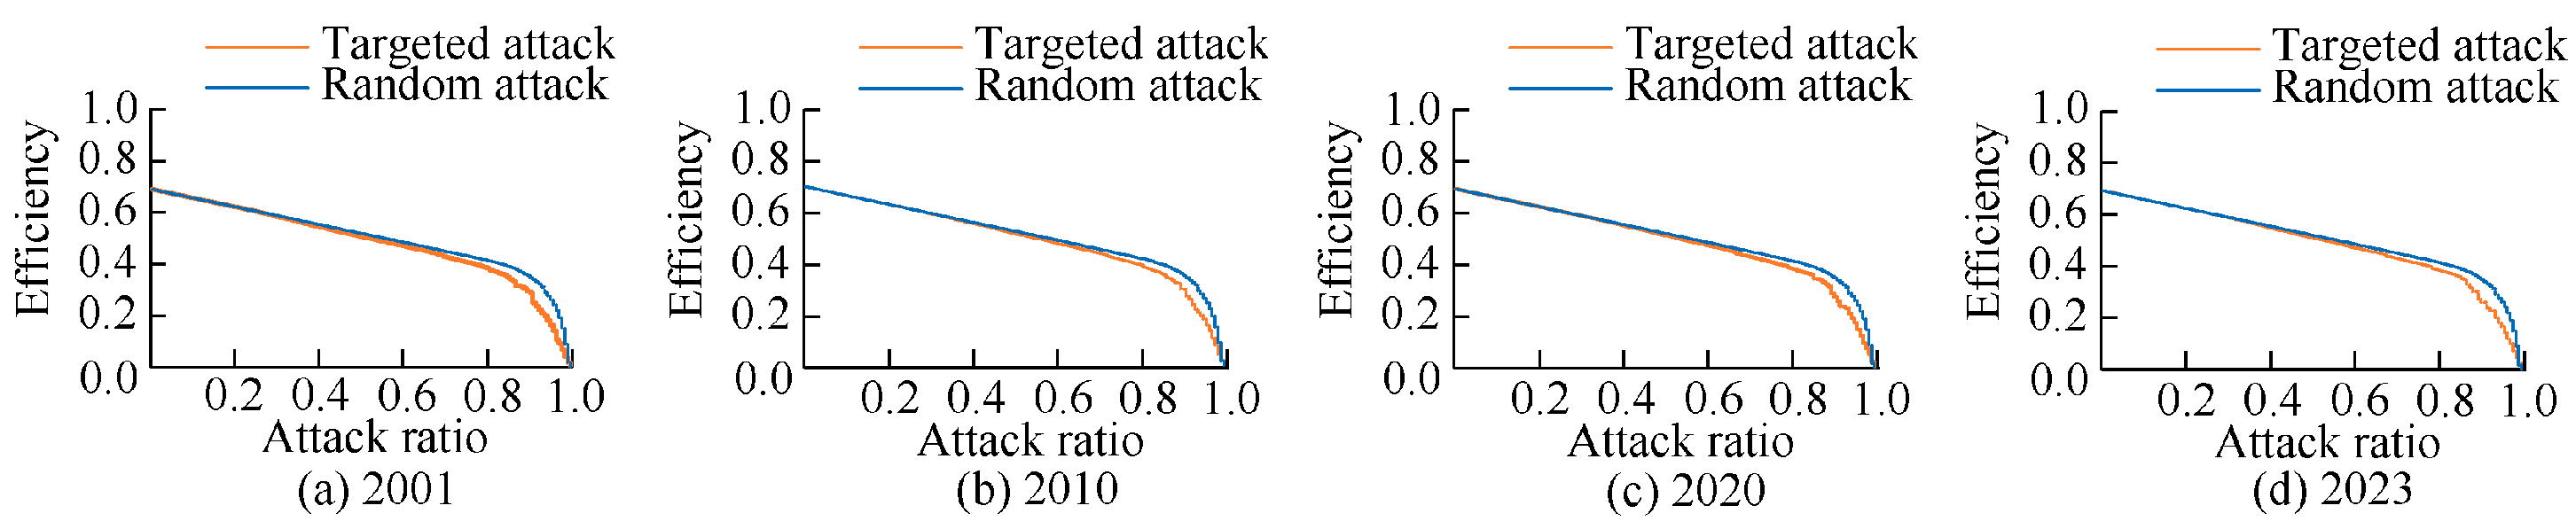
5.2. Resilience Evaluation of the Tourism Ecological Health Network

To measure the resilience of the TEHN, a gravity model was used to extract a topological structure, with source patches as nodes and corridors as the network. For better visualization, connections below the mean value were concealed (Figure 7). The strong links of the TEHN in Shanghai remained relatively stable, being primarily composed of short-distance connections, with fewer long-distance connections between the city center and the periphery. As shown in Figure 7, although the strong connections in 2001, 2010, 2020, and 2023 underwent slight adjustments over the years, their overall structure remained largely unchanged. These strong connections were primarily short-range links, forming three core aggregation areas: the city center, the Qingpu-Songjiang region, and Chongming District. This indicates that the spatial connectivity of the TEHN has become more stable, with tight connections in local areas, while the overall network remains relatively weak.
Based on the obtained topological structure, the resilience of the TEHN was evaluated (Table 3). Overall, the resilience index showed a consistent upward trend, rising from 0.175 in 2001 to 0.263 in 2023. Since all resilience indicators in this study were normalized to a (0, 1) scale, where values closer to 1 indicated stronger resilience, a value of 0.263 suggested a relatively low level. Currently, no universally accepted threshold defines the “optimal level” of network resilience. Thus, this interpretation is based on the index’s relative distance from the upper bound of the scale. However, the evolution of various resilience indicators across different years also reveals discrepancies, indicating an uneven enhancement of resilience.
Initially, in terms of structural resilience, both node robustness and network robustness exhibited stable evolutionary characteristics at high levels (Figure 8 and Figure 9). From 2001 to 2023, under both deliberate and random attacks, the trends of node and network robustness remained stable, with node robustness being higher. This stability can be attributed to the relatively consistent evolution of connectivity in Shanghai’s TEHN, which displays a core–periphery structure (Figure 7). Even when key connections in the core area were removed, the core maintained a number of tourism nodes, forming redundant paths that preserved node connectivity. However, this led to the shortest paths between nodes being longer, which reduced the overall network efficiency.
Subsequently, the node tourism effect index increased significantly, gradually forming three core aggregation areas: the city center, the Qingpu-Songjiang region, and Chongming District (Figure 10). In 2001, the node tourism effect was generally low, with only a few nodes exerting considerable influence. By 2010, the node tourism effect had significantly increased, with higher values in the Qingpu and Songjiang districts. In 2020, high tourism effect zones expanded further, with many high-value nodes emerging in the city center and Chongming District. By 2023, the node tourism effect had spread across the entire region, with tourism nodes in other areas also developing. This evolution can be attributed to several factors. The city center maintained its dominant position due to its high centrality and the cumulative effect of high-quality tourist attractions. In Qingpu and Songjiang, the tourism effect increased after 2010, due to infrastructure improvements, upgrades in attractions, and higher node centrality. In Chongming District, the tourism effect surged after 2020 because of eco-tourism development, better transportation infrastructure, and policy support. These factors suggest that the nodes not only have strong ecological connectivity but also possess high tourism attractiveness and development potential.
In addition, the node ecological effect index has grown at a slower pace, with Qingpu-Songjiang and Chongming District remaining as core aggregation areas (Figure 11). No significant changes were observed in the node ecological efficiency index in 2001, 2010, and 2020. However, in 2023, ecological effects improved noticeably across the entire region. Over time, the node ecological effects in Qingpu-Songjiang and Chongming District remained high. This can be attributed to the high ecological resource endowment in these areas, with many nodes being large wetland parks, forest parks, and botanical gardens. Additionally, as node centrality has increased, these regions not only maintain ecological connections with other nodes but also use their ecological advantages to foster ecological diffusion.
Furthermore, the network integration index has grown slowly, increasing from 0.012 to 0.056 (Figure 12a–d). From 2001 to 2023, the integration of urban roads in Shanghai gradually improved, forming a spatial structure with the city center as the core, tapering off toward the periphery. In this context, the integration of the TEHN steadily increased, but its growth was limited. This suggests that ecological accessibility between attractions is relatively low and reflects the urban road system’s planning model, which is primarily focused on serving commuting areas and economic development, while its suitability for tourism ecological mobility remains insufficient.
Finally, the network choice index remains low, showing a stable, low-level trend, fluctuating between 0.013 and 0.015 (Figure 12e–h). From 2001 to 2023, the choice of roads in Shanghai gradually increased, with a higher level of choice concentrated on major roads, highways, and other key transportation corridors, forming a spatial structure that extended from the center to the periphery. In this context, the choice of the TEHN did not change significantly, remaining at a low level. This indicates that the network’s circulation capacity within the overall transportation system is weak, and tourists’ range of mobility along ecosystem health paths is limited, primarily relying on the support of other roads, rather than efficiently moving through the TEHN.

5.3. Resilience Enhancement of Tourism Ecological Health Network

Based on the previous evaluation of Shanghai’s TEHN and its resilience, we propose strategies to enhance its resilience. It is important to note that the TEHN is a simulated network designed to support ecosystem health, rather than a representation of actual transportation infrastructure or tourist mobility patterns. Accordingly, the following recommendations should be viewed as forward-looking ecological planning strategies derived from simulation outcomes, intended to inform real-world spatial decision-making.
We propose constructing a multi-level, multi-center TEHN based on structural resilience. This network should focus on enhancing connectivity and optimizing spatial balance. These strategies aim to reduce islandization, mitigate the central city agglomeration effect, and improve connectivity in peripheral areas, ultimately enhancing the system’s stability and anti-interference capability. Specifically, the first priority is to improve the connectivity of isolated areas, thereby enhancing the network’s overall integrity. Drawing on the ecological simulation results, we recommend prioritizing the development of environmentally friendly transport links, such as green bridges and ecological ferry routes, at key ecological breaks and river-crossing bottlenecks. These connections should be supported by non-motorized pathways and integrated green mobility hubs. For example, on Changxing Island and Hengsha Island, dedicated spaces could be reserved for future multi-modal ecological transport stations combining ferry services, bicycle rental organizations, and tourist service facilities. We also propose developing the “Chongming Ecological Transport Hub Layout Guidelines” to establish clear standards for accessibility, vegetation coverage, and spatial reservation, providing technical guidance for future cross-river infrastructure and ecological transport network planning.
Next, it is necessary to break the unipolar agglomeration trend in the central city by optimizing spatial balance within the network. Based on the simulation results, which identified potential peripheral ecological corridors, we recommend developing secondary eco-tourism centers in districts such as Songjiang, Qingpu, Fengxian, and Jinshan to facilitate the outward diffusion of ecological recreation functions. A dedicated spatial coordination plan for a “multi-center–multi-corridor” eco-tourism network should be led by the Municipal Bureau of Culture and Tourism, defining the hierarchy of nodes and corridors, public service distribution, and green mobility integration mechanisms. For example, integrating ecological belts around the city—such as Dianshan Lake, Dongtan Wetland, and the Hangzhou Bay coastline—will help establish a peripheral ecological tourism loop, boosting tourism flow in these areas.
Guided by functional resilience, we aim to develop an efficient, ecologically sustainable, and adaptive TEHN. Optimization should focus on enhancing the adaptability of tourism resources, strengthening ecosystem support capacity, and improving the tourism transport system. Achieving this requires boosting the service capacity of tourism resources, enhancing the diffusion of ecological resources, and increasing the support capacity of the transport system, which will ultimately improve the network’s resilience and sustainability. Specifically, first, enhancing the tourism function at key nodes will improve the integrated capacity for tourism and ecology. Our research findings indicated that although the spatial distribution of tourism effects had stabilized, regional development imbalances persisted. Wetlands, suburban parks, and agri-tourism models should be employed to enhance the flow and utilization of tourism resources in Qingpu, Songjiang, Jinshan, and Fengxian districts. For example, Qingpu District could utilize Dianshan Lake and its surrounding wetlands to create an integrated tourism corridor that connects wetland ecology, historic towns, and agritourism, complemented by visitor centers, walking trails, and interpretive signage. Jinshan and Fengxian could focus on their coastal and agricultural environments by developing eco-campsites, farming experience areas, and cultural display sites to form multifunctional tourism spaces that reflect their distinctive local identities.
In addition, enhancing ecological effects at key nodes will facilitate the diffusion and sharing of ecological resources. Our research findings showed that the diffusion of ecological effects was slow, being primarily concentrated in Qingpu-Songjiang and Chongming District, which limited the overall improvement of the city’s tourism ecology. Future efforts should focus on promoting ecological spillover effects from peripheral areas to the urban center by establishing ecological buffer zones in suburban regions. Ecological restoration and greenway construction would facilitate the diffusion of ecological resources toward the city center. For example, any development of the “One River, One Creek” ecological corridor should prioritize improving public spaces along the Huangpu River and Suzhou Creek by enhancing their environmental quality, accessibility, and recreational functions.
Finally, optimizing the tourism transport network will improve the adaptability of the TEHN. Based on the results derived from network integration and choice, given that the TEHN was a simulated network without a fully aligned physical transportation system, future planning should incorporate ecological corridors and greenway interfaces into the urban road network. We recommend that the municipal transportation authority lead the development of a dedicated “Shanghai Ecological Slow Mobility Plan for Tourism,” centered on a three-tier non-motorized access system that connects parks, scenic areas, and neighborhoods. This plan should specify route classifications, node connectivity, and standard roadway widths. At key ecological mobility nodes, low-impact tourism infrastructure—such as interpretive signage and mobile service stations—should be provided to meet essential visitor needs while minimizing environmental disturbance. In areas with dense ecological resources and significant tourism demand, pilot ecological transit routes could be implemented, including the “Chongming Green Island Loop” and the “Dianshan Lake Ecotourism Transit Ring.” These routes should integrate electric buses, small shuttle vehicles, and non-motorized paths to enhance ecological accessibility and adaptability. Related infrastructure and projects should be embedded within the city’s integrated transportation and public space planning framework, coordinated across departments to support an ecologically driven and collaborative implementation approach.

6. Discussion

6.1. Construction of Tourism Ecological Health Network

By introducing the concept of a TEHN, this study integrates ecosystem health with tourist flow networks. Existing research typically considers ecological factors as supplementary references when optimizing tourist flow [7,8], or focuses on the ecological conservation behaviors of residents and tourists at tourist destinations [55,56]. However, a systematic tourist flow network, with ecosystem health as the core constraint, has not been established. The development of tourism has profoundly impacted ecosystem health [9,10,11], yet current optimization efforts for tourist flow networks have not fully integrated ecosystem health constraints. This study uses the EHI as a core constraint in constructing the tourist flow network, directly simulating the formation of the optimal TEHN between tourist attractions using the MCR model. This approach overcomes the limitations of traditional studies and provides a new theoretical framework for optimizing tourism flow networks.
This study constructs the TEHN for Shanghai using the VORS and MCR models while analyzing its spatiotemporal evolution. The results show that from 2001 to 2023, the TEHN in Shanghai exhibited a central agglomeration pattern, with lower network density in peripheral areas. This trend was primarily driven by a decline in the city’s EHI in 2010, 2020, and 2023 compared to 2001. While the ecological value in peripheral areas has consistently been higher than in the central urban areas, the ecological resistance value in the periphery has shown a more pronounced upward trend. Tourism ecological health corridors based on the MCR model will prioritize paths with lower cumulative resistance values [26,27,31]. In long-distance ecological connections in the TEHN between peripheral areas and the central urban districts, corridors tended to favor paths through areas with lower cumulative resistance values in the city center. This pattern suggests that the TEHN conformed to a typical “core strengthening–periphery weakening” spatial structure, consistent with the core–periphery model in complex networks, where highly central nodes demonstrated greater connectivity and redundancy, while peripheral nodes were more susceptible to disconnection and external disturbances [57]. This shift further concentrated the TEHN toward the central urban areas, consistent with the findings of Wang et al. (2021) [25], where tourism nodes in the central city were more tightly connected, and tourist flow was more concentrated. This trend not only increases the ecological carrying capacity in the central city but also exacerbates the disparity in the distribution of tourism resources between central and peripheral areas [58]. Additionally, this phenomenon suggests that, despite the gradual inclusion of ecosystem health factors in Shanghai’s urban planning, a structural imbalance in ecological connectivity between tourist attractions remains. The increasing ecological pressure from tourist flow, as noted in Ref. [59], underscores the rising ecological pressure seen in Shanghai’s tourism sector, emphasizing the need for a low-carbon tourism model. Therefore, for large cities like Shanghai, with a substantial population and economic scales, constructing and optimizing the TEHN is essential.
From a temporal perspective, the TEHN structures constructed for 2001, 2010, 2020, and 2023 did not exhibit notable fluctuations in overall spatial configuration or structural resilience metrics. The network consistently exhibited central agglomeration and weak peripheral connectivity, without signs of abrupt changes or major structural reconfigurations. This stability suggests that when ecosystem health is used as the primary constraint for path resistance, the TEHN maintains a robust structural configuration. Its dynamic evolution is largely shaped by long-term spatial trends and the inertia of ecological resistance, with limited responsiveness to short-term shocks such as the COVID-19 pandemic in 2020. This pattern aligns with theoretical insights, such as those by Gonzalez et al. (2017) [60], who demonstrated that ecological network stability and connectivity follow a nonlinear relationship and tend to converge toward persistent structural cores. These findings highlight the structural inertia embedded in the TEHN’s path selection process. To better capture the effects of policy changes or shifts in tourism activity on the ecology–tourism system, future studies should incorporate more continuous temporal data.

6.2. Resilience Analysis of the Tourism Ecological Health Network

Resilience is a key indicator in network evaluation, reflecting the network’s ability to maintain stability and sustainability in the face of external disturbances [12]. As a comprehensive evaluation dimension, resilience assesses not only the network’s structural robustness but also its adaptability and recovery capacity at the functional level [41,42]. This study analyzed the TEHN from two perspectives: structural resilience and functional resilience. The results showed that the network excelled in terms of structural resilience, particularly through the high stability of node robustness and network resilience over time, suggesting that the core tourism nodes maintained strong connectivity, even when exposed to external disturbances. This pattern of structural evolution supports the theoretical proposition in complex network theory that redundancy regarding connections and central core concentration enhances the overall network resilience [57].
However, the analysis identified notable limitations to functional resilience. First, tourism effects on individual nodes increased significantly, with Qingpu, Songjiang, and Chongming gradually emerging as new functional centers. These changes were primarily driven by human-induced factors, such as scenic area rankings and transportation accessibility, which could rapidly enhance nodal performance in the short term. From a complex network perspective, this pattern aligned with the “preferential attachment mechanism,” wherein highly connected nodes were more likely to attract additional links, reinforcing their functional dominance and widening the core–periphery divide [61]. Second, ecological effects at the nodes showed slower growth. Being constrained by land use structure, it was difficult to achieve significant short-term improvements in ecosystem health through policy or engineering measures. This outcome reflected the structural inertia and adaptive delay that are characteristic of ecosystem resilience, marked by strong path dependence and limited regulatory flexibility [62]. Finally, the network demonstrated low levels of integration and choice, indicating that the TEHN was not yet effectively integrated with the urban transportation system. This misalignment limited tourists’ ability to select eco-friendly travel routes and highlighted a structural imbalance that is often observed in network systems. While structural embedding existed, functional embedding remained insufficient, exemplifying the theoretical assertion that “connectivity does not necessarily imply accessibility” [63].
Additionally, this study confirms that structural and functional resilience are not linearly positively correlated, as noted in previous research [64,65,66]. While high structural resilience enhances network stability, the absence of appropriate functional integration may limit the tourism ecological network’s adaptability to environmental changes or emergencies. Therefore, optimizing the resilience of the TEHN requires considering the synergistic relationship between structure and function to achieve higher levels of adaptability and sustainability.

6.3. Practical Implications

The resilience enhancement strategies outlined above have highlighted the scientific relevance of TEHN simulation and have provided practical, forward-looking guidance for urban ecological planning, tourism development, and transportation management. Ecological planning authorities should focus on restoring ecological connectivity and deploying green infrastructure by targeting critical nodes and potential corridors that were identified through the simulated network. Priority should be given to addressing disruptions in ecological paths and cross-river bottlenecks through the introduction of eco-friendly facilities such as ecological corridors, green bridges, and multimodal slow mobility routes to enhance overall system coherence and resilience.
Cultural and tourism agencies should encourage the expansion of eco-tourism functions into peripheral urban areas to support a “multi-center–multi-corridor” spatial structure that aligns ecological assets with tourism services. This objective can be achieved by developing targeted spatial plans that define functional roles and service levels for key nodes and by coordinating eco-tourism infrastructure with green transportation networks, thereby promoting both ecological conservation and tourism growth.
Transportation and infrastructure departments should incorporate ecological mobility needs into their non-motorized and public transport planning. In major ecological nodes and high-traffic tourism areas, emphasis should be placed on green mobility solutions such as electric buses, slow travel networks, and eco-service hubs. A dedicated ecological tourism mobility plan should be formulated to build a three-tier slow travel system linking parks, scenic sites, and communities. Coordinated policy efforts and multi-agency collaboration are essential to support the integrated development and implementation of an environmentally sustainable transportation network.

6.4. Limitations and Further Work

This study has five limitations. First, the research area is limited but can be expanded to include additional cities. This study focused on Shanghai, a highly urbanized megacity, and its TEHN and resilience evolution might not have been applicable to cities with differing geographical environments, economic development levels, and ecological characteristics.
Second, the diversity of the research data can be improved. In evaluating the TEHN, this study integrated data from the LULC, NDVI, and road networks to simulate optimal ecological tourism paths using the MCR model. However, this approach was ecologically driven and did not reflect actual tourist movement. Due to fundamental differences in modeling logic and variable dimensions, behavioral data were not included for cross-validation. In addition, obtaining multi-temporal, multi-sample behavioral datasets has remained challenging due to privacy constraints, limited access, and incomplete coverage. While the MCR model captures ecological connectivity effectively, it fails to fully account for tourist path preferences, cost sensitivities, or environmental constraints. Consequently, further validation of the TEHN’s alignment with real-world tourism flows is needed, especially across different urban contexts. Future research should integrate behavioral data, including GPS trajectories, social media activity, and traffic flow records, to explore the coupling between ecological routes and actual movement, thereby supporting more behaviorally responsive eco-tourism planning.
Third, the temporal resolution of the analysis could be improved. We selected 2001, 2010, 2020, and 2023 as observation points, representing the formation, expansion, disruption, and recovery phases of the TEHN. However, our findings indicated that the 2020 disruption, attributed to the COVID-19 pandemic, did not result in significant structural or resilience changes, with patterns remaining highly consistent with those in 2010 and 2023. This suggests that Shanghai’s TEHN exhibits structural persistence in response to sudden shocks. While this stability is notable, the long and irregular time intervals may obscure the influence of intermediate events such as new policies, behavioral shifts, or infrastructure upgrades. For instance, China’s 2016 “Healthy China 2030” initiative may have contributed to improvements in spatial layout and resilience. Future work should consider incorporating denser or continuous annual data to better capture the dynamic evolution of the TEHN and enhance the completeness of the findings.
Fourth, the selection of tourism nodes could be more comprehensive. We focused on scenic areas that were nationally rated 3A-level and above to ensure data reliability. However, this criterion may exclude functionally important sites, including popular but unrated attractions, cultural resources, or emerging destinations. Future studies should utilize alternative data sources such as user reviews and social media content to identify a more inclusive range of tourism nodes and improve model representativeness.
Finally, certain key parameter settings require more systematic validation. We assigned weights for the VORS indicators and network resilience metrics based on the literature and the AHP, both of which have provided theoretical and methodological support. However, the weighting process could benefit from further refinement. We used a 500 m × 500 m regular grid as the modeling and analysis unit, a resolution that is commonly applied in urban spatial research. Nevertheless, variations in spatial scale can affect the distribution of ecological indicators and network structure detection. Future studies should incorporate systematic parameter sensitivity testing to enhance model transparency and robustness.

7. Conclusions

This study conceptualized the TEHN as a complex adaptive system that integrates ecological and tourism subsystems. By coupling the VORS framework with the MCR model under ecosystem health constraints, we constructed a dynamic spatial network that reflects both environmental resistance and tourism accessibility. A dual-dimensional resilience assessment framework—encompassing both structural and functional components—was further developed to quantify the system’s stability, adaptability, and resilience. This systems-based approach overcomes the limitations of traditional tourism network optimization, which often marginalizes ecological variables, by embedding ecological sustainability directly into tourist flow modeling. The framework offers a scientific basis for integrated decision-making in the coordinated development of tourism and ecosystems.
We reached the following conclusions: As ecosystem health declined—especially in peripheral areas—Shanghai’s TEHN shifted from a dispersed layout to a more centralized and clustered form, with limited connectivity in outer regions. The network’s resilience comprised structural and functional components, exhibiting an overall upward trend. While structural resilience remained relatively high, functional resilience still required improvement. Low levels of network integration and choice—key components of functional resilience—reflected insufficient alignment between the TEHN and the urban transportation system, thereby limiting tourists’ access to eco-friendly travel routes. In response, a development strategy was proposed to maintain structural resilience while strengthening functional resilience. This approach aimed to guide the transition of the network from a centralized model toward a multi-centered, hierarchical structure, promoting efficient connectivity, ecological compatibility, and long-term sustainability.

Author Contributions

M.W.: writing—original draft, visualization, methodology, investigation, formal analysis, data curation, and conceptualization. T.H.: writing—review and editing, validation, supervision, resources, project administration, and funding acquisition. All authors have read and agreed to the published version of the manuscript.

Funding

The research was funded by the National Social Science Foundation of China, grant number 23BGL168.

Data Availability Statement

The original contributions presented in this study are included in the article. Further inquiries can be directed to the corresponding author.

Conflicts of Interest

The authors declare no conflicts of interest.

Abbreviations

The following abbreviations are used in this manuscript:
TEHNTourism ecological health network
EHIEcosystem health index
VORSVigor–organization–resilience–services
MCRMinimum cumulative resistance
AHPAnalytic hierarchy process
LULCLand use and land cover
NDVINormalized difference vegetation index

References

  1. Li, Y.; Qin, L.; Wang, Y.; Liu, H.; Zhang, M.; Hao, H. Ecosystem health assessment of the largest lake wetland in the Yellow River basin using an improved vigor-organization-resilience-services model. Ecol. Indic. 2024, 166, 112539. [Google Scholar] [CrossRef]
  2. Ran, P.; Frazier, A.E.; Xia, C.; Tiando, D.S.; Feng, Y. How does urban landscape pattern affect ecosystem health? Insights from a spatiotemporal analysis of 212 major cities in China. Sustain. Cities Soc. 2023, 99, 104963. [Google Scholar] [CrossRef]
  3. Debbage, K.G.; Debbage, N. Aviation carbon emissions, route choice and tourist destinations: Are non-stop routes a remedy? Ann. Tour. Res. 2019, 79, 102765. [Google Scholar] [CrossRef]
  4. Jiménez-Uribe, D.A.; Daniels, D.; González- Álvarez, Á.; Vélez-Pereira, A.M. Influence of vehicular traffic on environmental noise spectrum in the tourist route of Santa Marta City. Energy Rep. 2020, 6, 818–824. [Google Scholar] [CrossRef]
  5. Zhang, J.; Hu, R.; Cheng, X.; Christos, V.; Philbin, S.P.; Zhao, R.; Zhao, X. Assessing the landscape ecological risk of road construction: The case of the Phnom Penh-Sihanoukville Expressway in Cambodia. Ecol. Indic. 2023, 154, 110582. [Google Scholar] [CrossRef]
  6. Tian, J.; Li, J. Analysis and treatment of the conflict between sustainable development and environmental protection based on the ecotourism concept. Front. Environ. Sci. 2022, 10, 1056643. [Google Scholar] [CrossRef]
  7. Campos, C.; Laso, J.; Cristóbal, J.; Albertí, J.; Bala, A.; Fullana, M.; Fullana-i-Palmer, P.; Margallo, M.; Aldaco, R. Towards more sustainable tourism under a carbon footprint approach: The Camino Lebaniego case study. J. Clean. Prod. 2022, 369, 133222. [Google Scholar] [CrossRef]
  8. Zouridaki, M.; Apostolakis, A.; Kourgiantakis, M. Cultural routes through the perspective of sustainable mobility: A critical literature review. J. Tour. Res. 2024, 26, e2756. [Google Scholar] [CrossRef]
  9. Li, J.; Shen, W. Spatial heterogeneity of the effects of human activities on ecosystem health of a coastal tourism city: A case study of Rizhao, China. Appl. Ecol. Environ. Res. 2021, 19, 3029–3051. [Google Scholar] [CrossRef]
  10. Wang, P.; Zhang, J.; Xu, D.; Chen, D.; Tao, J.; Wang, J.; Ma, X. Study on driving factors of island ecosystem health and multi-scenario ecology simulation using ecological conservation and eco-friendly tourism for achieving sustainability. J. Environ. Manag. 2025, 373, 123480. [Google Scholar] [CrossRef]
  11. Zhang, S.; Zhang, Z.; Zhang, T.; Ju, H. Assessment of coastal zone ecosystem health in the context of tourism development: A case study of Jiaozhou Bay. Ecol. Indic. 2024, 169, 112874. [Google Scholar] [CrossRef]
  12. Holling, C.S. Resilience and stability of ecological systems. Annu. Rev. Ecol. Syst. 1973, 4, 1–23. [Google Scholar] [CrossRef]
  13. Bhurtyal, S.; Hernandez, S.; Amankwah-Nkyi, K. Data-driven methods to assess transportation system resilience: Case study of the Arkansas roadway network. J. Transp. Eng. Part A Syst. 2025, 151, 05024005. [Google Scholar] [CrossRef]
  14. Zheng, J. Tourism supply chain resilience assessment and optimization based on complex networks and genetic algorithms. Syst. Soft Comput. 2025, 7, 200214. [Google Scholar] [CrossRef]
  15. Qi, D.; Wang, B.; Zhao, Q.; Jin, P. Research on the spatial network structure of tourist flows in Hangzhou based on BERT-BiLSTM-CRF. ISPRS Int. J. Geo-Inf. 2024, 13, 139. [Google Scholar] [CrossRef]
  16. Shao, Y.; Huang, S.; Wang, Y.; Li, Z.; Luo, M. Evolution of international tourist flows from 1995 to 2018: A network analysis perspective. Tour. Manag. Perspect. 2020, 36, 100752. [Google Scholar] [CrossRef] [PubMed]
  17. Vada, S.; Dupre, K.; Zhang, Y. Route tourism: A narrative literature review. Curr. Issues Tour. 2023, 26, 879–889. [Google Scholar] [CrossRef]
  18. Chen, X.; Huang, Y.; Chen, Y. Spatial pattern evolution and influencing factors of tourism flow in the Chengdu-Chongqing economic circle in China. ISPRS Int. J. Geo-Inf. 2023, 12, 121. [Google Scholar] [CrossRef]
  19. Zhu, N.; Zeng, G.; Li, X.; Zhong, Z. Optimum spatial scale of regional tourism cooperation based on spillover effects in tourism flows. Tour. Econ. 2023, 29, 409–436. [Google Scholar] [CrossRef]
  20. Zhou, S.; Zang, X.; Yang, J.; Li, J.; Chen, S. Modelling the coupling relationship between urban road spatial structure and traffic fow. Sustainability 2023, 15, 11142. [Google Scholar] [CrossRef]
  21. Cao, S. An optimal round-trip route planning method for tourism based on improved genetic algorithm. Comput. Intell. Neurosci. 2022, 2022, 7665874. [Google Scholar] [CrossRef]
  22. Pei, Q.; Wang, L.; Du, P.; Wang, Z. Optimization of tourism routes in Lushunkou District based on ArcGIS. PLoS ONE 2022, 17, e0264526. [Google Scholar] [CrossRef]
  23. Huang, Y.; Gan, X.; Feng, Y.; Li, J.; Niu, S.; Zhou, B. A new framework for assessing ecosystem health with consideration of the sustainable supply of ecosystem services. Landsc. Ecol. 2024, 39, 37. [Google Scholar] [CrossRef]
  24. Li, X.; Xia, G.; Lin, T.; Xu, Z.; Wang, Y. Construction of urban green space network in Kashgar City, China. Land 2022, 11, 1826. [Google Scholar] [CrossRef]
  25. Wang, L.; Wu, X.; He, Y. Nanjing’s intracity tourism flow network using cellular signaling data: A comparative analysis of residents and non-local tourists. ISPRS Int. J. Geo-Inf. 2021, 10, 674. [Google Scholar] [CrossRef]
  26. Cao, C.; Luo, Y.; Xu, L.; Xi, Y.; Zhou, Y. Construction of ecological security pattern based on InVEST-Conefor-MCRM: A case study of Xinjiang, China. Ecol. Indic. 2024, 159, 111647. [Google Scholar] [CrossRef]
  27. Wu, Z.; Lei, S.; Yan, Q.; Bian, Z.; Lu, Q. Landscape ecological network construction controlling surface coal mining effect on landscape ecology: A case study of a mining city in semi-arid steppe. Ecol. Indic. 2021, 133, 108403. [Google Scholar] [CrossRef]
  28. Yang, Y.; Wang, Y.; Tao, S.; Kong, Y.; Chen, J. A wildlife corridor site selection method based on the habitat suitability assessment of the Qinghai-Tibet Plateau. Glob. Ecol. Conserv. 2025, 58, e03452. [Google Scholar] [CrossRef]
  29. Costanza, R. Ecosystem health and ecological engineering. Ecol. Eng. 2012, 45, 24–29. [Google Scholar] [CrossRef]
  30. He, J.; Pan, Z.; Liu, D.; Guo, X. Exploring the regional differences of ecosystem health and its driving factors in China. Sci. Total Environ. 2019, 673, 553–564. [Google Scholar] [CrossRef]
  31. Peng, J.; Liu, Y.; Li, T.; Wu, J. Regional ecosystem health response to rural land use change: A case study in Lijiang City, China. Ecol. Indic. 2017, 72, 399–410. [Google Scholar] [CrossRef]
  32. Qiao, W.; Huang, X. The impact of land urbanization on ecosystem health in the Yangtze River Delta urban agglomerations, China. Cities 2022, 130, 103981. [Google Scholar] [CrossRef]
  33. Gan, L.; Wen, Q.; Lev, B.; Jiang, W. Tourism ecological security evaluation based on dynamic super-efficiency network SBM from the perspective of all-for-one tourism. J. Clean. Prod. 2023, 429, 139333. [Google Scholar] [CrossRef]
  34. Bergantino, A.S.; Gardelli, A.; Rotaris, L. Assessing transport network resilience: Empirical insights from real-world data studies. Transp. Rev. 2024, 44, 834–857. [Google Scholar] [CrossRef]
  35. Ruan, J.; Chen, Y.; Yang, Z. Assessment of Temporal and Spatial. Int. J. Disaster Risk Reduct. 2021, 66, 102578. [Google Scholar] [CrossRef]
  36. Zhai, X.; Sun, C.; Zou, W.; Hao, S. Spatiotemporal characteristic and evolution of China’s marine economic resilience. Ocean Coast. Manag. 2023, 238, 106562. [Google Scholar] [CrossRef]
  37. Van Ginkel, K.C.H.; Dottori, F.; Alfieri, L.; Feyen, L.; Koks, E.E. Flood risk assessment of the European road network. Nat. Hazards Earth Syst. Sci. 2021, 21, 1011–1027. [Google Scholar] [CrossRef]
  38. Xu, S.; Wang, X.; Tang, H.; Wang, D. Spatio-temporal evolution of population mobility differentiation patterns in a pandemic context: Based on a network perspective. Geomat. Nat. Hazards Risk 2023, 14, 2240945. [Google Scholar] [CrossRef]
  39. Wang, H.; Ge, Q. Spatial association network of economic resilience and its influencing factors: Evidence from 31 Chinese provinces. Humanit. Soc. Sci. Commun. 2023, 10, 290. [Google Scholar] [CrossRef] [PubMed]
  40. Wang, X.; Xu, S.; Wang, D. Analysis of regional resilience network from the perspective of relational and dynamic equilibrium. J. Clean. Prod. 2023, 425, 138859. [Google Scholar] [CrossRef]
  41. Chen, X.; Ma, S.; Chen, L.; Yang, L. Resilience measurement and analysis of intercity public transportation network. Transp. Res. D Transp. Environ. 2024, 131, 104202. [Google Scholar] [CrossRef]
  42. Li, J.; Nie, W.; Zhang, M.; Wang, L.; Dong, H.; Xu, B. Assessment and optimization of urban ecological network resilience based on disturbance scenario simulations: A case study of Nanjing city. J. Clean. Prod. 2024, 438, 140812. [Google Scholar] [CrossRef]
  43. Shi, J.; Cui, L. Characteristics of high impact weather and meteorological disaster in Shanghai, China. Nat. Hazards 2012, 60, 951–969. [Google Scholar] [CrossRef]
  44. Yuan, W.; Mu, X.; Jiao, J.; Li, D.; Li, J. How to enhancing urban space renewal through visual landscape perception? An approach from street view image recognition. Soc. Indic. Res. 2024, 175, 659–686. [Google Scholar] [CrossRef]
  45. Liu, B.; Tian, Y.; Guo, M.; Tran, D.; Alwah, A.A.Q.; Xu, D. Evaluating the disparity between supply and demand of park green space sing a multi-dimensional spatial equity evaluation framework. Cities 2022, 121, 103484. [Google Scholar] [CrossRef]
  46. Yang, J.; Huang, X. The 30 m annual land cover dataset and its dynamics in China from 1990 to 2019. Earth Syst. Sci. Data 2021, 13, 3907–3925. [Google Scholar] [CrossRef]
  47. Wu, Y.; Qin, F.; Li, L.; Dong, X. Construction and optimisation of watershed scale ecological network: A case study of Kuye River Basin. Front. Environ. Sci. 2024, 12, 1364568. [Google Scholar] [CrossRef]
  48. Zhao, S.; Ma, Y.; Wang, J.; You, X. Landscape pattern analysis and ecological network planning of Tianjin City. Urban For. Urban Green. 2019, 46, 126479. [Google Scholar] [CrossRef]
  49. D’Inverno, G.; Carosi, L.; Romano, G. Meeting the challenges of the waste hierarchy: A performance evaluation of EU countries. Ecol. Indic. 2024, 160, 111641. [Google Scholar] [CrossRef]
  50. Wang, Y.; Zhao, M.; Ji, R.; Shi, H. Food supply networks in the Pearl River Delta mega-city region: Characteristics, resilience and security strategies. J. Nat. Resour. 2024, 39, 564–581. (In Chinese) [Google Scholar] [CrossRef]
  51. Zikirya, B.; Xing, Y.; Zhou, C. The matching relationship between the distribution characteristics of high-grade tourist attractions and spatial vitality in Xinjiang. Sustainability 2024, 16, 9426. [Google Scholar] [CrossRef]
  52. Wang, H.; Liu, P. Characteristics of the urban environmental regulation network and its impact on carbon emission efficiency in China. Humanit. Soc. Sci. Commun. 2024, 11, 1378. [Google Scholar] [CrossRef]
  53. Li, X.; Lv, Z.; Zheng, Z.; Zhong, C.; Hijazi, I.H.; Cheng, S. Assessment of Lively Street Network Based on Geographic. Multimed. Tools Appl. 2017, 76, 17801–17819. [Google Scholar] [CrossRef]
  54. Liu, W.; Li, D.; Meng, Y.; Guo, C. The relationship between emotional perception and high-density built environment based on social media data: Evidence from spatial analyses in Wuhan. Land 2024, 13, 294. [Google Scholar] [CrossRef]
  55. Tian, X.; Jiang, Y. Exploring behavioral determinants of residents’ ecological conservation in rural tourism development. Sci. Rep. 2025, 15, 1826. [Google Scholar] [CrossRef]
  56. Zhang, W.; Ran, H. Research on the driving mechanism of tourists’ ecological protection behavior in intangible cultural heritage sites. Front. Psychol. 2024, 15, 1514482. [Google Scholar] [CrossRef]
  57. Gao, J.; Barzel, B.; Barabási, A. Universal resilience patterns in complex networks. Nature 2016, 530, 307–312. [Google Scholar] [CrossRef] [PubMed]
  58. Tan, X.; Liu, Z.; Shi, L.; Huang, X. Geospatial analysis of sports tourism resources in China’s urban clusters: A case study of the Sichuan-Chongqing region utilizing GIS and the geographic detector. Front. Sports Act. Living 2024, 6, 1496469. [Google Scholar] [CrossRef] [PubMed]
  59. Lin, W.; Li, Y.; Li, X.; Xu, D. The dynamic analysis and evaluation on tourist ecological footprint of city: Take Shanghai as an instance. Sustain. Cities Soc. 2018, 37, 541–549. [Google Scholar] [CrossRef]
  60. Gonzalez, A.; Thompson, P.; Loreau, M. Spatial ecological networks: Planning for sustainability in the long-term. Curr. Opin. Environ. Sustain. 2017, 29, 187–197. [Google Scholar] [CrossRef]
  61. Barabási, A.; Albert, B. Emergence of scaling in random networks. Science 1999, 286, 509–512. [Google Scholar] [CrossRef]
  62. Walker, B.; Holling, C.S.; Carpenter, S.R.; Kinzig, A.P. Resilience, adaptability and transformability in social–ecological systems. Ecol. Soc. 2004, 9, 5. [Google Scholar] [CrossRef]
  63. Batty, M. Accessibility: In search of a unified theory. Environ. Plan. B Urban Anal. City Sci. 2009, 36, 191–194. [Google Scholar] [CrossRef]
  64. Medaglia, J.D.; Huang, W.; Karuza, E.A.; Thompson-Schill, S.L.; Ribeiro, A.; Bassett, D.S. Functional alignment with anatomical networks is associated with cognitive flexibility. Nat. Hum. Behav. 2018, 2, 156–164. [Google Scholar] [CrossRef] [PubMed]
  65. Park, H.-J.; Friston, K. Structural and functional brain networks: From connections to cognition. Science 2013, 342, 1238411. [Google Scholar] [CrossRef] [PubMed]
  66. Wang, T.; Li, H.; Huang, Y. The complex ecological network’s resilience of the Wuhan metropolitan area. Ecol. Indic. 2021, 130, 108101. [Google Scholar] [CrossRef]
Figure 1. Location of the study area.
Systems 13 00654 g001
Figure 2. The technical framework of this study.
Systems 13 00654 g002
Figure 3. Network integration and choice under multiple buffer distances. (a) Network integration; (b) Network choice.
Systems 13 00654 g003
Figure 4. Evolution of an urban ecosystem health pattern. (a) 2001; (b) 2010; (c) 2020; (d) 2023.
Systems 13 00654 g004
Figure 5. Evolution of an urban tourism ecological health network pattern. (a) 2001; (b) 2010; (c) 2020; (d) 2023.
Systems 13 00654 g005
Figure 6. Kernel density analysis of urban tourism ecological health network. (a) 2001; (b) 2010; (c) 2020; (d) 2023.
Systems 13 00654 g006
Figure 7. Topological structure of the tourism ecological health network. (a) 2001; (b) 2010; (c) 2020; (d) 2023.
Systems 13 00654 g007
Figure 8. Node robustness of the urban tourism ecological health network. (a) 2001; (b) 2010; (c) 2020; (d) 2023.
Systems 13 00654 g008
Figure 9. Network robustness of the urban tourism ecological health network. (a) 2001; (b) 2010; (c) 2020; (d) 2023.
Systems 13 00654 g009
Figure 10. Node tourism effect in the urban tourism ecological health network. (a) 2001; (b) 2010; (c) 2020; (d) 2023.
Systems 13 00654 g010
Figure 11. Node ecological effect in the urban tourism ecological health network. (a) 2001; (b) 2010; (c) 2020; (d) 2023.
Systems 13 00654 g011
Figure 12. Analysis of urban road integration and degrees of choice. (a) Integration in 2001; (b) Integration in 2010; (c) Integration in 2020; (d) Integration in 2023; (e) Choice in 2001; (f) Choice in 2010; (g) Choice in 2020; (h) Choice in 2023.
Systems 13 00654 g012
Table 1. Ecosystem resilience coefficient (ERC) and ecosystem service coefficient (ESC) of each land use type in China.
Ecosystem TypeCroplandForestlandGrasslandWaterbodyBuilt-Up LandBarren Land
ERC0.5000.9000.7000.8000.2000.100
ESC0.5001.0000.8000.8500.3300.013
Table 2. Resilience evaluation indicator system for the tourism ecological health network.
DimensionIndicatorWeight
Structural resilienceNode robustness0.088
Network robustness0.140
Functional resilienceNode tourism effect0.394
Node ecological effect0.283
Network integration0.059
Network choice0.036
Table 3. Resilience evaluation of the urban tourism ecological health network.
Resilience Indicator2001201020202023
Node robustness0.7930.7950.7940.793
Network robustness0.4940.4960.4960.495
Node tourism effect0.0050.0650.1510.203
Node ecological effect0.1150.1310.1120.143
Network integration0.0120.0120.0360.056
Network choice0.0150.0160.0160.013
Resilience0.1750.2030.2330.263
Disclaimer/Publisher’s Note: The statements, opinions and data contained in all publications are solely those of the individual author(s) and contributor(s) and not of MDPI and/or the editor(s). MDPI and/or the editor(s) disclaim responsibility for any injury to people or property resulting from any ideas, methods, instructions or products referred to in the content.

