1. Introduction
Youth digital exclusion, particularly among those Not in Education, Employment, or Training (NEET), is not merely the outcome of individual deficiencies but a reflection of complex system-level dynamics. These include the interactions between socio-economic conditions, education systems, digital infrastructure, labor market access, and digital risk behaviors. This study adopts a systems thinking perspective to explore digital exclusion as an emergent outcome of multiple interrelated subsystems. By modeling these interdependencies—through Principal Component Analysis (PCA), logistic regression, and spatial analysis—we aim to understand how digital skills, behaviors, and structural variables jointly influence NEET vulnerability across European regions.
There are a number of definitions regarding digital competence that delimit it as the ability to explore and act flexibly in situations involving new technologies, to exploit the potential of technology to solve problems, and to generate and distribute new knowledge [
1]. Essential digital competencies at the beginning of the century included information literacy, communication, collaboration, critical thinking, creativity, and problem-solving [
2]. The high number of technological innovations in recent years has forced the labor market to update its skills to adapt to new requirements [
3]. Also, the need to develop appropriate educational solutions has led to the inclusion of artificial intelligence tools that significantly contribute to the assessment of student competence development more flexibly and efficiently [
4]. Currently, these are increasingly oriented towards elements such as cybersecurity [
5], data literacy [
6], cloud computing and server administration [
7], the use of digital and artificial intelligence tools [
8], and more.
In an era full of opportunities generated by digital technological developments, the internet offers both unprecedented learning situations and challenges regarding its risky use. Digital natives, namely the current generations of adolescents, are the largest consumers of information compared with previous generations, making them vulnerable to various forms of inappropriate behavior in the online environment and activities lacking or with a low level of ethics, a fact that is especially accentuated among those from families with low socio-economic status [
9]. In this sense, Netiquette, a hybrid word combining “network” and “etiquette”, outlines the social code of the internet intended to reduce activities that involve, among others, the expression of personal data, harassment, pranks, and hate speech, as well as accessing inappropriate content [
10].
Less defined by researchers, in our opinion, risky internet use (RIU) refers to any behavior adopted by children or adolescents during their internet usage that endangers them to face psychological, social, legal, or even physical harm. They are mostly related to the absence of digital literacy, emotional control, or an awareness of consequences, which is enhanced by the features of youth development, including impulsivity, curiosity, the exploration of identity, and peer acceptance. Mainly discussed is routine risky internet use among young people, identified as viewing/exposure to unwarranted materials (e.g., violence, pornography, or pro-anoxia websites); cyberbullying (victim, perpetrator, or bystander) [
11]; infringement of privacy such as the publication of personal information or passcodes; excessive or loss of control on the use of more and more websites or compulsive use more often associated with gaming, social media, or streaming [
12,
13]; meeting and developing relations with questionable people; sexting and sharing explicit images; involvement in offending behaviors like hacking or piracy [
14]; and so on. This behavior involves a large scale of digital skills, which does not necessarily mean it is intentional; rather, it is usually accidental due to a lack of awareness or control. In our opinion, digital skills and internet usage are employment advantages that factors at the individual, familial, and environmental levels can influence. Therefore, they are essential for prevention and education at various levels (e.g., in schools, families, and policy).
This system’s framing is particularly relevant given the multi-layered nature of digital exclusion, which spans individual, institutional, and structural levels. Influences such as digital skill proficiency, exposure to online risks, access to technology, and socio-economic constraints operate not in isolation but in dynamic interaction. By adopting a systems lens, this study recognizes that small changes in one part of the system (e.g., improving digital skills) can have amplified effects across other components (e.g., employment outcomes or social participation). This approach moves beyond reductionist views and positions digital exclusion as an emergent property of a broader socio-technical ecosystem, shaped by feedback loops, path dependencies, and uneven regional development.
3. Systemic Analytical Framework and Methodology
This study employs a multi-method approach grounded in systems thinking, integrating statistical and spatial analysis to investigate how interconnected digital dimensions affect NEET vulnerability. The methodology is designed to uncover and model the systemic relationships among the variables that represent distinct yet interdependent components of the digital exclusion system.
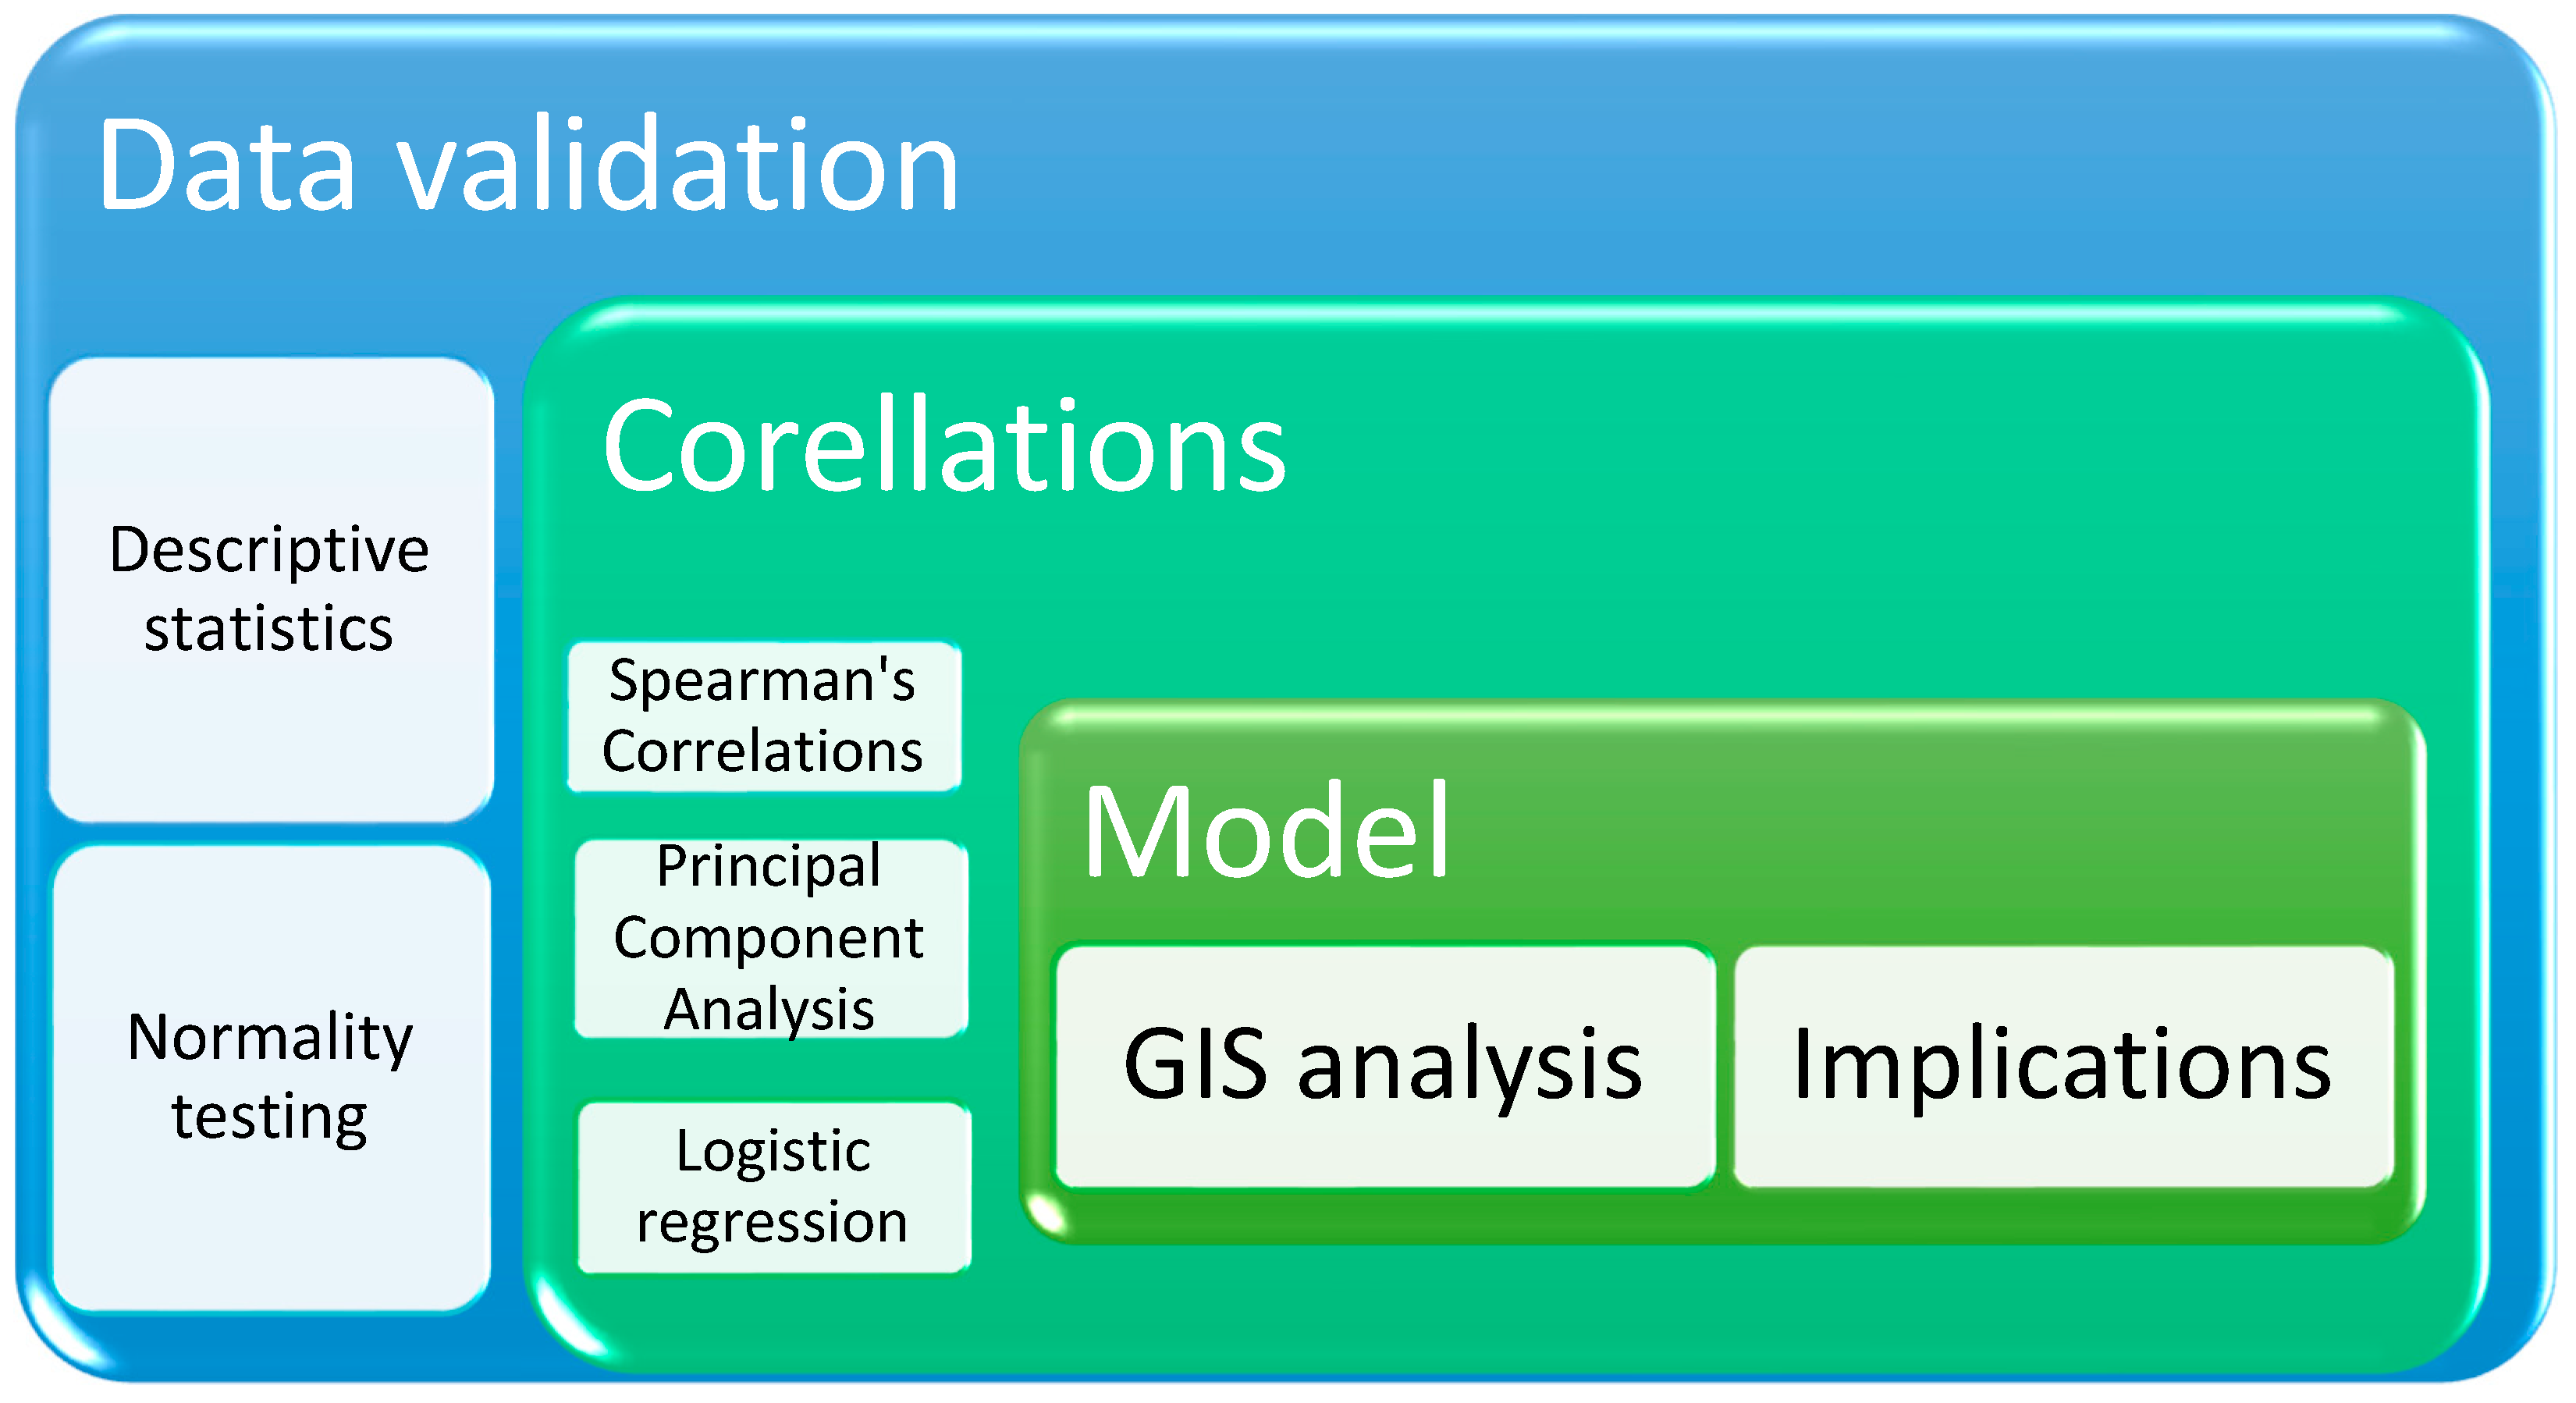
The analysis follows a structured flow, combining statistical methods and spatial visualization techniques to understand the relationships between digital skills, internet use, and NEET status in Europe. The study is carried out in several stages: (1) descriptive statistics—an initial exploration of variables and an analysis of their distribution; (2) normality testing—checking the distribution of data to select appropriate methods (parametric or non-parametric); (3) Spearman’s correlations—identifying raw relationships between digital variables and NEET rate; (4) Principal Component Analysis (PCA)—reducing the dimensionality of data and extracting latent factors; (5) logistic regression—estimating the impact of digital factors on the probability of becoming NEET; (6) GIS analysis—the spatial visualization of results to identify regional patterns and digital disparities; (7) identifying implications—interpreting the results and formulating recommendations for public policies (
Figure 1).
Through this integrated approach, this study offers a quantitative and spatial perspective on the socio-digital exclusion of young people, thereby contributing to the development of more effective intervention strategies. Moreover, the model highlighted the need for an integrated approach, offering insights into the alienation, social exclusion, and psychological issues, as well as the ethics and integrity in promoting the use of the internet.
This study analyzes the relationship between risky internet use and the likelihood of a young person becoming NEET. The data comes from Eurostat and covers 2000–2024, including 24 variables grouped into eight dimensions, for 28 countries.
For the present analysis, we have opted for the standard definition used at the European level, which defines the NEET group as young people aged between 15 and 24, according to the Eurostat methodology. This allows for comparability between countries and highlights structural differences regarding the inclusion of young people in the labor market and the education system. The formula for calculating the NEET rate is defined as follows:
where
NEP = not employed persons;
NoFE = not included in formal education or training;
NoNFE = not included in non-formal education or training;
Y15-24 = total population aged 15–24.
3.1. Variables and Data Sources
Although Eurostat provides data on a longitudinal level for the period 2000–2024, we focus on the time frame 2020–2023 for our analysis. The choice was based on the availability of harmonized and coherent indicators in all 28 European countries that were considered in this study. The country year is the unit of analysis, and all the data available are secondary, aggregated indicators taken from Eurostat and the Digital Economy and Society Index (DESI). We do not apply data at the individual level in countries because, regarding this list of variables, such microdata is not publicly available in a comparable form.
To enhance transparency, we also mention that the data are country-level statistics, which include digital behavior and the occurrence of NEET. They are the variables that involve daily internet use, activity on social media and messaging systems, knowledge about personal data protection, and digital skills levels. Unit measurement and code are defined formally, based on Eurostat coding lists, and Eurostat metadata standards [
58] guarantee definition and temporal consistency.
Following suggestions about multivariate quantitative research [
59], the general descriptive statistics of each variable are presented in
Section 3.2 and in
Appendix A as the mean, standard deviation, minimum, and maximum values. This improves replicability and provides an empirical perspective based on the ground empirical aspect of digital inequality as well as NEET risk distributions in Europe.
This set provides a clear and logical structuring of the variables used to examine the relationship between internet use and the likelihood of being classified as NEET. Their organization facilitates the understanding of the indicators, their temporal distribution, and relevant statistical characteristics.
The detailed description of the variables, specifying the Eurostat codings, labels used, and explanations of the indicators, establishes the conceptual basis of the analysis by presenting the definitions, sources, and codings of the indicators employed. The indicators are grouped according to the dimensions they measure: internet use for socializing (SNET), instant messaging (CHAT), daily internet use (IDay), personal data protection (IMAP), and digital skills (I_DSK2). We should note that YYYY represents the year in question. The data were extracted from the Eurostat [
53] database through the mentioned codes (
Table 1) to provide transparency and theoretical underpinning.
3.2. Descriptive Statistics
To better comprehend the country-level inequities and patterns of distribution, we have included a description of values and statistics in the extended study in
Appendix A. The tables contain detailed pointers of all six dimensions of digital and social exclusion, 28 countries in the European region (NUTS 0 level), and the specifications are for the years 2020–2024. The findings validate and moderate the above observations. An example can be noted as the NEET rates were extremely polarizing since the kurtosis and skewness values were very high, especially in Southeastern Europe. In the meantime, digital behaviors like the use of instant messaging and social networks are highly homogeneous with negatively skewed distributions, meaning almost complete penetration. Very much differently, some indicators touch on digital skills and individual data security, which points to severe dispersion and asymmetry, indicating structural weakness in specific countries. Such a statistical investigation provides the empirical basis of the typologies and models created in the subsequent sections with an overwhelming force, which does not, however, conflict with the logic of the latter. Quite the contrary, it reinforces the case for the use of customized policy reactions towards youth digital exclusion in various national settings.
The NEET rate recorded a steady decrease between 2020 and 2023, with the average national values decreasing from 10.73% in 2020 to 9.45% in 2023, which may suggest improvements in youth employability or participation in education and training. Romania, with a NEET rate of 16.5% in 2023, is among the countries with the highest values, while the Netherlands has the lowest values, recording only 3.3% in the same year. The distribution of the NEET rate is positively skewed, indicating that most countries have lower rates, while a few countries have much higher values.
The use of social networks and instant messaging remains at high levels in all countries but shows a slight decrease in 2024. The average values are high, exceeding 90% for most years. For example, Spain and France have social network usage rates of over 95% in 2023, while Romania and Bulgaria show lower values, around 89%. The distribution of these variables is slightly negatively skewed, suggesting that the use of social networks and instant messaging is almost universal in all the countries analyzed. This phenomenon may indicate a maturation of users or a change in digital consumption patterns.
Daily internet access is high, with an average of over 96% for the entire period analyzed. For example, Finland and Norway reach values of almost 100%, while countries such as Bulgaria or Romania are below the average, but with an increasing trend. The distribution of these data indicates extensive digital adoption, with a slight negative skew.
Personal data protection (IMAP) shows significant variability across countries, with a variation of over 50 percentage points between countries such as Norway (92.59%) and Serbia (34.02%). This may reflect differences in digital education and regulatory policies on cybersecurity. This variable follows a normal distribution, suggesting a relatively balanced adoption of data protection measures.
Digital skills are marked by significant disparities across countries. The average for Low Digital Skills in 2023 is 16.94%, but countries such as Serbia and Turkey exceed 40%, while Finland and the Netherlands have very low values, below 5%. For very limited digital skills (No Digital Skills), the average is 0.98%, but there are countries where this percentage is significantly higher, such as Romania, with almost 5%, while countries such as Denmark, Sweden, and Finland have values close to 0%. The asymmetric distribution of this indicator is relevant for the hypothesis regarding the impact of digital skills on NEET status.
As a conclusion, the descriptive analysis shows important differences between European countries in terms of the risk of digital exclusion and the NEET rate (Apendix A). Northern European countries have high levels of digital literacy and extensive internet use, while Southeastern European countries, such as Romania, Bulgaria, and Turkey, have higher NEET rates and lower digital skills.
3.3. Normality Tests
The distribution of the variables in the analysis was assessed using the Kolmogorov–Smirnov (K-S) and Shapiro–Wilk (S-W) tests, which are commonly used to test the normality of data [
60]. These tests compare the distribution of the sample with the theoretical normal distribution and determine whether the differences are significant.
The interpretation criteria are as follows:
If
p > 0.05, the normality hypothesis is accepted, indicating that the variable follows a normal distribution [
61].
If
p < 0.05, the normality hypothesis is rejected, suggesting that the distribution of the variable is significantly different from the normal one [
62].
The results of the applied normality tests are presented in
Table 2.
According to Pallant [
63], parametric tests such as the
t-test, ANOVA, or Pearson’s correlation are adequate for variables with a normal distribution. For the variables without a normal distribution, non-parametric methods are more appropriate, including the Mann–Whitney U test, the Kruskal–Wallis test, and Spearman’s Rho coefficient for correlations [
63,
64]. In the context of this analysis, Spearman’s Rho is preferred for estimating correlations between risky internet use and the probability of being NEET, given that most of the variables analyzed do not meet the normality assumption [
62]. This methodological approach ensures the robustness of the results and the validity of the inferences formulated in the study.
4. Exploring Correlation Methods
The analysis was performed using a combination of statistical and spatial methods, allowing the identification of relationships between internet use, digital skills, and the risk of being NEET. To explore the relationship between digital skills, internet use, data protection, and the likelihood of being NEET, we applied Spearman’s Rho correlation, Principal Component Analysis, logistic regression, and GIS analysis for the spatial visualization of the results.
4.1. Spearman’s Rho Correlations
In the analysis of the relationship between risky internet use, digital skills, and the likelihood of being NEET, we used Spearman’s Rho correlation coefficient. This non-parametric test is appropriate for data that is not normally distributed, as previously verified by the Kolmogorov–Smirnov and Shapiro–Wilk tests. We also used a two-tailed significance test, which is appropriate when there is no clear hypothesis about the direction of the relationship between the variables [
61].
Spearman’s Rho (ρ) is a non-parametric measure of rank correlation that assesses the strength and direction of the association between two variables. Unlike Pearson’s correlation, which measures linear relationships, Spearman’s Rho evaluates monotonic relationships, meaning that as one variable increases, the other tends to increase or decrease consistently, without requiring a strict linear relationship.
4.2. Principal Component Analysis
PCA is used not only to reduce dimensionality but to identify latent subsystems—clusters of indicators that co-evolve within the broader digital exclusion system. This helps reveal the internal architecture of exclusion risks across EU countries.
PCA is used to identify the latent dimensions of internet use, thereby reducing the dimensionality of the dataset and grouping variables into relevant factors. Promax rotation, an oblique rotation method, is chosen due to its ability to allow for correlation between factors, which is recommended for socio-economic variables [
65].
Data adequacy is tested using the Kaiser–Meyer–Olkin (KMO) test and Bartlett’s test of sphericity (BTS) to determine whether PCA can be effectively applied to reduce the size of the dataset and extract significant factors. According to the literature, PCA is a frequently used technique for identifying latent structures in a large set of variables, facilitating interpretation and reducing redundancy [
61]. The KMO test measures sample adequacy, and Bartlett’s test verifies the existence of significant relationships between variables. If the values of these tests are acceptable, PCA can be used to reduce dimensionality and identify latent components [
62].
If the extraction value is high (close to 1), the variable is well explained by the extracted factors; if it is low (below 0.5), it may require elimination or reconsideration (61). Variance explanation is a crucial step in PCA, as it allows for the determination of the optimal number of components that preserve the relevant information of the dataset [
66]. The goal of the analysis is to identify the minimum number of components that explain a sufficiently large percentage of the total variance. Component selection is based on eigenvalues, the Kaiser criterion (retention of components with eigenvalue > 1), and their interpretability [
61].
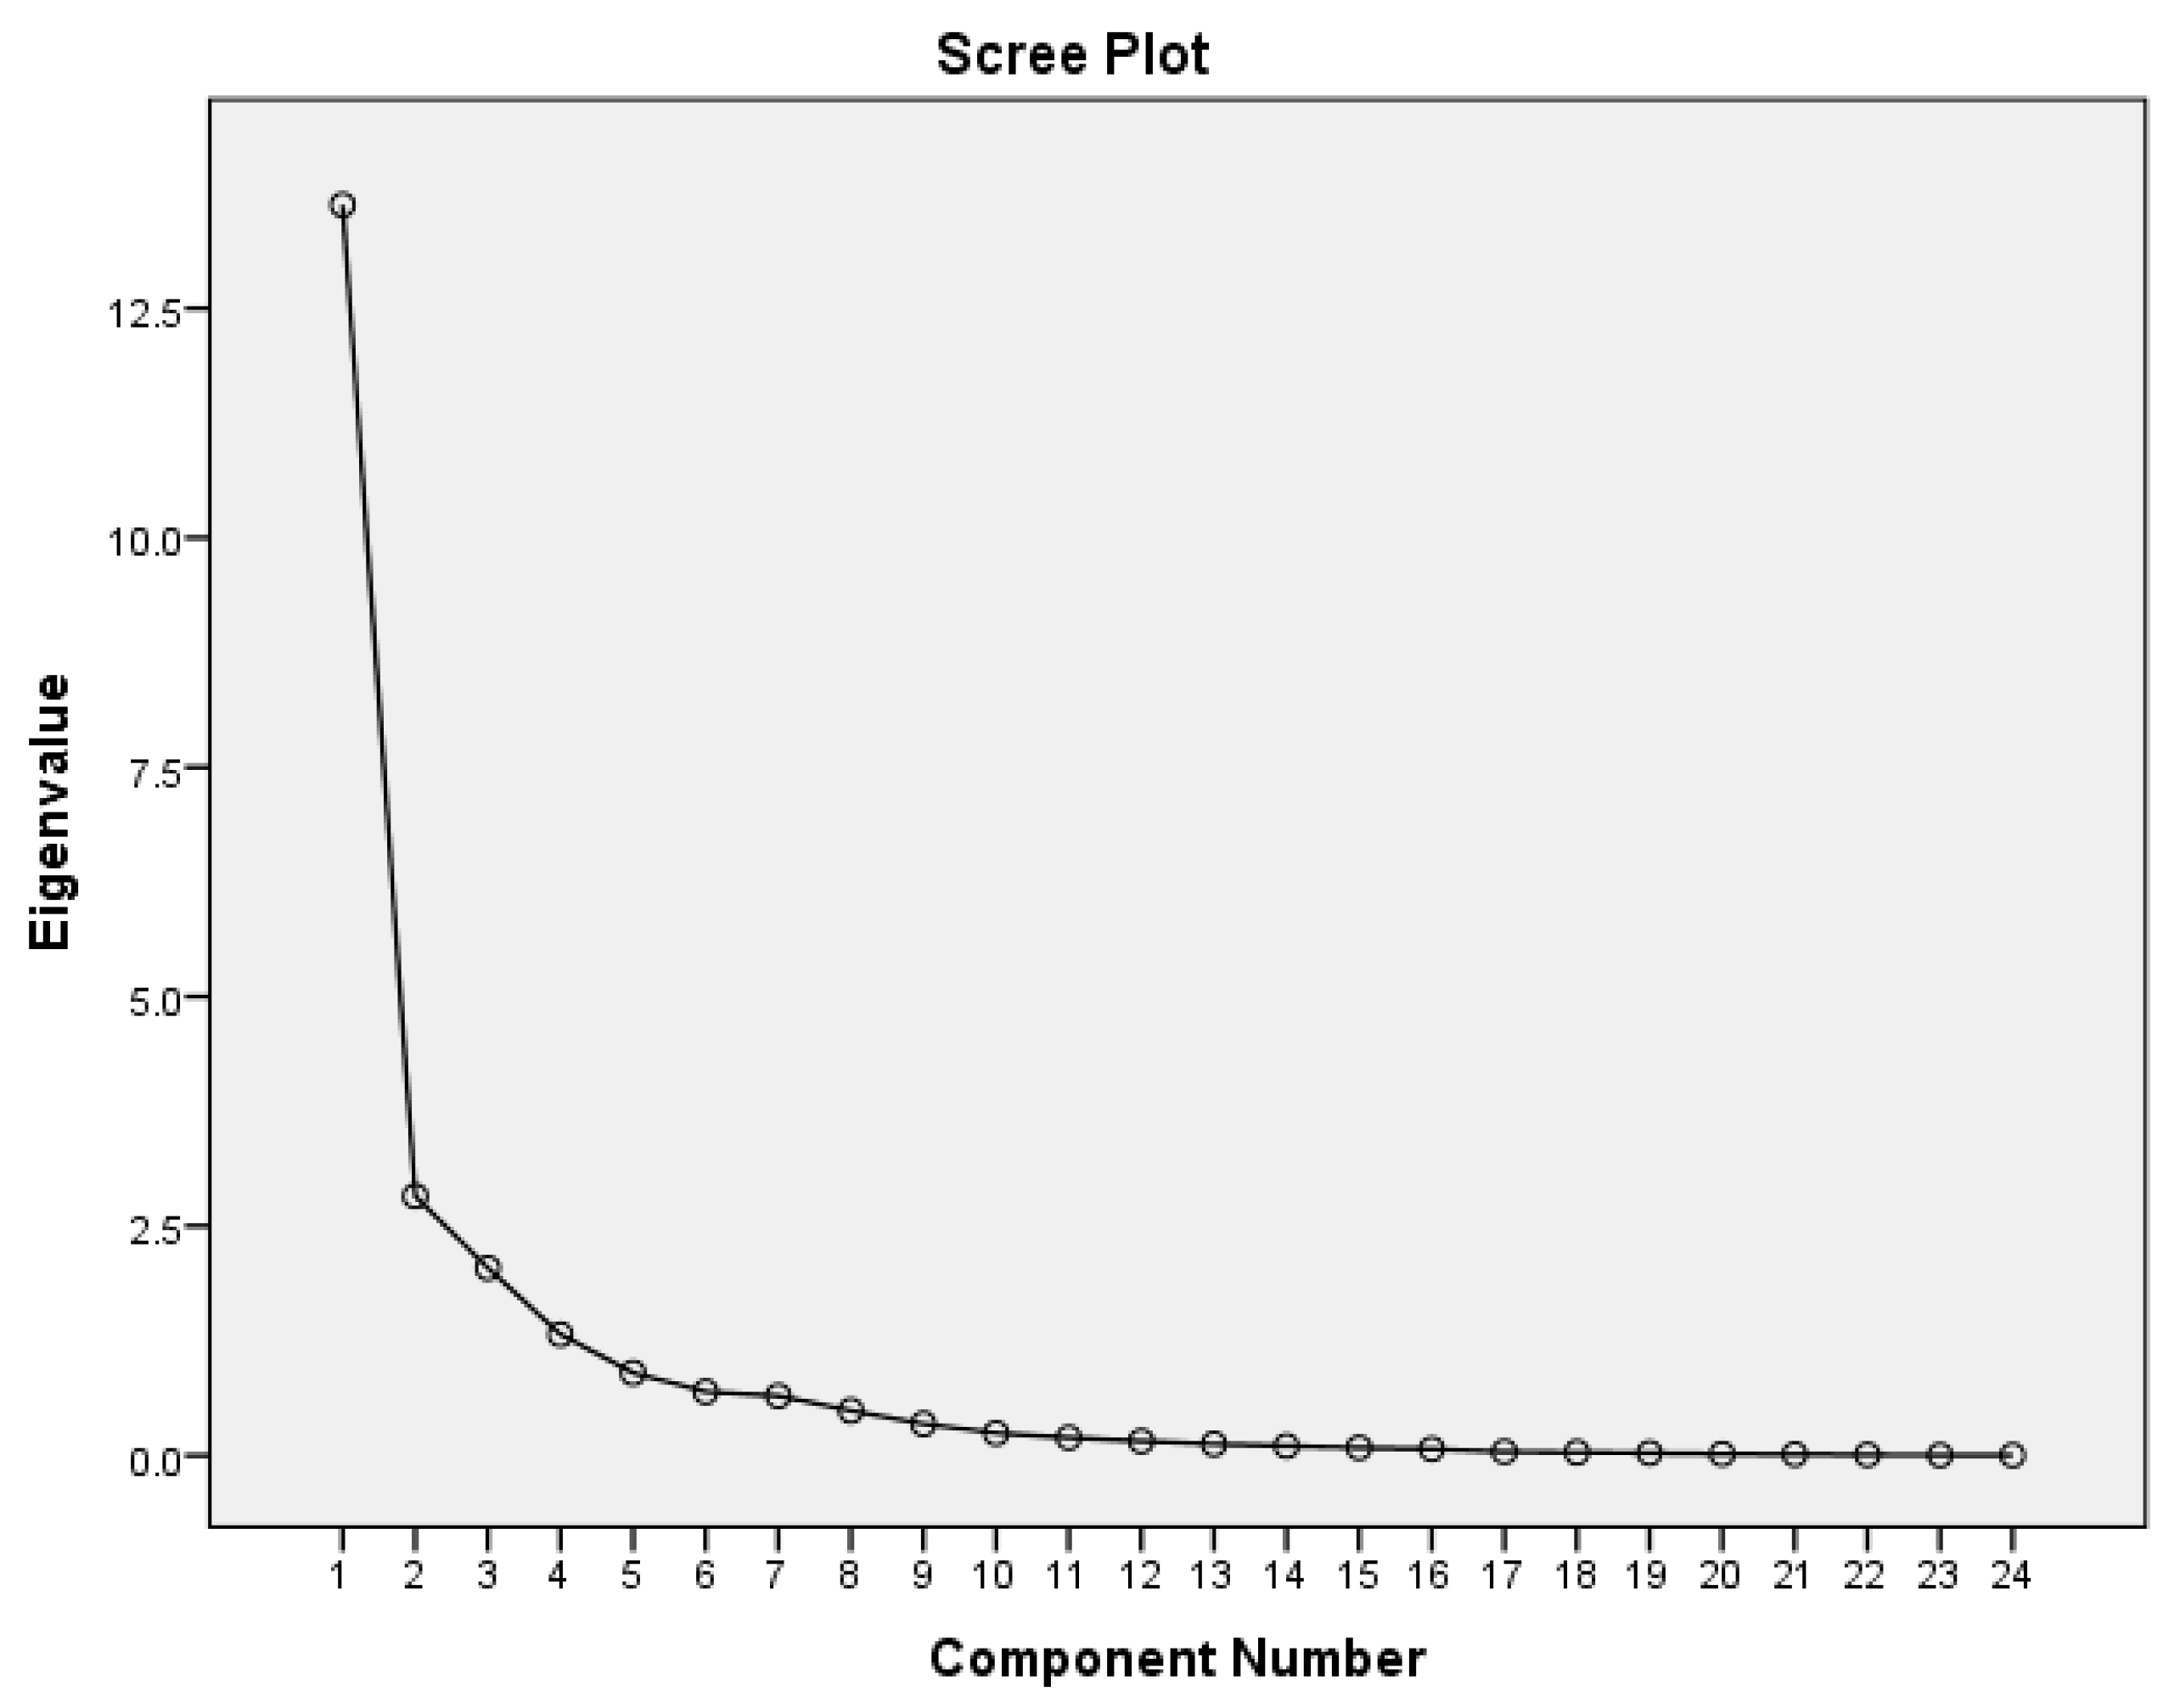
The Scree Plot graph helps determine the optimal number of principal components to retain in the PCA model. The Scree Plot graphically represents the relationship between the number of components and the eigenvalue, providing a visual criterion for the selection of relevant components [
61]. The purpose of using the Scree Plot is to identify the elbow point, where the decrease in eigenvalue becomes insignificant. According to the Kaiser criterion [
67,
68], only components with an eigenvalue > 1 should be retained, and the others are eliminated because their contribution to the total variance is negligible [
66].
Two matrices are constructed for the factors extracted by PCA: the structure matrix and the correlation matrix. Unlike the structure matrix or the component matrix, the correlation matrix reflects the degree of association between the principal components, which is essential for validating the rotation method used [
61]. This analysis aims to determine whether the extracted factors are independent or if there are significant correlations between them. If the correlation values are high, the use of an oblique rotation, such as Promax, which allows for the interdependence of the factors, is justified. Conversely, if the correlations are low, the use of an orthogonal rotation, such as Varimax, would be more appropriate [
66].
Given the partial correlations between extracted components under Promax rotation, we complemented the analysis with an orthogonal rotation technique to test robustness and enhance interpretability.
To strengthen the main model by using Promax-rotated PCA, we also ran a Principal Component Analysis (PCA) that Varimax orthogonally rotated. The purpose of this step was to determine the independence and clarity of interpretations of the retained components.
The four rotated solutions established the existence of four conceptually homogeneous dimensions, which collectively accounted for 82.5 percent of the total variance, making it equivalent to the criterion (eigenvalue > 1) of Kaiser. The rotated component matrix (provided in
Appendix B) separates two important behavioral domains into daily internet use, social networks, instant messaging, and digital skills, and strengthens the internal structure of the conceptual model. By normalizing the loadings on the components, also by minimizing cross-loadings, the Varimax rotation made the factors more empirically transparent. This further reinforces the methodological strength of the factor extraction method, demonstrating that not only the oblique method, but also the orthogonal procedure, can yield stable and interpretable structures.
Such a complementary analysis will help address potential issues regarding factor independence and confirm the usefulness of the dimensionality reduction method employed in the current research [
69].
4.3. Logistic Regresion
As this study uses aggregated country-level data rather than individual-level records, logistic regression was applied using the proportion of NEETs in each country year as the dependent variable, not a binary indicator. The model was implemented as a Generalized Linear Model (GLM) with a binomial family and logit link, consistent with the approaches used in ecological and cross-national research [
70,
71].
Logistic regression is employed to quantify the systemic influence of identified digital subsystems on the likelihood of NEET status, capturing how multiple, coexisting factors jointly affect the outcomes within the socio-technical system of youth inclusion.
Logistic regression is applied to estimate the probability of being NEET, using the factors extracted from the PCA as independent variables. This method is suitable for modeling the relationships between categorical variables and continuous predictors, allowing a better understanding of the risks of socio-economic exclusion. To prevent multicollinearity problems, the model is validated using the Nagelkerke R2 and the Variance Inflation Factor (VIF) collinearity test.
Logistic regression analysis is a statistical method for examining the relationship between a binary dependent variable and one or more independent variables. This technique estimates the probability of an event occurring depending on the values of the explanatory variables.
Checking the data preprocessing is a step before interpreting the results, as a large number of excluded cases could affect the validity of the model [
72]. The purpose of this analysis is to determine the total number of cases available for the logistic model and to check for missing data that could influence the validity of the results. Ensuring data integrity helps to obtain robust estimates and avoid systematic errors in the interpretation of regression coefficients [
73,
74].
The block 0 analysis of the logistic regression, which represents the initial model without predictors, is essential to evaluate the performance of the model with only the constant, before including the independent variables [
72].
This determines the classification accuracy of the null model (the model that does not consider any predictors) and checks the importance of the independent variables before including them in the regression. It provides a baseline for evaluating how much the predictors improve the model’s performance [
73,
75].
4.4. GIS Analysis Method
Geographic Information Systems (GIS) are used to spatially visualize the system-level disparities in digital capacity and exclusion risk across European territories. This spatial dimension highlights how regional contexts operate as subsystems with differentiated structural conditions and feedback loops.
Exploratory Spatial Data Analysis (ESDA) is used to identify geographical patterns in the variables under analysis. This includes methods such as choropleth maps, which visualize the distribution of NEET rates and digital skills at the regional level.
ESDA combines visual and statistical techniques to explore spatial data, helping to detect patterns and anomalies in the geographical distribution of the phenomena under study [
76]. This methodological approach allows for a robust integration between statistical and spatial analysis, providing a multidimensional understanding of socio-digital exclusion.
4.5. CHAID Decision Tree Analysis
We used a CHAID (Chi-squared Automatic Interaction Detection) decision tree model to enhance the interpretability and determine nonlinear thresholds in the association between digital autonomy and NEET status. CHAID is a non-parametric technique for segmentation, applicable to the discovery of decision rules in categorical outcomes, as well as the detection of interactions among explanatory variables, without any assumption of linearity or normality [
77,
78]. The calibration of the model was performed with the binary NEET2023 variable status as a dependent variable and explanatory indicators collected during prior PCA and logistic regression procedures.
The project was analyzed using CHAID and IMAP2020, which is the percentage of persons able to control access to their personal information, and it was found to be the most relevant division. It was revealed that the risk of falling into NEET status increased by almost 20 times (76.5 percent, compared with 3.9 percent) among those countries whose indicator was exactly or less than the suggested threshold (67.13 percent), whereas the risk decreased by more than 80 times (only 9.1 percent, compared with 795.8 percent) in countries with a higher indicator. This observation validates the protective dimensions of digital agency and cybersecurity awareness of socio-economic exclusion among young citizens [
79,
80]. There was a statistically significant split as indicated by Bonferonni-adjusted Chi-square = 12.128,
p = 0.004 and a global classification accuracy of 82.1% (
Appendix C, which shows a complete overview of node splits, classification tables, and model accuracy measures).
The decision tree, therefore, supplements the analytic chain and the introduction of comprehensible thresholds, risk divisions, and an easier policy making outlook. While we use the latent dimensionality reduction in PCA or the probability estimation of logistic regression, the rule structure of CHAID also offers an alternative aspect that targets digital inclusion strategies clearly. In that way, it reinforces the conclusion that digital capability and data governance competency is a significant leverage in inclusive youth policy in a digital society [
81].
While CHAID enhances the interpretability of the NEET model by identifying actionable thresholds and nonlinear interactions, it is not a substitute for more predictive or temporally dynamic approaches. Given the moderate explanatory power of the logistic regression model (Nagelkerke R
2 = 0.339), future extensions of this research should incorporate longitudinal modeling techniques—such as mixed-effects regression—or machine learning methods that can better capture complex interactions and improve classification accuracy [
82,
83]. These approaches offer promising avenues for refining risk prediction and tailoring policy responses across diverse temporal and geographic contexts.
5. Results
We will briefly present the results of the three methods for determining the existence of correlations between the studied variables to emphasize the results of the GIS spatial analysis, which offers a complex picture at the level of European countries.
5.1. Spearman’s Rho
A preliminary analysis of the relationships between variables using the Spearman coefficient indicated that factors related to digital skills and data protection are significantly correlated with the likelihood of being NEET, which justifies their inclusion in the predictive models. The Spearman correlation analysis suggests that a lack of digital skills and risky internet use are significantly correlated with the likelihood of being NEET (p < 0.05). These findings support the use of PCA to reduce dimensionality and select the most important factors for logistic regression.
The use of social media and instant messaging: There is a significant positive correlation between the NEET rate and the use of social media in 2020 (ρ = 0.412,
p = 0.029) and the use of instant messaging in 2021 (ρ = 0.367,
p = 0.042). These results suggest that a higher frequency of use of these platforms could be associated with an increased likelihood of being NEET, supporting the hypothesis that the excessive use of the internet could have negative effects on the employability of young people [
84].
Data protection and NEET: The correlation analysis revealed a negative correlation between data protection and the NEET rate in 2023 (ρ = −0.502,
p = 0.008). This result suggests that young people who are more aware and cautious in managing their personal data are less likely to become NEET [
46].
Digital skills and NEET: The variable “Low Digital Skills” in 2021 had a significant positive correlation with the NEET rate (ρ = 0.478,
p = 0.011), indicating that the lack of basic digital skills increases the risk of exclusion from the labor market and the education system [
85]. Also, “No Digital Skills” in 2023 showed a strong positive correlation with the NEET rate (ρ = 0.536,
p = 0.004), confirming the hypothesis that the total lack of digital skills is a predictor of social exclusion.
These results support the hypothesis that excessive internet use, exposure to digital risks, and a lack of digital skills contribute to an increased likelihood of being NEET. In particular, the lack of digital skills appears to be a strong determining factor, suggesting the need for educational policies that support the development of digital competences among young people.
5.2. PCA and PROMAX Rotation Results
To check whether PCA is appropriate for the dataset, the Kaiser–Meyer–Olkin (KMO) and Bartlett tests were used. The KMO result is 0.674, which suggests an acceptable fit for PCA. This value shows an acceptable level of correlation between variables, according to the methodological standards established in the exploratory factor analysis [
68].
The Bartlett’s test results χ
2 (276) = 880.306,
p < 0.001 confirm the existence of significant correlations between variables and justify the use of PCA. Bartlett’s test confirms that the correlation matrix is not an identity matrix and that there are significant relationships between variables [
86,
87]. Since
p < 0.05, the validity of using PCA for this dataset is confirmed.
The results of the KMO and Bartlett tests support the application of PCA with valid results, allowing the reduction in the dataset size and the extraction of significant factors. Subsequent analysis of the factor loadings will facilitate the identification of latent dimensions that explain the variation in the data.
The PCA results indicate that the first four components together explain 82.55% of the total variance of the dataset. The first principal component (PC1) accounts for 56.78% of the variance, suggesting a dominant factor in structuring the data. The following components (PC2, PC3, and PC4) add 11.77%, 8.51%, and 5.49%, confirming that these four components are sufficient to account for the variability of the dataset.
After PROMAX rotation, the factor loadings are redistributed among the components, which facilitates their interpretation, but the values can no longer be summed directly for the total variance explained. Subsequent components have eigenvalues below 1 and explain less than 5% of the variance of the dataset, indicating that they do not contribute significantly to the model and can be removed from the analysis [
62].
The Scree Plot (
Figure 2) confirms the selection of four components in the PCA model, as they capture the main structure of the data. The choice of this number of factors is supported by both the Kaiser method and the turning point visible in the plot. Retaining more components would lead to overinterpretation, while eliminating important factors could lead to the loss of significant information.
The four variables extracted by the PCA with Promax rotation are as follows:
PC1: Intensive daily use of the internet (IDayYYYY, SNETYYYY).
PC2: Lack of digital skills (I_DSK2_YYYY_X, I_DSK2_YYYY_LM).
PC3: Exposure to risks regarding personal data (IMAPYYYY).
PC4: Excessive use of social media and instant messaging (CHATYYYYY).
The correlation matrix for the extracted values is presented below in
Table 3.
The correlation between C1 and C3 is 0.620, indicating a significant relationship between these factors. Similarly, the correlations between C1 and C2 (0.546) and between C3 and C2 (0.525) are high enough to indicate a relationship between these factors, but not so high as to suggest redundancy between the components [
62]. Moderate correlations between the components suggest that they are not completely independent, but that there is some overlap in the explained variability. This is typical in PCA applied to complex datasets, where latent factors may have common influences on the observed variables.
The matrix of correlations between components confirms that the Promax rotation was an appropriate choice, as it allows the factors to be correlated in a realistic manner, reflecting the latent structure of the dataset. Moderate correlations suggest that each component explains a distinct aspect of the data, but without being completely independent of the others. This result supports the validity of the factor model and provides a solid basis for interpreting the relationships between the original variables and the extracted factors.
5.3. Logistical Regresion
The results indicate that all 28 cases were included in the analysis, with no missing values (missing cases = 0). This means that the logistic model uses 100% of the available observations, which guarantees good representativeness of the data. The absence of excluded cases is a positive indicator since incomplete models or missing values could reduce the precision of the estimates and introduce possible biases into the model [
88]. Summarizing the processing of cases confirms that the logistic model uses the entire dataset without exclusions or missing values. This result suggests that no additional data treatment is necessary before interpreting the model results.
The Hosmer–Lemeshow test suggests that the model fits the data well. The accuracy of the model is moderate (67.9%), but better for class 0 (71.4%) than for class 1 (64.3%). The only variable with a trend towards statistical significance is FAC2_1 (p = 0.084), which may have a negative impact on the probability of being in category 1.
5.4. GIS Analysis
This section analyzes the estimated probabilities (PRE_1), standardized residuals (ZRE_1), and influential values (LEV_1) resulting from the logistic regression model. These values are essential for validating the model and integrating it into GIS analyses, allowing the visualization of the spatial distribution of probabilities and the detection of outliers [
72].
The purpose of this analysis is to verify the accuracy of the logistic model and identify observations that have a significant impact on the results. By examining the estimated probabilities and standardized residuals, we can evaluate the performance of the model and identify areas where predictions are underestimated or overestimated [
73].
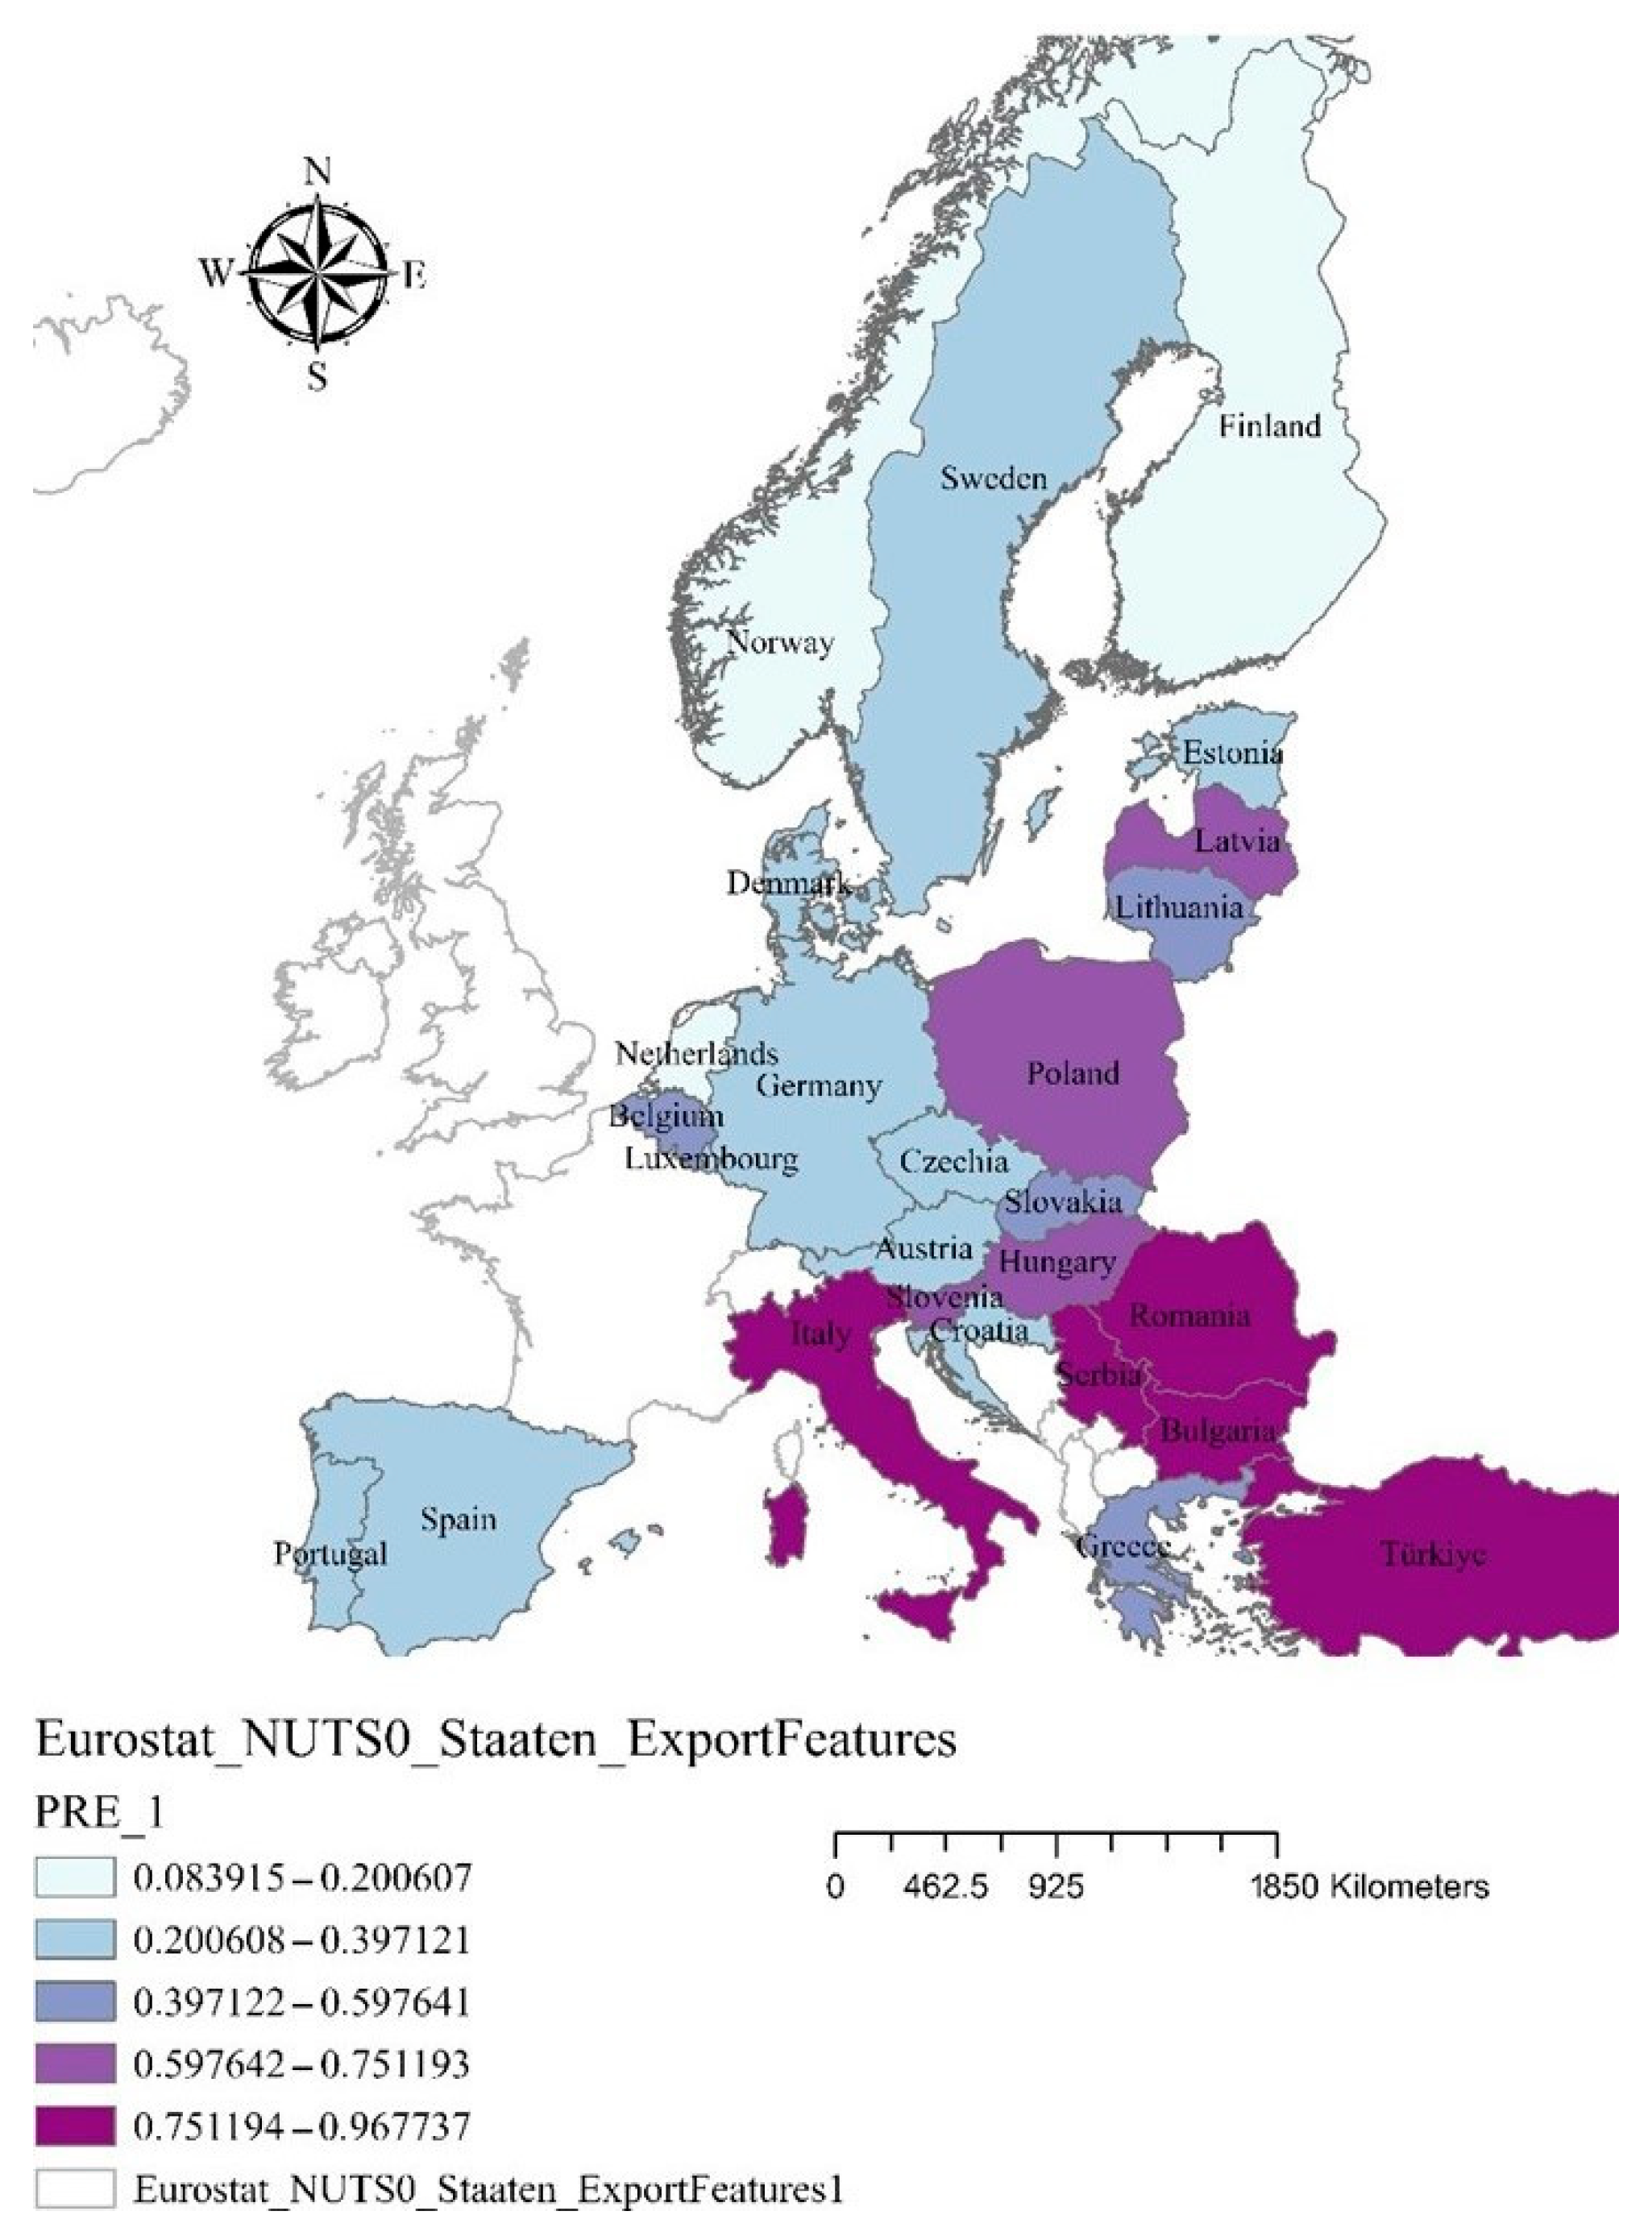
Figure 3 presents the estimated probabilities to be classified as NEET.
The estimated probabilities show the potential to be classified as NEET if the value is “1” and, on the other hand, if the value is “0”. According to the results, the lowest value is 0.0839, reflecting a low probability of being included in the NEET category, and the highest value is 0.9677, which indicates a consistent probability of being classified as NEET.
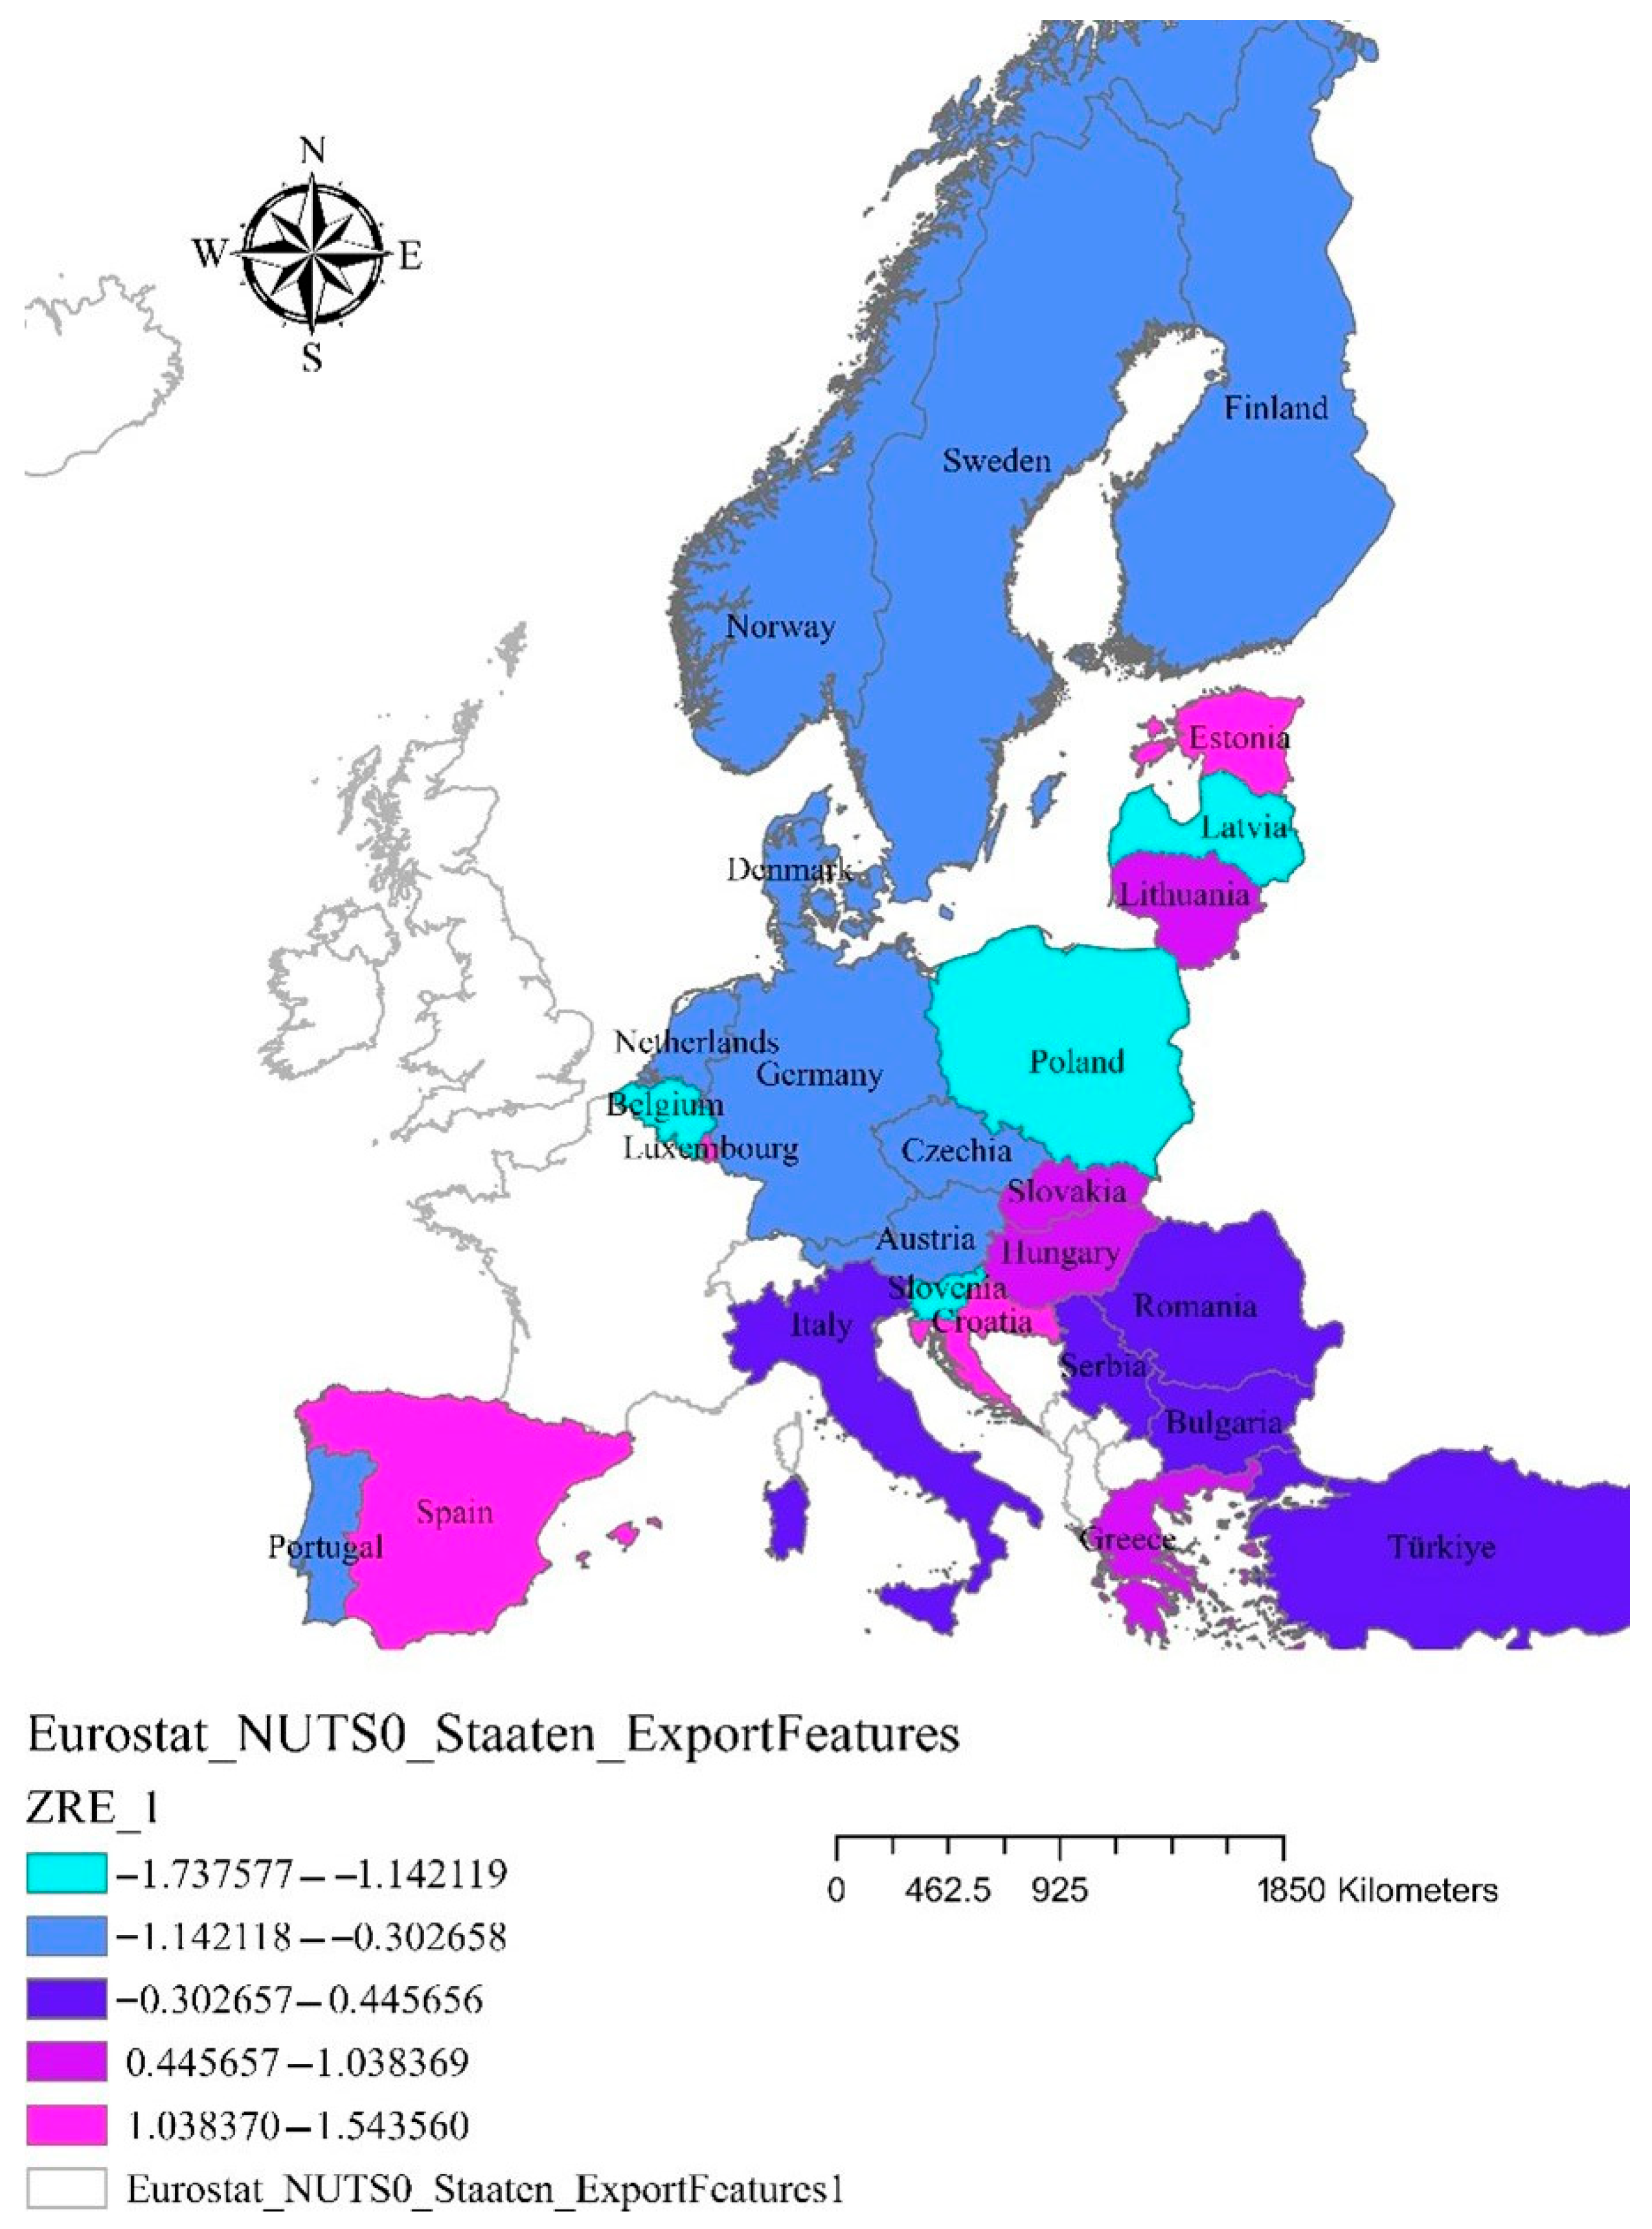
The standardized residual (
Figure 4) values indicate the discrepancies between the observed and predicted values. Large residuals (positive or negative) may suggest outliers or systematic errors in the model.
The positive standardized residuals show that the model underestimated the probability of this observation, while a negative value expresses an overestimation of the probability of this observation. The values for our model are between −1.7375 and 1.5435, which falls well within the acceptable range (−2 to +2) based on ArcGIS standard criteria [
89]. This suggests that the model fits the data well, with no extreme outliers. At the same time, there is no strong spatial autocorrelation in the residuals, meaning that the model does not systematically overestimate or underestimate in specific regions. Moreover, the predictors used appropriately capture the variance in the dependent variable.
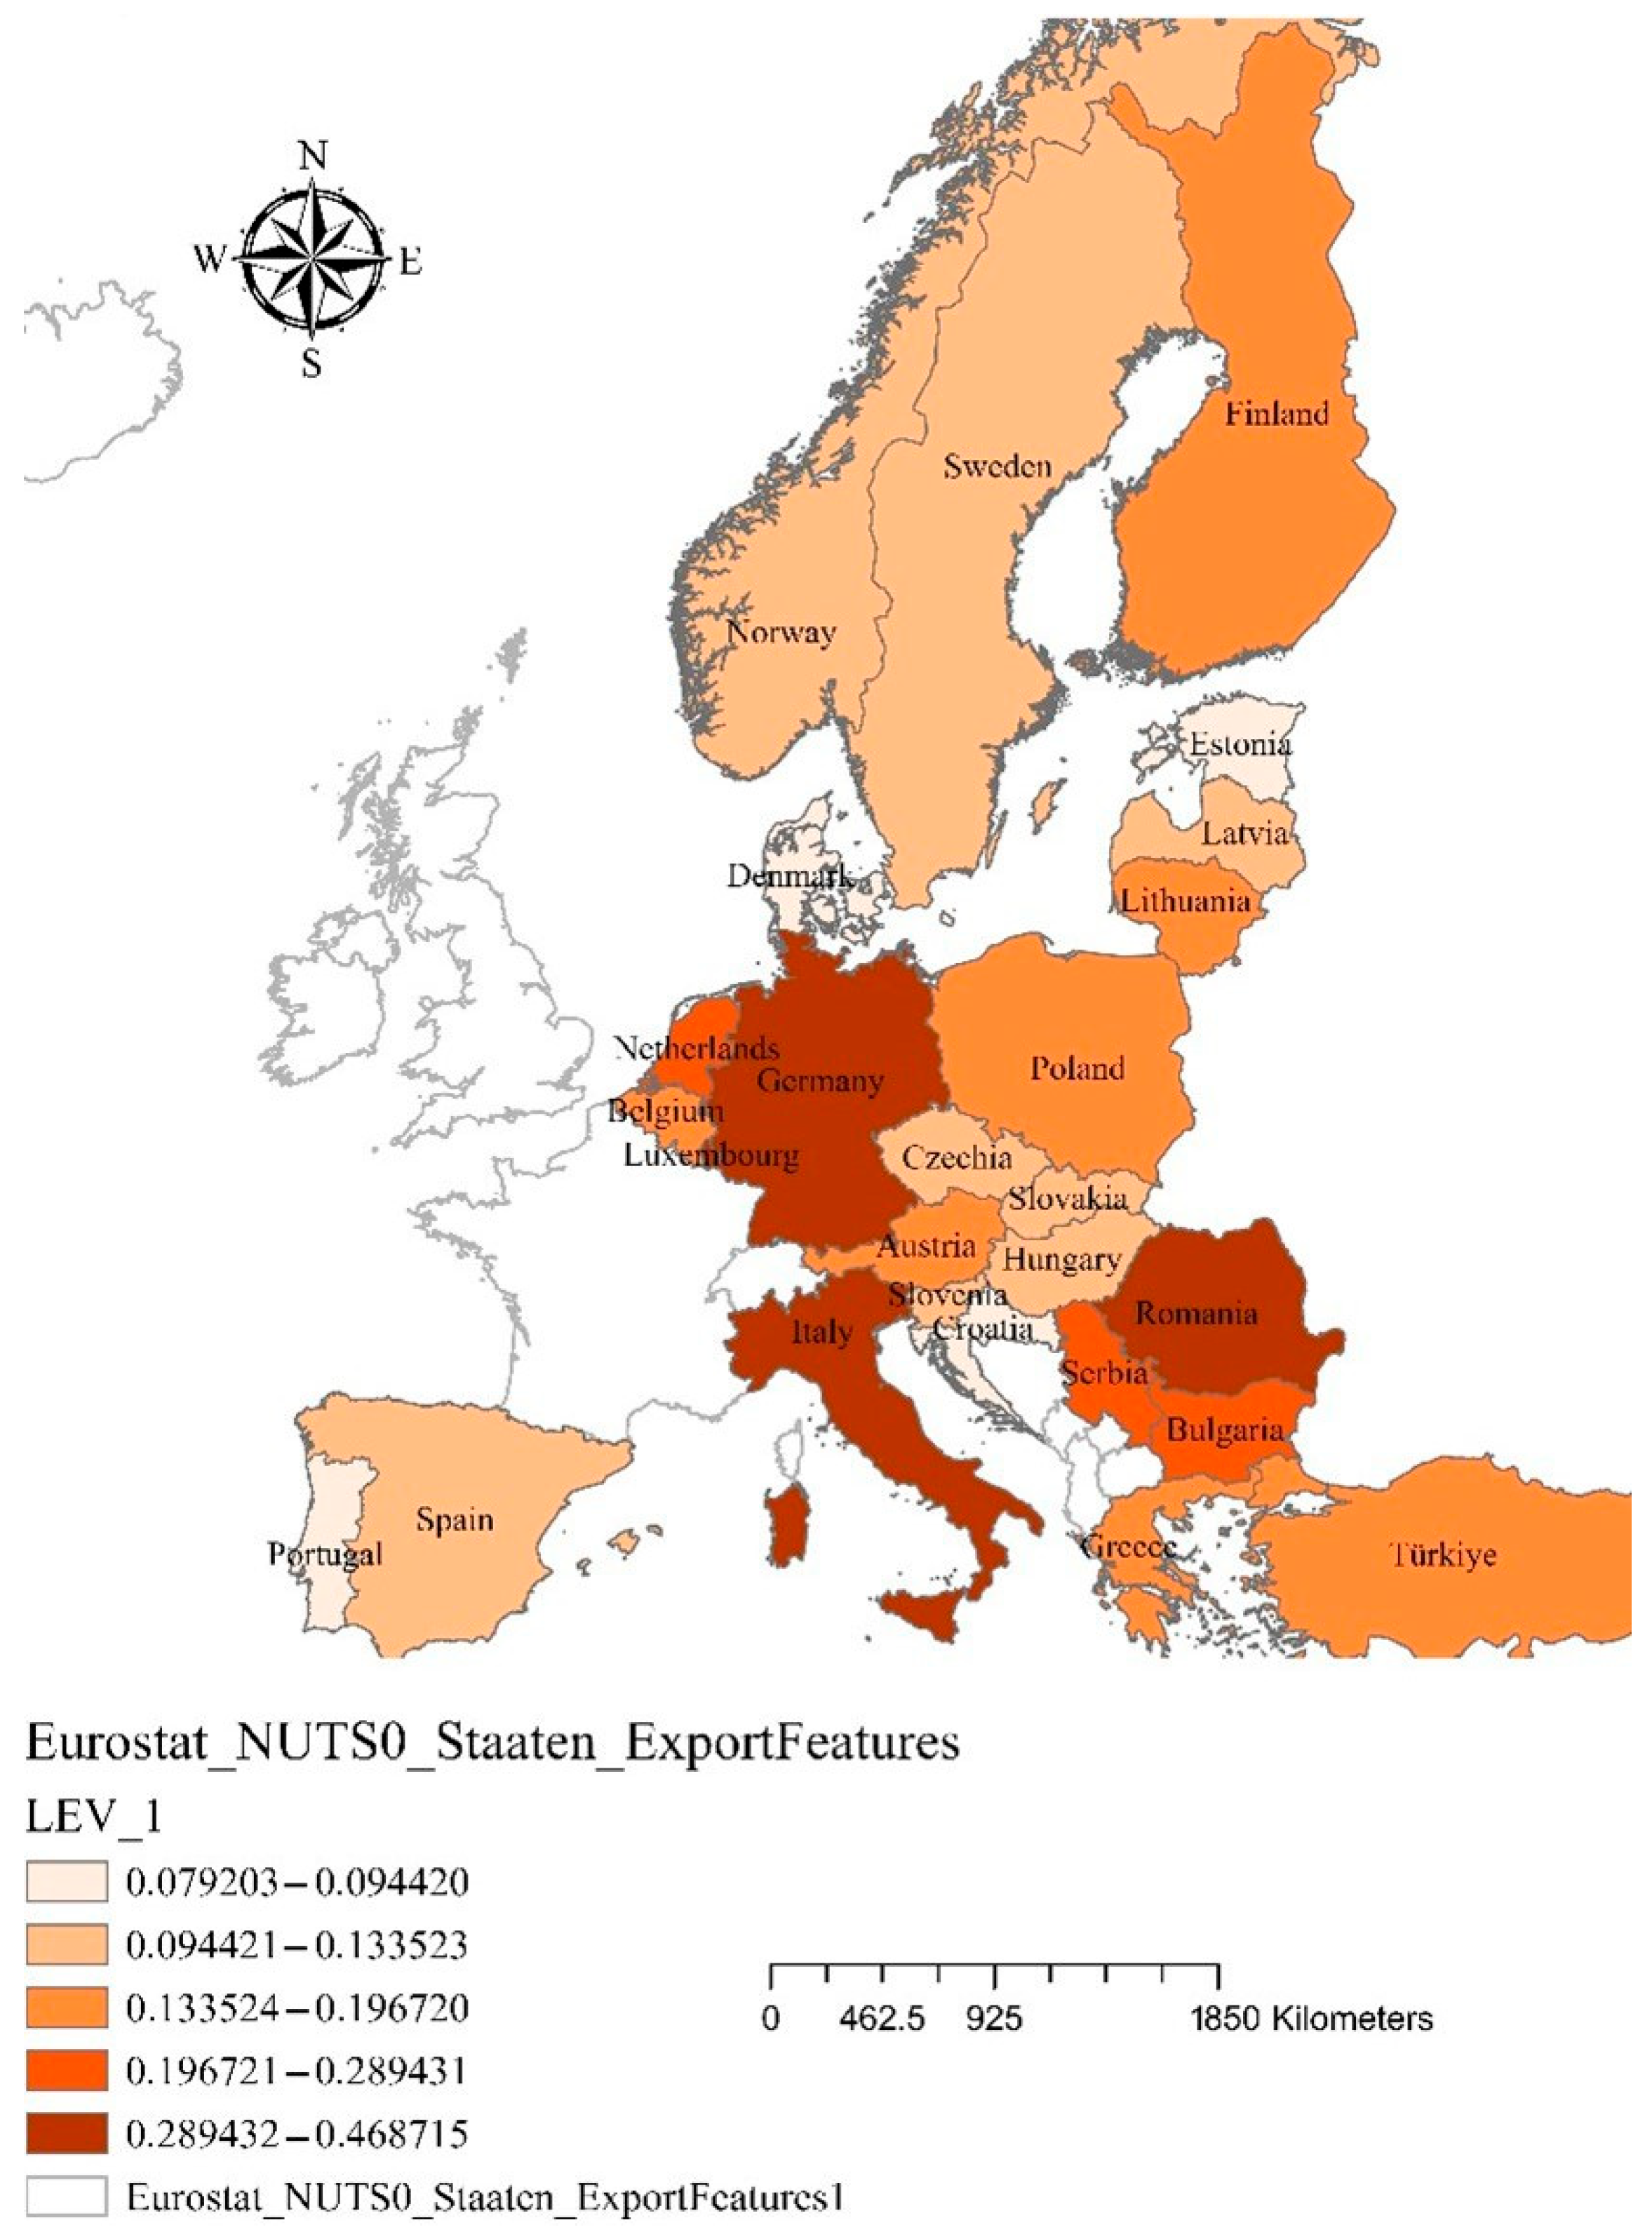
Influential values or leverage values measure how much an observation influences the estimated regression coefficients. A high leverage (>2 × average leverage value) indicates an unusual observation that might significantly affect the model predictions. If the leverage is high but the residuals are small, the point is influential but still fits the model well. The results are presented in
Figure 5.
As can be seen, the leverage values are between 0.0792 and 0.4687, with an average value of 0.3571 (4 variables + 1/28 observation = 0.1785).
The formula for the average leverage value is as follows:
where
Since leverage values above 0.5 or closer to 1 are considered highly influential, the maximum value (0.4687) suggests that no extremely influential points exist, but a few observations might still deserve further inspection. Most data points have reasonable leverage values (0.0792–0.4687). There are no extreme high-leverage points (close to 1), meaning no single observation is distorting the model drastically. A few moderate-to-high leverage points may exist, but they are within an acceptable range, and they should be discussed in relation to the residual values.
5.5. CHAID Decision Tree Results: Objectives, Outputs, and Interpretations
In order to further examine the factors that lead to NEET status, we utilized a CHAID (Chi-squared Automatic Interaction Detector) classification tree analysis via SPSS v30. This approach was selected due to the possibility of handling categorical predictors, as well as exploring complex and nonlinear interrelations among the variables to provide a hierarchical structure. The CHAID algorithm can help us determine the decision rules and hierarchically defined segmentations related to the assumption of being NEET, depending on digital skills, the use of the internet, and data protection practices.
The CHAID findings have been organized into seven major outputs, each representing one stage of the analysis process, as summarized in
Table 4. The outputs are further explained in
Appendix C and allow for validation, supplementing the results of the Spearman correlations, PCA, logistic regressions, and GIS analysis performed in
Section 5.1,
Section 5.2,
Section 5.3 and
Section 5.4.
These findings validate that the inability to possess digital skills and an intensive, yet disorganized, engagement with the internet are the primary factors that lead to NEET risk, which aligns entirely with the results of the prior analytical phases (
Section 5.1,
Section 5.2,
Section 5.3 and
Section 5.4). The decision tree model fills the gap of traditional regression-based analysis because it provides rules with understandable interpretations, which can be converted to intervention practices. CHAID models are uniquely positioned to reveal hierarchical predictors and viable groupings, as demonstrated earlier by [
77] and later echoed by other channels in the sphere of socio-economic profiling [
90,
91].
The CHAID model identified a crucial digital cut point of strong explanatory power regarding NEET vulnerability. In particular, the IMAP2020 variable, reflecting third-level digital proficiency, including the ability to manage and protect personal digital data, proved to be the most dominant predictor in a binary segmentation of countries. The model has recognized a cut point of 67.13 percent and divided the dataset into two clusters. It was observed that countries with a NEET prevalence of 67.13% or less, according to the IMAP2020, still had a very high NEET prevalence of 76.5%, whereas those above this value had a NEET rate of only 9.1%. Such unequivocal differentiation leads to the assumption that digital self-protection sensitization is a determinant in combating youth expulsion from employment, training, or school.
Cluster 1 includes Romania, Bulgaria, Italy, Greece, Spain, Croatia, Hungary, Slovakia, Poland, Portugal, Cyprus, Latvia, Lithuania, Malta, Slovenia, Czechia, and Estonia, which have limited capacities of digital self-control. As compared with the above, Cluster 2 contains Sweden, Finland, Denmark, Netherlands, Germany, Austria, France, Belgium, Ireland, Luxembourg, and Norway, which exceed the IMAP2020 standard [
92].
These results suggest that addressing policy targeting through a decision tree analysis is warranted and support the usefulness of digital autonomy as a strategic proxy for social resilience and labor market integration. The precision of the segmentation also enhances the interpretability of the model and its applicability in developing targeted interventions for digital inclusion [
79,
80,
81].
6. Discussion
The interpretation of the results has been approached with caution, acknowledging the methodological constraints and data limitations highlighted throughout the study. This perspective ensures the robustness and reliability of the conclusions drawn.
The results of this study confirm that digital exclusion among the youth is best understood as the output of an interconnected system involving digital skills, behavioral risks, and socio-economic structures. Rather than treating variables as isolated predictors, the analysis models their interaction as part of a dynamic system shaping NEET vulnerability across regions. This systems-level perspective aligns with prior work emphasizing the importance of feedback loops, structural inequalities, and policy alignment in managing digital transformation outcomes [
93,
94,
95,
96,
97]. This study confirms that a lack of digital skills and a lack of awareness of online risks contribute to the socio-economic vulnerability of young people. The results indicate a significant negative correlation between the degree of protection of personal data and the likelihood of being NEET (ρ = −0.502,
p = 0.008), suggesting that young people who adopt digital security practices are less at risk of socio-economic exclusion.
This result is consistent with previous studies [
45,
49], which highlight that digital literacy and data protection are critical factors for active participation in education and the labor market. On the other hand, daily internet use and instant messaging were not significantly correlated with NEET status, suggesting that the mere use of technology is insufficient to prevent digital and professional exclusion.
The results also support the idea that digital exclusion is not only a technological problem but also an ethical and social one. This confirms the studies of Van Deursen & Helsper [
79], which show that a lack of digital education can increase young people’s exposure to manipulation, online fraud, and corrupt practices.
Developing educational policies that are not limited to increasing access to technology but also emphasize ethical digital education, cybersecurity, and the development of essential digital skills can be recommended. In addition, supporting public initiatives that promote digital security and online integrity can significantly contribute to reducing the risk of NEET and increasing educational and professional inclusion.
From a theoretical standpoint, this study contributes to the systems literature by operationalizing digital exclusion as a multi-level, emergent system. The use of PCA allows for the identification of latent subsystems (e.g., digital skills clusters, risky online behavior patterns), while logistic regression quantifies their combined influence on system outcomes. Spatial mapping further contextualizes these dynamics, revealing how structural conditions (e.g., regional economic development, access to infrastructure) interact with individual-level variables to shape systemic risk.
Practically, the framing of this system offers a diagnostic tool for policymakers. Rather than focusing on single indicators or interventions, the findings suggest that targeted improvements across key subsystems—such as digital literacy education, online safety programs, and broadband access—can shift system-level outcomes. The ability to identify high-risk regional configurations through spatial analysis also supports the more efficient allocation of policy resources, especially within multi-level governance frameworks like the EU.
6.1. Strengths and Limitations of the Logistic Regression Model
While this study offers a systems-based approach to understanding youth digital exclusion in the EU, several limitations should be acknowledged.
Firstly, the analysis is constrained by the granularity and completeness of available data. While Eurostat provides harmonized indicators, some variables—such as digital skills or risk behaviors—are only available at a national (NUTS0) level and may obscure important intra-national differences. This limits the resolution of the system’s spatial dynamics.
Secondly, the logistic regression model is static and based on cross-sectional data. While it reveals relationships between digital subsystems and NEET probability, it does not capture the temporal feedback, delays, or nonlinear shifts often present in complex systems. Future work should consider longitudinal datasets or system dynamics modeling to explore time-sensitive causal pathways and interdependencies.
However, the fact that there are various annual observations of each country between 2020 and 2023 in the dataset gives the possibility of panelizing it. Although we do not apply panel data modeling to our data analysis, in the future, a panel data modeling approach based on econometric methods like fixed- or random-effect modeling may be used to analyze lagging outcomes, feedback effects, and policy change. Such strategies would help achieve a superior understanding of how digital exclusion changes with time and what structural predisposition it has, enhancing the existing cross-sectional knowledge [
98,
99].
Thirdly, the system boundaries defined in this study are necessarily simplified. The components analyzed—digital skills, behavioral risks, and socio-economic access—represent only part of a wider system that also includes education policy, family structures, labor market demand, and institutional trust. Including these would require a more expansive, possibly multi-level modeling framework.
Fourthly, while PCA is useful for identifying latent subsystems, it assumes linear relationships and orthogonality, which may not fully reflect the real-world interconnections of system components. Although the Principal Component Analysis (PCA) was useful in reducing dimensionality and identifying the main digital components, it relies on linear assumptions that may not fully capture the complexity of digital behavior. To address this, future work will explore alternative approaches—such as the clustering techniques available in ArcGIS Pro—that are more suitable for detecting nonlinear patterns and territorial groupings. Alternative dimensionality reduction methods, such as t-SNE or nonlinear manifold learning, could provide complementary insights.
Finally, although spatial analysis adds contextual richness, GIS-based methods are descriptive and do not account for spatial autocorrelation or diffusion effects. More advanced spatial econometrics or agent-based modeling could further enhance the systemic understanding of digital exclusion patterns.
The model has a moderate R2 (Nagelkerke R2 = 0.339), indicating that it explains a significant (but not a majority) portion of the variation in the dependent variable. The Hosmer–Lemeshow test (p = 0.366) shows a good fit between the model predictions and the observed data. It correctly classifies 67.9% of the cases, which means that it is better than a completely random model (50%). FAC2_1 is almost significant (p = 0.084), suggesting a possible effect, but which should be verified with a larger sample.
The model’s limitations stem from its overall significance, which is marginal (p = 0.084), indicating that the predictors do not significantly improve prediction compared with a model without variables. The variables included are not significant enough—none have a p < 0.05, which weakens the power of the model. The confidence intervals for Exp(B) are wide, suggesting high uncertainty in the effect estimates. The accuracy of the model is moderate—67.9% is not bad, but not very impressive, especially since the performance in category 1 (64.3%) is weaker.
Although the current analysis employs a cross-sectional logistic regression model based on PCA-derived factors, future research should consider implementing longitudinal panel models, such as Linear Mixed-Effects Regression, to better capture temporal dynamics and country-level heterogeneity. This extension would enhance the predictive accuracy and allow for more robust estimations of the systemic impact of digital variables on NEET vulnerability.
The research on the factors influencing NEET status has used various statistical and econometric methods to explain variations in this phenomenon. Our study applied logistic regression, supported by Principal Component Analysis (PCA) with Promax rotation, to examine the impact of digital skills and risky internet use on the probability of becoming NEET. Compared with other approaches in the literature, our methodology makes an important contribution by integrating GIS spatial analysis and using a multidimensional perspective on digital exclusion.
Most studies on NEET status use binary logistic regression or probit models to estimate risk factors. For example, Filandri et al. [
51] analyzed data from several European countries and demonstrated that factors such as educational level and economic background have a significant impact on the probability of being NEET. Our study partially confirms these findings, showing that a lack of digital skills is a significant predictor of socio-economic exclusion. The study by Redmond, P., & McFadden, C. [
52] highlights that educational level is the strongest determinant of NEET risk, and digital skills are rarely integrated into explanatory models. Our results complement this framework by introducing a digital factor, which specifically explains how digital security and personal data protection influence trust in using the internet for education and employment.
An emerging trend in recent research is the use of machine learning algorithms, such as Random Forest or Support Vector Machines (SVMs), to enhance the accuracy of NEET risk predictions [
100,
101]. These models have the advantage of capturing the complex interactions between variables and reducing the impact of classical statistical assumptions. In comparison, our logistic model has the advantage of interpretability, allowing for the clear identification of variables with significant influence. However, its accuracy (67.9%) is inferior to machine learning-based models, which have achieved accuracies of over 80% in some studies [
102]. A future direction could be to combine logistic regression with machine learning methods to optimize the classification of individuals into the NEET group.
The dimension of digital ethics and privacy is insufficiently explored in existing models. The study by Livingstone & Helsper [
45] indicates that young people who show a greater awareness of digital risks are more likely to use the internet productively. Our results support this hypothesis, demonstrating that digital security management (e.g., protecting personal data, avoiding online tracking) is negatively correlated with NEET status (ρ = −0.502,
p = 0.008).
Furthermore, Helsper [
103] emphasizes that digital exclusion is not only a technological problem but also an ethical and socio-cultural one. Thus, the integration of variables regarding risky internet use and privacy brings added value in explaining young people’s digital vulnerabilities.
GIS integration highlighted clear territorial disparities in digital skills and NEET rates. The choropleth maps confirmed that regions with limited digital access also have high NEET rates, suggesting that interventions need to be adapted to the local context. This approach provides a valuable tool for public policies, allowing resources to be targeted to regions at the highest risk of digital exclusion.
A key limitation of this study is the use of national-level (NUTS0) data, which, although harmonized and suitable for cross-country comparisons, may mask significant intra-national disparities. The sub-national variation in NEET prevalence and digital exclusion is likely to be substantial, especially in countries with pronounced regional inequalities. While the current approach enables a systems-level comparison across EU Member States, future research will aim to incorporate more granular data—at the NUTS2 or NUTS3 levels—where available, to improve spatial precision and inform localized policy responses. Eurostat’s Labour Force Survey and regional indicators related to youth inactivity, digital skills, and broadband access offer a promising basis for such analysis [
104].
Besides the problem of data granularity, there is another limitation of space which deals with the non-existence of formal tests regarding spatial dependence. We have not formally tested to see whether spatial autocorrelation or spatial dependence influences are identified in this study. Now that visualization with the use of GIS tools brought to light the regional differences in NEET levels and digital abilities, we cannot ignore that none of the methods involving Moran I, spatial lag models, or Geographically Weighted Regression (GWR) were used because of the national level of data aggregation (NUTS0). Follow-up studies are to be sought to apply spatial econometrics to more detailed data on NEET (e.g., NUTS 2 or NUTS 3) with the occurrence of localized modeling of spatial variation and dependency in the incidences of youth exclusion patterns [
105,
106,
107].
6.2. Practical Implications for Policy and Intervention
The results of the current analysis suggest some tangible policy directions for minimizing the risk of NEET through digital integration. The first is that the negative correlation between digital skills and the NEET rate is rather significant, which highlights the importance of improving national digital education efforts. Such initiatives are especially designed to include vulnerable youngsters, such as young dropouts, as well as those living in socio-economically underprivileged areas, and encompass not only entry-level but also mid-level expertise in ICT [
108,
109].
Second, the fact that the high-frequency utilization of social platforms is linked to NEET status highlights the importance of introducing the concept of cyber safety and digital wellness in schools and other youth educational outreach initiatives. Digital resilience could be enhanced by awareness campaigns dealing with such issues as online misinformation, addictive use patterns, and data protection [
54,
110].
Third, the spatial-level discrepancy in NEET rates implies that spatially based interventions, including mobile digital literacy units, subsidized vouchers for ICT training, and targeted NEET outreach teams, deserve priority. To align with the EU-wide goals of digital and social cohesion, these endeavors must be harmonized with both the European Youth Guarantee and the Digital Compass 2030 strategy [
81].
All these recommendations together advocate a systemic, targeted approach to the idea of digital inclusion and youth engagement that goes beyond infrastructure and access, to capabilities, ethics, and digital agency.
7. Conclusions
The data analysis confirmed that low digital skills are the main factor contributing to the likelihood of a young person being classified as NEET, supporting hypothesis H2. The results indicate significant differences between regions, suggesting that digital vulnerability varies according to socio-economic context. A lack of digital skills significantly increases the risk of being NEET, which is more pronounced in regions with reduced access to educational resources and economic opportunities.
Hypothesis H1 is partially confirmed: the excessive use of the internet and social networks is not a direct predictor of NEET status but may have an indirect effect by reducing the time allocated to educational activities or by affecting the cognitive skills necessary for insertion into the labor market. Excessive internet use does not have a direct impact on the likelihood of being NEET but may contribute indirectly by decreasing employability or negatively influencing educational processes. This confirms the other studies that are highlighting the benefits of digital skills and the threats as well [
111,
112].
Regarding hypothesis H3, exposure to the risks regarding the protection of personal data does not directly influence the likelihood of being NEET, but the identified correlations suggest that a lack of knowledge about online security may be associated with low digital skills, which, in turn, contributes to socio-economic exclusion. Exposure to data protection risks does not significantly influence NEET status, although it is correlated with low digital skills, which may have an indirect impact on socio-economic exclusion.
Hypothesis H4 is partially confirmed, as digital factors (including digital skills, internet use, and data protection) explain a significant part of the variation in the NEET rate, but not uniformly across all categories of young people and regions. The use of GIS revealed clear regional patterns, indicating significant digital and economic disparities between European countries. According to the GIS analysis, digital factors explain part of the variation in the NEET rate, but their impact is dependent on the socio-economic context and regional differences.
Several analytical levels indicate that hypothesis H4, which deals with the system’s explanatory strength of digital factors by the NEET status, is true. The research, using Principal Component Analysis (PCA) and logistic regression, says that digital skills and the pattern of use explain a high proportion of NEET prevalence variations. In addition, the CHAID decision tree model provides additional clarification, as it has revealed a critical level at 67.13 percent regarding the IMAP2020 variable, which indicates the proportion of people who can deal with their digital information. Countries above or standing below the threshold form patterns known as high-risk profiles, as they report a NEET prevalence of 76.5%, whereas countries above the threshold report a prevalence of merely 9.1% NEET.
In this binary separation, two territorial groups are created as follows:
Cluster 1 (IMAP2020 ≤ 67.13%): Romania, Bulgaria, Italy, Greece, Spain, Croatia, Hungary, Slovakia, Poland, Portugal, Cyprus, Latvia, Lithuania, Malta, Slovenia, Czechia, and Estonia.
Cluster 2 (IMAP2020 > 67.13%): Sweden, Finland, Denmark, the Netherlands, Germany, Austria, France, Belgium, Ireland, Luxembourg, and Norway.
This finding proves that the level of digital security awareness is not only a technological indicator but a sign of social inclusion [
79,
80,
81]. The interpretability and the actionability of the model are due to its clarity in segmentation in terms of CHAID, and its ability to target policies on the basis of digital thresholds, and profiles of vulnerability.
The GIS-based spatial analysis illustrates how digital exclusion is not just individual, but is also territorial, whereby there are regionalities of low digital capacities and NEET rates. This geographical evidence justifies the argument of tiny-scale interventions and the use of digital education and employability policies [
113,
114].
Thus, the answer to the research question is that low levels of digital skills significantly increase the likelihood of being NEET. In contrast, excessive internet use and exposure to digital risks have an indirect or limited effect on NEET status.
The integration of GIS methods allows the identification of territorial clusters with high NEET rates and low digital skills. The choropleth analysis highlights vulnerable regions, providing a tool for more targeted public policies. For example, the results show that areas with low digital access and low skills are associated with high NEET rates, underscoring the need for tailored local interventions.
Building on this study, several future research directions are proposed.
Firstly, expanding the framework to a longitudinal systems model would allow researchers to track how digital exclusion evolves over time in response to interventions, shocks (e.g., pandemics), or policy shifts. Incorporating feedback loops and time delays could help identify leverage points for systemic change.
Secondly, applying the same systems-based approach at sub-national levels (NUTS2 or NUTS3) would uncover regional disparities and localized system behaviors. This would be especially relevant in large, heterogeneous countries where national averages mask internal complexity.
Thirdly, integration with qualitative systems mapping techniques (e.g., causal loop diagrams, stakeholder models) could bring in expert and experiential knowledge, complementing the quantitative insights and making the model more actionable for policy design.
Fourthly, exploring agent-based models (ABMs) could simulate interactions between individuals and institutions within the system, allowing for scenario testing under different policy, behavioral, or technological conditions.
Fifthly, the framework could be adapted for comparative international studies, applying the same systems methodology to assess digital exclusion and NEET dynamics in non-European contexts. This would test the transferability of findings and surface context-specific system behaviors.
Ultimately, future research should investigate the inclusion of additional subsystems, such as mental health, housing stability, or access to public services, which may further elucidate the mechanisms driving youth exclusion in the digital age.
From the methodological perspective, applying advanced techniques such as Geographically Weighted Regression (GWR) or spatial error/lag models would provide a more detailed understanding of spatial heterogeneity in NEET determinants [
106,
107,
108]. Due to the limited spatial granularity of the available data (aggregated at the national level), the application of these techniques was not feasible within the scope of this study. Nonetheless, we acknowledge this as a valuable direction for future research, particularly when NEET data becomes available at NUTS 2 or NUTS 3 levels. In such a context, we plan to apply spatial autocorrelation diagnostics (e.g., Moran’s I, Lagrange Multiplier tests) and explore local regression approaches.
Through these measures, the reduction in the NEET rate can be accelerated and young people can be better prepared for the future digital economy, avoiding the vulnerabilities associated with uncontrolled internet use.
Previous research on NEET status has primarily focused on economic and educational factors, highlighting the connection between the labor market structure and the integration of young people [
51,
52]. In particular, the existing literature emphasizes that labor market rigidity and inadequate educational skills contribute to the increase in the NEET rate, but the impact of digital skills and risky internet use on socio-professional integration has been insufficiently investigated [
48,
103].
This research makes an original contribution by integrating advanced multivariate analysis, utilizing PCA with Promax rotation and logistic regression, to examine the relationship between digital skills, risky internet use, and the likelihood of becoming an NEET. Unlike previous studies, this approach provides an integrated perspective on the digital dimensions of youth exclusion.
Furthermore, regional disparities in digital skills and the NEET rate have rarely been analyzed in a detailed spatial framework. By using GIS and spatial clustering, this study provides a new geographical perspective on the correlations between digital skill levels, internet access, and economic vulnerability [
53]. The results obtained contribute to the formulation of personalized intervention strategies tailored to the digital profiles of young people and provide recommendations for more effective public policies aimed at reducing the NEET rate.
In summary, this study contributes to the literature by offering an integrated framework that links digital exclusion, territorial disparities, and youth socio-economic vulnerability. By combining multivariate statistics, CHAID segmentation, and spatial mapping, the research reinforces the strategic importance of digital competence, autonomy, and safety as core levers for reducing NEET risk in Europe’s digital age.
Future directions include longitudinal system modeling to capture dynamics over time; sub-national disaggregation (NUTS2/NUTS3) for regional precision; integration with qualitative mapping (e.g., causal loop diagrams); agent-based simulations of digital exclusion scenarios; and replication in non-EU contexts to validate systemic patterns.
Through these approaches, youth resilience in the digital age can be reinforced, ensuring that digital skills and protections are equity-driven enablers, not barriers.


