Article

Is Digital Industry Agglomeration a New Engine for Firms’ Green Innovation? A New Micro-Evidence from China

1
School of Economics and Management, Nanjing University of Science and Technology, Nanjing 210094, China
2
School of Business Administration, Shandong University of Finance and Economics, Jinan 250014, China
*
Author to whom correspondence should be addressed.
Systems 2025, 13(8), 627; https://doi.org/10.3390/systems13080627
Submission received: 5 June 2025 / Revised: 17 July 2025 / Accepted: 23 July 2025 / Published: 24 July 2025
(This article belongs to the Section Systems Practice in Social Science)

Abstract

The rapid development of the digital economy and the pursuit of green transformation are reshaping the innovation landscape of Chinese firms. However, limited attention has been paid to how digital industry agglomeration (DIA) influences corporate green innovation (CGI) at the firm level. Drawing on panel data from China’s A-share listed firms between 2017 and 2021, this study examines the differential effects of specialized agglomeration and diversified agglomeration of digital industry on CGI. The results indicate that DIA can promote CGI, with a 1% increase in DIA associated with a 1.503% increase in green innovation output. Further analysis reveals that specialized agglomeration exerts a significant positive effect, while diversified agglomeration has no evident impact. Our mechanism analysis indicates that knowledge spillovers serve as the key channel through which DIA fosters CGI. Moreover, heterogeneous effects analysis indicates that DIA exerts a stronger influence on non-high-tech enterprises and in regions where environmental regulation is less stringent. Drawing on these insights, fostering specialized digital clusters and strengthening knowledge-sharing mechanisms can help alleviate existing constraints on innovation diffusion, accelerating green innovation and supporting long-term sustainability.

1. Introduction

In the context of increasingly severe environmental challenges, CGI has gained global recognition as a fundamental imperative. CGI represents enterprises’ capabilities to integrate existing knowledge with environmental expertise, driving innovation in product design, production processes, and end-of-pipe technologies to minimize environmental impacts [1,2]. This form of innovation has garnered increasing attention in the modern economy, as it simultaneously promotes corporate sustainable development and safeguards the environment and ecosystem [3]. From a national perspective, some major economies, like the US and Japan, are actively working to establish their core competitive advantage by advancing CGI [4]. From an enterprise perspective, environmental management has emerged as a significant component of enterprise strategy. Enterprises that can carry out CGI in time will be more competitive and sustainable [5]. From a realistic perspective, China, after experiencing several years of rapid economic growth, urgently needs to transition from resource-, factor-, and capital-driven development toward green and innovation-driven growth [6]. This underscores the significance of stimulating enterprises’ enthusiasm for green technology innovation, a matter of profound concern and extensive discourse among governments and scholars.
In parallel, the digital economy has entered an advanced phase of spatial evolution, wherein DIA functions as both a catalyst and structural node for economic modernization. However, DIA is not merely a geographic concentration of firms—it represents a complex system characterized by inter-firm linkages, knowledge flows, digital infrastructure, and adaptive feedback loops. DIA not only contributes to fostering high-quality economic development but also serves as a strategic focal point for reshaping international competitiveness. Nevertheless, China’s level of DIA currently lags behind that of developed countries. Globally renowned DIA has established leading positions in specific areas of digital technology, such as software services in Silicon Valley in the United States and game design in Sweden. Therefore, to enhance China’s influence in the digital domain and foster new competitive advantages for the future, it is imperative to expeditiously nurture and grow DIA.
DIA refers to clusters of enterprises and related institutions that are geographically concentrated and engage in digital product manufacturing, service provision, technology application, and infrastructure development [7]. These agglomerations represent an advanced form of industrial organization, where firms benefit from proximity-based knowledge exchange, resource sharing, and technological collaboration [8]. Such agglomeration strengthens innovation within digital sectors and promotes the restructuring and modernization of conventional industries, thereby supporting the development of a modern industrial system [9]. From a systems perspective, DIA can be conceptualized as a key component of the broader regional innovation architecture, consisting of interlinked actors—including firms, platforms, and supporting institutions—that interact through digital infrastructure and knowledge flows. Within this system, firms may benefit from agglomeration-related externalities such as knowledge spillovers and technological complementarities [10]. This raises a key question: can firms embedded in such digital industrial systems effectively leverage these advantages to enhance their green innovation performance?
Given these problems, a thorough exploration of the effect of DIA on CGI has strong academic value. The analysis relies on a panel dataset of Chinese A-share companies spanning 2017–2021 to investigate how DIA and its various forms influence CGI. The aim is to provide a micro-level foundation for existing macro-level research. The research reveals that DIA significantly stimulates CGI, and distinguishing between different agglomeration modes indicates that specialized agglomeration primarily drives this effect, with diversified agglomeration having a less pronounced impact. Furthermore, this study thoroughly explores the potential mechanisms of DIA (especially specialization agglomeration) to promote CGI and finds that knowledge spillovers are a crucial mechanism by which DIA influences CGI. Overall, this study offers firm-level insights into how DIA, especially specialization agglomeration, contributes to CGI in today’s Chinese economic environment.

2. Literature Review

2.1. Linkages Between Industrial Agglomeration and CGI

Academic inquiry has long centered on how industrial agglomeration shapes green innovation outcomes. Existing studies typically focus on analysis from macro controls and industry perspectives, but their conclusions vary greatly. In summary, three main viewpoints emerge:
First, industrial agglomeration tends to foster green innovation. Given its role as a concentration of industries in specific geographic areas, industrial agglomeration helps in the redistribution of economic resources, leading to agglomeration externalities, thereby promoting the development of green innovation. Industrial agglomeration accelerates the spread and learning of expertise, technological know-how, and information among firms, promoting the diffusion and spillover of green concepts and pollution control technologies, thereby stimulating new ideas and further enhancing the green innovation capabilities of enterprises. This viewpoint is supported by empirical research. For instance, Liu et al. (2023) [11] emphasized that industrial agglomeration notably contributes to enhancing the effectiveness of local green advancement.
Second, industrial agglomeration may also cause adverse impacts to green innovation. Given constrained availability of resources and spatial limitations, excessive agglomeration generates negative externalities through the crowding effect. This situation significantly disrupts firms’ innovation-related R&D efforts and dampens their capacity for generating green innovation outcomes. Zeng et al. (2021) [12] found that industrial agglomeration may impede improvements in green innovation efficiency.
Third, there exists a complex non-linear link of industrial agglomeration and green innovation. Under the theory of “cluster lifecycle” [13], different stages of agglomeration present different externalities, and these externalities have varying effects on green innovation. For example, Hao et al. (2022) [14] reported that, at the level of Chinese cities, the link between industrial agglomeration and the efficiency of green innovation follows a U-shaped trajectory. In contrast, Chen et al. (2021) [15] indicated an inverted U-shaped connection between polycentric clustering and green innovation performance.
These macro-level studies offer valuable insights into how industrial agglomeration relates to green innovation. Nevertheless, the role of such clustering in shaping the innovation behavior of micro-level enterprises is still not well understood. This gap is even more pronounced in the context of DIA, as the digital industry—a technology- and knowledge-intensive sector—has a fundamentally different development and production mode compared to traditional manufacturing and service industries.

2.2. Knowledge Spillovers from Industrial Agglomeration

Most existing macro-level studies have explored how clustering of industries relates to the advancement of green innovation. The foundational argument, drawn from classical agglomeration theory, emphasizes the role of technological externalities in generating agglomeration benefits. Within industrial agglomeration regions, the proximity of various actors facilitates the dissemination and diffusion of knowledge, thereby giving rise to significant knowledge spillover effects [16,17]. Zhao et al. (2019) [18] assert that knowledge spillover effects within industrial agglomerations originate from competition and emulation among peer enterprises, collaboration and learning among upstream and downstream enterprises, and interaction and cooperation between businesses and research universities. Simultaneously, these effects are further magnified through the dynamic cyclical process of knowledge spillovers resulting from the diffusion and sharing of innovative outputs [19].
The question of whether firms incorporate knowledge spillovers into their green innovation activities garners increasing attention in academia. De Marchi et al. (2013) [20] propose that the success of green technology innovation depends on the extent to which firms acquire external knowledge. Ma et al. (2022) [21] argue that knowledge spillovers play a crucial role in green technology innovation: they directly impact technological progress and also indirectly influence further innovation through market competition. Nie et al. (2022) [22] find that the accumulation of knowledge greatly facilitates firms’ green innovation efforts. However, the specific relationship among DIA, knowledge spillovers, and CGI remains untested empirically.

2.3. Research on DIA

In recent years, academia has increasingly focused on research regarding the digital economy and digital industrialization [23,24]. However, investigations into DIA are still in their early stages, primarily addressing its conceptualization, quantification, and influence.
The academic interest in the digital industry is growing. However, consensus on defining the digital industry has not yet been reached. Institutions such as Tencent Research Institute, Alibaba, KPMG, and Information and Communications Technology (CAICT) have each advanced interpretations of the concept in their research frameworks [25]. Among these entities, CAICT’s definition has gained the most traction, receiving widespread acknowledgment from both academic circles and the industry sector [7,25,26]. According to this widely referenced definition, the digital industry includes sectors such as telecom, electronic information manufacturing, internet industries, and software/IT services. Drawing on Porter’s cluster theory, DIA refers to the spatial clustering and collaborative interactions of digital-sector firms and institutions, which together form innovation-driven ecosystems.
Building on the conceptual foundation, a growing body of empirical work has attempted to measure and evaluate the degree of DIA across regions. Li et al. (2023) [27] applied location entropy as an indicator to quantify the agglomeration intensity of core digital economy industries across Chinese provinces. They also applied approaches such as kernel density estimation, the Dagum Gini coefficient, and exploratory spatial analysis to examine changes over time, regional disparities, and geographic patterns in industrial agglomeration. Similarly, Yuan et al. (2023) [7] also adopted location entropy to assess the spatial clustering of China’s digital sector across provinces.
Although the environmental consequences of digital industry development have been widely studied, scholars have yet to reach a unified conclusion. Yi et al. (2022) [28] found that the technological advancement of the digital industry itself may increase carbon emissions intensity. However, by promoting technological innovation in upstream and downstream industries, it effectively drives the national low-carbon transformation and development, resulting in an overall reduction in carbon emissions. In contrast, many studies report that the total carbon emissions from the information and communication technology industry increase exponentially with its rapid growth [29].
This research offers several key contributions. First, by integrating DIA and CGI into a single analytical framework, it explores how different DIA modes affect CGI, providing new micro-level evidence on the relationship between DIA and CGI in the Chinese context. Second, using a mediating effect model, it empirically tests the role of knowledge spillovers in the relationship between DIA and CGI, clarifying the underlying mechanism and enriching the theoretical understanding of this relationship. These findings not only contribute to academic knowledge but also offer practical guidance for enterprises to leverage DIA for green innovation.

3. Research Hypothesis

3.1. DIA and CGI

Digital industries differ significantly from traditional manufacturing sectors. These industries are typically highly knowledge-intensive, heavily reliant on intangible assets such as data, software, and algorithmic knowledge, and characterized by strong network externalities—where the value of participation increases as more users, firms, or platforms join the system [30]. These features suggest that the mechanisms through which agglomeration affects innovation in the digital context may be distinct and potentially more powerful than in traditional industries. Drawing from theories of digital innovation ecosystems and platform economics, DIA can be viewed not only as a geographic concentration of firms but also as a socio-technical system that enables dynamic knowledge exchange, interoperability, and value co-creation across firms [31]. Within such ecosystems, firms interact and evolve through shared platforms, digital infrastructure, and complementary innovation activities. These ecosystem-level interactions promote deeper knowledge flows, collaborative experimentation, and rapid dissemination of green technologies, especially under shared policy and environmental objectives.
Within the framework of agglomeration, DIA can be classified into digital industry specialization agglomeration and digital industry diversification agglomeration. Specialized agglomeration of digital industries reflects the distribution of digital industries of the same type in space. As emphasized by Marshall (1961) [32], the concentration and specialization of the same industry are more conducive to generating agglomeration economies. Specialized agglomeration of digital industries can generate both economies of scale and technological spillovers. On the one hand, specialized agglomeration of digital industry can achieve efficient sharing of specialized labor, intermediate inputs, and infrastructure within a region. This, in turn, can help lower the cost of firms’ purchases of products and services related to green development, allowing them to concentrate their resources on technological R&D, thus providing vital funding for CGI. On the other hand, within specialized agglomeration zones, similar enterprises find it easier to engage in communication and exchange regarding production processes and techniques. This facilitates knowledge spillovers through channels such as factor flows, industry connections, learning, and imitation. Knowledge spillovers not only promote the dissemination of new ideas but also enable firms to acquire new knowledge and technologies from their competitors. This enhances the heterogeneity of firms’ knowledge, aiding in breaking away from conventional thinking and traditional cognitive paradigms. Furthermore, this heightened awareness of their own knowledge and capability inadequacy instills a stronger sense of “catching up” or “leading” among latecomer enterprises, consequently enhancing their green innovation capabilities and enabling them to participate more effectively in market competition.
The diversified agglomeration of digital industries reflects the spatial distribution of diverse digital industries within the same area. In theory, diversified agglomeration in the digital industry can also promote CGI. First, diversified agglomeration of the digital industry broadens the diversity of intermediate product supplies within clusters, providing firms with more choices of intermediate products. This not only enhances production efficiency but also allows firms to flexibly select intermediate products that align with high-level pollution treatment technologies, thereby facilitating CGI. Second, diversified agglomeration of digital industry facilitates firms’ acquisition, use, imitation, absorption, and recombination of various complementary knowledge resources from different industries. This encourages the collision of diverse ideas and mutual learning, stimulating new creativity and further enhancing corporate green innovation capabilities. Additionally, the labor pool built by the diversified agglomeration of digital industry contributes to improving the efficiency of matching between firms and labor. This enables firms to selectively choose labor that aligns with the promotion of green technological innovation, thereby elevating corporate green technology innovation levels.
Therefore, theoretically, under the effect of agglomeration externalities brought about by specialized agglomeration and diversified agglomeration of digital industry, DIA contributes to promoting firms’ green innovation. However, as digital industry agglomeration zones in China have only recently been established, regional diversification within the digital sector remains limited [7]. This significantly restricts the positive externalities associated with the digital industrial diversified agglomeration, which may lead to an insignificant impact on CGI. As a result, the driving force behind CGI is primarily attributed to specialized digital industry agglomeration. Based on this premise, the hypothesis below is proposed:
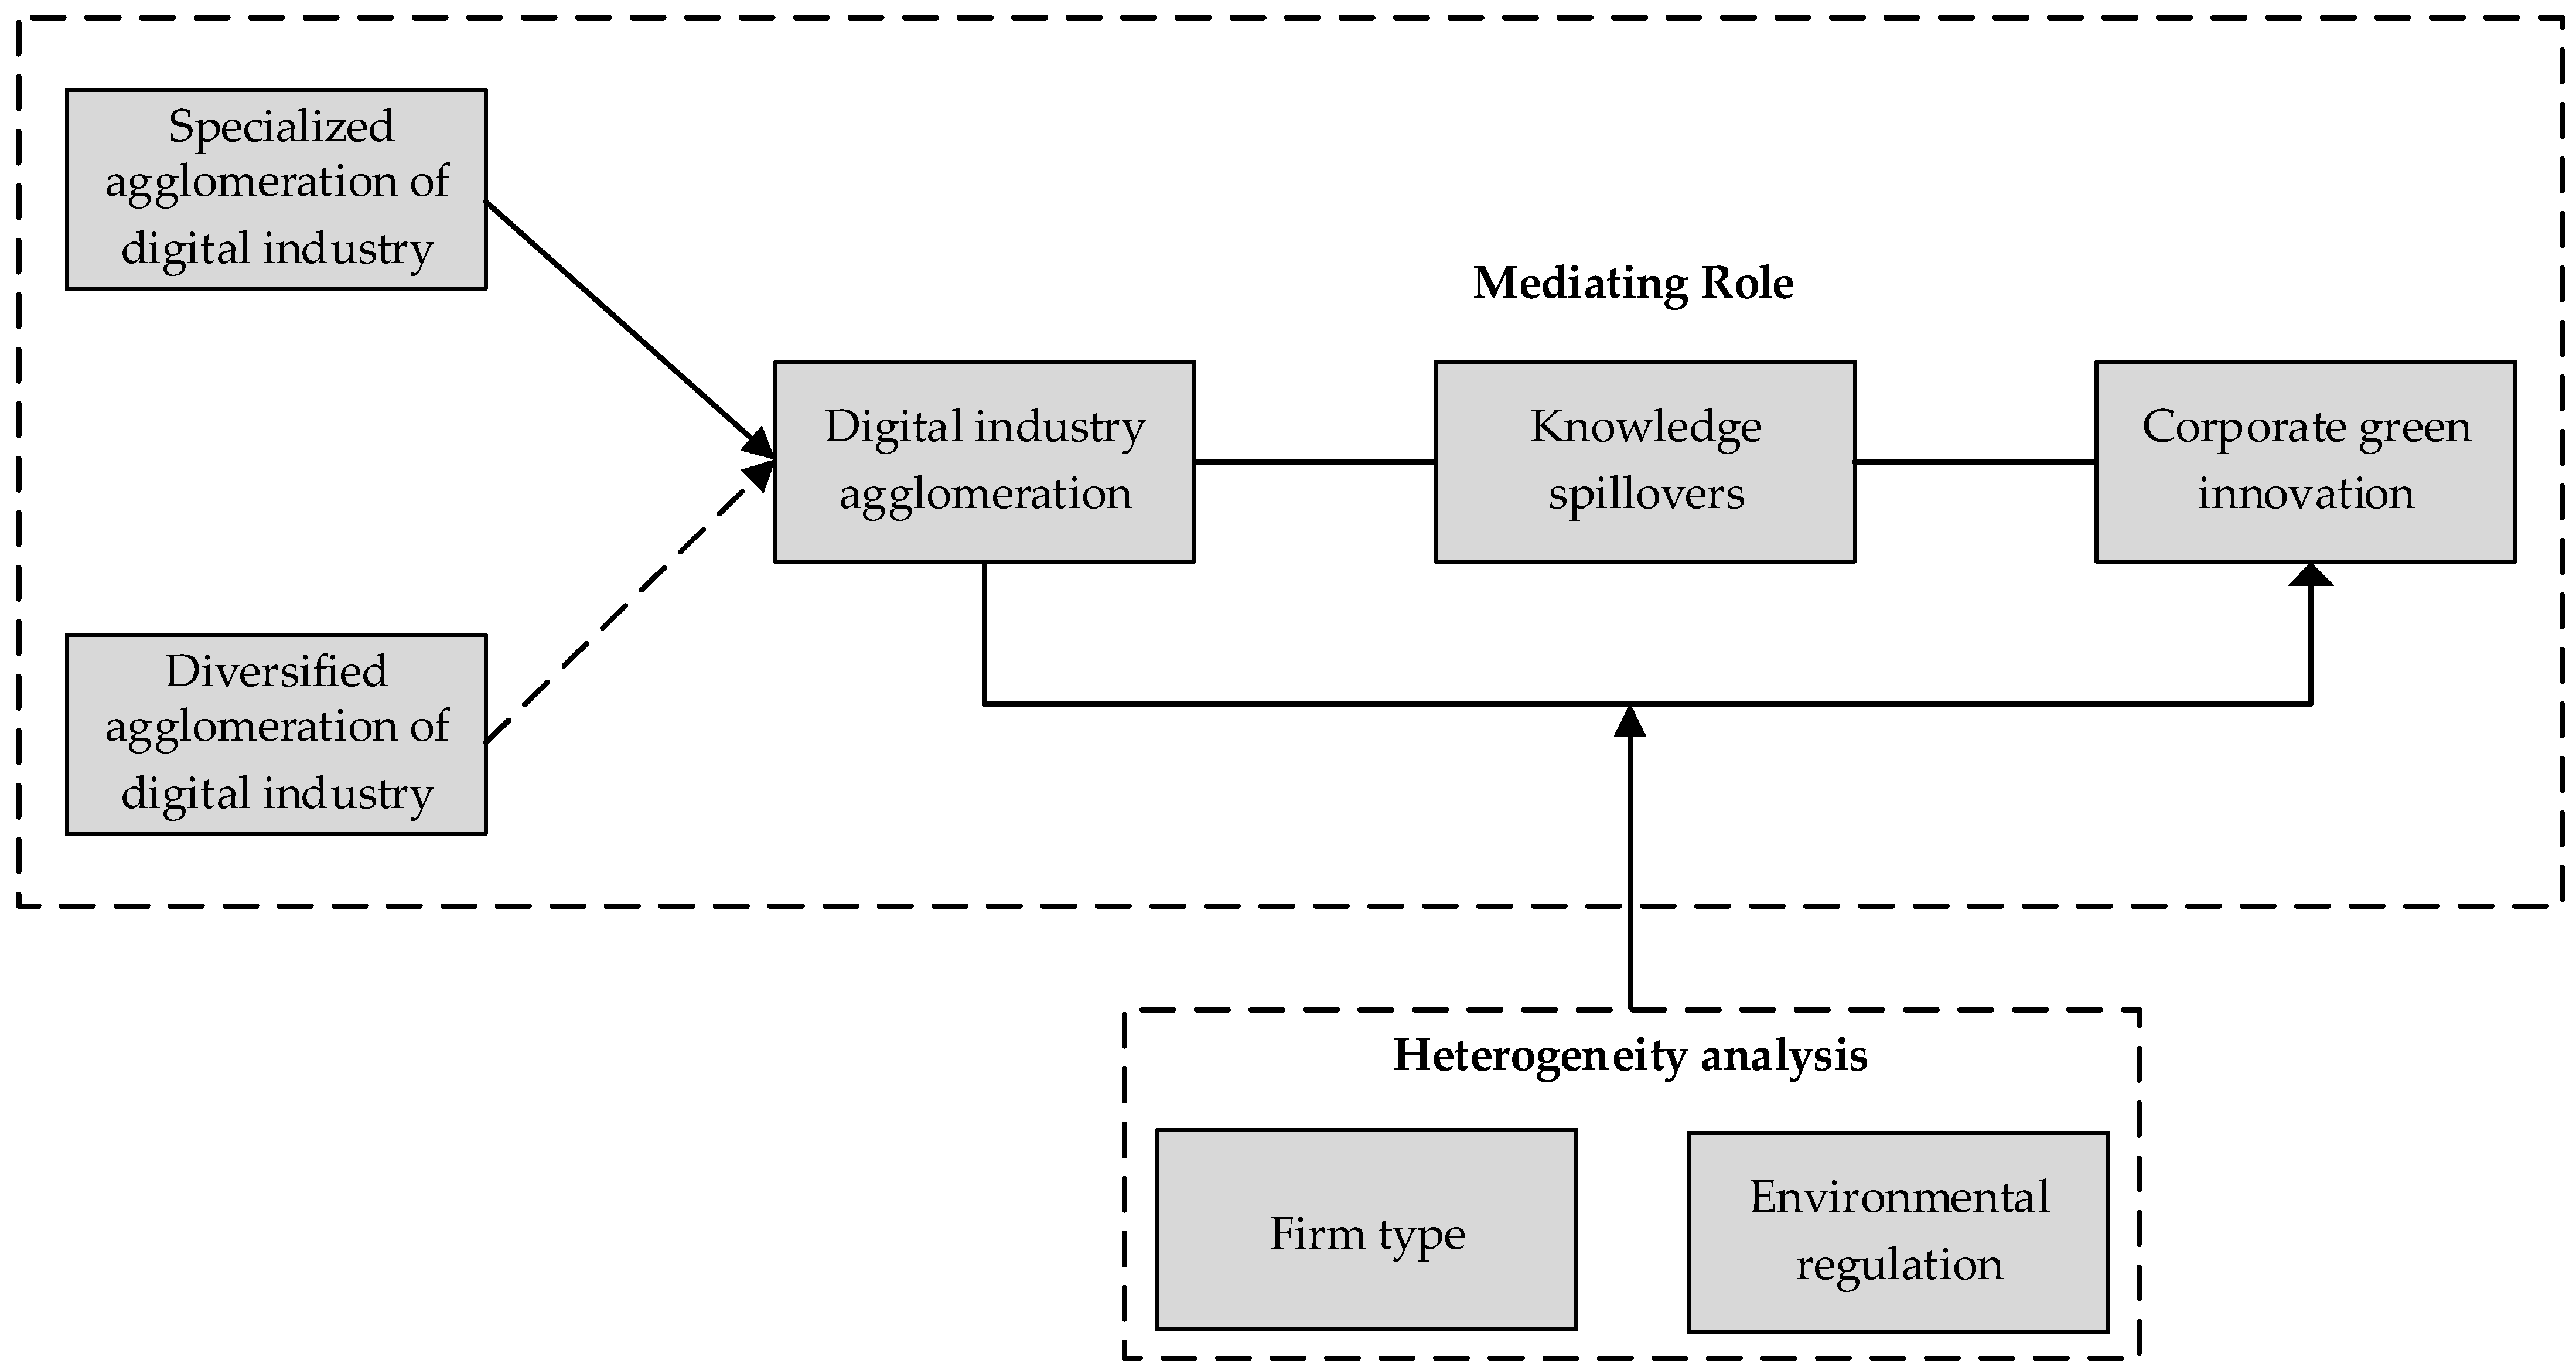
H1: 
DIA can significantly promote CGI.
H2: 
The specialized agglomeration of the digital industry can significantly promote CGI, whereas the impact of diversified agglomeration in the digital industry on CGI may not be as pronounced.

3.2. DIA, Knowledge Spillovers, and CGI

When agglomeration effects occur, knowledge spillovers between firms through interaction and learning are often unavoidable. According to Arrow (1962) [33], despite the extensive protection afforded to information by the law, information itself is an intangible entity that can never be fully regarded as a possessable commodity. This is because in any form of information production, the use of information itself leads to its disclosure, at least partially. In other words, the very nature of information is such that it is disclosed in the course of its use, which makes it difficult for information to be fully controlled or possessed. Therefore, the exchange of knowledge and technology between firms is easier when they are geographically close to each other. Within the agglomeration area, the digital industry is able to obtain substantial knowledge and technology spillovers through technological externalities between firms. This situation allows firms to benefit from the innovations of surrounding firms, which in turn facilitates the accumulation of knowledge and technology needed for green innovation. Such agglomeration effects significantly increase the likelihood of successful innovation.
First, DIA triggers knowledge spillover effects among enterprises. It is manifested in vertical exchanges and interactions among suppliers, producers, downstream distributors, and customers based on the supply chain. Knowledge and technology are embedded in innovative products and technologies. By engaging in learning by doing and learning by use, downstream firms in the supply chain can internalize external knowledge and technology, thereby facilitating indirect access to innovation spillovers. This approach not only makes industrial collaboration more flexible, precise, and efficient, but also helps enterprises to keep abreast of cutting-edge information technology and development dynamics promptly and accurately, thus increasing the success rate for green innovation. In short, through learning by doing and learning by using, downstream firms can gain access to technology and knowledge spillovers, which, in turn, facilitate industrial collaboration and the success of green innovation. Horizontally, knowledge spillovers are reflected in the competition and imitation behaviors among enterprises within the same market, and the technological achievements of enterprises that prioritize innovation will also benefit other enterprises in the agglomeration area. By learning new knowledge and technologies from their competitors, enterprises acquire heterogeneous knowledge, break through cognitive inertia and paradigms, and overcome the limitations of their own knowledge and capabilities, thus enhancing their green innovation capabilities.
Second, there are knowledge spillovers that occur between laborers during the process of DIA. As digital industries agglomerate in a region, a situation known as “labor pooling” develops, making it easier for specialized laborers to engage in face-to-face exchanges [34]. Such exchanges not only improve the flow efficiency of explicit knowledge among enterprises but also promote the spread and proliferation of tacit knowledge and technology. To sum up, DIA stimulates the generation of new ideas, concepts, and modes by optimizing the communication platform for practitioners, and it provides the best green technological innovation learning environment for high-tech talents. Therefore, the knowledge spillover effect triggered by digital industry agglomeration helps promote CGI.
Finally, DIA has had a demonstrative and stimulating effect on entrepreneurship and green innovation culture. By forming a diversified enterprise network structure, DIA promotes the dissemination and application of the concepts of energy conservation and emission reduction, as well as green and clean technologies. This environment makes it easier for enterprises to reach a consensus and deepens their awareness of the environment, which, in turn, promotes the focus of R&D towards green transformation and upgrading. This process further promotes the development and application of green technologies. In short, DIA promotes the development of enterprises in the field of green innovation through demonstration and incentive effects, and facilitates the birth and diffusion of green technologies.
H3: 
Knowledge spillovers serve as a key channel through which DIA enhances CGI.
Figure 1 illustrates the theoretical framework developed in this study.

4. Data and Method

4.1. Data Source

The data sources in this paper are divided into two categories: the first is firm-level data, which is used to measure the explanatory variables (firms’ green innovation) and firm-level control variables. The CNRDS database provides information on green patents, whereas control variables are primarily drawn from the CSMAR database, with supplementary information provided by Wind when necessary. The second type of data is the province-level data, which is used to calculate the core explanatory variables (digital industry agglomeration) and the regional-level control variables, and is taken from the China Statistical Yearbook.
To analyze how DIA influences CGI, it is essential to match the two categories of data described above. The data matching process begins by categorizing firms based on their registered locations to the corresponding provinces, followed by matching the digital industrial agglomeration index according to province and year. To ensure data quality, the following processing steps are undertaken: (1) exclusion of samples from the financial industry; (2) removal of companies classified as ST, *ST, or PT during the year; and (3) exclusion of samples with missing data. The final sample spans the period from 2017 to 2021, comprising 10,798 valid observations.

4.2. Model Design

To empirically investigate the association between DIA and CGI, we estimate the effect of DIA levels on CGI. In this analysis, we employ a dual fixed effects regression model of CGI as a function of DIA and several control variables. To address potential heteroscedasticity, we transform the independent variables into logarithmic form.
G r e i j s t = α 0 + α 1 ln D i g a g g j s t + η X + Y e a r t + I n d s + ε i j s t
where i stands for company, j for province, s for industry, and t for year. G r e i j s t represents the level of CGI. D i g a g g j s t denotes DIA, including the overall level of DIA ( A g g j s t ), specialized agglomeration of digital industry ( S p e j s t ), and diversified agglomeration of digital industry ( D i v j s t ). X denotes a set of control variables. Additionally, the specification incorporates fixed effects for years ( Y e a r t ) and industries ( I n d s ), while the error term is denoted by ε i j s t .

4.3. Variable Definitions

4.3.1. Dependent Variable

CGI is typically represented by two metrics: green patent applications and granted patents [35]. Because approvals often involve delays, our analysis focuses on application figures to evaluate innovation intensity [36]. To ensure the reliability of the results, this study uses the count of enterprise-level green patent authorizations as part of the robustness verification.

4.3.2. Independent Variable

While a standardized definition of the digital industry remains absent, existing studies commonly refer to the classification developed by CAICT, which effectively reflects the core components of the sector. Following CAICT’s classification [25,37], the digital industry encompasses sectors such as electronic information manufacturing, telecommunications, software and information technology services, and the internet industry.
To quantify DIA, we adopted the method of Torres et al. (2019) [38], which calculates the proportion between regional digital industry workforce density and the national total of digital industry employment, serving as an indicator of agglomeration. The calculation formula is as follows:
A g g j s t = E j s t / L j t E s t
where A g g j s t denotes the overall level of DIA, E j s t is the employment of sector s in region j at time t , L j t refers to the land area in province j in period t , and E s t represents the total employment within the national digital sector corresponding to region s during period t . A larger A g g j s t value reflects a higher concentration of digital industry activities within that region.
To compute the specialization agglomeration index of the digital industry, we adopted the measurement method proposed by Liu and Wu (2023) [39], using location entropy as the metric. The corresponding equation is given below:
S p e j s t = E j s t / E j t E s t / E t
where S p e j s t denotes the specialized agglomeration of digital industry, E j t denotes the employment size of province j during year t , while E t captures nationwide employment in period t . S p e j s t indicates the degree of specialization of the digital industry across regions. When the proportion of employment in the digital industry in a certain region is higher, the specialization agglomeration index ( S p e j s t ) of that region will be higher, indicating a higher degree of specialization in the digital industry in that region.
For the digital industry diversification agglomeration index, we drew inspiration from the measurement method proposed by Cheng and Jin (2022) [40], which utilizes the inverse of the HHI index. The corresponding equation is given below:
D i v j s t = 1 / s = 1 , s s ( E j s t E j t E j s t ) 2 1 / s = 1 , s s ( E s t E t E s t ) 2
where D i v j s t denotes the diversification agglomeration of digital industry, E j s t represents the employment in other digital industries s in province j besides the digital industry s in period t , E s represents the total employment in other digital industries s across the country except for the digital industry s in period t , and the meanings of the other variables are the same as above. The diversification agglomeration index ( D i v j s t ) reflects the degree of diversification of digital industries in various regions. When the proportion of employment in the digital industry s is relatively low, indicating that the employment in other digital industries in that region is relatively high; the diversification agglomeration index of that region is higher. This pattern indicates a more dispersed development of non-dominant digital industries, integrating a broader range of differentiated knowledge and enhancing overall diversification.

4.3.3. Control Variable

Building on prior research, we included several control variables in our regression models. At the firm level, we accounted for variables, as suggested in previous studies [25,41,42]: (1) Firm age (Age), (2) Leverage level (Lev), (3) Return on equity (Roa), (4) Cashflow ratio (Cashflow), (5) Fixed assets ratio (Fixed), (6) Innovation input (RD).
Regional-level control variables were included in the regression models, as guided by previous research [25,43]: (1) Fiscal expenditure scale (Fiscal_e) and (2) Transportation infrastructure (Tran). Variable definitions are shown in Table 1.
Table 2 summarizes the core indicators employed in the analysis. For CGI, the range extends from a minimum of 0 to a maximum of 1543, with a standard deviation of 36.642 and a mean of 5.543. This suggests that Chinese firms exhibit relatively weak capacity for green innovation, with substantial disparities in green patent output across companies. The DIA indicator has an average of −5.266, ranging from −11.389 to −2.421, with a standard deviation of 1.795. Such dispersion reflects substantial regional gaps in digital industry agglomeration, pointing to an urgent need for targeted policies to reduce imbalance.

5. Empirical Results

5.1. Analysis of Spatial and Temporal Patterns in DIA

As China’s economic development does vary between regions, the agglomeration of digital industries may also vary across China [39]. Figure 2, based on a sample of 30 provinces, illustrates the levels of DIA in different regions. The three figures in the first column (a, d, g) depict the overall level of distribution of DIA (Agg). The three figures in the second column (b, e, h) show the geographic distribution of the level of specialization agglomeration of digital industries (Spe). Meanwhile, the three figures in the third column (c, f, i) depict the degree of digital industry diversification across regions (Div).
From the overall DIA patterns in panels a, d, and g, it is evident that Shanghai, Beijing, Guangdong, Jiangsu, Tianjin, and Zhejiang have relatively high concentration, consistent with prior studies [25]. Conversely, Qinghai, Xinjiang, Inner Mongolia, Gansu, and several additional provinces present much weaker intensity. Across the country, a clear “core-periphery” spatial pattern has emerged. Compared with central and western regions, the eastern coastal areas maintain a substantially higher intensity of DIA. Such spatial differences across regions largely stem from the economic, infrastructural, talent-related, trade, and locational strengths found in eastern China. The eastern coastal areas boast developed economic systems and superior geographical locations, providing strong support for the rapid agglomeration of the digital industry. Additionally, these regions generally possess advanced infrastructure and abundant talent, conditions that promote DIA.
DIA is further divided into specialization agglomeration (as shown in Figure 2b,e,h) and diversification agglomeration (as shown in Figure 2c,f,i). The spatial pattern of digital industry specialization agglomeration largely mirrors regional differences in digital industry development, with eastern coastal areas exhibiting notably higher levels of specialization. However, in terms of the diversified agglomeration of digital industries, the eastern coastal region does not have a high level, and there is a significant difference in regional distribution compared to the overall level of digital industries. This preliminary observation suggests that regional differences in the agglomeration of digital industries are mainly caused by specialization agglomeration.

5.2. Results of Baseline Regression

Table 3 presents the effects of DIA on CGI. The first model indicates a positive and statistically significant association between DIA and CGI at the 5% level. This indicates that DIA can promote CGI, thus supporting Hypothesis 1.
From the previous analysis, it is evident that DIA contributes to promoting CGI. So, which agglomeration pattern is primarily responsible for this effect? The second and third models assess how specialization and diversification within the digital industry influence CGI. The estimated coefficient for specialized digital clustering (lnSpe) is positive and statistically significant at the 10% level. The third model shows that although the estimated coefficient for digital industry diversification agglomeration (lnDiv) remains positive, it fails to reach statistical significance. The result suggests that the driving effect of DIA on CGI is mainly driven by specialization agglomeration, while the promoting effect of diversification agglomeration on CGI is not significant, thus supporting Hypothesis 2. This outcome may be attributed to the predominance of specialization within China’s digital sector, whereas diversification agglomeration remains underdeveloped in both extent and maturity, thereby limiting its capacity to generate meaningful externalities among digital enterprises.

5.3. Endogeneity and Robustness Tests

5.3.1. Instrumental Variables Estimations

Although the explanatory variable of this paper is corporate green technology innovation and the explanatory variable is province (municipality directly under the central government) level digital industry agglomeration, which alleviates the interference of reverse causality to a certain extent, the problem of endogeneity still should not be ignored. The agglomeration of digital industry firms may be attracted by regions with higher levels of green innovation, which usually have superior innovation environments, well-developed infrastructures and policy support, and are more conducive to the business expansion and collaborative innovation of digital firms. Additionally, the presence of green innovation firms may, in turn, promote the agglomeration of digital industry firms through knowledge spillover, market demand expansion and industry chain improvement. The bidirectional relationship may cause endogeneity, potentially biasing model outcomes. To mitigate this concern, an instrumental variable strategy is implemented as a robustness test. We employ the provincial fixed-line telephone penetration rate from 1984 as an instrument, in line with Huang et al. (2019) [44], we use the provincial landline penetration rate from 1984 as an instrumental variable. The choice of this instrumental variable is based on exogenous and correlation considerations. On the one hand, the number of landline telephones, which was the main mode of communication before the popularization of Internet technology, is closely related to the popularity of Internet technology. Regions exhibiting a larger number of landline connections generally possess stronger internet infrastructure, which in turn supports the agglomeration of digital industries. Therefore, the instrumental variable shows a strong association with DIA. On the other hand, 1984 was more than forty years ago, and it is difficult for this instrumental variable to influence firms’ green innovation today, thus satisfying the exogeneity requirement. In addition, as the 1984 provincial-level fixed-line telephone density (measured per 100 people) is a time-invariant cross-sectional indicator, it cannot be directly employed as an instrument. Following Nunn and Qian (2014) [45], we uses the cross-multiplier term between the national information technology service revenue in the lagged period and the number of fixed-line telephones per 100 people in each province in 1984 as an instrumental variable for the current period’s digital industry agglomeration.
In the instrumental variable regression analysis, only digital industry agglomeration (lnAgg) and digital industry specialization agglomeration (lnSpe) were tested, while digital industry diversification agglomeration (lnDiv) was not included. The baseline regression suggests that diversification within the digital industry shows no notable effect on firms’ green innovation. Consequently, this factor is excluded from the instrumental variable analysis. This study applies the LM test and Wald F-test to examine the relevance between the selected instruments and the endogenous regressors, and to further evaluate the potential issue of weak identification associated with the instruments. The results are shown in Table 4. The LM test produces statistics of 52.18 and 102.57, both highly significant at the 1% threshold, which strongly rejects the null hypothesis of underidentification. Furthermore, the Wald F statistics, reported as 46.61 and 92.17, are well above the critical threshold of 16.38 set by Stock and Yogo (2005) [46] for a 10% significance level, suggesting no evidence of weak instruments and confirming the suitability of the chosen instrumental variables. Columns (2) and Columns (4) take DIA and specialized digital industry agglomeration as the key explanatory variables. Both variables display positive and statistically significant coefficients at the 5% threshold. This reinforces the conclusion that, after mitigating endogeneity issues, the positive effect of DIA on promoting CGI persists with robustness.

5.3.2. Lagged Independent Variable

Earlier research emphasizes that patent-based indicators often reflect innovation performance only after a time delay, given the lengthy process from R&D investment to patent realization [47,48]. To account for the lagged effect, the independent variable is lagged by one period in the robustness test, and the corresponding results are reported in Table 5. The coefficients for DIA and its specialization are statistically significant at the 1% threshold, underscoring their robust positive associations with CGI. In contrast, although diversified agglomeration (lnDiv) also shows a positive sign, its effect does not reach statistical significance. These estimates align with the baseline model, supporting the reliability of the findings.

5.3.3. Replacement of the Dependent Variable

Taking into account that green patent grants data can better reflect a company’s green innovation capability, in the robustness test, we replaced the number of green patent applications with the number of green patent grants. Table 6 presents the results, which align with those obtained in the baseline analysis, thereby reinforcing the robustness of the principal findings.

6. Mechanism Analysis

The regression results above suggest that specialization agglomeration plays the dominant role in enhancing CGI, while diversification agglomeration does not significantly promote CGI. To analyze the pathway through which DIA impacts CGI, this paper draws on Jiang (2022) [49] to construct the following mechanism testing model.
S p i l l o v e r i j s t = α 0 + α 1 ln D i g a g g j s t + η X + Y e a r t + I n d s + ε i j s t
Within Equation (5), S p i l l o v e r i j t serves as a mediator variable, that is, knowledge spillover.
Following Huang et al. (2022) [50], knowledge spillover is captured through patent collaborations between listed companies (including their subsidiaries) and external firms. D i g a g g j s t represents DIA, including overall agglomeration level (Agg) and specialization agglomeration in the digital industry (Spe). As indicated by the aforementioned analysis, due to the insignificant impact of diversified agglomeration in the digital industry on CGI, this mechanism is no longer analyzed. The other variables have the same meaning as the variables above.
Table 7 reports the mediation analysis results. Columns (2) and (4) indicate that both DIA and its specialization dimension exhibit positive signs, with DIA significant at the 5% level and specialization showing marginal significance at 10%. These findings are consistent with our prediction that DIA and specialization in the digital industry contribute to promoting knowledge spillover. Knowledge spillovers can promote CGI by providing an external ‘knowledge spillover pool’ that supplements the complex technologies and cross-disciplinary knowledge required for green innovation [51]. In knowledge-intensive environments, enterprises are more likely to acquire heterogeneous knowledge, break out of habitual thinking patterns, and enhance the flexibility and diversity of green innovation [52]. In addition, knowledge spillovers reduce the R&D costs and uncertainty of green innovation and help strengthen enterprises’ resource bases and risk-bearing capabilities, thereby continuously promoting green innovation [53,54,55]. In summary, based on the above findings, knowledge spillover acts as a mediator in the link between DIA and CGI, consistent with H3.

7. Heterogeneity Analysis

7.1. Heterogeneity by Firm Type

We first examine whether the impact of DIA differs across firms with varying levels of innovation capacity. Using the “Recognition Project Type” from the CSMAR Listed Company Qualification Recognition dataset, we classify firms into high-tech enterprises (Ht = 1) and non-high-tech enterprises (Ht = 0), and perform separate regressions. As shown in Table 8, both lnAgg and lnSpe exert statistically significant and positive effects on CGI among non-high-tech enterprises, whereas their effects are not significant for high-tech enterprises. This finding suggests that non-high-tech firms, which typically have weaker internal innovation capabilities, rely more on the external knowledge, infrastructure, and collaboration benefits brought by digital industry agglomeration. By contrast, high-tech firms may already possess mature innovation systems, and thus the marginal benefit from external agglomeration may be limited.

7.2. Heterogeneity by Environmental Regulation Intensity

To capture regional variations in environmental regulation intensity, we adopt an indicator calculated as pollution–control investment divided by industrial value-added [56]. We define ER = 1 as high environmental regulation regions, and ER = 0 as low environmental regulation regions. As shown in Table 9, both lnAgg and lnSpe have significant positive impacts on CGI in low-regulation regions. However, in high-regulation areas, neither form of agglomeration shows a statistically significant effect. One possible explanation is that in highly regulated environments, firms face stronger compliance burdens and risk aversion, which may crowd out green innovation activities. In contrast, firms in less-regulated areas may enjoy more operational flexibility to leverage agglomeration externalities—such as access to shared technologies, digital infrastructure, and innovation spillovers—for green transformation.

8. Conclusions

Drawing on firm-level data from China’s A-share market between 2017 and 2021, this study explores how DIA influences CGI. We have found the following: (1) The results indicate that DIA significantly promotes CGI, with a 1% increase in DIA associated with a 1.503% increase in green innovation output. (2) When disaggregating agglomeration patterns, we find that the driving force is mainly derived from specialized agglomeration, whereas diversified agglomeration has no statistically significant effect. (3) Our mechanism analysis indicates that knowledge spillovers serve as the key channel through which DIA fosters corporate green innovation. (4) Our heterogeneity analysis demonstrates that the effects of DIA are stronger for non-high-tech enterprises and in regions with lower environmental regulation intensity.
Our findings align with recent studies highlighting the positive impact of specialized agglomeration on innovation outcomes [57,58], suggesting that firms benefit more from depth than breadth when it comes to knowledge compatibility and absorptive capacity. However, these findings differ from studies that advocate for the innovation benefits of industrial diversification [59,60]. One potential explanation lies in the stage of digital ecosystem development in China: the dominance of specialized clusters and the immature structure of diversified agglomerations may limit the realization of external economies of scope. Moreover, in regions where institutional support, technological complementarity, and market matching are underdeveloped, diversification may fail to translate into meaningful innovation synergies. We suggest that the insignificant impact of diversification is not evidence of its ineffectiveness in principle, but rather a reflection of structural or contextual thresholds yet to be overcome in China’s current digital industrial landscape.

8.1. Theoretical Implications

First, this study extends the industrial agglomeration literature by incorporating a digital perspective, emphasizing firm-level green innovation (CGI) rather than traditional regional innovation metrics, and empirically distinguishing the effects of specialized versus diversified agglomeration within the digital industry. Specifically, prior studies have primarily examined how industrial agglomeration influences regional-level green innovation [11,14]. However, research that explores its effect on CGI—particularly through the lens of DIA—remains relatively scarce [61]. The digital industry is a typical technology-intensive and knowledge-intensive industry, with its development and production processes fundamentally different from traditional manufacturing and service industries [7,26]. The objective of this research is to examine how DIA affects CGI, with a particular focus on distinguishing the effects of specialization and diversification agglomeration patterns at the firm level.
Second, this study advances the understanding of CGI mechanisms by identifying knowledge spillovers as a significant mediating channel and incorporating heterogeneity analysis to clarify boundary conditions. Specifically, while previous studies have confirmed the impact of knowledge spillovers on CGI, they have noted that firms within agglomerations attribute their innovation to these spillovers [21,62]. However, empirical analyses exploring the detailed connection between DIA, knowledge spillovers, and CGI are still limited. In this context, our study further explores the mechanism through which DIA influences CGI via knowledge spillovers. Moreover, this study introduces heterogeneity analysis, demonstrating that the effects of DIA are stronger for non-high-tech enterprises and in regions with lower environmental regulation intensity, which supplements the boundary conditions of DIA’s impact on CGI.

8.2. Practical Implications

First, government departments and industrial planning bodies should prioritize the development of specialized digital industry parks. Our findings suggest that DIA’s influence on CGI mainly stems from specialization agglomeration. To leverage this mechanism, governments should strategically plan and expand specialized digital clusters that co-locate firms sharing similar technological bases and environmental innovation needs. Governments can assist these parks by providing customized policy measures, including funding for environmentally friendly technology R&D and preferential land-use policies, to accelerate the growth of the digital economy. Moreover, authorities should encourage these parks to act as centers that foster the deep convergence between digital and traditional industries, ultimately creating internationally competitive zones of digital industry clustering.
Second, policymakers should take a phased approach to cultivating diversification agglomeration by enhancing cross-sector innovation ecosystems. Although diversification agglomeration does not yet show significant effects on CGI in our empirical analysis, this may be due to its limited maturity and insufficient spillover channels in the current industrial context. Rather than dismissing its potential, policymakers should proactively invest in foundational infrastructure to support future diversification benefits. This includes building open innovation platforms that connect digital firms with actors in green manufacturing, energy, and services; encouraging university–industry collaborations; and developing digital-green pilot zones that integrate diverse knowledge domains.
Finally, policymakers are encouraged to implement tailored approaches to reflect the diverse influence of DIA under different firm structures and regulatory environments. The empirical findings indicate that CGI gains from DIA tend to be stronger for non-high-tech firms and under less stringent environmental regulation. This implies that a one-size-fits-all approach may not fully unlock the potential of digital clusters. Therefore, targeted policies such as inclusive digital infrastructure investments, tailored environmental regulatory frameworks, and specialized innovation support schemes for lagging firms or regions should be implemented. Moreover, future digital industry policies should incorporate flexibility to adapt to sector-specific and regional characteristics, ensuring that the green innovation dividends of digital agglomeration are equitably distributed.

8.3. Limitations and Future Directions

Similarly to previous research, the design of this research has some limitations and provides direction for future research. First, given the difficulty of accessing detailed data, our analysis relies on a province-level indicator for DIA. Although this choice improves comparability, it may fail to capture variations within provinces. Firms within the same province may experience significantly different levels of digital industry concentration depending on their local context. Consequently, the provincial-level measurement might attenuate the estimated effects or mask localized agglomeration dynamics. Future research could leverage more granular city- or district-level data to construct refined DIA indicators, enabling a more precise analysis of spatial heterogeneity and the localized spillover effects of digital industry ecosystems.
Second, mechanism analysis needs to be further expanded. The effect of DIA patterns on CGI may also rely on a number of other mediating variables that have not yet been addressed in current research, like labor reserves and input shares. These mediating variables can be the subject of further research. Investigating these would deepen the understanding of how DIA systems generate green innovation through multi-dimensional element synergies.
Third, this study is based on listed A-share firms, which typically exhibit higher innovation intensity and better access to policy instruments than SMEs or unlisted digital enterprises. Therefore, policy recommendations derived from this study may not generalize to all firm types. Future research could extend the analysis to a broader range of firms, particularly SMEs and non-listed enterprises, by incorporating alternative datasets such as industrial surveys or administrative firm-level records. Such efforts would help verify the robustness and generalizability of the observed agglomeration–innovation relationships across different ownership structures, firm sizes, and levels of market exposure.

Author Contributions

Conceptualization, Y.Y. and Y.Z.; methodology, L.Z.; software, Y.Y. and J.D.; formal analysis, Y.Y.; data curation, L.Z.; writing—original draft preparation, Y.Y.; writing—review and editing, Y.Z. All authors have read and agreed to the published version of the manuscript.

Funding

This research was funded by Postgraduate Research and Practice Innovation Program of Jiangsu Province, grant number KYCX25_0854; National Natural Science Foundation of China, grant number 42471194; The Taishan Scholar Project of Shandong Province of China, grant number tsqn202306222; General Project of Humanities and Social Sciences of the Ministry of Education, grant number 24YJA790107.

Data Availability Statement

The data are available from the author upon reasonable request.

Conflicts of Interest

The authors declare no conflicts of interest.

Abbreviations

The following abbreviations are used in this manuscript:
DIADigital Industry Agglomeration
CGICorporate Green Innovation
R&DResearch and Development

References

  1. Chen, Y.; Lai, S.; Wen, C. The influence of green innovation performance on corporate advantage in Taiwan. J. Ind. Manag. Optim. 2006, 67, 331–339. [Google Scholar] [CrossRef]
  2. Shahzad, M.; Qu, Y.; Zafar, A.U.; Appolloni, A. Does the interaction between the knowledge management process and sustainable development practices boost corporate green innovation? Bus. Strateg. Environ. 2021, 30, 4206–4222. [Google Scholar] [CrossRef]
  3. Song, W.; Yu, H. Green innovation strategy and green innovation: The roles of green creativity and green organizational identity. Corp. Soc. Responsib. Environ. Manag. 2018, 25, 135–150. [Google Scholar] [CrossRef]
  4. Omonijo, O.N.; Zhang, Y. Examining the relationship between technological innovation, environmental social governance and corporate sustainability: The moderating role of green operational innovation. Hum. Soc. Sci. Commun. 2025, 12, 1–15. [Google Scholar] [CrossRef]
  5. Xiao, H.; Al Mamun, A.; Masukujjaman, M.; Yang, Q. Modelling the significance of strategic orientation on green innovation: Mediation of green dynamic capabilities. Hum. Soc. Sci. Commun. 2023, 10, 777. [Google Scholar] [CrossRef]
  6. Feng, Y.; Wang, X.; Liang, Z. How does environmental information disclosure affect economic development and haze pollution in Chinese cities? The mediating role of green technology innovation. Sci. Total Environ. 2021, 775, 145811. [Google Scholar] [CrossRef] [PubMed]
  7. Yuan, G.; Pan, M.; Qin, F. Digital Industry Agglomeration and Technical Innovation of Manufacturing Industrial Enterprises. J. Zhongnan Univ. Econ. Law 2023, 256, 146–160. [Google Scholar] [CrossRef]
  8. Xiong, W.; Li, J. The knowledge spillover effect of multi-scale urban innovation networks on industrial development: Evidence from the automobile manufacturing industry in China. Systems 2023, 12, 5. [Google Scholar] [CrossRef]
  9. Farboodi, M.; Mihet, R.; Philippon, T.; Veldkamp, L. Big Data and Firm Dynamics. SSRN Electron. J. 2019, 109, 38–42. [Google Scholar]
  10. Wang, C.; Wang, L.; Xue, Y.; Li, R. Revealing spatial spillover effect in high-tech industry agglomeration from a high-skilled labor flow network perspective. J. Syst. Sci. Complex. 2022, 35, 839–859. [Google Scholar] [CrossRef]
  11. Liu, B.; Luo, J.; Zheng, K.; Wu, F.; Zhao, X. How will industrial collaborative agglomeration affect the efficiency of regional green development? Front. Ecol. Evol. 2023, 11, 1179004. [Google Scholar] [CrossRef]
  12. Zeng, W.; Li, L.; Huang, Y. Industrial collaborative agglomeration, marketization, and green innovation: Evidence from China’s provincial panel data. J. Clean. Prod. 2021, 279, 123598. [Google Scholar] [CrossRef]
  13. Jirčikova, E.; Pavelkova, D.; Bialic-Davendra, M.; Homolka, L. The age of clusters and its influence on their activity preferences. Technol. Econ. Dev. Econ. 2013, 19, 621–637. [Google Scholar] [CrossRef]
  14. Hao, A.; Tan, J.; Ren, Z.; Zhang, Z. A Spatial Empirical Examination of the Relationship Between Agglomeration and Green Total-Factor Productivity in the Context of the Carbon Emission Peak. Front. Environ. Sci. 2022, 10, 829160. [Google Scholar] [CrossRef]
  15. Chen, X.; Chen, X.; Song, M. Polycentric agglomeration, market integration and green economic efficiency. Struct. Change Econ. Dyn. 2021, 59, 185–197. [Google Scholar] [CrossRef]
  16. Chen, Y.; Zhu, Z.; Cheng, S. Industrial agglomeration and haze pollution: Evidence from China. Sci. Total Environ. 2022, 845, 157392. [Google Scholar] [CrossRef] [PubMed]
  17. Gilbert, B.A.; McDougall, P.P.; Audretsch, D.B. Clusters, knowledge spillovers and new venture performance: An empirical examination. J. Bus. Ventur. 2008, 23, 405–422. [Google Scholar] [CrossRef]
  18. Zhao, S.; Jiang, Y.; Wang, S. Innovation stages, knowledge spillover, and green economy development: Moderating role of absorptive capacity and environmental regulation. Environ. Sci. Pollut. Res. 2019, 26, 25312–25325. [Google Scholar] [CrossRef] [PubMed]
  19. Mao, J.; Liu, Y. The Impact of Undertaking Industrial Relocation on Green Innovation Efficiency in the Yellow River Basin: A Two-Stage Analysis from an Innovation Value Chain Perspective. Sustainability 2025, 17, 1581. [Google Scholar] [CrossRef]
  20. De Marchi, V.; Schiuma, G.; Grandinetti, R. Knowledge strategies for environmental innovations: The case of Italian manufacturing firms. J. Knowl. Manag. 2013, 17, 569–582. [Google Scholar] [CrossRef]
  21. Ma, L.; Ali, A.; Shahzad, M.; Khan, A. Factors of green innovation: The role of dynamic capabilities and knowledge sharing through green creativity. Kybernetes 2025, 54, 54–70. [Google Scholar] [CrossRef]
  22. Nie, L.; Gong, H.; Zhao, D.; Lai, X.; Chang, M. Heterogeneous knowledge spillover channels in universities and green technology innovation in local firms: Stimulating quantity or quality? Front. Psychol. 2022, 13, 943655. [Google Scholar] [CrossRef] [PubMed]
  23. Peng, J.; Chen, H.; Jia, L.; Fu, S.; Tian, J. Impact of Digital Industrialization on the Energy Industry Supply Chain: Evidence from the Natural Gas Industry in China. Energies 2023, 16, 1564. [Google Scholar] [CrossRef]
  24. Zhao, C.; Liu, Z.; Yan, X. Does the digital economy increase green TFP in cities? Int. J. Environ. Res. Public Health 2023, 20, 1442. [Google Scholar] [CrossRef] [PubMed]
  25. Yang, Y.; Zhu, Y.; Zhang, Y. The impact of digital industry agglomeration on firms’ carbon emissions: New micro-evidence from Chinese manufacturing firms. Environ. Sci. Pollut. Res. 2024, 31, 48332–48350. [Google Scholar] [CrossRef] [PubMed]
  26. Wang, J.; Zhou, S. The Current Situation, Characteristics and Spillover Effect of the Development of Digital Industry in China. J. Quant. Technol. Econ. 2021, 38, 103–119. [Google Scholar]
  27. Li, D.; Zhang, Y.; Li, K. Agglomeration degree, disequilibrium and dynamic evolution of the core industries of China’s inter-provincial digital economy. Stat. Decis. 2023, 18, 103–108. [Google Scholar]
  28. Yi, Z.; Wei, L.; Wang, L. The Effect of Technological Development of Digital Industry on Carbon Emission Intensity. Int. Econ. Trade Res. 2022, 38, 22–37. [Google Scholar]
  29. Zhou, X.; Zhou, D.; Wang, Q.; Su, B. How information and communication technology drives carbon emissions: A sector-level analysis for China. Energy Econ. 2019, 81, 380–392. [Google Scholar] [CrossRef]
  30. Li, H.; Lin, Q.; Jian, Z.; Li, S. An analysis of the internal relationship between the digital economy and resource allocation in manufacturing enterprises. J. Ind. Manag. Optim. 2025, 21, 335–355. [Google Scholar] [CrossRef]
  31. Wolfert, S.; Verdouw, C.; van Wassenaer, L.; Dolfsma, W.; Klerkx, L. Digital innovation ecosystems in agri-food: Design principles and organizational framework. Agric. Sys. 2023, 204, 103558. [Google Scholar] [CrossRef]
  32. Marshall, A. Principles of Economics. Polit. Sci. Q. 1961, 77, 430–444. [Google Scholar] [CrossRef]
  33. Arrow, K.J. Economic Welfare and the Allocation of Resources for Invention; Springer: Berlin, Germany, 1962. [Google Scholar]
  34. Steijn, M.P.A.; Koster, H.R.A.; Van Oort, F.G. The dynamics of industry agglomeration: Evidence from 44 years of coagglomeration patterns. Journal of Urban Economics 2022, 130, 103456. [Google Scholar] [CrossRef]
  35. Jiang, S.; Liu, X.; Liu, Z.; Shi, H.; Xu, H. Does green finance promote enterprises’ green technology innovation in China? Front. Environ. Sci. 2022, 10, 981013. [Google Scholar] [CrossRef]
  36. Han, S.; Zhang, Z.; Yang, S.; Liu, Z. Green Finance and Corporate Green Innovation: Based on China’s Green Finance Reform and Innovation Pilot Policy. J. Environ. Public Health 2022, 2022, 1833377. [Google Scholar] [CrossRef] [PubMed]
  37. Song, Y.; Bian, Z.; Ma, N.; Tu, W. How Does the Low-Carbon City Pilot Policy Affect Enterprises’ Green Innovation? Empirical Evidence from the Context of China’s Digital Economy Development. Sustainability 2024, 16, 1760. [Google Scholar] [CrossRef]
  38. Torres, G.; Correa, Q.; Álvarez, G.; Río, R. Agglomeration Economies: An Analysis of the Determinants of Employment in the Cities of Ecuador. Symmetry 2019, 11, 1421. [Google Scholar] [CrossRef]
  39. Liu, S.; Wu, P. The impact of high-tech industrial agglomeration on China’s green innovation efficiency: A spatial econometric analysis. Front. Environ. Sci. 2023, 11, 1167918. [Google Scholar] [CrossRef]
  40. Cheng, Z.; Jin, W. Agglomeration economy and the growth of green total-factor productivity in Chinese Industry. Socioecon. Plann. Sci. 2022, 83, 101003. [Google Scholar] [CrossRef]
  41. Leyva-De la Hiz, D.I.; Bolívar-Ramos, M.T. The inverted U relationship between green innovative activities and firms’ market-based performance: The impact of firm age. Technovation 2022, 110, 102372. [Google Scholar] [CrossRef]
  42. Lyu, X.; Wen, S.; Li, H. The Impact and Mechanism of Internal Informal Institutions on Green Innovation: Empirical Evidence from Chinese Listed Companies. Sustainability 2023, 15, 15743. [Google Scholar] [CrossRef]
  43. Shi, M.; Zou, T.; Xu, J.; Wang, J. Can Carbon Emissions Trading Scheme Make Power Plants Greener? Firm-Level Evidence From China. Front. Energy Res. 2022, 10, 906033. [Google Scholar] [CrossRef]
  44. Huang, Q.; Yu, Y.; Zhang, S. Internet development and productivity growth in manufacturing industry: Internal mechanism and China experiences. China Ind. Econ. 2019, 8, 1019581. [Google Scholar]
  45. Nunn, N.; Qian, N. US Food Aid and Civil Conflict. Am. Econ. Rev. 2014, 104, 1630–1666. [Google Scholar] [CrossRef]
  46. Stock, J.; Yogo, M. Identification and inference for econometric models: Asymptotic distributions of industrial variables statistics with many instruments. J. Am. Stat. Assoc. 2005, 89, 1319–1320. [Google Scholar]
  47. Rao, S.; Pan, Y.; He, J.; Shangguan, X. Digital finance and corporate green innovation: Quantity or quality? Environ. Sci. Pollut. Res. 2022, 29, 56772–56791. [Google Scholar] [CrossRef] [PubMed]
  48. Wu, B.; Gu, Q.; Liu, Z.; Liu, J. Clustered institutional investors, shared ESG preferences and low-carbon innovation in family firm. Technol. Forecast. Soc. Chang. 2023, 194, 122676. [Google Scholar] [CrossRef]
  49. Jiang, T. Mediating effects and moderating effects in causal inference. China Ind. Econ. 2022, 5, 100–120. [Google Scholar]
  50. Huang, R.; Jin, J.; Sunguo, T.; Liu, Y. The moderating effect of psychological trust on knowledge spillovers and firms’ open innovation. Front. Psychol. 2022, 13, 1071625. [Google Scholar] [CrossRef] [PubMed]
  51. Ben Arfi, W.; Hikkerova, L.; Sahut, J.-M. External knowledge sources, green innovation and performance. Technol. Forecast. Soc. Chang. 2018, 129, 210–220. [Google Scholar] [CrossRef]
  52. Muscio, A.; Nardone, G.; Stasi, A. How does the search for knowledge drive firms’ eco-innovation? Evidence from the wine industry. Ind. Innov. 2017, 24, 298–320. [Google Scholar] [CrossRef]
  53. Bloom, N.; Schankerman, M.; Van Reenen, J. Identifying technology spillovers and product market rivalry. Econometrica 2013, 81, 1347–1393. [Google Scholar] [CrossRef]
  54. He, B.; Tian, S.; Zhang, X. Does the pilot free trade zone policy increase regional innovation ability? Evidence from China. Appl. Econ. Lett. 2025, 32, 576–581. [Google Scholar] [CrossRef]
  55. Shen, Y.; Yang, Z. Chasing Green: The Synergistic Effect of Industrial Intelligence on Pollution Control and Carbon Reduction and Its Mechanisms. Sustainability 2023, 15, 6401. [Google Scholar] [CrossRef]
  56. Zhang, L.; Mu, R.; Hu, S.; Zhang, Q.; Wang, S. Impacts of Manufacturing Specialized and Diversified Agglomeration on the Eco-Innovation Efficiency—A Nonlinear Test from Dynamic Perspective. Sustainability 2021, 13, 3809. [Google Scholar] [CrossRef]
  57. Nie, L.; Wang, Y.; Wu, Y. Service sector agglomeration and industrial structure optimisation: Evidence from China’s resource-based cities. Asian-Pac. Econ. Lit. 2024, 38, 3–21. [Google Scholar] [CrossRef]
  58. Frenken, K.; Van Oort, F.; Verburg, T. Related variety, unrelated variety and regional economic growth. Reg. Stud. 2007, 41, 685–697. [Google Scholar] [CrossRef]
  59. Boschma, R.; Iammarino, S. Related variety and regional growth in Italy. Sci. Technol. Policy Res. 2007, 62, 1–24. [Google Scholar]
  60. Kekezi, O.; Klaesson, J. Agglomeration and innovation of knowledge intensive business services. Ind. Innov. 2020, 27, 538–561. [Google Scholar] [CrossRef]
  61. Wang, L.; Lou, Y.; Zhao, C.; Wu, Y. Collaborative promotion of digital industrial innovation by standards and intellectual property rights: Theoretical framework and future research. Sci. Stud. Sci. 2022, 40, 632–641. [Google Scholar]
  62. Wu, R.; Lin, B. Does industrial agglomeration improve effective energy service: An empirical study of China’s iron and steel industry. Appl. Energy 2021, 295, 117066. [Google Scholar] [CrossRef]
Figure 1. Analytical framework.
Systems 13 00627 g001
Figure 2. Spatial distribution of provincial digital industry agglomeration by type and year (2017, 2019, 2021). (ac) represent Agglomeration, Specialization, and Diversification in 2017; (df) represent them in 2019; and (gi) in 2021.
Systems 13 00627 g002
Table 1. Definition of variables.
SymbolsNamesCalculation Methods
GreCorporate green innovationApplications for green patents
AggDigital industry agglomerationSee variable definitions for details
SpeSpecialized agglomerationLocation entropy
DivDiversified agglomerationThe inverse of the HHI index
AgeFirm ageln (Current year–Registration year)
LevLeverage levelTotal debts/Gross assets
RoaReturn on equityNet profit/Gross assets
CashflowCashflow ratioThe share of operating cash inflows against total assets
FixedFixed assets ratioRatio of fixed to overall assets
RDInnovation inputResearch and development expenditure/Total assets
Fiscal_eFiscal expenditure scaleFiscal expenditure/Gross domestic product
TranTransportation infrastructureLogarithm of highway mileage
Table 2. Descriptive statistics of the variables.
VariablesCountMeansdMinp50Max
Gre10,7985.54336.6420.0000.0001543.000
lnAgg10,798−5.2661.795−11.389−5.195−2.421
lnSpe10,7980.0270.688−2.046−0.0311.022
lnDiv10,798−1.5501.419−2.949−2.0545.943
Age10,7982.9560.2941.3862.9964.159
Lev10,7980.4190.1980.0100.4131.636
Roa10,7970.0430.085−1.8590.0430.880
Cashflow10,7980.0460.071−0.6450.0460.664
Fixed10,7980.1950.1550.0000.1600.954
RD10,7340.0250.0240.0000.0210.272
Fiscal_e10,7980.1910.0640.1070.1680.643
Tran10,79811.6950.9619.46611.97512.896
Table 3. The results of digital industry agglomeration and its different agglomeration modes with firms’ green innovation.
(1)(2)(3)
GreGreGre
lnAgg1.503 **
(0.707)
lnSpe 2.313 *
(1.380)
lnDiv 0.090
(0.375)
Age0.9740.9690.923
(2.975)(2.978)(2.970)
Lev17.311 ***17.314 ***17.145 ***
(4.137)(4.153)(4.098)
Roa16.078 ***16.113 ***15.722 ***
(6.032)(6.074)(5.868)
Cashflow15.301 ***15.464 ***15.786 ***
(5.390)(5.407)(5.520)
Fixed−1.724−1.881−2.728
(5.071)(5.043)(5.191)
RD24.987 *26.583 *29.844 **
(15.105)(15.131)(14.800)
Fiscal_e11.739−0.486−15.083 **
(10.867)(8.082)(6.527)
Tran1.6630.153−0.253
(1.113)(0.621)(0.519)
_cons−21.946−9.977−2.676
(18.145)(14.989)(12.826)
Year FEYesYesYes
Ind FEYesYesYes
N10,73310,73310,733
Adj-R20.1690.1680.167
Note: standard errors are presented in parentheses. The symbols *, **, and *** denote significance levels of 10%, 5%, and 1%, respectively. The same applies below.
Table 4. Instrumental variable examination.
First StageSecond StageFirst StageSecond Stage
(1)(2)(3)(4)
lnAggGrelnSpeGre
IV0.295 *** 0.639 ***
(0.043) (0.067)
lnAgg 10.488 **
(4.882)
lnSpe 4.840 **
(2.195)
Age−0.0741.128−0.0930.780
(0.060)(2.691)(0.060)(2.634)
Lev−0.01318.217 ***0.08917.692 ***
(0.088)(3.761)(0.097)(3.676)
Roa−0.371 *15.865 ***−0.334 *13.596 **
(0.180)(5.926)(0.172)(5.392)
Cashflow0.17118.547 ***−0.20721.343 ***
(0.207)(7.055)(0.222)(7.610)
Fixed−0.825 ***7.3600.039 ***−1.483
(0.116)(7.123)(0.127)(4.969)
RD3.985 ***1.748−0.87847.795
(0.799)(31.005)(0.783)(17.276)
Fiscal_e−17.104 ***172.546 **13.957 ***−74.391 ***
(0.312)(84.675)(0.507)(30.351)
Tran−1.116 ***12.782 **0.282 ***−0.284
(0.037)(5.909)(0.051)(0.879)
Year FEYesYesYesYes
Ind FEYesYesYesYes
KP rk LM statistic52.18 ***102.57 ***
KP rk Wald F statistic46.6192.17
[16.38][16.38]
Adj-R20.6850.2210.4120.220
N10,73310,73310,73310,733
Note: standard errors are presented in parentheses. The symbols *, **, and *** denote significance levels of 10%, 5%, and 1%, respectively.
Table 5. The independent variable lags by one period.
(1)(2)(3)
GreGreGre
L.lnAgg1.522 ***
(0.450)
L.lnSpe 2.209 ***
(1.163)
L.lnDiv 0.193
(0.415)
Age2.4492.4522.438
(1.598)(1.598)(1.600)
Lev22.701 ***22.719 ***22.586 ***
(2.776)(2.777)(2.778)
Roa27.782 ***27.829 ***27.496 ***
(8.055)(8.058)(8.064)
Cashflow21.363 ***21.586 ***21.841 ***
(7.762)(7.764)(7.768)
Fixed−3.370−3.592−4.410
(4.069)(4.070)(4.063)
RD15.96818.03021.478
(24.074)(24.060)(24.047)
Fiscal_e14.1901.314−13.838
(10.909)(9.152)(9.490)
Tran1.806 **0.248−0.129
(0.771)(0.532)(0.514)
_cons−31.554 **−19.090−12.026
(12.834)(11.784)(11.567)
Year FEYesYesYes
Ind FEYesYesYes
N646164616461
Adj-R20.1650.1650.164
Note: standard errors are presented in parentheses. The symbols **, and *** denote significance levels of 5%, and 1%, respectively.
Table 6. Alternative measurements of a firm’s green innovation.
(1)(2)(3)
GregGregGreg
lnAgg0.972 **
(0.435)
lnSpe 1.557 *
(0.839)
lnDiv 0.091
(0.255)
Age−0.215−0.217−0.245
(1.800)(1.801)(1.805)
Lev10.317 ***10.324 ***10.207 ***
(2.445)(2.453)(2.426)
Roa6.412 *6.447 *6.189 *
(3.341)(3.359)(3.262)
Cashflow12.133 ***12.229 ***12.452 ***
(3.938)(3.949)(4.009)
Fixed−0.266−0.342−0.919
(3.048)(3.042)(3.086)
RD2.9583.8916.118
(8.896)(8.874)(8.637)
Fiscal_e5.892−1.596−11.858 **
(6.696)(5.384)(5.201)
Tran0.9760.013−0.259
(0.673)(0.401)(0.361)
_cons−10.720−3.2021.789
(10.361)(8.868)(8.175)
Year FEYesYesYes
Ind FEYesYesYes
N10,73310,73310,733
Adj-R20.2520.2510.250
Note: standard errors are presented in parentheses. The symbols *, **, and *** denote significance levels of 10%, 5%, and 1%, respectively.
Table 7. The results of mediating effect.
(1)(2)(3)(4)
GreSpilloverGreSpillover
lnAgg1.503 **0.556 **
(0.707)(0.273)
lnSpe 2.313 *0.923 *
(1.380)(0.505)
Age0.974−0.6080.969−0.608
(2.975)(1.186)(2.978)(1.186)
Lev17.311 ***2.840 **17.314 ***2.846 **
(4.137)(1.423)(4.153)(1.427)
Roa16.078 ***2.840 *16.113 ***2.865 *
(6.032)(1.619)(6.074)(1.630)
Cashflow15.301 ***4.092 *15.464 ***4.143 *
(5.390)(2.408)(5.407)(2.413)
Fixed−1.7242.276−1.8812.242
(5.071)(2.373)(5.043)(2.364)
RD24.987 *−5.41626.583 *−4.918
(15.105)(5.423)(15.131)(5.394)
Fiscal_e11.7391.271−0.486−2.862
(10.867)(3.446)(8.082)(3.409)
Tran1.6630.3220.153−0.224
(1.113)(0.362)(0.621)(0.281)
_cons−21.946−0.165−9.9774.056
(18.145)(4.741)(14.989)(5.230)
Year FEYesYesYesYes
Ind FEYesYesYesYes
N10,73310,73310,73310,733
Adj-R20.1690.2460.1680.245
Note: standard errors are presented in parentheses. The symbols *, **, and *** denote significance levels of 10%, 5%, and 1%, respectively.
Table 8. Heterogeneity by firm type.
Ht = 1Ht = 0Ht = 1Ht = 0
(1)(2)(3)(4)
GreGreGreGre
lnAgg1.2831.676 **
(0.973)(0.822)
lnSpe 1.9112.768 **
(1.938)(1.332)
Age4.950−7.067 *4.962−7.107 *
(4.010)(3.826)(4.019)(3.838)
Lev26.261 ***0.20926.255 ***0.239
(6.234)(1.909)(6.247)(1.901)
Roa22.696 **1.90722.653 **2.011
(9.177)(2.692)(9.257)(2.672)
Cashflow26.238 ***0.98926.435 ***1.057
(8.685)(3.256)(8.768)(3.205)
Fixed−11.808 *10.954−12.053 *10.990
(6.965)(7.005)(6.998)(6.994)
RD24.405−16.34725.800−14.752
(17.859)(23.535)(17.772)(23.495)
Fiscal_e12.0895.0811.543−7.942
(15.131)(9.483)(11.015)(7.616)
Tran2.3380.4471.048−1.218 *
(1.653)(0.842)(0.873)(0.680)
_cons−45.041 *24.339 **−34.72037.501 ***
(27.276)(10.265)(21.452)(13.805)
Year FEYesYesYesYes
Ind FEYesYesYesYes
N6957377669573776
Adj-R20.0450.3440.0440.344
Note: standard errors are presented in parentheses. The symbols *, **, and *** denote significance levels of 10%, 5%, and 1%, respectively.
Table 9. Heterogeneity by environmental regulation intensity.
ER = 1ER = 0ER = 1ER = 0
(1)(2)(3)(4)
GreGreGreGre
lnAgg0.5111.854 **
(0.349)(0.875)
lnSpe −0.0433.337 **
(1.002)(1.566)
Age1.1721.1121.1011.154
(1.722)(5.012)(1.704)(5.019)
Lev13.275 ***21.997 ***13.217 ***22.047 ***
(2.612)(7.344)(2.590)(7.365)
Roa10.413 ***22.574 **10.296 ***22.619 **
(3.659)(10.020)(3.630)(10.039)
Cashflow8.821 **19.535 *8.972 **19.727 *
(4.271)(10.339)(4.298)(10.378)
Fixed−5.842 **3.152−6.034 **3.043
(2.821)(9.195)(2.886)(9.153)
RD26.11325.93227.557 *26.136
(16.553)(20.328)(16.635)(20.360)
Fiscal_e2.910−1.092−6.070−10.592
(6.502)(13.138)(6.706)(11.892)
Tran1.382 **1.1610.645−0.651
(0.616)(1.426)(0.429)(0.865)
_cons−20.549 **−14.044−12.952−1.367
(10.067)(25.901)(8.465)(22.786)
Year FEYesYesYesYes
Ind FEYesYesYesYes
N5340539353405393
Adj-R20.0950.2220.0950.222
Note: standard errors are presented in parentheses. The symbols *, **, and *** denote significance levels of 10%, 5%, and 1%, respectively.
Disclaimer/Publisher’s Note: The statements, opinions and data contained in all publications are solely those of the individual author(s) and contributor(s) and not of MDPI and/or the editor(s). MDPI and/or the editor(s) disclaim responsibility for any injury to people or property resulting from any ideas, methods, instructions or products referred to in the content.

