Abstract
This paper analyzed the importance of applying modern concepts and tools for monitoring production processes in order to improve effectiveness, efficiency, and sustainable manufacturing. The aim of the study was to develop and apply a stochastic model based on a modified real-time observation method to optimize production cycles in the metalworking industry. The research was conducted over several years in real industrial conditions using instantaneous observations, and the collected data were statistically analyzed using control charts and flow coefficient functions. The results showed a significant reduction in production cycle times and improved efficiency, particularly when the batch size was optimized to 10 units. The analyzed working time elements and flow coefficients enabled a comprehensive analysis and influenced trends in subsequent years, thereby improving production management. A comparative analysis of the results reveals a downward trend in average PC time per unit over the years—56.2, 37.7, 31.5, and 44.8 min from phases I to IV—until the introduction of a new operation. The corresponding flow coefficient functions are y1 = 297.54/x + 2; y2 = 239/x − 7.36; y3 = 192/x + 0.65; and y4 = 438.2/x − 11.3. These findings suggest that the optimal batch size for the enterprise under consideration is 10 units. The findings confirmed that the integration of Lean principles and Industry 4.0 methods contributes to the reduction of non-productive time and better process control. The study provided a simple and effective model for cycle time optimization that can be implemented even in small and medium-sized enterprises.
1. Introduction
Various companies worldwide, regardless of their industry, have recognized the practical benefits of Lean production, Industry 4.0, and other modern approaches to improving business processes. These concepts are applicable not only to large-scale enterprises but also to small and medium-sized organizations, enabling continuous and sustainable development. Their implementation has expanded beyond manufacturing to include production planning, development, transportation, and logistics, demonstrating significant potential for optimization and digitalization across business sectors.
The synergy between Lean principles and Industry 4.0 enables companies to accelerate production cycles through digitalization, optimization of material and information flows, and better resource utilization. For instance, using IoT devices for real-time production monitoring can enhance just-in-time manufacturing and reduce unnecessary delays. Therefore, closely monitoring production cycles, identifying inefficiencies, and optimizing production times and batch sizes are key steps in achieving greater flexibility and competitiveness.
Therefore, it is crucial to closely monitor production cycles, identify waste and inefficiencies, and optimize production times and batch sizes. By doing so, companies can achieve significant reductions in production cycles, increase manufacturing flexibility, and improve market competitiveness.
Numerous studies have examined the key factors that hinder improvements in manufacturing cycle efficiency. For instance, research efforts [1,2] have identified persistent issues such as prolonged lead times, high levels of material waste, inefficient production layouts, and inadequate workforce management. These challenges emphasize the necessity of adopting effective strategies to optimize production processes. Among the proposed solutions is the implementation of structured management systems, including Lean manufacturing and total quality management [3,4,5]. Additionally, the existing literature demonstrates that the application of Lean principles can lead to substantial improvements in productivity and lead time reduction. In particular, practices such as value stream mapping and the elimination of non-value-adding activities are critical for enhancing overall operational efficiency [6,7,8,9].
When comparing the differences, traditional or mass production is considered an outdated paradigm due to the lack of a direct link between production and demand. In contrast, Lean is regarded as a new paradigm, as the production of various models in small batches directly aligns with customer needs, allowing companies to adapt more easily and quickly to market changes. The smaller the batch size, the smoother and more efficient the overall business process becomes. Lean production operates continuously, in a one-piece flow, emphasizing the optimization and integration of machines, materials, people, and facilities [10].
One of the key indicators of production performance, which in today’s modern business environment must be flexible enough to enable timely responses to customer demands, is the length of the production cycle. Numerous methods are used for recording and optimizing production cycles, one of which is the method of real-time observations. Increasingly, modifications of this original method are being applied, taking into account a greater number of time elements within the production cycle—both productive and non-productive—in order to obtain more detailed analyses and potential optimization solutions. Despite the widespread use of Lean and Industry 4.0 principles, existing methods for monitoring and optimizing production cycles often lack a comprehensive approach that includes both productive and non-productive time elements in real-time analysis. This gap limits the ability to fully understand cycle inefficiencies and hinders effective optimization. However, few studies have integrated real-time work sampling with stochastic modeling to quantify both productive and non-productive time elements under real manufacturing conditions. This gap is addressed in this paper. The aim of this study was to develop and validate a stochastic model for analyzing and optimizing production cycle elements using a modified real-time observation method. By quantifying and interpreting both productive and non-productive time, the model enables more accurate process evaluation and supports the implementation of sustainable manufacturing practices.
Therefore, this paper presents a novel modified real-time observation method that integrates a broader spectrum of time components within the production cycle. Developed through extensive multi-year research and validated in multiple enterprises, this method enhances the precision of production monitoring. Additionally, a new model is introduced to support continuous monitoring, detailed analysis, and targeted improvements in production processes, thus contributing to increased flexibility and sustainability in manufacturing. Despite significant theoretical contributions to the field of Lean management and Industry 4.0, existing research rarely includes experimental analyses that incorporate real-time observation and quantification of time elements within the production cycle. In particular, there is a lack of models that simultaneously account for both productive and non-productive time in real industrial conditions. This study addresses that gap by developing a stochastic model based on several years of empirical research.
The paper is structured as follows: The theoretical background and hypotheses are presented first, followed by the research methodology and data collection process. Then, the results are analyzed and discussed, leading to conclusions and recommendations for future research.
2. Theoretical Background and Hypotheses Development
2.1. Lean Manufacturing and Industry 4.0
Lean manufacturing emphasizes waste elimination and process optimization, resulting in cost reductions and increased customer value. Contemporary production paradigms increasingly rely on real-time transparency across all stages of the manufacturing process, enabling early validation of design choices and more agile responses to disruptions. This contributes to greater resource efficiency and productivity.
Modern manufacturing also integrates advanced digital technologies such as the Internet of Things, artificial intelligence, and robotics. These innovations support continuous data collection and analysis, enhancing decision-making and operational efficiency. Such technological integration is reshaping industrial practices and helping manufacturers maintain competitiveness in a rapidly evolving global market [11].
Building on these developments, Industry 5.0 introduces a more human-centric approach by fostering collaboration between people and machines. It aims to balance technological advancements with human intelligence, supporting resilient, sustainable, and personalized production. The focus shifts from purely technological progress toward broader societal goals, underscoring the importance of human involvement in industrial evolution [12].
The integration of these modern methods and technologies allows companies to improve their manufacturing processes, increase competitiveness, and contribute to the sustainable development of the industry.
Many companies in the United States have started applying Lean philosophy to increase efficiency, reduce production cycle times, enhance customer satisfaction, and streamline workflows in the system. This has simultaneously placed significant pressure on changes to the management system, which had previously been focused on supporting traditional production methods (mass production and achieving economies of scale) [13,14].
Today, Lean essentially represents any effort to achieve greater outcomes with less investment. It explores value from the customer’s perspective, and based on the insights gained, processes are redesigned to increase value. The socio-technical effects of global competition force companies to develop and implement new product development strategies in order to provide customers with the highest-quality product in the shortest time, with lower costs, and a faster response to customer demands.
Automation of operations and processes is often mentioned in the literature as one of the directions of development. Sarkis states that production technology is moving towards automation systems and data exchange and that manufacturers are using Industry 4.0 technologies, which can complement human decisions with technologies aimed at decentralizing decision-making [15].
The goal of implementing the Lean approach is to reduce product manufacturing time, which is a key resource for sustainable production, by eliminating the losses that occur during the production process. The development and application of the model are specifically aimed at achieving efficient, high-quality, sustainable, and competitive manufacturing.
Lean construction, based on the general Lean principles of the manufacturing sector, strives to minimize waste and increase customer value. Within this framework, VSM assumes a crucial role by visually representing and optimizing the flow of materials and information across the entire process [16].
VSM equips professionals with the ability to perceive the current state of a process and design an ideal future state [17]. In the construction industry, VSM aids in understanding process interactions, lead times, inventory levels, and other facets of production. VSM empowers users to discern both value-added and non-value-added activities [18]. This is vital as it aids in identifying waste, such as over-production, waiting time, transportation, excessive processing, inventory, motion, and manufacturing defects [19]. Recognizing and eliminating these wastes can enhance efficiency and increase value for the customer [20,21]. The majority of studies focus on theoretical and review-based research related to Lean and its tools, as well as on examining knowledge, attitudes, and perceptions through surveys. However, there are a limited number of studies that investigate Lean within production cycles, particularly through experimental approaches, and that establish a connection between the production cycle, error detection, time waste, and the application of modified methods. Although numerous studies describe Lean tools and principles [16,17,18,19,20,21], most rely on survey-based or qualitative approaches without direct experimental validation. Studies that link Lean practices with actual production cycles are limited and often do not analyze detailed time elements. This paper differs by introducing a stochastic model that quantitatively examines the frequency of specific activities in real-world settings, thus enabling direct process optimization.
Hypothesis 1.
The application of Lean principles and Industry 4.0 contributes to the reduction of the average production cycle time in real industrial conditions.
2.2. Production Cycle and Sustainable Production
The duration of the production cycle is one of the key indicators of successful and sustainable manufacturing. When the production process is efficient, effective, and well-managed, it minimizes resource waste and reduces the amount of scrap and waste generated. As a result, high-quality products can be manufactured in less time and delivered to the end customer on schedule.
The development of a new product and its introduction to the market demands a significant amount of time, and any delays in this process can lead to substantial financial losses for manufacturers [22,23]. In this context, two key production indicators are the level of capacity utilization and the production cycle (PC) time [24]. While the engineering–technological indicator—machinery capacity utilization level—is highly relevant for production and business performance, optimizing time efficiency requires a more detailed assessment of the utilization levels of PC working time elements. A shorter production cycle translates more quickly into higher customer satisfaction.
Companies generally track PC time through documentation, but they rarely analyze the specific elements within the cycle to identify opportunities for time reduction [8]. Klarin et al. demonstrated in [25] that shift-level capacity utilization should be treated as a stochastic variable when determining the overall capacity utilization in the production process. Their study, based on work sampling across 74 companies, supports this approach. This paper builds on the assumption that PC time also represents a stochastic time characteristic of the production process.
According to [22,26], the total PC time (tpc) is divided into production time (tp) and non-production time (tnp). Production time consists of technological time (tt), further broken down into machine operation time (ttm) and preparation-final time (tpf), while non-technological time (tnt) includes control time (tc), transportation time (ttr), and packing time (tpk). Non-production time encompasses various causes of production stoppages, with the most frequent ones identified in this study, such as shortages of raw materials (tmr), tools (ttl), organizational delays (to), machine breakdowns (tb), and other influencing factors (tot).
The movement of workpieces is a crucial aspect of monitoring PC time, as the sequencing of operations can be consecutive, parallel, or a combination of both, typically dictated by the type of production. The organization of these sequences significantly affects production time, especially in small-batch and serial manufacturing. In consecutive sequencing, an entire batch must complete one machine operation before progressing to the next, whereas in parallel sequencing, each piece advances to the next operation immediately upon completion. A combined approach introduces elements of both methods to mitigate the disadvantage of machine idling.
The optimization of production and business processes has become the target point that all companies strive for. Traditional analytical tools, used to increase process efficiency and reduce costs, have mostly focused on physical processes that participate in every phase of production, while alternative methods of increasing efficiency view the process as a whole and optimize the integration of each phase of production [27].
The integration of all processes within a company, in itself, has the primary goal of ensuring a system that will provide the right information at the right time and in the right place.
Hypothesis 2.
A higher frequency of stoppages correlates with a higher percentage of non-productive time within the production cycle.
2.3. Monitoring the Elements of Working Time
Monitoring the elements of working time by applying the method of work sampling was first practiced by Tippet [9], who used a binomial distribution to follow only three elements of the working time—the machine is running, the machine is in preparation, and the machine is at a standstill. Back in the year 1962, Planus [28] concluded that in many enterprises, stoppages between operations amount to as high as 90% of the total cycle duration. It often happens that a product whose PC was one month actually requires only one day of pure work, with the rest of time accounting for preparations, stoppages, delays and failures in labor coordination, and the like in a way that the area of the enterprise is most often proportionate to the time wasted in it. In surveys conducted by Rosenblatt and Lee [29], Yeh et al. [30], and Porteus [31], the deterioration of the production process is assumed to be a random process. Over the past several decades, various models for dealing with the production cycle have been studied by many researchers. In the approach proposed by Hanssmann [32] during each production cycle, a product is produced once and the cycle time of every product is identical. The importance of the production cycle is emphasized by Agrawal et al. [33], who presented an approach to production planning by means of targeting minimal product cycle times. Certain works [30,34] consider the impact of machine breakdown on production cycle time, while Kun-Jen et al. [35] propose an inventory model linked to production cycle optimization. Rappold and Yoho [36] explore a production policy in which the length of the production cycle is kept between a lower and upper limit, while Taleizadeh et al. [37] determine the optimal cycle length of each product through cost function minimization. Sattler [38] used a queuing curve approximation to determine the productivity improvement of particular machine sets and provided a basis for cycle time adjustment. Fowler et al. [39] developed sampling strategies to quickly generate the simulation-based cycle time throughput curve, while Yu and Huang [40] analyzed the relationship between the product cycle time and the operation tool. Giri and Jun [34] consider an economic manufacturing quantity problem with two failures in each production cycle. Recently, Kuo et al. [41] proposed a manufacturing intelligence approach based on neural networks to analyze production data and tool data for cycle time reduction. Further investigations are proposed to analyze the trade-off between cycle time, yield, and throughput to develop an optimal strategy for throughput and cycle time increase [42]. The authors emphasize the importance of smart production, model development, modeling, production monitoring, process control, and defect research [43,44,45,46,47].
Traditional order-oriented production methods are gradually shifting to service-oriented production methods [48]. Through information technology, enterprises can realize real-time control of the production process of the workshop, timely adjust production plans according to market changes or customer needs, improve market response speed, optimize manufacturing resources, improve production efficiency and reduce costs, and improve core competitiveness [49,50].
Hypothesis 3.
The application of a modified work sampling method in real time enables more accurate quantification of cycle elements and their optimization.
The aim of this research is to develop and apply a stochastic model for optimizing the duration of the production cycle and its working time elements.
Three research hypotheses were tested:
H1: The application of Lean principles and Industry 4.0 contributes to the reduction of the average production cycle time.
→ Tested by comparing PC time and efficiency across four years, before and after intervention.
H2: A higher frequency of stoppages correlates with a higher percentage of non-productive time.
→ Evaluated by observing and comparing tnp values in relation to specific stoppage causes over time.
H3: The application of a modified work sampling method enables a more accurate quantification of cycle elements and supports their optimization.
→ Confirmed by measuring the improved accuracy of time allocation and reduction of deviation after model implementation.
The methodology ensured that the developed model was not only statistically grounded but also practically applicable, even in resource-constrained industrial settings.
3. Methodology
The research was conducted over a period of four years at a Serbian metalworking company specializing in automotive components. Each year, ongoing production cycles were observed involving the same machines. Data were collected through instantaneous observations based on the assumption of stochastic and normal distribution. Annual data collection throughout the four-year study provided a reliable representation of production behavior.
The data collection process involved three phases: preparation, observation, and analysis. Preparation included selecting representative machines—approximately 25% of the total—and identifying bottlenecks. Daily observation lists and paths were predefined.
The recording period was determined based on production cycle length and repeated under similar conditions to ensure statistical reliability. The sample’s adequacy was measured using control limits and standard deviation. Observations were performed across multiple workstations sharing common characteristics, increasing sample coverage and allowing faster data collection.
To ensure unbiased data, two key conditions were fulfilled: a sufficiently large number of recorded states and random time intervals between observations. Each observation was logged into a recording sheet corresponding to one production cycle, noting the frequency of individual work states. As established in prior research [35], the greater the number of observations, the more accurately the results reflect actual working conditions. Therefore, capturing as many production cycles as possible over a longer period is essential for ensuring reliable data. The newly established model should enable high-quality monitoring and analysis of PC time, which will result in less freezing of assets, a decrease in inventory levels, and a higher turnover of assets in production processes, with the end result of increasing competitiveness and production.
The selection of 25% of the machines was based on recommendations from previous studies [51], which demonstrated that a sample of 20–30% is sufficient for reliable assessment when analyzing homogeneous work centers with similar operations.
The observation time is related to the production cycle length and must be at least equal to the cycle duration, repeated multiple times under consistent conditions to ensure representativeness.
Observation schedules were predefined, but the time intervals between observations were determined using random number generation within each shift to avoid systematic bias.
Sample representativeness is assessed using standard deviation and control limits, treating working time elements as process functions. Observations are conducted across multiple workstations sharing common characteristics, increasing sample coverage and reducing data collection time.
To ensure unbiased data, a sufficient number of states must be recorded, and observation times should be randomly distributed. Observations are logged on recording sheets corresponding to one production cycle, noting the frequency of individual work states.
The greater the number of observations, the more accurate and representative the results, making it essential to capture as many production cycles as possible over an extended period. Therefore, the study was conducted in three different enterprises, with repeated observations to gather a larger dataset for comparative analysis.
Recording sheets include the number of machines and daily observations. The number of observations can be mathematically determined based on the desired accuracy and allowable error.
The collected data were analyzed using statistical control methods, including standard deviation and control limits (±3σ), to assess stability and variation in production performance.
The format of the observation sheet depends on the number of observations made during the day. The number of observations can be determined based on the diagram showing the relationship between accuracy and the number of measurements.
The formulas used are provided in Appendix A.
The method of instantaneous observations (MTZ) is based on random discrete observations, unlike continuous recording, which is impractical and uneconomical, especially for many machines over long periods. The MTZ provides satisfactory accuracy based on the law of large numbers—the higher the number of observations, the more reliable and closer to reality the results are. Although continuous recording may serve as an alternative to the MTZ, it is not the only available approach for collecting data on work processes. Several other methods are also used in work analysis, each with its own limitations. One of the most commonly applied techniques is time study, which involves direct observation and stopwatch-based measurement of the duration of individual activities. While this method provides high accuracy, it requires the constant presence of an observer, making it time-consuming and logistically demanding, particularly when analyzing a large number of workstations.
Another alternative is video analysis, which involves recording work processes with a camera and conducting subsequent analyses. Although this method allows for detailed insights into work structure, it requires technical equipment, additional time for video processing, and trained personnel, all of which increase costs and reduce efficiency in industrial settings.
Automated data collection systems, such as sensors and devices used in the context of Industry 4.0, are also increasingly utilized. These systems enable continuous and precise monitoring of processes, but are often associated with high implementation costs, complex maintenance, and the need for integration into existing infrastructure. This limits their wider application, especially in small and medium-sized enterprises.
In this context, the MTZ, along with its modified variants, stands out as an affordable and sufficiently reliable solution that enables the collection of representative data with minimal investment, no need for complex equipment, and relatively simple organizational requirements. These modified approaches have further increased its applicability and adaptability to various industrial environments, making the MTZ a practical choice for productivity analysis, especially in conditions where resources are limited and observation needs to cover multiple workstations over extended periods.
Four-week cycles were selected because they match the average production series length at the company and allow for the accumulation of sufficient observations for statistical analysis. Unlike existing deterministic models, the proposed stochastic model uses a binomial distribution and includes both productive and non-productive time elements, resulting in a more realistic representation of the actual production process.
During the research period, a series of interventions were introduced aimed at improving production efficiency in accordance with the Lean principles and elements of Industry 4.0. The core of the applied Lean approach was the systematic identification and reduction of waste—primarily in the form of non-productive time—using the method of instantaneous observations (MTZ).
By monitoring work processes across multiple machines in real time, the MTZ enabled the detection of delays and idle periods that did not contribute to value creation, such as waiting for materials, machine breakdowns, or organizational inefficiencies. This aligns directly with Lean tools such as waste mapping (muda detection) and cycle time analysis, which focus on streamlining processes by eliminating non-value-adding activities. Although no major structural or automation changes were introduced during the observation period, continuous improvement actions were taken based on the insights provided by the MTZ analysis. These included better material supply coordination, preventive maintenance scheduling, and improvements in work organization. This approach also reflects the Industry 4.0 philosophy to the extent that data-driven decision-making was applied—observational data served as the basis for evaluating process performance and making targeted improvements, albeit in a low-tech form.
4. Results
Contemporary PC optimizations are often deterministic, arbitrary, and sometimes subjective methods or special cases involving extensive mathematical calculations. Methods applicable in everyday factory use require a new approach that is as simple as possible, yet objective, justifiable, and consistent. The main stages and model steps are presented in Figure 1. The model is the result of our research and outlines the steps that need to be implemented. The process begins with familiarization with production and training for observation (Steps 1–2), followed by identifying the series under observation and recording data using a structured sheet (Steps 3–4). The recorded data are then entered into an Excel file for processing (Step 5), after which calculations are performed to determine the duration and share of various cycle elements in terms of frequency, percentage, and minutes (Step 6). Next, the average production cycle time per series is calculated (Step 7), along with the standard deviation and control limits (Step 7, second box). The results are visualized in a diagram showing the behavior of observed work time elements (Step 9) and analyzed for bottlenecks and non-productive time (Step 10). Finally, based on these insights, the optimal production series is experimentally determined (Step 11), closing the loop and allowing for process improvements.
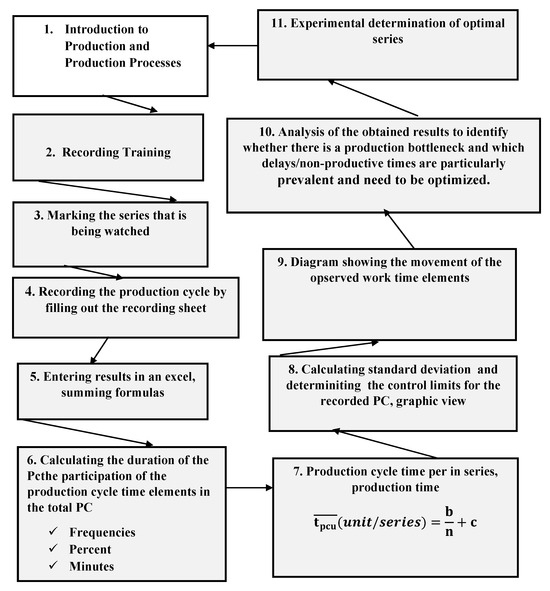
Figure 1.
Stochastic model for optimizing production cycles aimed at sustainable production.
A modified work sampling method application will enable the determination of the participation percentages of working time elements against the total duration of the production cycle [16]. It consists of current observations of PC time elements at randomly chosen times. Frequencies of certain time elements are recorded in the screening list, related to one PC. The data in Table 1 are thus formed. Using the frequencies, the percentage of the individual elements against the total PC time is calculated [26]. The model is very simple to apply even in SME and is based on statistical calculations lately.

Table 1.
Production cycle elements by percentage of elements.
The organization of the operations sequence in a medium-sized metalworking enterprise with a small series production, where screenings were performed, was of the consecutive type. The monitoring included 158 cycles of different series sizes (4–10 pieces). Using the frequencies, the percentage of the individual elements against the total PC time is calculated, as shown in Table 1. Time values are in minutes; percentages refer to the share of total cycle time. The screening results are shown in Table 2 for years I, II, III, and IV.
Table 2.
PC mean values, mean production time per cycle, pieces in a series, in minutes, and production time and control limits acceptance control (AC) and boundary control (BC) in %.
Table 2 and Figure 2a,b show the production cycle time, PC mean time, mean production time per cycle, and pieces in a series, in minutes, and production time tp and the control limits acceptance control (AC) and boundary control (BC) as well as SD in % for years I–IV. By examining Table 2, which presents data for the four years of the study—the first, second, third, and fourth years—it can be observed that the average productive time significantly reduced from 249 min (76.4%) in the first year to 193 min (79.77%) in the third year. This improvement is attributed to enhanced organizational efficiency and the stabilization of production processes. However, in the fourth year, the average productive time increased again to 263 min due to the integration of a new operation lasting 30 min throughout the year.
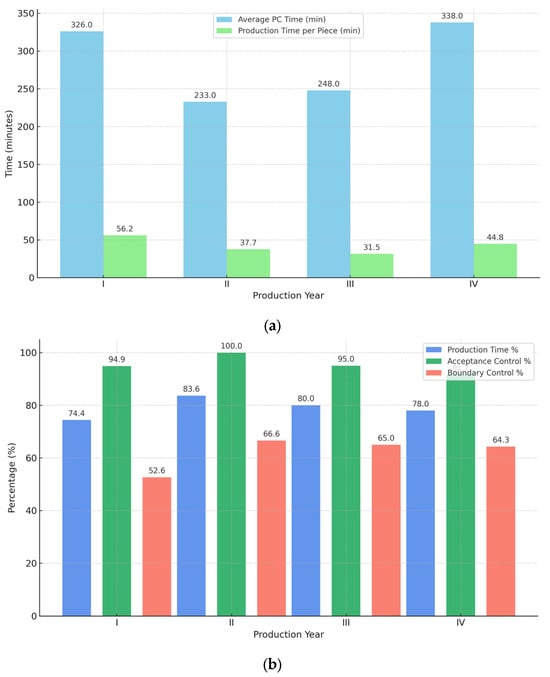
Figure 2.
(a) Average PC time and production time per piece. (b) Production time and control limits by year.
Figure 2a compares the average total PC time and the average production time per piece for each year (I–IV). It illustrates a noticeable reduction in both metrics in years II and III, indicating improved efficiency following process interventions. Figure 2b shows the percentage of TP, AC, and BC for each year. The highest production efficiency and control precision are observed in years II and III, as evidenced by high AC values and narrowed control ranges.
Figure 3 illustrates the production time percentage (tp %), acceptance control (AC %), and boundary control (BC %) across four production cycles (I–IV). Cycle II shows the highest production time efficiency (100%), while Cycle I has the highest BC % value, indicating a broader control limit. The AC % values are highest in Cycles II and III, showing more rigorous acceptance control in those cycles.
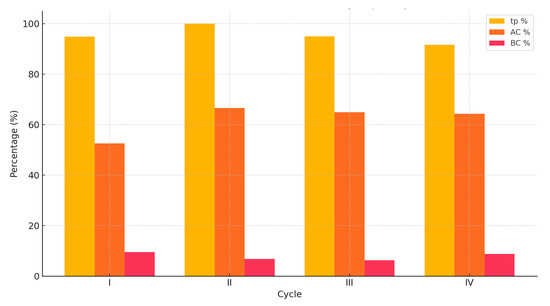
Figure 3.
Production and control percentages.
Figure 4 compares key time-based production metrics across four cycles (I–IV). Cycle II demonstrates the highest production efficiency (tp/min) and the shortest time per piece (tp/piece), indicating optimal performance. In contrast, Cycle IV has the highest total production time, suggesting a longer process duration despite moderate efficiency.
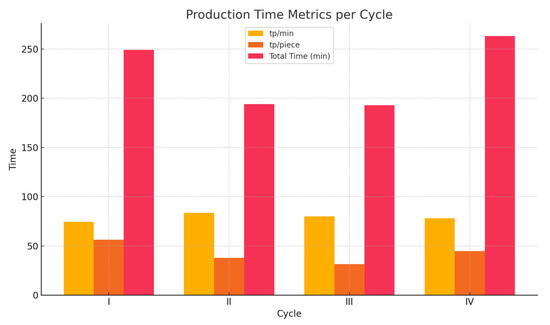
Figure 4.
Production time metrics per cycle.
The results for screening PC during the first year (Figure 2a,b) show that the percentage of production time tpn mean value equals 74.35%, while the control limits are AC = 96.06% and BC = 52.64%. Figure 3 displays the trend of the longest time—technological machine tm, where it is noticeable that the process is also mastered and that the control limits are also set within narrow limits: CC = 24.4%, AC = 30.1%, and BC = 18.7%. The flow coefficient function for the first year is shown in Figure 4.
It is obvious from Figure 4 that, mathematically viewed, the process is mastered, because all the points lie within the control limits BC < AC (54.1 < 76 < 97.9). The trend of (tpcui), i.e., the flow coefficient, can be approximated by the function
where n is the number of pieces.
This bar chart displays the number of pieces produced in each production cycle (Figure 5).
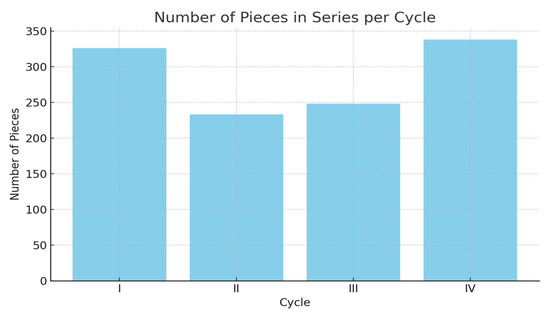
Figure 5.
Number of pieces in series per cycle.
Cycle IV leads with the highest number of pieces (338), followed closely by Cycle I (326), indicating a higher output capacity in those cycles. Cycle II has the lowest number of pieces, suggesting either a shorter production run or higher complexity.
Experimental investigations proved that mean productive time ranges according to normal distribution, as in Figure 6, and the formula Y = a/x + b, where a and b are constants, Y is the productive time per piece in different series, and x is the number of pieces per series. Experimental determination of the optimal order quantity enables anticipation of the required lot size in the following year based on previous year data.
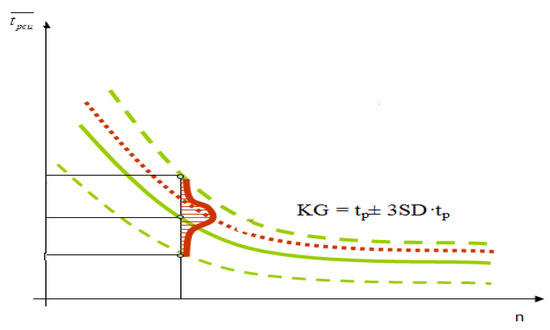
Figure 6.
Trend of mean productive time according to normal distribution.
Also, emphasis should be placed on a large number of papers dealing with the problem of production cycle on the assembly lines, of which the most prominent works are by Hu et al. [52] and Kumar & Dalgobind [53], who employ the calculations of time for the assembly line, using the binomial and normal distribution, and also the work by Hackstein & Budenbener [54], which reports the results of monitoring the production cycle performed by semi-automated means in a flexible manufacturing system in German industry.
Bottleneck control in real-time production [55], prioritizing machine fleet preventive maintenance [56], spare parts inventory for maintenance, optimization of initial buffer adjustment [57], reduction of machine setup time [58], and predicting order lead times [59], can lead to production effects improvement and manufacturing cycle time reduction [60].
Although the production cycle—defined as the time from the initiation of production to the completion and packaging of the final product—is a critical factor in manufacturing efficiency, there is still a noticeable lack of research addressing the monitoring and optimization of its duration and the contribution of its time components in practical industrial settings.
This paper deals with the problem of simultaneous determination of the economic manufacturing quantity and the production cycle time that, as a result, offers a simple and low cost method of determining manufacturing.
Figure 7 illustrates the trends of mean production time per unit across various series sizes, providing insight into the comparative efficiency of different batch configurations. The diagram reveals that 10-piece series consistently achieve the shortest average production times, while smaller series (e.g., 4- or 5-piece) result in longer times per unit. This indicates that increasing the series size of up to 10 pieces contributes to better time efficiency. However, further increases might lead to process imbalances or work-in-progress accumulation. Therefore, this figure supports the recommendation to stabilize the batch size to around 10 units as an optimal configuration for the observed manufacturing process.
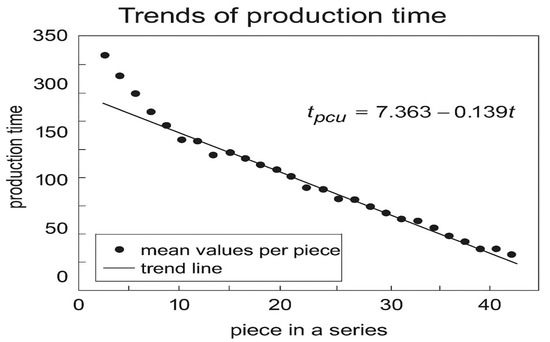
Figure 7.
Trends of production time mean values per piece in a series .
In prior research, the coefficient of running time was used primarily as a baseline for determining series size. However, these investigations lacked a comprehensive analysis of inter-series relationships. Our updated approach corrects this gap by grouping the data and focusing on the PC time per unit (tpcu) and the percentage of PC time (tp) for each group, along with the corresponding standard deviations (SDp).
During the second year, a supplementary experiment was carried out to evaluate the improvements achieved after modifications to the production model. Observations were conducted across 30 production cycles, each comprising between 17 and 26 instances, yielding an average of 21 observations per cycle and a total of 644 recorded data points.
During the first year of observation, several inefficiencies in the production process were identified and addressed through targeted modifications. Firstly, high non-productive time (25.19%) was reduced by applying a revised observation method that enabled more accurate monitoring and identification of idle periods. Frequent material shortages (tmr = 1.42%) were mitigated by improving procurement planning and enhancing communication with suppliers. To address machine breakdowns (tb = 1.6%), preventive maintenance protocols were intensified, and technical diagnostics were optimized. Additionally, the initially used batch sizes led to prolonged cycle times per unit, prompting experimental validation that confirmed a 10-piece series as optimal for time efficiency. Real-time monitoring was also enhanced through the implementation of a modified work sampling method and control charts, allowing better visibility and process control. Lastly, standardized work procedures were introduced through operator training and the harmonization of practices across similar workstations. These improvements laid the foundation for the enhanced performance observed in the second year, notably reflected in reduced production time per piece and increased process stability, as presented in Table 2 and Figure 2a and Figure 3.
The updated chart now visually depicts that mean production time decreased significantly—from 325 min to 233 min on average. Following the application of the model, there was a 28% reduction in production cycle duration, and the average cycle time dropped from 35 to 17 min. This is confirmed by the control limits shown in the new graphic, with a mean value of 83.60%, bounded by BC = 66.66% and AC = 100%.
The recalculated trend coefficients, now c = 7.363 and b = 239, better reflect the adjusted production dynamics and affirm the positive effect of the intervention. The improved visual format also helps underscore these changes more intuitively. It is noticeable from the diagram in Figure 8 for the third year that the number of pieces in a series can be higher than the current one and that the 10-piece series has a significantly shorter time than the 4-piece series. This means that the tendency should be to have a 10-piece series in the manufacturing process; however, a question is posed as to whether a further increase will disturb the optimal organization of workplaces and cause an accumulation of pieces, leading to an increase in time per piece.
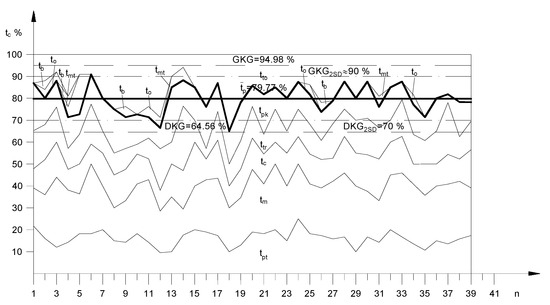
Figure 8.
Diagram of PC working time elements for the third year.
Comparing data for the second year, it is evident that across all PC strata, from those with 4 pieces to those with 100 pieces, the average production time decreases, with the 4-piece series reducing from 72.48 min to 35.67 min. This means that there should be a higher number of cycles for 8-, 9-, and 10-piece series, and not for 5-, 6-, and 7-piece series, because this caused the reduction in the total production time from 194 min in the second year to only 193 min in the third year. However, production time increased to 263 min in the last year, due to a smaller number of pieces in a series.
To illustrate the trends in and dynamics of movement, the results are also presented graphically. Figure 8 shows the behavior of work elements through a polygon diagram. The areas between the two lines represent the magnitude of the time elements within the production cycle. The diagram indicates that there are no significant oscillations between the highest and lowest values across individual cycles. The movement of production time is fully under control, as all values fall within the control limits defined by ± 3 SD, according to the formula KG = ± 3 SD. The upper control limit GKG is 100%, while the lower control limit DKG is 64.56%. The process is also considered to be in control according to the control limit criterion of ±2 SD, with the upper control limit GKG at 89.91% and the lower control limit DKG at 69.63%. Only cycle no. 6 reaches the upper control limit, while the value of cycle no. 18 touches the lower control limit.
Figure 9 shows a diagram of the trends in PC working time elements for the last—fourth—year.
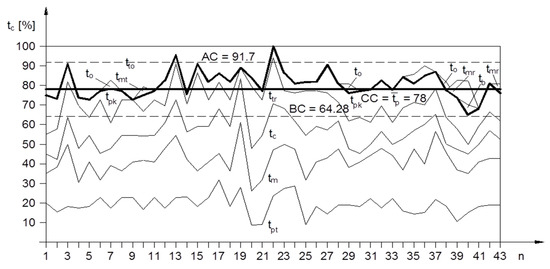
Figure 9.
Trends in PC working time elements for the fourth year.
The total time of 43 production cycles amounts to 14,526 min. This gives an average production cycle time of
14,526/43 = 338 min
The total productive time across all cycles is 11,301 min.
The average productive time per cycle is
11,301/43 = 263 min
The average productive time per cycle, expressed as a percentage, is calculated by summing the individual productive time percentages and dividing by the number of cycles:
3317.35/43 = 77.98%
The standard deviation is calculated using the formula for a normal process function.
The control limits shown in the diagram in Figure 9 are determined according to the formula
KG3 = ±3 · SD(tp)
KG3 = 77.98 ± 3 · 77.98 · 0.0878
GKG3 = 91.67%
DKG3 = 64.28%
The flow coefficient function has the form y1 = 297.54/x + 2; y2 = 239/x − 7.36; y3 = 192/x + 0.65; and y4 = 438.2/x − 11.3.
Some of the main types of waste in production include the following:
Excessive movement—unnecessary motions by workers or equipment, such as material relocation, bending, or poorly organized workspaces, leading to fatigue and potential injuries. Reorganizing workstations and implementing ergonomic solutions can significantly improve efficiency.
Waiting—delays in the production process where products spend most of their time idle, waiting for processing. In serial production, studies show that up to 90% of the time, goods remain unprocessed, slowing down overall workflow.
Overproduction—manufacturing products without immediate demand, leading to increased costs, additional storage requirements, and artificial demand creation through marketing. The Lean concept promotes a “pull” production approach, ensuring that products are made only when there is a real need.
In addition to these theoretically recognized types, our research—based on four years of direct observations within the selected company—confirmed the presence of such waste in practice, particularly through the identification of specific time losses and inefficiencies within production cycles.
Therefore, continuously monitoring and optimizing production using modern concepts is crucial. One possible solution is a developed stochastic model, which enables better forecasting, adaptation, and more efficient resource management within the production process.
5. Discussion
The most significant indicator, the production time percentage, was the lowest in the first year, amounting to 76.4%, and in the second and third years, it was 83.6% and 79.77% due to production running-in, whereas in the last year, it dropped to 78% because of the introduction of a new operation. The highest percentage of production time applies to the manufacturing time ttm by years: I–24.6; II–25.9; III–23.76; and IV–22.4%; and manufacturing lead time: I—10.9; II–16.82; III–16.15; and IV–19%, which together make up technological time tt. It can be noticed that the percentage of manufacturing lead time is high for the metalworking industry, so PC could be reduced by reducing the manufacturing lead time.
In the first year, investigation of this PC time amounted to only 10.7% for the same technological time—24.6% and 23.73%. This could have been caused by the capacity extension phase the enterprise was undergoing, and thereby the machine shop reconstruction as well.
Average production time, in minutes, in year II = 193 min, with tp% = 79.77%. Non-production time equals 54.8 min or tp % = 20.23%.
Observing data for the four study years, we can see that the average production time significantly reduced, from 249 min (76.4%) to 193 min (79.77%). However, due to raising the organizational level and production running-in and introducing a new 30 min operation, production time again increased to 263 min. Within the production time, the manufacturing time ttm has the smallest oscillations by years: 24.5%, 25.2 9%, and 23.73%. Manufacturing lead time steadily increased from 10.7% to as high as 19% in the last year, when 30 min operation was introduced.
The mean production time tp by years is (74.35; 83.6; 79.77; and 78%), with an SD of (9.49; 6.8; 6.35; and 8.78%). This indicates that the processes are mastered, that standard deviation follows production time mean values, and, as expected, that higher values yield a smaller error for years II and III, but a bigger one for years I and IV, thus supporting the fact that conditions of production organization have not been substantially changed.
Therefore, taking the error with ±3 SD, the control limits are such that they do not exceed the production time mean values.
During the last year, the technological machine time (main time) tm was the longest, amounting to 22.4% and 75.7 min/piece, respectively. The second longest time was the manufacturing lead time tpt, amounting to 19% and 64.2 min, respectively. Control time tc equaled 14.1% and 47.6 min, respectively. Transport time was 14.9% and 50 min, respectively, whereas total production time amounts to 80.13% or 271 min.
Within the non-production time tnp, in the period of four years, stoppages due to the lack of raw materials significantly decreased, from 1.42% (II) to 0.99% (III). Also, stoppages due to machine maintenance and breakdown tb reduced from 1.6% (II) to 0.36% (III).
Total non-production time tnp drastically reduced from 25.19% in I to 16.4% in II; however, it was again 20.33% in year III and 22% in year IV.
There are no large oscillations by individual cycles. The process of production time trend is completely mastered because all values are set within the control errors ± 3 SD. This is represented by the formula KG = tp ± 3 SDtp, where GKG = 94.98% and the lower control limit GKG = 64.56% for year IV.
In the third year, the manufacturing lead time tpt increased at the expense of machine time tm, so in the second year, tpt was 14.53% and tm 44.97%; in year II, tpt was 21.18 and tm 40.11%; the sum of the time of control tc, transport ttr, and packing tpk for 2017 amounted to 24.64% (12.34, 6.15, 6.15) for year II and 23.46% (11.66, 6.11, 5.79) for year III. In non-production time tnp, the only significant difference between PC times is in maintenance and stoppage times, where in year II, it was 1.91%, and in the third year it was only 0.13%, resulting in a total production time difference from 14.78% in year II to 12.7% in year III.
The trends of all PC elements, including mean production time and control limits, for the last year indicate that the introduction of a new operation requires better mastery.
Improvements were made possible through the application of the model, which enabled the comparison and analysis of production cycles and times. This allowed for the identification of time losses by revealing previously unnoticed errors and highlighting the most frequent and recurring bottlenecks. One production bottleneck was identified and resolved by introducing an additional operation, which significantly improved the quality of both the production process and the final products. Defining and implementing the optimal batch size contributed to the optimization of production times. The shorter the product remains in the production process, the more effectively non-value-adding steps can be eliminated, leading to improved energy efficiency, reduced waste generation, and more timely responses to customer demands and market needs.
The verification of the hypotheses was carried out based on the statistical results presented in Table 2.
Hypothesis 1: The application of modern methods and concepts such as Lean and Industry 4.0 positively impacts production processes and the pursuit of sustainable production.
Result: Confirmed. Table 2 shows a statistically significant decrease in average production time across the observed years (p < 0.05), indicating improved efficiency and alignment with sustainability goals.
Hypothesis 2: The duration of the production cycle is one of the key indicators of successful and sustainable manufacturing.
Result: Confirmed. This is supported by the observed reduction in non-productive time, which fell from 25% to 16.4%, primarily due to fewer stoppages caused by raw material shortages and equipment failures (Table 2).
Hypothesis 3: The application of work sampling methods in real time enables the identification and reduction of production cycle idle times, thereby significantly decreasing total cycle duration and increasing the efficiency of the production system.
Result: Confirmed. The use of the MTZ method enabled the timely identification of downtime causes, contributing to the steady decrease in average cycle time (from 364 min to 302 min) and an increase in the share of productive time. These trends demonstrate the method’s effectiveness in improving production system performance.
This study contributes to both theory and practice by offering a simple yet statistically grounded model for production cycle optimization, applicable even in small and medium-sized enterprises. Its limitations include the specific industrial sector analyzed and the limited number of participating companies. Future research should extend the model’s applicability across different sectors and technologies to validate its generalizability.
A comparative analysis of the results reveals a declining trend in average production cycle (PC) time per piece across the years, until the introduction of a new operation. The values were 56.2, 37.7, 31.5, and 44.8 min from year I to year IV, respectively. The corresponding flow coefficient functions are
y1 = 297.54/x + 2,
y2 = 239/x − 7.36,
y3 = 192/x + 0.65, and
y4 = 438.2/x − 11.3.
These findings suggest that the optimal batch size in the analyzed case is likely around 10 pieces. Furthermore, by analyzing the screened elements of working time and flow coefficients, it was possible to assess their trends and impact on the subsequent year, thereby enabling more effective production management.
6. Conclusions
Our empirical findings, based on a methodology that can be easily implemented even in SMEs, provide valuable insights into various managerial challenges related to investment decisions aimed at reducing product-specific cycle times and implementing process redesigns.
The analysis conducted demonstrated that applying the proposed model enabled a clearer understanding of production time structure and inefficiencies. It facilitated the identification of hidden errors and recurring bottlenecks, one of which was effectively addressed through the addition of a new operation—resulting in measurable improvements in both process stability and product quality. Furthermore, determining the optimal batch size proved essential for cycle time optimization. Reducing the product’s time in the production flow allowed for the elimination of non-value-adding activities, leading to better energy utilization, less waste, and faster adaptation to market and customer demands.
Based on these insights, it is recommended that future research focus on a more accurate determination of the optimal series size, which may be empirically established using the flow coefficient.
In comparison to traditional deterministic models, the proposed stochastic approach—based on a modified real-time work sampling method—offered a more realistic and flexible way to evaluate production cycle elements in real industrial environments. Unlike continuous time recording, video analysis, or automated sensor-based systems, which often require significant resources, the MTZ method and its modified variants enable reliable data collection with minimal investment and organizational complexity. These advantages make it particularly suitable for small and medium-sized enterprises (SMEs) and environments with limited technical infrastructure. This directly addressed the central research problem of how to optimize cycle time under variable production conditions by enabling detailed quantification of both productive and non-productive time components. This study contributes to the development of theory by bridging the gap between Lean/Industry 4.0 principles and real-time stochastic analysis, which is still insufficiently explored in the literature. Nonetheless, the research has limitations: it was conducted within a single industrial sector with a limited number of participating companies. Future research should aim to validate the model across diverse industries and investigate the influence of different production structures and technologies on its applicability.
Author Contributions
S.S. Writing—original draft preparation, project administration and writing—review; D.Ć. conceptualization and supervision.; M.K. methodology and formal analysis; V.G. data curation and conceptualization; M.B. editing and writing—review; L.D. visualization and writing—review; S.U. validation and investigation. All authors have read and agreed to the published version of the manuscript.
Funding
This paper has been supported by the Provincial Secretariat for Higher Education and Scientific Research of the Autonomous Province of Vojvodina, number 003099809 2024 09412 003 000 000 001-02.
Data Availability Statement
The raw data supporting the conclusions of this article will be made available by the authors on request.
Conflicts of Interest
The authors declare no conflicts of interest.
Abbreviations
| Abbreviation | Meaning |
| n | Number of items for production in a series |
| SD | Standard deviation |
| PC | Production cycle |
| tp | Production time |
| tnp | Non-production time |
| tt | Technological time |
| ttm | Machine operation time |
| tpf | Preparation—final time |
| tnt | Non-technological time |
| tc | Control time |
| ttr | Transportation time |
| tpk | Packing time |
| tmr | Stoppage due to materials |
| ttl | Stoppage due to tools |
| to | Stoppage due to organization |
| toi | Time of individual operations |
| tb | Machine breakdown time |
| tot | Stoppage due to other factors |
| tpc | Production cycle time |
| tpt | Set-up time |
| tm | Manufacturing time |
| tpn | Mean production time |
| tp/piece | Production time per piece |
| AC | Acceptance control limit (upper control limit) |
| BC | Boundary control limit (lower control limit) |
| KG | Control coefficient (tp ± 3 SD) |
| tpcu | Production cycle time per unit |
| VSM | Value stream mapping |
| IoT | Internet of Things |
| SME | Small and medium-sized enterprise |
| MTZ | Method of instantaneous observations |
Appendix A. Detailed Formulas and Calculations
This appendix presents the mathematical formulations used in the analysis and evaluation of production cycle efficiency and stability, based on data collected through modified work sampling.
Percentage of Time Element Occurrence
To determine the relative frequency of each time element in the observed production process,
where
pᵢ = (nᵢ/N) × 100%
- -
- nᵢ = number of recorded observations for element i
- -
- N = total number of observations
Stratified standard deviation is given by the formula
where is:
The stratified mean value of production during is
where fi is the number of PCs with an identical number of units in a series, and N is the total number of production cycles.
Control limits the amount
Moving can be approximated by the formula
The standard deviation (σᵢ) for each time element is calculated as follows:
σᵢ = √[(pᵢ × (100 − pᵢ))/N]
Based on this, the control limits used in control charts are as follows:
Upper Control Limit (UCL) = pᵢ + 3 σᵢ
Lower Control Limit (LCL) = pᵢ − 3 σᵢ
These limits help determine the statistical stability of the process over time.
Control limit for production time based on standard deviation (±3 σ range):
KG = tp ± 3·SD_tp
Average Duration of Each Time Element
The average time dedicated to each element during the production cycle is
where T_total is the total observed cycle time.
Tᵢ = (pᵢ/100) × T_total
Production Efficiency Coefficient
The efficiency of the production process is evaluated by the ratio of productive to total time
E = (T_productive/T_total) × 100%
This indicator is used to assess how much of the cycle is effectively utilized.
Formula to calculate the number of observations based on probability, estimated occurrence, and allowable error:
where
K = p (1 − p)/r2
K—a number representing the probability,
p—the percentage expression of the phenomenon being studied (usually assumed in advance),
r—the error margin in the observation.
References
- Praharsi, Y.; Jami’in, M.A.; Suhardjito, G.; Wee, H.M. The application of Lean Six Sigma and supply chain resilience in the maritime industry during the era of COVID-19. Int. J. Lean Six Sigma 2021, 12, 800–834. [Google Scholar] [CrossRef]
- Benmamoun, Z.; Fethallah, W.; Ahlaqqach, M.; Jebbor, I.; Benmamoun, M.; Elkhechafi, M. Butterfly Algorithm for Sustainable Lot Size Optimization. Sustainability 2023, 15, 11761. [Google Scholar] [CrossRef]
- Aleksandrova, S.V.; Vasiliev, V.A.; Letuchev, G.M. Digital Technology and Quality Management. In Proceedings of the 2018 International Conference “Quality Management, Transport, and Information Security, Information Technologies”, IT and QM and IS, St. Petersburg, Russia, 24–28 September 2018; pp. 18–21. Available online: https://ieeexplore.ieee.org/document/8525075 (accessed on 28 April 2025).
- Sá, J.C.; Vaz, S.; Carvalho, O.; Lima, V.; Morgado, L.; Fonseca, L.; Doiro, M.; Santos, G. A model of integration ISO 9001 with Lean Six Sigma and main benefits achieved. Total. Qual. Manag. Bus. Excel. 2020, 33, 218–242. [Google Scholar] [CrossRef]
- Bento, G.D.S.; Tontini, G. Developing an instrument to measure lean manufacturing maturity and its relationship with operational performance. Total Qual. Manag. Bus. Excell. 2018, 29, 977–995. [Google Scholar] [CrossRef]
- Kunkera, Z.; Tošanović, N.; Štefanić, N. Improving the Shipbuilding Sales Process by Selected Lean Management Tool. Machines 2022, 10, 766. Available online: https://www.mdpi.com/2075-1702/10/9/766 (accessed on 28 April 2025). [CrossRef]
- Shahsavar, A.; Sadeghi, J.K.; Shockley, J.; Ojha, D. On the relationship between lean scheduling and economic performance in shipbuilding: A proposed model and comparative evaluation. Int. J. Prod. Econ. 2021, 239, 108202. [Google Scholar] [CrossRef]
- Sharma, S.; Gandhi, P.J. Scope and Impact of Implementing Lean Principles & Practices in Shipbuilding. Procedia Eng. 2017, 194, 232–240. [Google Scholar] [CrossRef]
- Jebbor, I.; Benmamoun, Z.; Hachimi, H. Optimizing Manufacturing Cycles to Improve Production: Application in the Traditional Shipyard Industry. Processes 2023, 11, 3136. [Google Scholar] [CrossRef]
- El-Homsi, A.; Slutsky, J. Corporate Sigma: Optimizing the Health of Your Company with Systems Thinking; Taylor & Francis Group: New York, NY, USA, 2010. [Google Scholar]
- Industrija Transformacija Proizvodnje: Kako Tehnologija Menja Industrijske Procese? Available online: https://www.industrija.rs/vesti/clanak/transformacija-proizvodnje-kako-tehnologija-menja-industrijske-procese (accessed on 22 April 2025).
- Ghobakhloo, M.; Iranmanesh, M.; Fathi, M.; Rejeb, A.; Foroughi, B.; Nikbin, D. Beyond Industry 4.0: A Systematic Review of Industry 5.0 Technologies and Implications for Social, Environmental and Economic Sustainability. Asia-Pac. J. Bus. Adm. 2024. [Google Scholar] [CrossRef]
- Baggaley, B.; Maskell, B. Value Stream Management for Lean Companies.–Part I. Cost. Manag. 2003, 17, 24–30. [Google Scholar]
- Wasim, A.; Shehab, E.; Abdalla, H.; Al-Ashaab, A.; Sulowski, R.; Alam, R. An Innovative Cost Modelling System to Support Lean Product and Process Development. Int. J. Adv. Manuf. Technol. 2013, 65, 165–181. [Google Scholar] [CrossRef]
- Sarkis, J. Supply Chain Sustainability: Learning from the COVID-19 Pandemic. Int. J. Oper. Prod. Manag. 2020, 41, 63–73. [Google Scholar] [CrossRef]
- Singh, B.; Garg, S.K.; Sharma, S.K. Value stream mapping: Literature review and implications for Indian industry. Int. J. Adv. Manuf. Technol. 2011, 53, 799–809. Available online: https://link.springer.com/article/10.1007/s00170-010-2860-7 (accessed on 28 April 2025). [CrossRef]
- Lasa, I.S.; Laburu, C.O.; Vila, R.d.C. An evaluation of the value stream mapping tool. Bus. Process Manag. J. 2008, 14, 39–52. [Google Scholar] [CrossRef]
- Ohno, T. Das Toyota-Produktionssystem; Campus Verlag: Frankfurt am Main, Germany, 2013. [Google Scholar]
- Ramani, P.V.; Ksd, L.K.L. Application of lean in construction using value stream mapping. Eng. Constr. Arch. Manag. 2019, 28, 216–228. [Google Scholar] [CrossRef]
- Nübel, K.; Bühler, M.M.; Jelinek, T. Federated Digital Platforms: Value Chain Integration for Sustainable Infrastructure Planning and Delivery. Sustainability 2021, 13, 8996. [Google Scholar] [CrossRef]
- Geiger, M.; Hock, D.; Nübel, K. Development of a Novel Production Model for Labour Productivity: Modular Construction Toolkit Design. Buildings 2023, 13, 2887. [Google Scholar] [CrossRef]
- Eckert, C.M.; Clarkson, P.J. Planning Development Processes for Complex Products. Res. Eng. Des. 2010, 21, 153–171. [Google Scholar] [CrossRef]
- Herrmann, J.W.; Chincholkar, M.M. Design for Production: A Tool for Reducing Manufacturing Cycle Time. In Proceedings of the Volume 3: 5th Design for Manufacturing Conference; American Society of Mechanical Engineers: Baltimore, MD, USA, 2000; pp. 261–270. [Google Scholar]
- Stanisavljev, S.; Klarin, M.; Spasojevic-Brkic, V.; Vasović, J.V.; Radojčić, M. Identification of Annual Work Hour Elements in Production Cycle and Experimental Assessment of Flow Coefficient and Optimal Series. Tech. Gaz. 2019, 26, 1523–1528. [Google Scholar] [CrossRef]
- Klarin, M.M.; Cvijanovic, J.M.; Brkic, V.K.S. The Shift Level of the Utilization of Capacity as the Stochastic Variable in Work Sampling. Int. J. Prod. Res. 2000, 38, 2643–2651. [Google Scholar] [CrossRef]
- Stanisavljev, S. Development of Stochastic Optimization Model of Production Cycle Time in Small and Medium Enterprises. Ph.D. Thesis, University of Novi Sad, Novi Sad, Serbia, 2017. [Google Scholar]
- Kendall, K.; Mangin, C.; Ortiz, E. Discrete Event Simulation and Cost Analysis for Manufacturing Optimisation of an Automotive LCM Component. Compos. Part A Appl. Sci. Manuf. 1998, 29, 711–720. [Google Scholar] [CrossRef]
- Planus, O.P.; Galerie, J.; Gillonier, A.; Planus, P.; Danty-Lafrance, L.; Boehm, A. Théorie & Pratique Du Planning; Les Éditions d’organisation: Malakoff, France, 1962. [Google Scholar]
- Rosenblatt, M.J.; Lee, H.L. Economic Production Cycles with Imperfect Production Processes. IIE Trans. 1986, 18, 48–55. [Google Scholar] [CrossRef]
- Yeh, R.H.; Ho, W.-T.; Tseng, S.-T. Optimal Production Run Length for Products Sold with Warranty. Eur. J. Oper. Res. 2000, 120, 575–582. [Google Scholar] [CrossRef]
- Porteus, E.L. Optimal Lot Sizing, Process Quality Improvement and Setup Cost Reduction. Oper. Res. 1986, 34, 137–144. [Google Scholar] [CrossRef]
- Pyke, D.F.; Cohen, M.A. Performance Characteristics of Stochastic Integrated Production-Distribution Systems. Eur. J. Oper. Res. 1993, 68, 23–48. [Google Scholar] [CrossRef]
- Agrawal, A.; Minis, I.; Nagi, R. Cycle Time Reduction by Improved MRP-Based Production Planning. Int. J. Prod. Res. 2000, 38, 4823–4841. [Google Scholar] [CrossRef]
- Giri, B.C.; Yun, W.Y. Optimal Lot Sizing for an Unreliable Production System under Partial Backlogging and at Most Two Failures in a Production Cycle. Int. J. Prod. Econ. 2005, 95, 229–243. [Google Scholar] [CrossRef]
- Chung, K.-J.; Hou, K.-L.; Lan, S.-P. The Optimal Production Cycle Time in an Integrated Production-Inventory Model for Decaying Raw Materials. Appl. Math. Model. 2009, 33, 1–10. [Google Scholar] [CrossRef]
- Rappold, J.A.; Yoho, K.D. A Model for Level-Loading Production in the Process Industries When Demand Is Stochastic. Prod. Plan. Control 2008, 19, 686–701. [Google Scholar] [CrossRef]
- Taleizadeh, A.A.; Sadjadi, S.J.; Niaki, S.T.A. Multiproduct EPQ Model with Single Machine, Backordering and Immediate Rework Process. Eur. J. Ind. Eng. 2011, 5, 388. [Google Scholar] [CrossRef]
- Sattler, L. Using Queueing Curve Approximations in a Fab to Determine Productivity Improvements. In Proceedings of the IEEE/SEMI 1996 Advanced Semiconductor Manufacturing Conference and Workshop. Theme-Innovative Approaches to Growth in the Semiconductor Industry. ASMC 96 Proceedings; IEEE: Cambridge, MA, USA, 1996; pp. 140–145. [Google Scholar]
- Fowler, J.W.; Park, S.; MacKulak, G.T.; Shunk, D.L. Efficient Cycle Time-Throughput Curve Generation Using a Fixed Sample Size Procedure. Int. J. Prod. Res. 2001, 39, 2595–2613. [Google Scholar] [CrossRef]
- Yu, C.-Y.; Huang, H.-P. On-Line Learning Delivery Decision Support System for Highly Product Mixed Semiconductor Foundry. IEEE Trans. Semicond. Manufact. 2002, 15, 274–278. [Google Scholar] [CrossRef]
- Kuo, C.-J.; Chien, C.-F.; Chen, J.-D. Manufacturing Intelligence to Exploit the Value of Production and Tool Data to Reduce Cycle Time. IEEE Trans. Automat. Sci. Eng. 2011, 8, 103–111. [Google Scholar] [CrossRef]
- Haller, M. Cycle Time Management during Production Ramp-Up. Robot. Comput.-Integr. Manuf. 2003, 19, 183–188. [Google Scholar] [CrossRef]
- Kotsiopoulos, T.; Leontaris, L.; Dimitriou, N.; Ioannidis, D.; Oliveira, F.; Sacramento, J.; Amanatiadis, S.; Karagiannis, G.; Votis, K.; Tzovaras, D.; et al. Deep Multi-Sensorial Data Analysis for Production Monitoring in Hard Metal Industry. Int. J. Adv. Manuf. Technol. 2021, 115, 823–836. [Google Scholar] [CrossRef]
- Wang, J.; Ma, Y.; Zhang, L.; Gao, R.X.; Wu, D. Deep Learning for Smart Manufacturing: Methods and Applications. J. Manuf. Syst. 2018, 48, 144–156. [Google Scholar] [CrossRef]
- Zhou, F.; Liu, G.; Xu, F.; Deng, H. A Generic Automated Surface Defect Detection Based on a Bilinear Model. Appl. Sci. 2019, 9, 3159. [Google Scholar] [CrossRef]
- Singh, J.; Singh, H.; Singh, B. Prioritization of Failure Modes in Manufacturing Processes: A Fuzzy Logic-Based Approach; Emerald Publishing Limited: Bingley, UK, 2020; ISBN 978-1-83982-143-1. [Google Scholar]
- Dimitriou, N.; Leontaris, L.; Vafeiadis, T.; Ioannidis, D.; Wotherspoon, T.; Tinker, G.; Tzovaras, D. A Deep Learning Framework for Simulation and Defect Prediction Applied in Microelectronics. Simul. Model. Pract. Theory 2020, 100, 102063. [Google Scholar] [CrossRef]
- Lv, Y.; Lin, D. Design an Intelligent Real-Time Operation Planning System in Distributed Manufacturing Network. Ind. Manag. Data Syst. 2017, 117, 742–753. [Google Scholar] [CrossRef]
- Panetto, H.; Stadzisz, P.C.; Li, W.; Jia, Q.-S. Guest Editorial: Special Issue on (Industrial) Internet-of-Things for Smart and Sensing Systems: Issues, Trends, and Applications. IEEE Internet Things J. 2018, 5, 4392–4395. [Google Scholar] [CrossRef]
- Chen, W. Intelligent Manufacturing Production Line Data Monitoring System for Industrial Internet of Things. Comput. Commun. 2020, 151, 31–41. [Google Scholar] [CrossRef]
- Jovanovic, A.; Mihajlovic, I.; Zivkovic, Z. Upravljanje Proizovodnjom; Technical Faculty Bor, Univerzitet u Beogradu: Belgrade, Serbia, 2005; ISBN 978-86-6305-039-6. [Google Scholar]
- Hu, S.J.; Ko, J.; Weyand, L.; ElMaraghy, H.A.; Lien, T.K.; Koren, Y.; Bley, H.; Chryssolouris, G.; Nasr, N.; Shpitalni, M. Assembly system design and operations for product variety. CIRP Ann. 2011, 60, 715–733. [Google Scholar] [CrossRef]
- Kumar, D.M. Assembly Line Balancing: A Review of Developments and Trends in Approach to Industrial Application. Glob. J. Res. Eng. 2013, 13, 28–50. [Google Scholar]
- Hackstein, R.; Budenbender, W. Flexible manufacturing systems as modules for the factory of the future. In Proceedings of the Symposium on Determination of Utilization Capacity Level, Belgrade, Serbia, 4 September 1989. [Google Scholar]
- Li, L.; Chang, Q.; Ni, J.; Biller, S. Real time production improvement through bottleneck control. Int. J. Prod. Res. 2009, 47, 6145–6158. [Google Scholar] [CrossRef]
- Patti, A.L.; Watson, K.J. Downtime variability: The impact of duration–frequency on the performance of serial production systems. Int. J. Prod. Res. 2009, 48, 5831–5841. [Google Scholar] [CrossRef]
- Schultz, C.R. Spare parts inventory and cycle time reduction. Int. J. Prod. Res. 2004, 42, 759–776. [Google Scholar] [CrossRef]
- Kusar, J.; Berlec, T.; Zefran, F.; Starbek, M. Reduction of machine setup time. J. Mech. Eng. 2010, 56, 833–845. [Google Scholar]
- Berlec, T.; Govekar, E.; Grum, J.; Potocnik, P.; Starbek, M. Predicting order lead times. Stroj. Vestn.-J. Mech. Eng. 2008, 54, 308–321. [Google Scholar]
- Jovanovic, J.R.; Milanovic, D.D.; Djukic, R.D. Manufacturing Cycle Time Analysis and Scheduling to Optimize Its Duration. Stroj. Vestn. J. Mech. Eng. 2014, 607, 512–524. [Google Scholar]
Disclaimer/Publisher’s Note: The statements, opinions and data contained in all publications are solely those of the individual author(s) and contributor(s) and not of MDPI and/or the editor(s). MDPI and/or the editor(s) disclaim responsibility for any injury to people or property resulting from any ideas, methods, instructions or products referred to in the content. |
© 2025 by the authors. Licensee MDPI, Basel, Switzerland. This article is an open access article distributed under the terms and conditions of the Creative Commons Attribution (CC BY) license (https://creativecommons.org/licenses/by/4.0/).