Article

Tracing the Tin Flows and Stocks in China: A Dynamic Material Flow Analysis from 2001 to 2022

1
School of Geography and Environment, Shandong Normal University, Jinan 250358, China
2
Antai College of Economics & Management, Shanghai Jiao Tong University, Shanghai 200240, China
3
School of Environmental Science and Engineering, Shanghai Jiao Tong University, Shanghai 200240, China
4
School of International and Public Affairs, Shanghai Jiao Tong University, Shanghai 200240, China
*
Author to whom correspondence should be addressed.
Systems 2025, 13(8), 622; https://doi.org/10.3390/systems13080622
Submission received: 12 June 2025 / Revised: 21 July 2025 / Accepted: 21 July 2025 / Published: 23 July 2025

Abstract

Tin is an indispensable metal for contemporary society owing to its extensive application. China is a major tin manufacturer and consumer worldwide. Nonetheless, the crucial characteristics of its tin metabolism remain limited. Therefore, a dynamic material flow analysis (MFA) from 2001 to 2022 was performed in this study to trace China’s tin flows and stocks. Findings show that China became a net tin exporter from a life cycle perspective, and annual tin consumption embodied in various final products varied between 49.3 kilo tons (Kt) in 2001 and 161.5 Kt in 2022, with home appliances and electronics being the dominant consumption sectors. A total of 913.3 Kt of tin became in-use stocks. In addition, the imported tin embodied in various final products varied between 13.9 Kt in 2001 and 21.6 Kt in 2022, with machinery being the dominant consumption sector. The exported tin embodied in various final products varied between 12.0 Kt in 2001 and 76.3 Kt in 2022, with machinery being the dominant consumption sector. Finally, this study proposes some suggestions, in view of the Chinese reality, like enhancing tin recycling, promoting tin geological prospecting, optimizing the structure of the tin trade, and promoting regional cooperation, to improve the supply security of tin resources.

1. Introduction

Global economic decarbonization requires considerable amounts of raw materials, leading to a high supply risk of metals [1]. As one of the earliest discovered and used metals, tin has been used to make various products, such as different utensils, welding materials, frame retardants, semiconductors, home appliances, etc. Tin plays crucial roles in modern strategic emerging industries targeting the low-carbon economy [2,3,4]. The rapid global development of low-carbon technologies (e.g., photovoltaic and electric vehicles) also led to increased demand for tin resources [5,6], aggravating the imbalance between its supply and demand [7]. China ranked as both the world’s leading producer and consumer of refined tin, contributing 52.38% to global output and 53.32% to total consumption, in 2022 [8]. However, its domestic tin ore cannot meet with the domestic demand for refined tin, leading to a large amount of tin import [8]. It is projected that the global identified tin ore reserves will be exploitable for less than 15 years by 2022, with China’s reserves expected to last only 8 years [9]. Moreover, global tin supply and demand are subject to fluctuations driven by various factors, like environmental legislation, natural disasters, and technical improvements [3,10,11], leading to ongoing imbalances and dynamic shifts in the tin market. In addition, rapid exploitation and overutilization have hindered the sustainable development of China’s tin industry [6,7]. Therefore, it is critical to identify the key issues related with tin resource security and measure tin utilization efficiency in China.
Material flow analysis (MFA) is a structured analytical approach used to quantify the stocks and flows of a specific material or element within a defined system boundary [12,13,14]. As an effective method for resources flow quantification, numerous studies on the MFA of various aspects have been performed [13,14], such as plastics [15], wood [16], e-waste [17], construction materials [18], rare earth elements [19], mobility infrastructure [20], construction solid waste [21], etc. MFA has also been extensively applied to the sustainable management of metals, such as iron [22,23], zinc [24], nickel [25], molybdenum [26], manganese [27], aluminum [28,29], copper [30], indium [31], lithium [32,33], lanthanum [34], gadolinium [35], niobium [36], gallium [37,38], and zirconium [39]. For example, Gao et al. [38] conducted a comprehensive MFA of the global flows of gallium, revealing that most gallium derived from global bauxite mining ultimately ends up as gallium losses. Xiao et al. [40] analyzed the supply and demand of China’s dysprosium based on a dynamic MFA during the period of 2000 to 2019. Izard and Müller [10] investigated the global tin cycle from 1927 to 2005 and pointed out that most of the global tin mined in the 20th century was accumulated in landfills. Yang et al. [41] visualized the tin flows in China in 2014 and forecasted China’s tin supply and demand, finding that tin imports were critical for China’s future tin supply. Li et al. [3] found that a strong correlation existed between refined tin use and gross domestic product per capita in developing nations, while the relationship was weak in developed countries. Unfortunately, no dynamic analysis of China’s tin cycle has been conducted. This lack of research limits the understanding of how tin flows and stocks have changed over time. Such insights are crucial for maintaining a stable balance between tin supply and demand. Given the growing demand for tin, a comprehensive and up-to-date assessment is crucial to strengthen the safety of the tin supply chain. As a result, it is pressing to execute a dynamic analysis of tin flows and in-use stocks for valuable information to be provided in order to achieve sustainable resource management. To address such research gaps, this study aims to implement a dynamic MFA to examine China’s tin flows and stocks during the period of 2001 to 2022. The results from this study are anticipated to offer important guidance for the sustainable management of tin resources.

2. Methods and Data

2.1. Temporal Scope and System Boundary

China’s mainland was set as a spatial boundary, while Hong Kong, Macao, and Taiwan were not considered owing to insufficient data in this research. Moreover, the period of 2001–2022 was selected as the temporal scope so that the evolution of tin use in China’s contemporary industry can be captured. Flowing stages including mining and beneficiation, refining and separation, fabrication, manufacturing, use, and waste management [41] were considered in this study. Figure 1 shows the framework of the MFA for the tin flows. Traded tin products include tin ore, tin concentrate, refined tin, tin-containing intermediate products, tin-containing final products, and tin scraps.

2.2. Tin Flows and Stocks Analysis

The conservation of mass is the fundamental principle of MFA [42,43]. This means that the total inflows are equal to the total outflows [39], as presented in Equation (1).
F i , t i n p u t + F i , t i m p o r t + F i , t r e c y c l i n g = F i , t o u t p u t + F i , t e x p o r t + F i , t l o s s + S i , t
where i and t represent each life stage and a specific year within the study period, respectively. F i , t i n p u t represents the domestic tin material input during stage i of year t, while F i , t i m p o r t represents the international tin import at the same stage and year F i , t r e c y c l i n g represents the recycling tin flow during stage i of year t. F i , t o u t p u t and F i , t e x p o r t represent domestic tin material output and tin export flows during stage i of year t, respectively. F i , t l o s s and Si,t represent the tin loss flow and the net addition to stocks during stage i of year t, respectively.
In this study, the mass of pure tin was adopted to represent various tin material flows. In addition, the specific calculation method for tin flows and stocks is provided below.
(1) Domestic tin flows
Each tin flow in each life stage was calculated by multiplying the tin content within a product with the amount of this product [41], as shown in Equation (2).
F i , t = k = 1 F i , t , k = k = 1 m i , t , k × C i , k
where i and k represent each life stage and individual tin-containing product, respectively. Fi,t represents the total domestic tin flow during stage i of year t, while Fi,t,k represents the tin flow embodied in tin-containing product k at the same stage and year. mi,t,k represents the amount of tin-containing product k during stage i of year t and Ci,k represents the tin content in product k at the same stage.
(2) Import and export tin flows
Tin import and export flows were calculated based on the amounts of tin-containing products and their corresponding tin contents [41], as shown in Equations (3) and (4). Table S1 lists detailed information of the Harmonized Commodity Description and detailed information of the tin contents in various traded products.
F i , t i m p o r t = j = 1 F i , t , j i m p o r t × C i , j
F i , t e x p o r t = j = 1 F i , t , j e x p o r t × C i , j
where j denotes an imported tin-containing product. F i , t i m p o r t denotes the total tin imports at stage i in year t, while F i , t e x p o r t denotes the total tin exports at the same stage and year. Ci,j denotes the tin content of product j at stage i.  F i , t , j i m p o r t denotes the import amount of product j at stage i in year t, while F i , t , j e x p o r t denotes the export amount of product j at the same stage and year.
(3) Tin loss flows
Each tin loss flow was calculated by multiplying the tin input with its loss ratio [41], which is shown in Equation (5). The tin loss ratios during different stages are listed in Table S2.
F i , t l o s s = F i , t i n × R i l o s s
where F i , t l o s s , F i , t i n , and R i l o s s represent tin loss at stage i in year t, tin flow into stage i in year t, and the tin loss ratio at stage i in year t.
(4) Recycling tin flows
The recycling of tin mainly occurred in the waste management stage in this study. At this stage, tin embodied in tin-containing products, such as food packaging, home appliances, and electronics, was recycled as old scraps. These recycling flows are returned to the stage of refining and separation as secondary tin resources. Owing to a lack of detailed data on recycling ratios for all of the final products, the total secondary tin utilization data are used for the calculation.
(5) In-use tin stocks
In-use stocks of tin refer to the amounts of tin embodied in various final products accumulated in the anthroposphere [39]. The in-use stock of each individual tin-containing product can be calculated by the cumulation of annual variations from the initial year [39,41], namely 2001 for this study. In-use tin stocks were calculated based on a top-down method, as shown in Equations (6)–(8).
S i , t = S i , t 0 + t = t 0 t F i , t i n F i , t o u t
F i , t o u t = m = 1 l i f e t i m e F i , t m i n × P i , m
S t = i = 1 n S i , t
where S i , t 0 (default set as 0) and Si,t are the in-use stocks of product i at year t0 and t, respectively. F i , t i n and F i , t o u t are the input and output flow of product i in year t, respectively. Pi,m is the probability of product i for serving m years, and it can be calculated based on a normal distribution. The life spans of various tin-containing products are listed in Table S3. St is the total in-use stocks of all the final tin-containing products in year t.

2.3. Uncertainty Analysis

Total in-use stocks and end-of-life (EoL) flows of tin-containing final products were estimated based on tin flow data and product life spans, introducing inherent uncertainties into the analysis. To assess the reliability of the results, an uncertainty analysis was conducted. Uncertainty levels were categorized into three tiers, namely 2% (low), 5% (medium), and 10% (high) [39]. Data obtained directly from authoritative industrial databases and official yearbooks were considered to have low uncertainty, with a 2% margin, due to their high reliability. Medium uncertainty, set at 5%, was assigned to data derived from the academic literature and expert interviews, as these involve a degree of subjective judgment. Data from other origins such as market research or deduced through extra information have an elevated level of uncertainty, showing an uncertainty scope of 10%.

2.4. Data Sources

Data utilized in this study were collected from various sources. Specifically, data on tin ores, refined tin, and secondary tin were drawn from The Yearbook of Nonferrous Metals Industry of China (2002–2023) [44,45] and reports by the United States Geological Survey (USGS) [46]. Data on tin imports and exports were sourced from the United Nations Trade Database [47]. Other main data sources include the proprietary China Bulk Commodity (CBC) database [9], expert interviews with professionals from tin-related enterprises, and the published literature [48,49,50,51,52]. Detailed information is available in the Supplementary Materials of this study. All the tin flows were expressed in tin metallic equivalents. Table S4 lists tin consumption in China from 2001 to 2022.

3. Results

3.1. Evolution of Tin Cycle in China

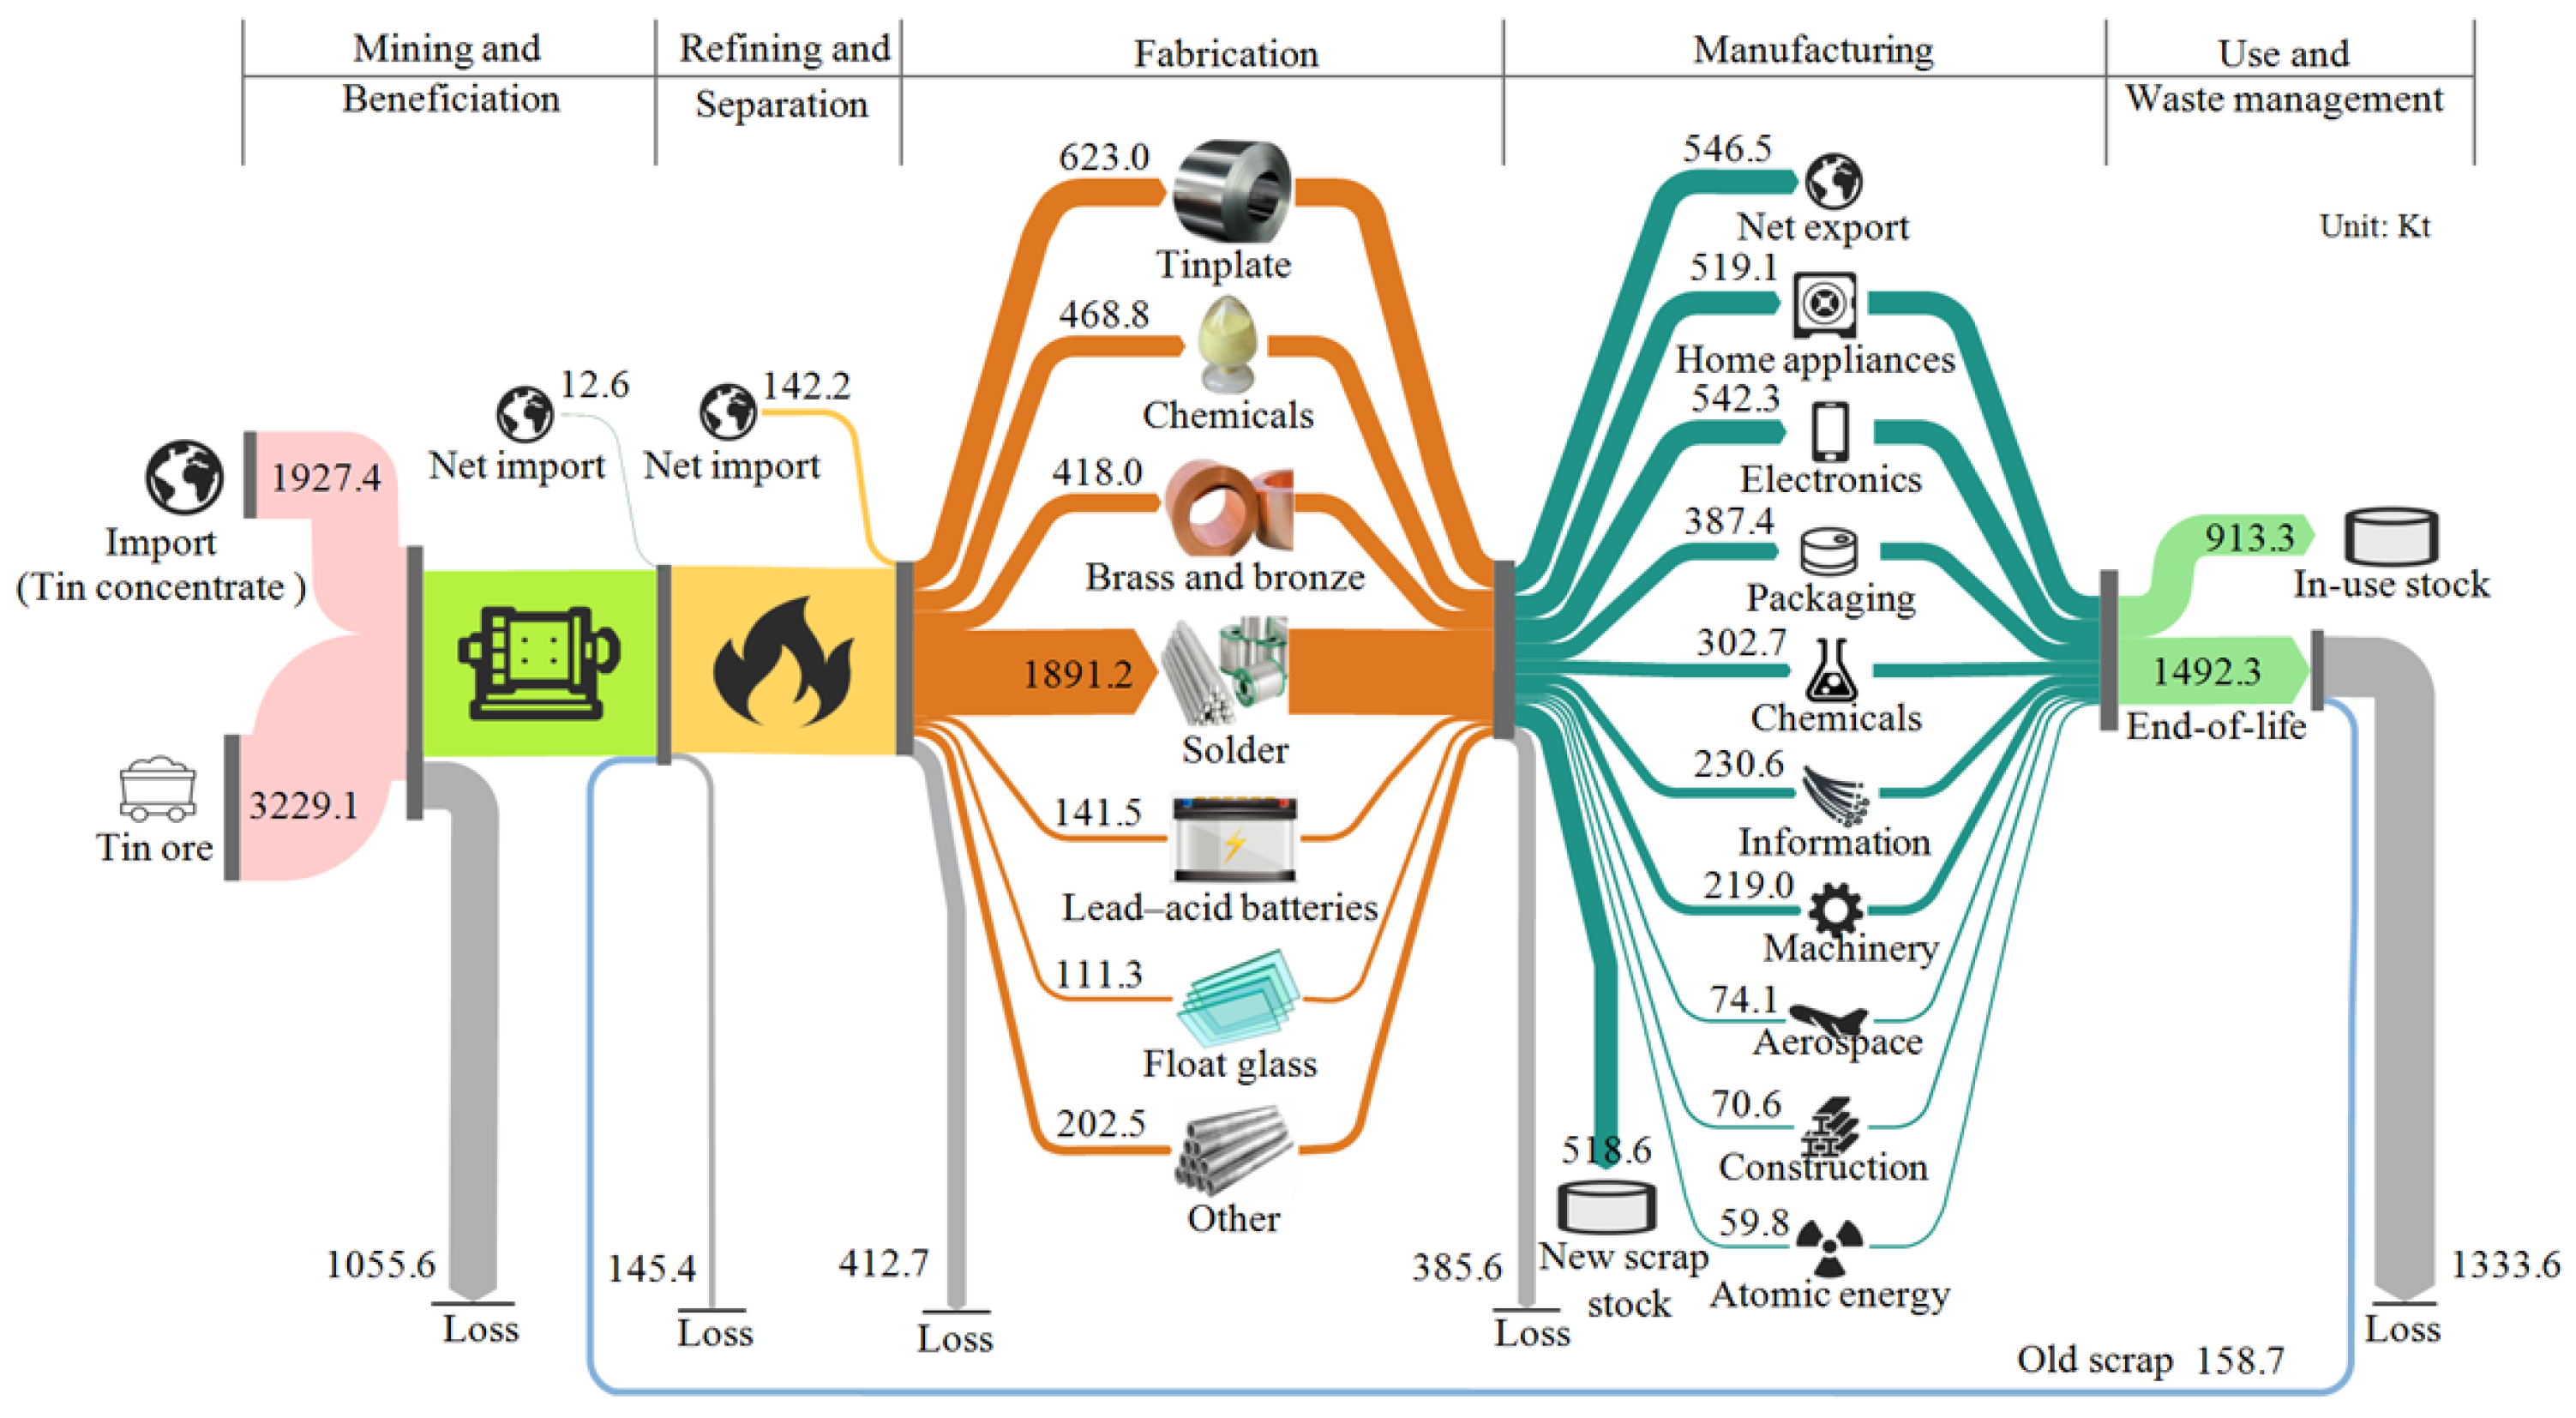
Figure 2 shows China’s cumulative tin flows and stocks over the period from 2001 to 2022. For the stage of mining and beneficiation, the total tin input during the study period was 5.16 million tons (Mt), including domestic tin ores and imported tin resources. Total extracted tin from domestic mines was 3.23 Mt, with 2.17 Mt flowing into the refining and separation process and 1.06 Mt being lost as tailings. Specifically, the production of domestic concentrate fluctuated from 92.9 kilo tons (Kt) in 2001 to 80.2 Kt in 2022, with the lowest value being 61.7 Kt in 2002 and the highest value at 145.9 Kt in 2007 (Table S5). Moreover, China imported a considerable amount of tin ores and concentrates to satisfy its demand for tin resources, totaling 1.93 Mt over the study period.
Domestic primary tin and tin-containing concentrates entered into the stage of refining and separation. Tin loss occurred during this stage, with a cumulative figure of 145.4 Kt. With net imports of 142.2 Kt tin-containing products, the total tin flows entering into the fabrication stage reached 4.27 Mt, with a cumulative loss of 412.7 Kt occurring during this stage. Tin flows entering the manufacturing stage reached 3.86 Mt, with a loss of 385.6 Kt and a new scrap stock of 518.6 Kt. New scraps that were generated primarily resulted from the failure to recycle returned materials directly at production sites [53].
For the use stage, the cumulative domestic tin demand across various final products reached 2.41 Mt during the study period, in which the electronics sector was the dominant contributing sector (22.54%), followed by the sectors of home appliances (21.58%) and food packaging (16.10%). In addition, 913.3 Kt of tin embodied in final products became in-use stocks, while 1.49 Mt of tin reached the end of its life spans, flowing into the waste management stage. In particular, 158.7 Kt of tin was reused as secondary tin resources, and the remaining 1.33 Mt of tin was discharged to the environment without effective collection and utilization.

3.1.1. Tin Consumption Patterns

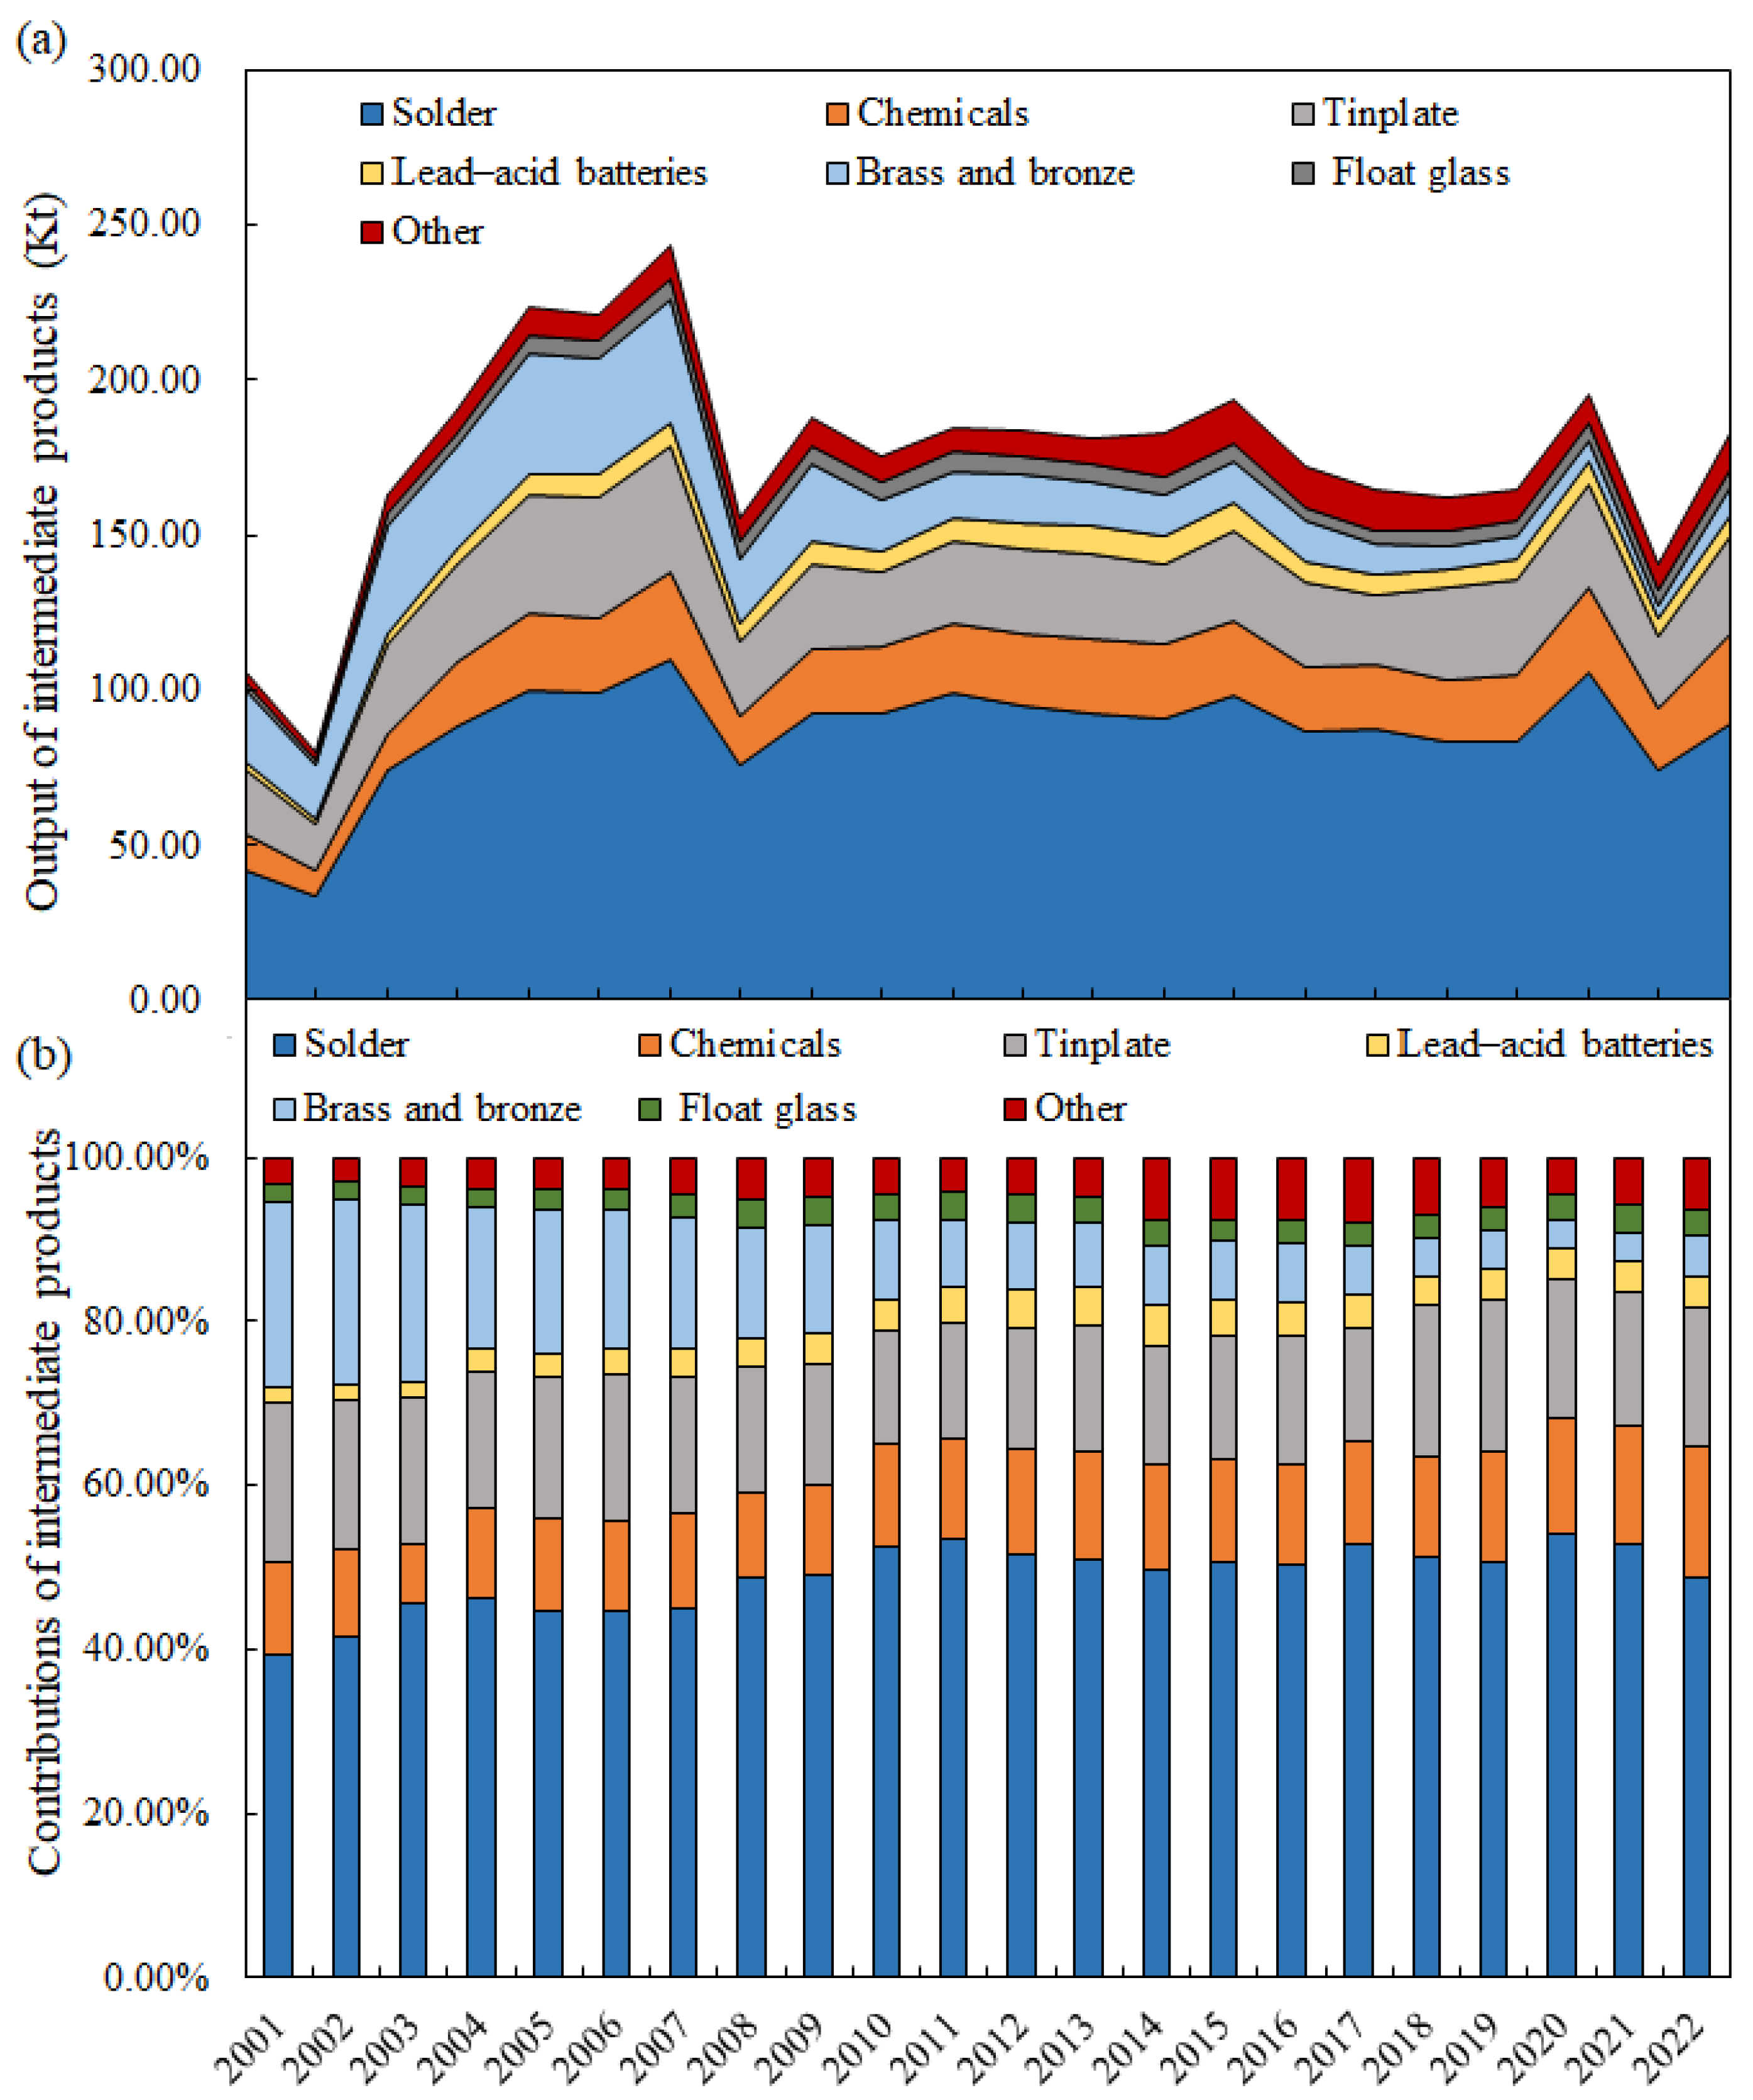
The cumulative amount of intermediate products was 3.86 Mt, in which solder was the largest contributor (49.04%), followed by tinplate (16.15%), chemicals (12.16%), and brass and bronze (10.84%). Specifically, the output of intermediate products rose from 106.1 Kt in 2001 to 182.7 Kt by 2022, with the lowest value of 80.4 Kt in 2002 and the highest value of 243.6 Kt in 2007. Figure 3 illustrates the output and contribution of tin-containing intermediate products from 2001 to 2022, including solder (39.35–54.05%), chemicals (7.26–16.04%), tinplate (13.64–19.47%), lead–acid batteries (1.83–4.91%), brass and bronze (3.28–22.66%), float glass (2.03–3.48%), and others (3.00–8.10%). Among them, the contribution of solder showed an increasing trend, while the contribution of brass and bronze showed a decreasing trend. The demand for tin for solder production is projected to rise in the future, driven by the rapid expansion of the photovoltaic industry.
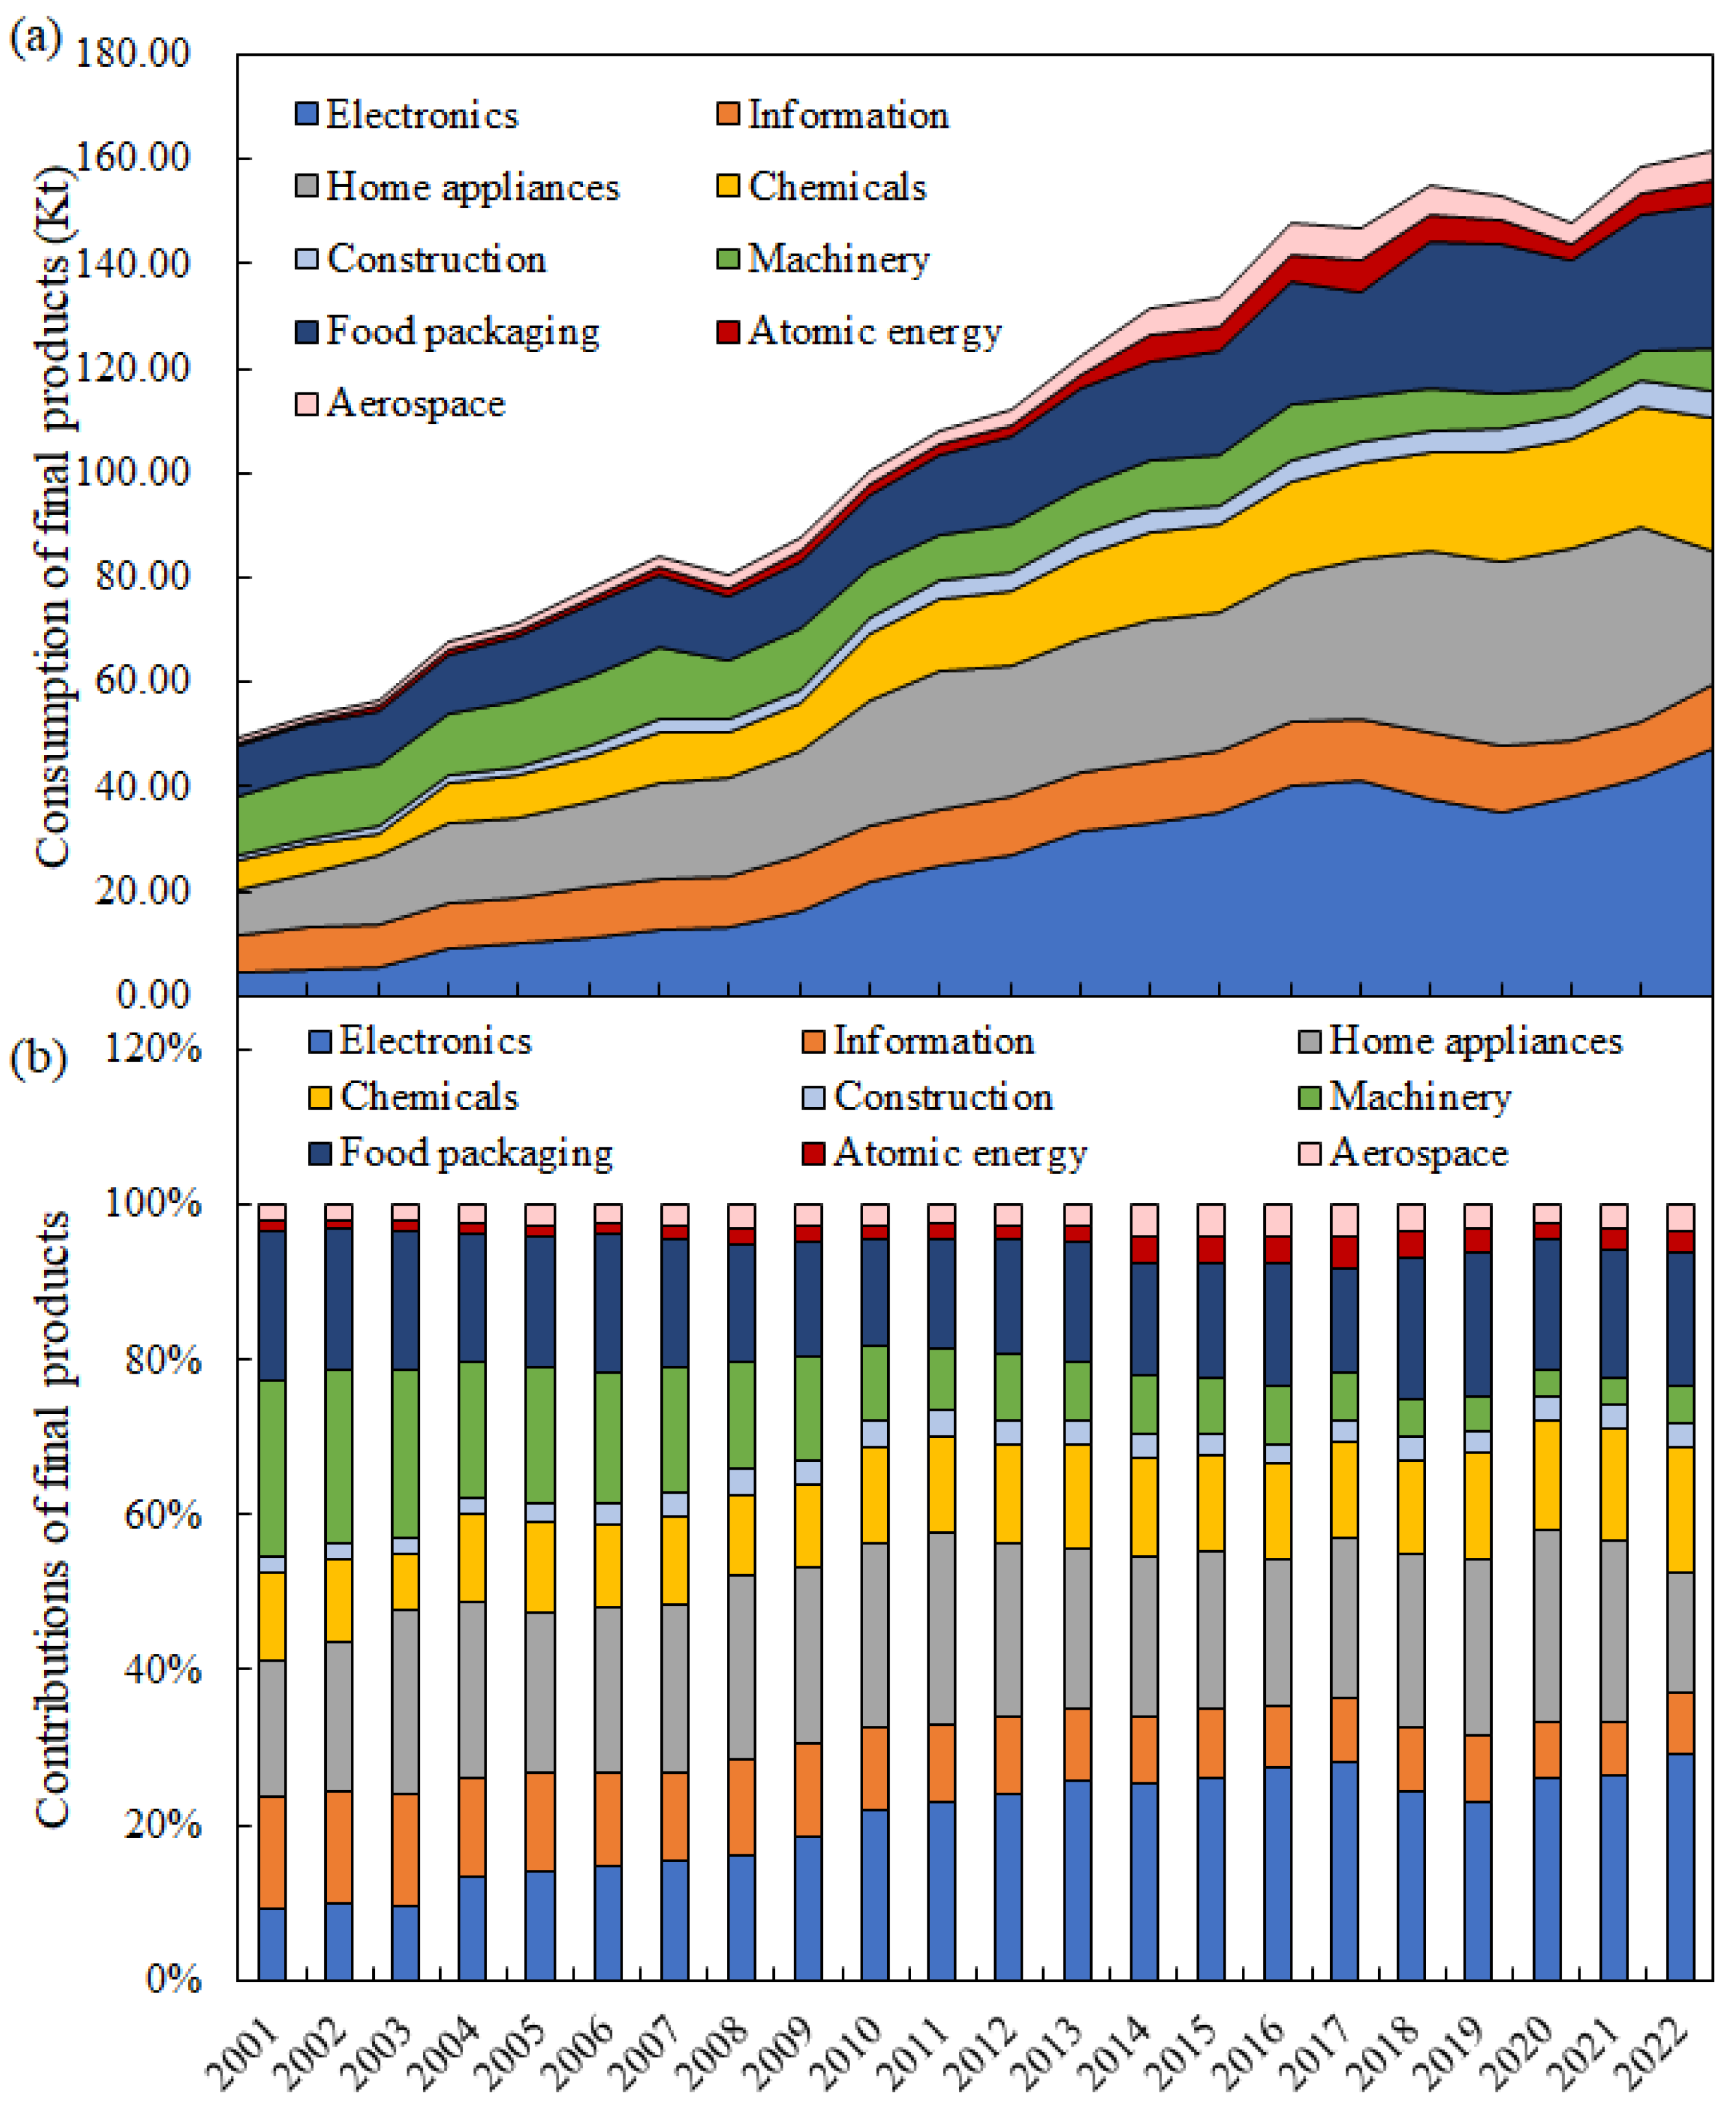
Figure 4 illustrates the historical outputs and contributions of various tin-containing final products, including electronics (9.13–29.29%), information (6.75–14.58%), home appliances (15.60–24.86%), chemicals (7.26–16.04%), construction (2.03–3.48%), machinery (3.32–22.72%), food packaging (13.64–19.47%), atomic energy (1.12–3.89%), and aerospace (1.87–4.16%). Specifically, the contribution of electronics increased from 9.13% in 2001 to 29.29% in 2022, while the contribution of machinery decreased from 22.72% in 2001 to 5.02% in 2022.
Annual domestic tin consumption rose from 49.3 Kt in 2001 to 161.5 Kt by 2022. In particular, annual domestic tin consumption rose from 4.5 Kt in 2001 to 47.3 Kt by 2022 for electronics application. For home appliances, annual domestic tin consumption increased from 8.7 Kt in 2001 to 25.2 Kt by 2022, peaking at 37.1 Kt in 2021. For chemicals, annual domestic tin consumption increased from 5.6 Kt in 2001 to 25.9 Kt by 2022. For food packaging, annual domestic tin consumption rose from 9.6 Kt in 2001 to 27.4 Kt by 2022. Figure 4 also shows that the machinery sector made the largest contribution to total tin consumption in 2001 and 2002. But from 2003 to 2011, home appliances made the largest contribution to total tin consumption. Since 2012, the electronics sector has made the largest contribution to total tin consumption. Such a consumption structure experienced a significant change during this study period, reflecting the industrial structure adjustment led by the Chinese government.

3.1.2. In-Use Tin Stocks and EoL Tin Flows

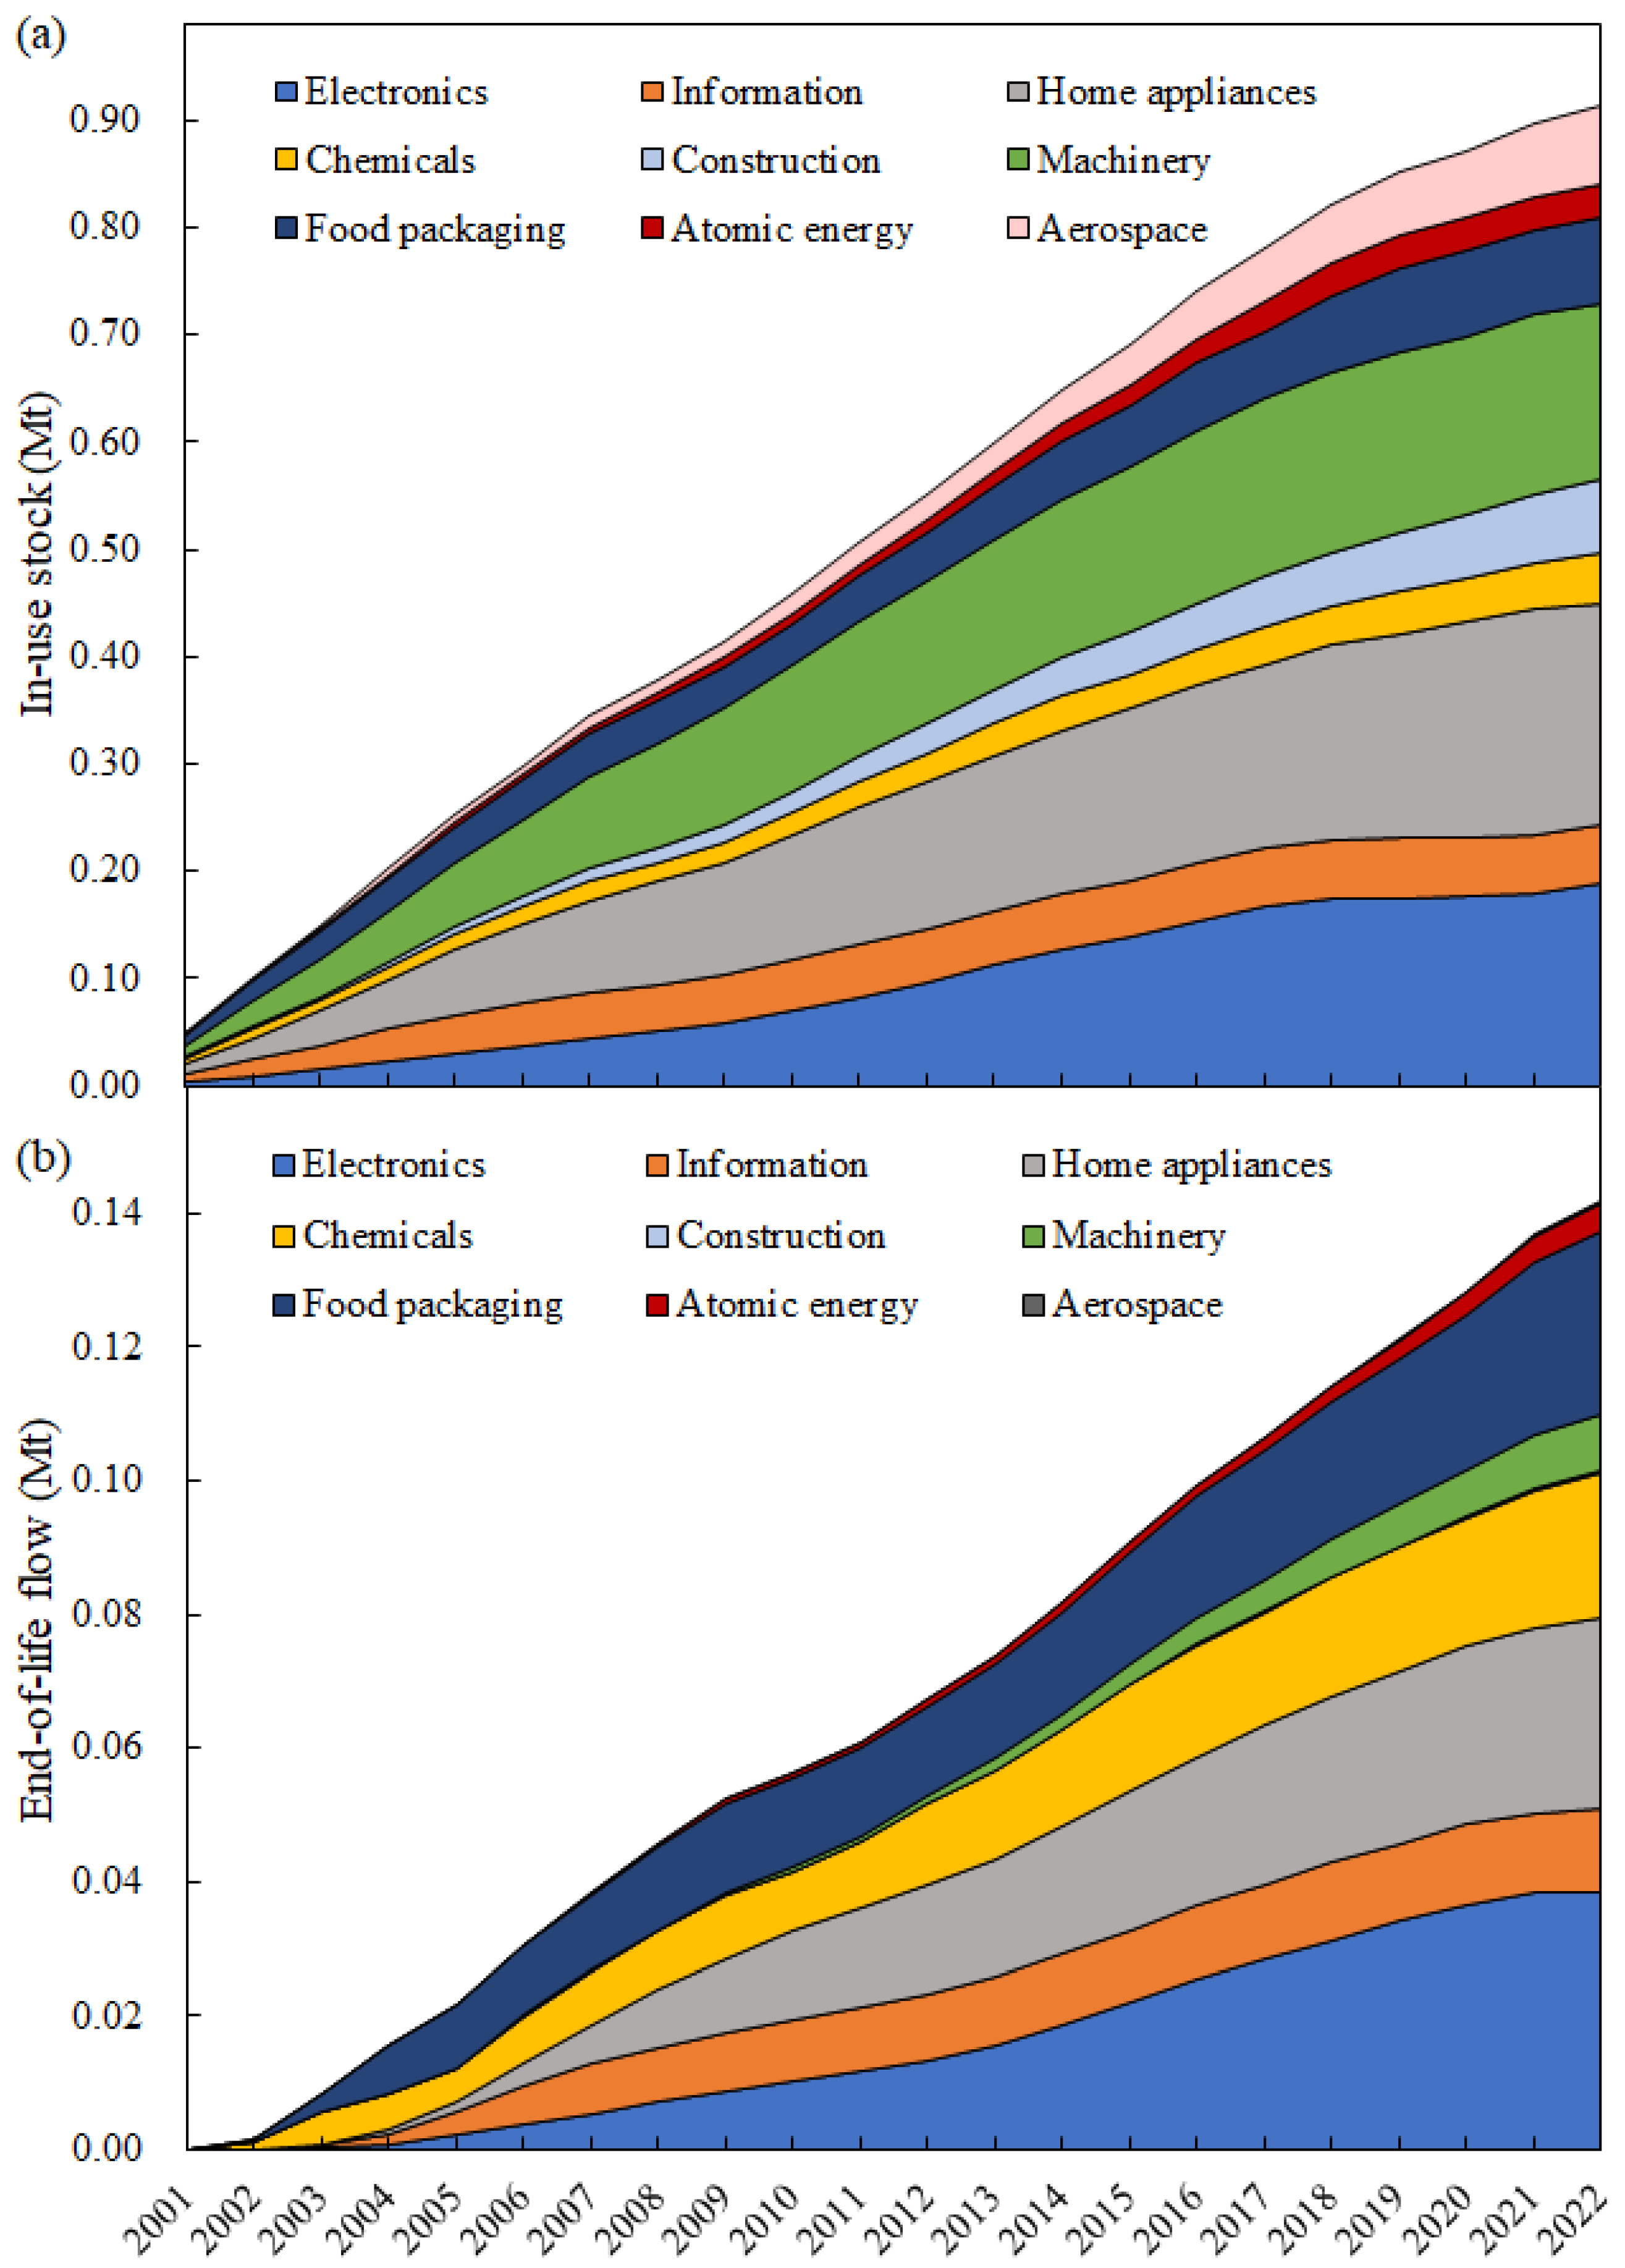
Figure 5 presents the trends in total in-use tin stocks and EoL tin flows from 2001 to 2022. As depicted in Figure 5a, the in-use tin stocks embedded in the tin-containing final products expanded to 913.3 Kt by 2022 from 49.2 Kt in 2001. Home appliances accounted for the largest share of cumulative in-use stock at 206.4 Kt (22.59%), followed by electronics at 188.5 Kt (20.64%). In terms of home appliances, the in-use stock rose markedly from 8.7 Kt in 2001 to 206.4 Kt in 2022 owing to the development of the home appliance industry and the continued updating of home appliances. For electronics, the in-use stocks rose from 4.5 Kt in 2001 to 188.5 Kt by 2022. Other cumulative in-use stocks include those in food packaging, chemicals, machinery, aerospace, information, construction, and atomic energy, with figures of 79.1 Kt (8.66%), 48.2 Kt (5.28%), 163.5 Kt (17.90%), 72.6 Kt (7.94%), 54.4 Kt (5.95%), 68.8 Kt (7.53%), and 31.9 Kt (3.49%), respectively.
The cumulative EoL flow was 1.49 Mt in 2022, with final products of electronics (23.71%) and home appliances (20.96%) being the top two sectors. Specifically, the electronics sector’s EoL tin flow grew substantially, rising from 4.99 tons in 2001 to 38.6 Kt in 2022 (Figure 5b), while the EoL flow in those home appliances increased from 7.03 tons in 2001 to 28.8 Kt in 2022. Other cumulative EoL flows include those in food packaging, chemicals, information, machinery, atomic energy, construction, and aerospace, with figures of 308.3 Kt (20.66%), 254.5 Kt (17.05%), 176.2 Kt (11.81%), 55.5 Kt (3.72%), 27.9 Kt (1.87%), 1.8 Kt (0.12%), and 1.5 Kt (0.10%), respectively. In addition, the annual volume of recycled EoL flow rose significantly, from 0.2 Kt in 2001 to 36.9 Kt by 2022.

3.1.3. International Trade Patterns

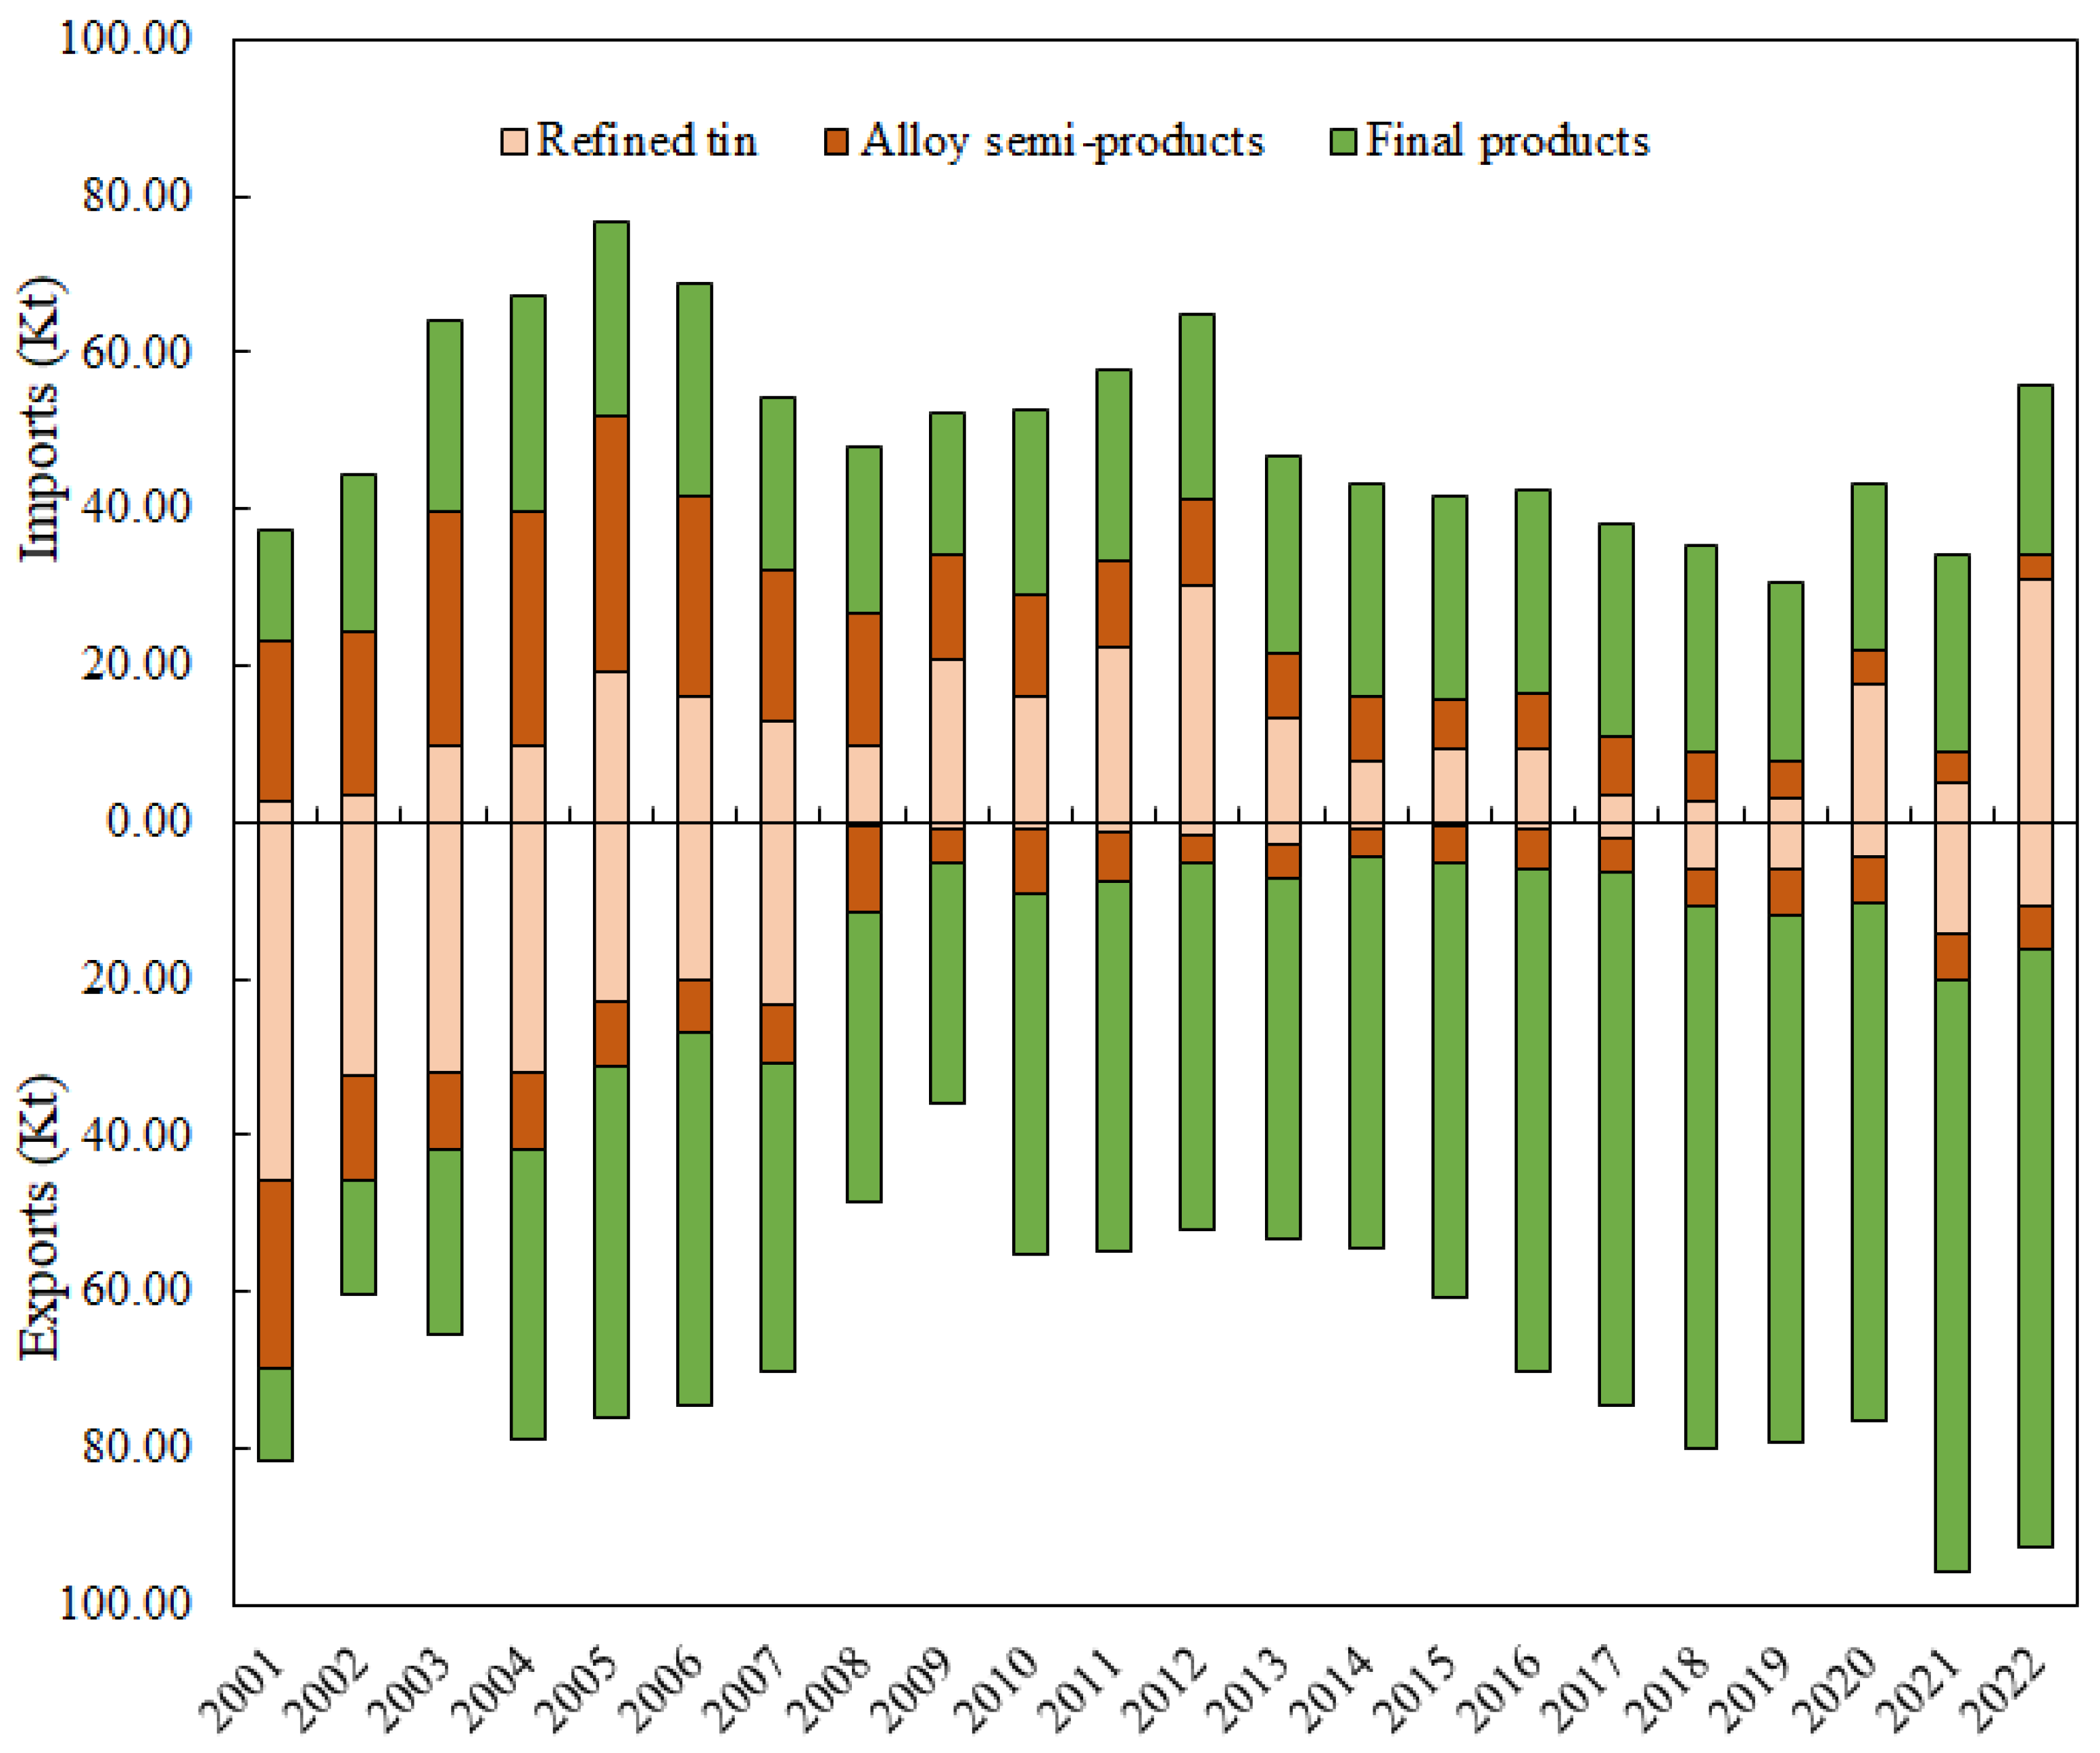
Figure 6 presents the historical evolution of the tin trade in China from 2001 to 2022, encompassing refined tin, alloy semi-products, and final products. Over the study period, China imported a total of 275.0 Kt of refined tin, 304.8 Kt of alloy semi-products, and 519.4 Kt of final products. In contrast, exports during the same period amounted to 262.4 Kt for refined tin, 162.6 Kt for alloy semi-products, and 1.07 Mt for final products. These results indicate that there is a net cumulative export in China, especially for tin-containing final products. Figure 6 also shows a clear trade imbalance during the study period. For instance, the exported refined tin was considerably higher than the imported refined tin before 2008, while the imported alloy semi-products expanded between 20.4 Kt in 2001 and 32.9 Kt in 2005 and then decreased. In addition, tin embodied in the exported final products was higher than that in the imported final products after 2004.
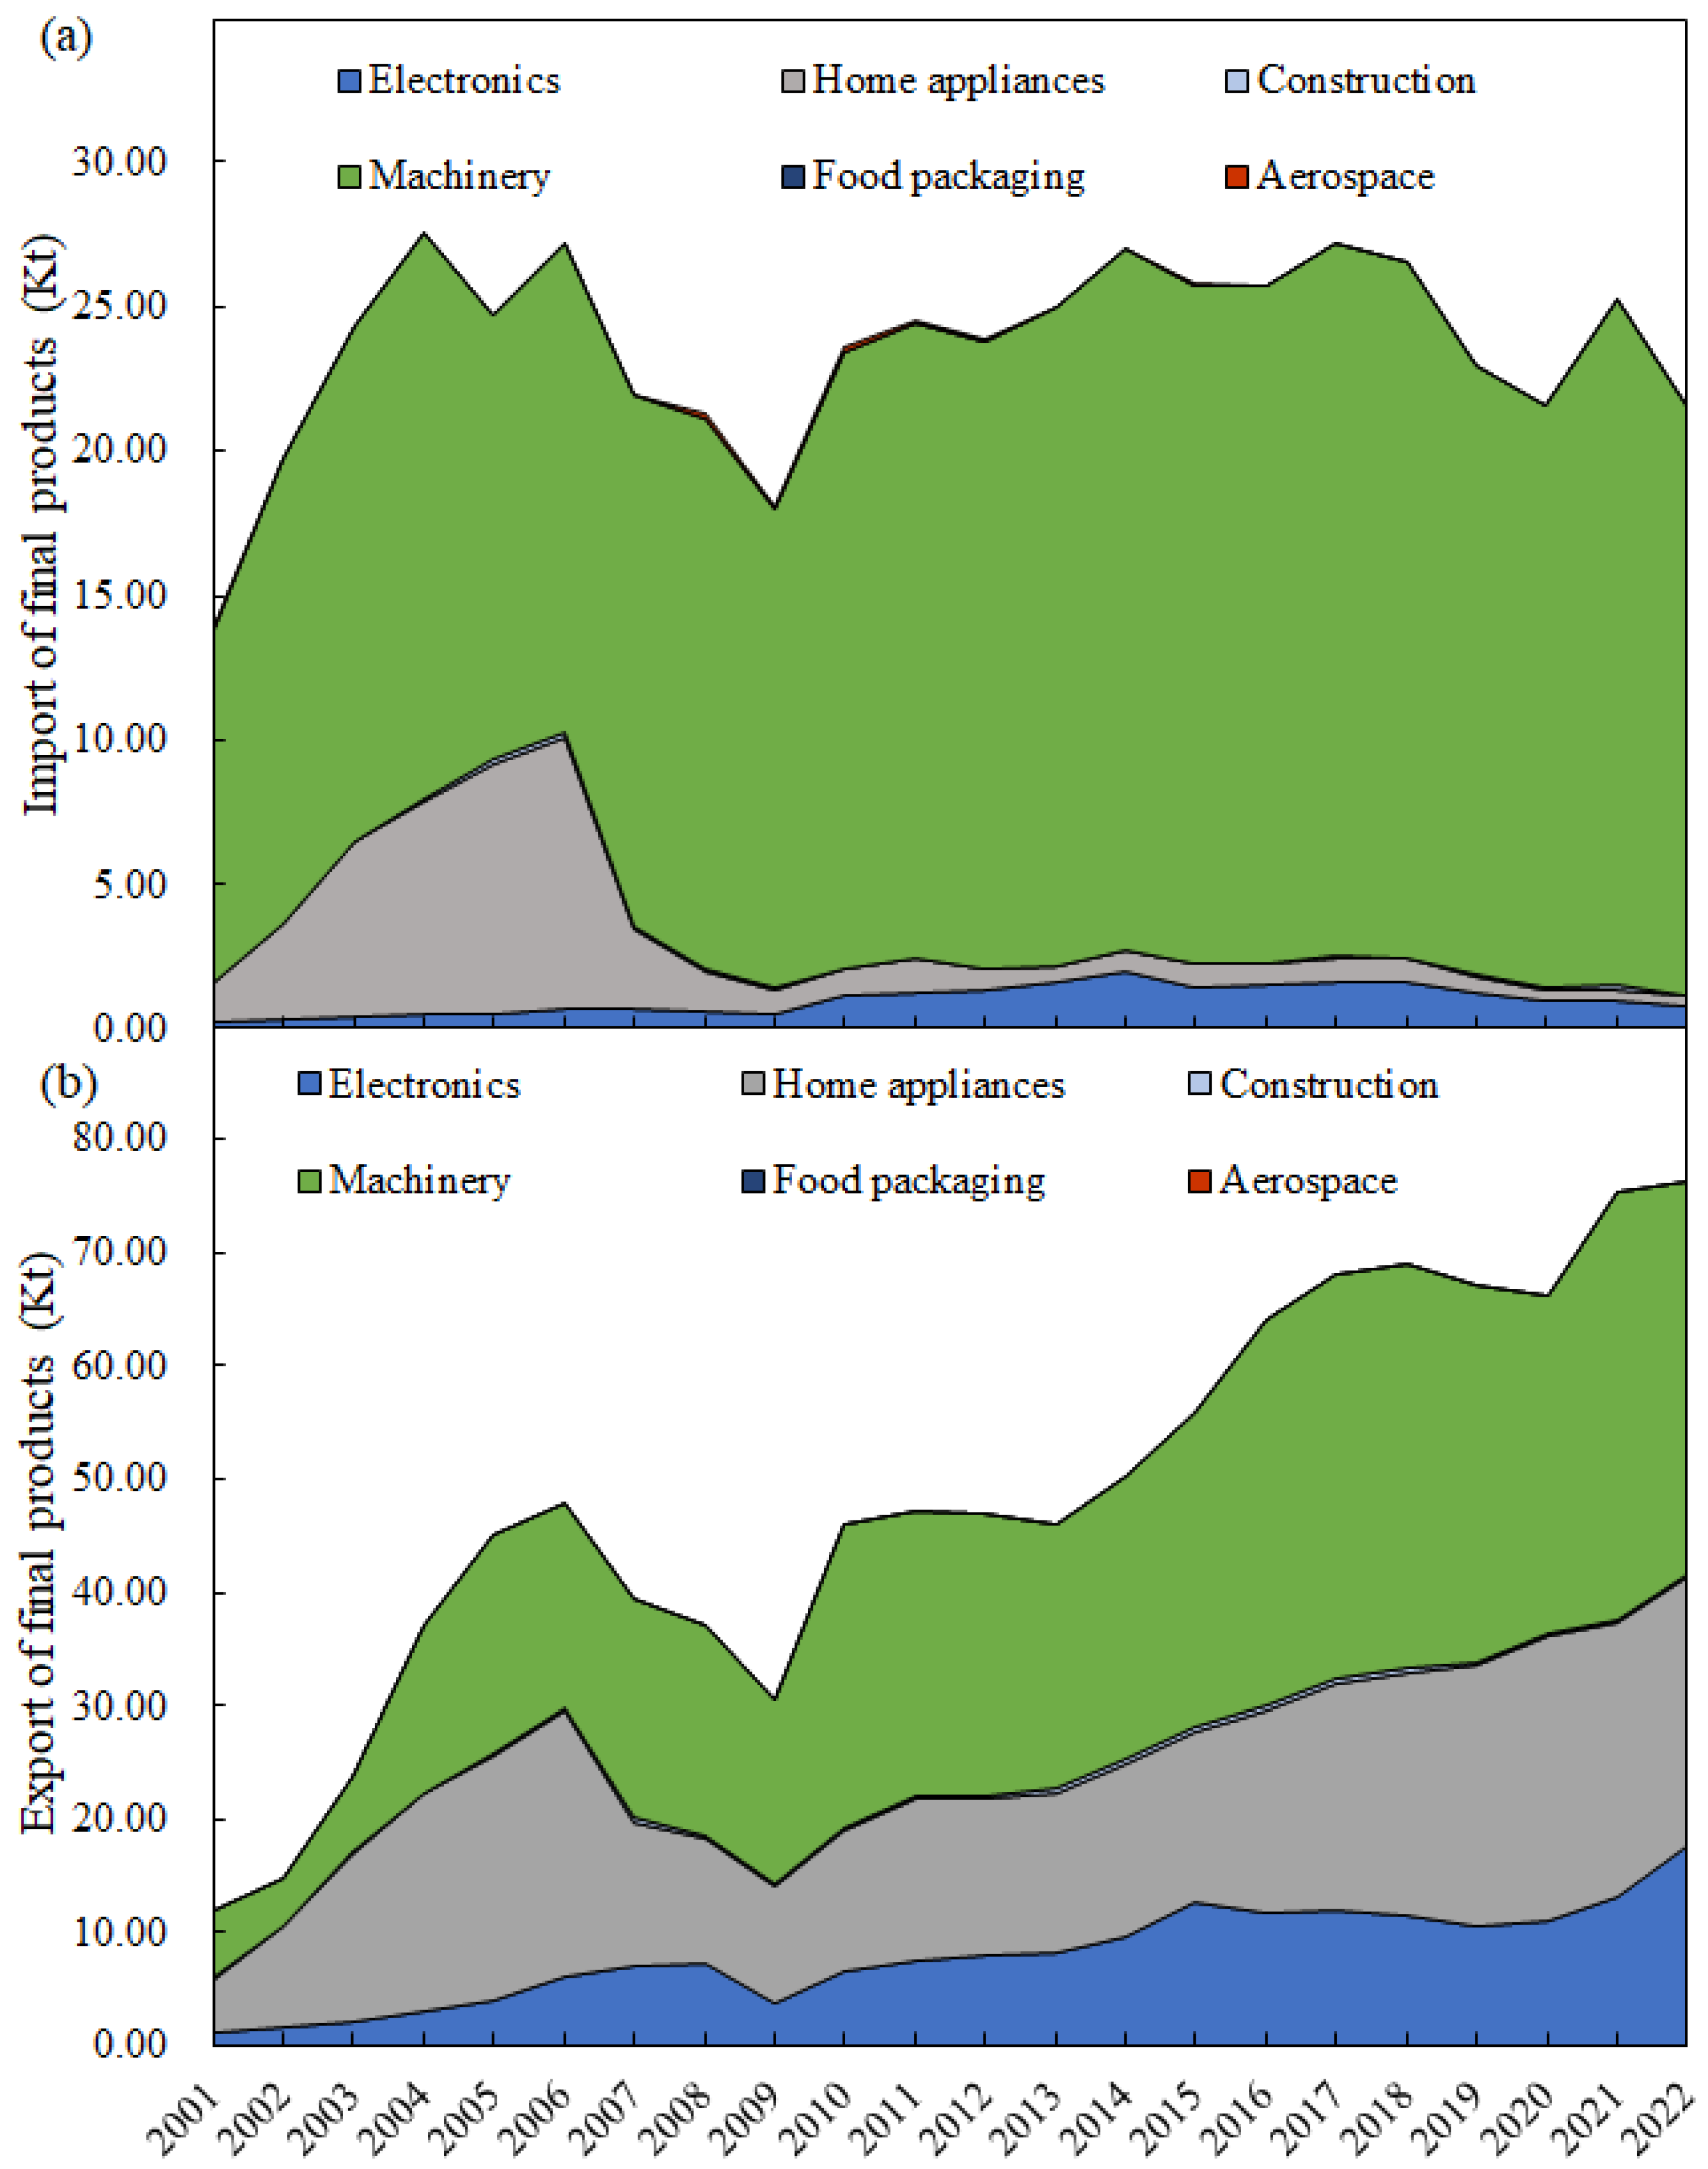
Figure 7 indicates the trade evolution of China’s tin-containing final products over the period of 2001 to 2022. Figure 7a shows that machinery was the dominant sector for total imported tin-containing final products, accounting for 85.66% (444.9 Kt) of the total imported final products (519.4 Kt) during the study period, followed by home appliances (50.2 Kt, 9.66%). Other imported final products include electronics, construction, aerospace, and food packaging, with figures of 22.0 Kt (4.24%), 1.4 Kt (0.27%), 876.9 tons (0.17%), and 9.5 tons (less than 0.01%), respectively. In addition, the imported tin embodied in various final products varied between 13.9 Kt in 2001 and 21.6 Kt in 2022, with machinery being the dominant consumption sector.
Figure 7b shows that machinery and home appliances were the top two sectors for total exported tin-containing final products, accounting for 48.42% (516.1 Kt) and 34.40% (366.7 Kt) of the total exports (1.07 Mt), respectively, followed by electronics (177.0 Kt, 16.61%). Other exported products, including those from construction, food packaging, and aerospace sectors, accounted for less than 1% of the overall export volume. In addition, exported tin embodied in various final products varied between 12.0 Kt in 2001 and 76.3 Kt in 2022, with machinery being the dominant consumption sector.

3.2. Uncertainty Analysis Results

Uncertainty analysis was implemented in order for the robustness of these outcomes to be tested. The results illustrated in Figure S1 show that the deviations of cumulative in-use stocks ranged from −4.52% to 4.44%, while those for end-of-life (EoL) flows ranged from −2.71% to 2.76%. Such results indicate that the MFA results are reliable and accurately represent the actual conditions of China’s tin in-use stocks and EoL flows.

4. Discussion

4.1. Results Comparison

There is a serious tin supply risk due to the limited endowment of tin resources [54]. The accelerating advancement of photovoltaic panels, 5G technologies, semiconductors, and electric vehicles is expected to drive sustained growth in global tin demand, potentially resulting in future supply shortages [8]. As a major tin producer and consumer, China’s tin resource management can greatly influence global tin markets. Therefore, this study conducted a dynamic MFA from 2001 to 2022 to trace China’s tin flows and stocks. The results obtained from this study that annual domestic tin consumption rose from 49.3 Kt in 2001 to 161.5 Kt by 2022, with the electronics sector making the largest contribution, are consistent with the points made by Yang et al. [41] and Yang et al. [55], who reported that the electronics sector was the dominant contributor to tin consumption. The results showed that the cumulative amount of intermediate products was 3.86 Mt, with solder being the largest contributor (49.04%). These findings aligned with those of Yang et al. [41], in which solder was the dominant contributor to refined tin consumption.

4.2. Advancing the Recycling of Tin

The results (Figure 2) show that the cumulative dissipative flow of tin to the environment as tailings reached 1.06 Mt during the study period. Although the beneficiation of tin ores has integrated several methods, instead of a single gravity separation method, this gravity beneficiation method remains the major beneficiation method for tin ores. However, the flotation of fine cassiterite has recently been explored because froth flotation can recover fine particles. This technological innovation can help improve the beneficiation efficiency of tin ores. In addition, many tin ores exist in the form of accompanying components. This means that more attention should be paid to the recovery and utilization of such associated resources so that the comprehensive utilization level of tin ores can be improved. Moreover, the grade of underground tin ores decreased from 1.06% in 2001 to 0.64% in 2022, while the ore grade for the milling process decreased from 0.88% in 2001 to 0.46% in 2022 [44,45]. Such decreases in ore grade mean that it is crucial to improve the beneficiation efficiency. In this regard, several economic incentives should be applied so that technological advances can be achieved, such as governmental subsidies and mining taxes. The results (Figure 4) also indicate that more tin resources have been used in making various electronics products and home appliances, but most of such products have reduced life spans due to rapid technological improvements, which will eventually lead to more electrical and electronic waste [41,51]. Therefore, more efforts should be made to recover tin from such waste. Research on tin recycling from secondary sources has been explored, offering possibilities for the recovery and reuse of secondary tin resources. For example, recycling tin from sources such as electrical and electronic equipment waste [41], tin refining sulfur slag [56], waste indium tin oxide [57], tin-bearing alloys [58], tin tailings [59], and tin middling [60] has also been investigated. However, there is a lack of an efficient collection system for such secondary tin resources. Although tin recycling has been actively promoted in China (Figure S2), more research and development (R&D) efforts should be supported through university–industrial partnerships so that research needs can be identified quickly.

4.3. Advancing Geological Exploration

Despite being the world’s leading producer of refined tin—with an output of 0.17 Mt in 2022—China remains heavily reliant on imports to satisfy its internal demand. The external dependence on tin concentrates reached 71.97% in 2022 [9]. The global life span of identified tin ore reserves was 15 years in 2022, while such a figure was only 8 years in China [9]. Therefore, it is imperative for the Chinese government to intensify geological exploration efforts to secure additional tin resources. Moreover, various measures should be taken to phase out small-scaled tin producers due to their insufficient technologies and management. Furthermore, capacity-building initiatives should be implemented to enable tin-related stakeholders to participate actively in cleaner production practices, thereby enhancing overall tin resource efficiency.

4.4. Optimizing Tin Trade Structure

Because tin can help connect various components on circuit boards, it is essential for manufacturing electronic devices. In addition, tin is used as one raw material for making data storage devices and Internet of Things devices. Swift expansion of China’s digital economy has induced a high demand for tin, necessitating greater reliance on imported tin resources to bridge the supply gap. Specifically, Myanmar has become a key tin supplier to China, occupying 76.82% of China’s entire tin import in 2022. Unfortunately, Myanmar is not a politically and economically stable country; its civil war and other geopolitical factors may seriously influence its tin supply to China. Consequently, it is imperative for China to expand and diversify its tin import sources. China should keep good relations with other tin-rich nations, such as Russia, Brazil, and Australia. Chinese tin mining companies should actively work with their counterparts in these countries through overseas investments and technological transfer. In addition, Chinese tin-associated corporations should collaborate with relevant companies within developed countries so that they can obtain more secondary tin resources.

4.5. Promote Regional Cooperation

Global tin reserves were reported to be 4.6 Mt in 2022, mainly distributed in Asia and South America [46]. Such a concentrated distribution of tin resources may lead to a potential tin resource supply risk (Figure S3). Regional cooperation can help alleviate such a risk. In this regard, the tin reserves in China, Indonesia, Myanmar, Vietnam, and Russia accounted for approximately 58% of the global tin reserves [46]. But only China has relatively mature tin refining and production technologies. Therefore, this study suggests that China actively work with other tin-rich countries through technological transfer.

5. Conclusions

China is experiencing rapid and unprecedented advancements in industrialization and intelligent technologies, which have substantially accelerated the growth of resource production and consumption. In particular, tin has played a progressively critical part as clean techniques have emerged. This pivotal role is particularly pronounced in electric vehicle technologies, which heavily rely on the development of the electronics industry. This study employed a dynamic MFA to trace the evolution of China’s tin flows and in-use tin stocks from 2001 to 2022. The dynamic MFA results reveal that the national in-use stocks of tin reached 913.3 Kt in 2022, an increase from 49.2 Kt in 2001. The results also show that the major tin application fields were electronics (22.54%) and home appliances (21.58%) during the study years. In addition, the largest contributors to in-use tin stocks were home appliances (22.59%) and electronics (20.64%), which may be potential sources for secondary tin resources in the future. China had high reliance on imported tin resources during the study period to satisfy the need for domestic and foreign markets. Improving the resource efficiency of secondary tin is recommended so that tin supply risk resilience can be improved. Moreover, formulating strategic initiatives to diversify tin supply channels and strengthen international collaboration is also essential for bolstering the security of China’s tin supply.
This study had several limitations. Although the dynamic MFA approach used in this study can be replicated for other regions or metals, provided that accurate and consistent data are available, the replicability of this study depends on the quality and availability of data across different time periods and geographic regions. Also, this study only conducted a dynamic MFA at the national level from 2001 to 2022 because provincial data were not available. Thus, a comprehensive study showing the tendency of tin stocks and flows at the provincial level will be explored in the future, when data are available. In addition, regions in China are experiencing imbalanced economic development owing to regional heterogeneity in industrial structure. In this regard, more region-specific solutions will be discussed in a future study aimed at enhancing the efficiency of tin resource utilization.

Supplementary Materials

The following supporting information can be downloaded at: https://www.mdpi.com/article/10.3390/systems13080622/s1, Table S1: The tin contents of various trade tin-containing products; Table S2: Loss of tin in various stages; Table S3: Lifespan of tin-containing final products; Table S4: Amount of China’s tin consumption from 2001 to 2022 (Unit: Kt tin); Table S5: Production of tin concentrate in China from 2001 to 2022; Figure S1: Uncertainty analysis of cumulative in-use stocks and end-of-life flows; Figure S2: Production of secondary tin in China from 2001 to 2022; Figure S3: Global tin reserves and tin production in 2022.

Author Contributions

Conceptualization, W.C. and Y.G.; methodology, W.C. and Z.G.; software, W.C. and L.H.; formal analysis, W.C.; investigation, L.H. and Y.W.; data curation, L.H. and Y.W.; writing—original draft preparation, W.C., Y.G. and Z.G.; writing—review and editing, Y.G.; visualization, L.H.; supervision, Y.G.; funding acquisition, W.C. and Y.G. All authors have read and agreed to the published version of the manuscript.

Funding

This study is supported by the National Natural Science Foundation of China (Grant No. 72004125, 72088101 and 42401220), Ministry of Education of the People’s Republic of China (Grant No. 24YJC630016), the China Postdoctoral Science Foundation (Grant No. 2023M732228), and the Education Department of Shandong Province (Grant No. 2022RW063).

Data Availability Statement

The data are available upon request.

Conflicts of Interest

The authors declare no conflict of interest.

References

  1. Valero, A.; Valero, A.; Calvo, G.; Ortego, A. Material bottlenecks in the future development of green technologies. Renew. Sustain. Energy Rev. 2018, 93, 178–200. [Google Scholar] [CrossRef]
  2. Calvo, G.; Valero, A. Strategic mineral resources: Availability and future estimations for the renewable energy sector. Environ. Dev. 2022, 41, 100640. [Google Scholar] [CrossRef]
  3. Li, H.; Qin, W.; Li, J.; Tian, Z.; Jiao, F.; Yang, C. Tracing the global tin flow network: Highly concentrated production and consumption. Resour. Conserv. Recycl. 2021, 169, 105495. [Google Scholar] [CrossRef]
  4. Chen, W.; Hu, L.; Zhang, T.; Hong, J.; Geng, Y. Evaluating the environmental impacts of tin ingot production in China: Insight from life cycle assessment. Environ. Impact Assess. Rev. 2025, 115, 108049. [Google Scholar] [CrossRef]
  5. Yang, X.; Guo, Y.; Liu, Q.; Zhang, D. Dynamic co-evolution analysis of low-carbon technology innovation compound system of new energy enterprise based on the perspective of sustainable development. J. Clean. Prod. 2022, 349, 131330. [Google Scholar] [CrossRef]
  6. Yu, S.; Duan, H.; Cheng, J. An evaluation of the supply risk for China’s strategic metallic mineral resources. Resour. Policy 2021, 70, 101891. [Google Scholar] [CrossRef]
  7. Fan, X.; Li, H.; Yu, Q.; Xu, J.; Li, M. Assessment of sustainable supply capability of Chinese tin resources based on the entropy weight-TOPSIS model. Sustainability 2023, 15, 13076. [Google Scholar] [CrossRef]
  8. China Nonferrous Metals Industry Association (CNMIA). 2023 Report on the Development of Non-Ferrous Metals in China; Metallurgical Industry Press: Beijing, China, 2023. [Google Scholar]
  9. China Bulk Commodity (CBC). China Bulk Commodity Database. Available online: https://www.cbcie.com/news/index.html (accessed on 13 July 2025).
  10. Izard, C.; Müller, D. Tracking the devil’s metal: Historical global and contemporary U.S. tin cycles. Resour. Conserv. Recycl. 2010, 54, 1436–1441. [Google Scholar] [CrossRef]
  11. Wang, X.; Tian, X.; Geng, Y. Uncovering the key determinants on the disruption of ores supply. Resour. Conserv. Recycl. 2025, 212, 107953. [Google Scholar] [CrossRef]
  12. Brunner, P.; Rechberger, H. Handbook of Material Flow Analysis: For Environmental, Resource, and Waste Engineers; CRC Press: Boca Raton, FL, USA, 2016. [Google Scholar]
  13. Deng, T.; Zhang, Y.; Fu, C. Modelling dynamic interactions between material flow and stock: A review of dynamic material flow analysis. Ecol. Indic. 2023, 156, 111098. [Google Scholar] [CrossRef]
  14. Widiyanti, A.; Rancak, G.T.; Ramadan, B.S.; Hanaseta, E. Comprehensive literature review of material flow analysis (MFA) of plastics waste: Recent trends, policy, management, and methodology. J. Mater. Cycles Waste Manag. 2025, 27, 1–18. [Google Scholar] [CrossRef]
  15. Houssini, K.; Li, J.; Tan, Q. Complexities of the global plastics supply chain revealed in a trade-linked material flow analysis. Commun. Earth Environ. 2025, 6, 257. [Google Scholar] [CrossRef]
  16. Wang, R.; Haller, P. Dynamic material flow analysis of wood in Germany from 1991 to 2020. Resour. Conserv. Recycl. 2024, 201, 107339. [Google Scholar] [CrossRef]
  17. Islam, M.T.; Huda, N. Material flow analysis (MFA) as a strategic tool in E-waste management: Applications, trends and future directions. J. Environ. Manag. 2019, 244, 344–361. [Google Scholar] [CrossRef] [PubMed]
  18. Augiseau, V.; Barles, S. Studying construction materials flows and stock: A review. Resour. Conserv. Recycl. 2017, 123, 153–164. [Google Scholar] [CrossRef]
  19. Chen, W.; Wang, P.; Zhao, S.; Chen, W.Q. Material flow analysis of rare earth elements: A comprehensive review. Sci. Technol. Rev. 2022, 40, 14–26. (In Chinese) [Google Scholar]
  20. Wiedenhofer, D.; Baumgart, A.; Matej, S.; Virág, D.; Kalt, G.; Lanau, M.; Tingley, D.D.; Liu, Z.; Guo, J.; Tanikawa, H.; et al. Mapping and modelling global mobility infrastructure stocks, material flows and their embodied greenhouse gas emissions. J. Clean. Prod. 2024, 434, 139742. [Google Scholar] [CrossRef]
  21. Li, Y.; Li, M.; Sang, P. A bibliometric review of studies on construction and demolition waste management by using CiteSpace. Energy Build. 2022, 258, 111822. [Google Scholar] [CrossRef]
  22. Li, Q.; Dai, T.; Wang, G.; Cheng, J.; Zhong, W.; Wen, B.; Liang, L. Iron material flow analysis for production, consumption, and trade in China from 2010 to 2015. J. Clean. Prod. 2018, 172, 1807–1813. [Google Scholar] [CrossRef]
  23. Rabab, N.; Geng, Y.; Cai, W.; Gu, W.; Gao, Z.; Shi, J. Uncovering the key features of iron metabolism in Pakistan from 2005 to 2020: A dynamic material flow analysis. Struct. Change Econ. Dyn. 2024, 71, 261–269. [Google Scholar] [CrossRef]
  24. Grund, S.; van Genderen, E.; van Leeuwen, M. Using Material Flow Analysis to Identifying Global and Regional Opportunities for Zinc Circularity. J. Adv. Manuf. Process. 2025, e70020. [Google Scholar] [CrossRef]
  25. Choi, H.; Hwang, Y.; Kim, J.; Kang, H.; Kim, D. Material flow and domestic demand analysis for nickel in South Korea. J. Clean. Prod. 2024, 449, 141711. [Google Scholar] [CrossRef]
  26. Yuan, N.; Geng, Y.; Mei, Y.; Gao, Z. Material flow analysis of molybdenum in China during 2000–2020. JOM 2024, 76, 2004–2015. [Google Scholar] [CrossRef]
  27. Zhu, E.; Geng, Y.; Xiao, S.; Guo, T.; Gao, Z.Y.; Gao, Z. Mapping the evolution of manganese flows and stocks in China from 2000 to 2021. Resour. Environ. Sustain. 2024, 16, 100152. [Google Scholar] [CrossRef]
  28. Eheliyagoda, D.; Li, J.; Geng, Y.; Zeng, X. The role of China’s aluminum recycling on sustainable resource and emission pathways. Resour. Policy 2022, 76, 102552. [Google Scholar] [CrossRef]
  29. Lei, Y.; Xu, X.; Li, J.; Wang, H.; Yue, Q.; Chen, W. Material flows and embodied carbon emissions of aluminum used in China’s photovoltaic industry from 2000 to 2020. Resour. Conserv. Recycl. 2025, 215, 108055. [Google Scholar] [CrossRef]
  30. Glöser, S.; Soulier, M.; Tercero Espinoza, L. Dynamic analysis of global copper flows. Global stocks, postconsumer material flows, recycling indicators, and uncertainty evaluation. Environ. Sci. Technol. 2013, 47, 6069–6724. [Google Scholar] [CrossRef]
  31. Lin, S.; Mao, J.; Chen, W.; Shi, L. Indium in mainland China: Insights into use, trade, and efficiency from the substance flow analysis. Resour. Conserv. Recycl. 2019, 149, 312–321. [Google Scholar] [CrossRef]
  32. Li, Z.; Wang, C.; Chen, J. Supply and demand of lithium in China based on dynamic material flow analysis. Renew. Sustain. Energy Rev. 2024, 203, 114786. [Google Scholar] [CrossRef]
  33. Zhang, Q.; Huang, Z.; Liu, B.; Ma, T. Sustainable lithium supply for electric vehicle development in China towards carbon neutrality. Energy 2025, 320, 135243. [Google Scholar] [CrossRef]
  34. Zheng, B.; Zhang, Y.; Geng, Y.; Wei, W.; Ge, Z.; Gao, Z. Investigating lanthanum flows and stocks in China: A dynamic material flow analysis. J. Clean. Prod. 2022, 368, 133204. [Google Scholar] [CrossRef]
  35. Zhao, S.; Wang, P.; Chen, W.; Wang, L.; Wang, Q.; Chen, W. Supply and demand conflicts of critical heavy rare earth element: Lessons from gadolinium. Resour. Conserv. Recycl. 2023, 199, 107254. [Google Scholar] [CrossRef]
  36. Liang, Z.; Geng, Y.; Zhong, C.; Xiao, S.; Wei, W. Tracking the evolution of niobium cycle in China from 2000 to 2021: A dynamic material flow analysis. J. Clean. Prod. 2024, 434, 140455. [Google Scholar] [CrossRef]
  37. Han, Z.; Liu, Q.; Ouyang, X.; Song, H.; Gao, T.; Liu, Y. Tracking two decades of global gallium stocks and flows: A dynamic material flow analysis. Resour. Conserv. Recycl. 2024, 202, 107391. [Google Scholar] [CrossRef]
  38. Gao, Z.; Geng, Y.; Li, M.; Liang, J.; Houssini, K. Tracking the global anthropogenic gallium cycle during 2000–2020: A trade-linked multiregional material flow analysis. Glob. Environ. Change 2024, 87, 102859. [Google Scholar] [CrossRef]
  39. Zhu, X.; Geng, Y.; Gao, Z.; Tian, X.; Xiao, S.; Houssini, K. Investigating zirconium flows and stocks in China: A dynamic material flow analysis. Resour. Policy 2023, 80, 103139. [Google Scholar] [CrossRef]
  40. Xiao, S.; Geng, Y.; Pan, H.; Gao, Z.; Yao, T. Uncovering the key features of dysprosium flows and stocks in China. Environ. Sci. Technol. 2022, 56, 8682–8690. [Google Scholar] [CrossRef]
  41. Yang, C.; Tan, Q.; Zeng, X.; Zhang, Y.; Wang, Z.; Li, J. Measuring the sustainability of tin in China. Sci. Total Environ. 2018, 635, 1351–1359. [Google Scholar] [CrossRef]
  42. Brunner, P.; Rechberger, H. Practical handbook of material flow analysis. Int. J. Life Cycle Assess. 2004, 9, 337–338. [Google Scholar] [CrossRef]
  43. Chowdhury, R.; Zhang, X. Phosphorus use efficiency in agricultural systems: A comprehensive assessment through the review of national scale substance flow analyses. Ecol. Indic. 2021, 121, 107172. [Google Scholar] [CrossRef]
  44. China Nonferrous Metals Industry Association (CNMIA). The Yearbook of Nonferrous Metals Industry of China 2002–2022; China Nonferrous Metals Industry Yearbook Press: Beijing, China, 2003–2024. [Google Scholar]
  45. China Nonferrous Metals Industry Association (CNMIA). 2023 The Yearbook of Nonferrous Metals Industry of China; China Nonferrous Metals Industry Yearbook Press: Beijing, China, 2025. [Google Scholar]
  46. The United States Geological Survey (USGS). Mineral Commodity Summaries. 2023. Available online: https://doi.org/10.3133/mcs2023 (accessed on 13 July 2025).
  47. UN Comtrade. 2000–2022. Available online: https://comtrade.un.org/data (accessed on 13 July 2025).
  48. Liu, L.; Zhao, H.; Liu, X.; Dai, T.; Liu, G. Cobalt material flow in the United States from 1995 to 2015. Resour. Sci. 2021, 43, 524–534. (In Chinese) [Google Scholar] [CrossRef]
  49. Huang, C.; Vause, J.; Ma, H.; Li, Y.; Yu, C. Substance flow analysis for nickel in mainland China in 2009. J. Clean. Prod. 2014, 84, 450–458. [Google Scholar] [CrossRef]
  50. Li, X.; Ren, Q.; Luo, Y.; Dai, T.; Wen, B.; Wang, M. Metabolic process of mechanical products iron resources based on material flow analysis in China. Resour. Sci. 2018, 40, 2329–2340. (In Chinese) [Google Scholar]
  51. Guo, X.; Yan, K.; Zhang, J.; Huang, G.; Tian, Q. Analysis of metal resource exploitation potential in typical e-waste. Trans. Nonferrous Met. Soc. China 2018, 28, 365–376. (In Chinese) [Google Scholar]
  52. Zheng, B.; Zhang, Y.; Geng, Y.; Wei, W.; Tan, X.; Xiao, S.; Gao, Z. Measuring the anthropogenic cycles of light rare earths in China: Implications for the imbalance problem. Sci. Total Environ. 2023, 879, 163215. [Google Scholar] [CrossRef] [PubMed]
  53. Mei, Y.; Geng, Y.; Xiao, S.; Su, C.; Gao, Z.; Wei, W. Dynamic material flow analysis of rhenium in China for 2011–2020. Resour. Policy 2023, 86, 104141. [Google Scholar] [CrossRef]
  54. Zhong, Q.; Li, Y.; Wang, Y.; Wang, H.; Li, H.; Liang, Y.; Liang, S. Revisiting metal footprints of nations with a reserve-side scarcity indicator. Ecol. Indic. 2022, 145, 109677. [Google Scholar] [CrossRef]
  55. Yang, C.; Zeng, X.; Li, H.; Tian, Z.; Liu, W.; Qin, W.; Li, J. Uncovering the evolution of tin use in the United States and its implications. Front. Environ. Sci. Eng. 2021, 15, 118. [Google Scholar] [CrossRef]
  56. Ma, J.; Huang, D.; Tian, Y.; Yang, H.; Chen, X.; Xu, B.; Yang, B.; Li, Y. Separation and recovery of tin and copper from tin refining sulfur slag using a new process of airtight sulfuration-Vacuum distillation. J. Clean. Prod. 2022, 378, 134553. [Google Scholar] [CrossRef]
  57. Xu, W.; Chen, X.; Liu, D.; Jiang, W.; Yang, B. Systematic thermodynamic and experimental studies for recovering indium and tin from indium tin oxide waste target with hydrogen. J. Clean. Prod. 2023, 429, 139328. [Google Scholar] [CrossRef]
  58. Fogarasi, S.; Imre-Lucaci, F.; Fogarasi, M.; Imre-Lucaci, Á. Technical and environmental assessment of selective recovery of tin and lead from waste solder alloy using direct anodic oxidation. J. Clean. Prod. 2019, 213, 872–883. [Google Scholar] [CrossRef]
  59. Zhang, Y.; Wang, J.; Cao, C.; Su, Z.; Chen, Y.; Lu, M.; Liu, S.; Jiang, T. New understanding on the separation of tin from magnetite-type, tin-bearing tailings via mineral phase reconstruction processes. J. Mater. Res. Technol. 2019, 8, 5790–5801. [Google Scholar] [CrossRef]
  60. Yu, Y.; Li, L.; Wang, J. Sn recovery from a tin-bearing middling with a high iron content and the transformation behaviours of the associated As, Pb, and Zn. Sci. Total Environ. 2020, 744, 140863. [Google Scholar] [CrossRef]
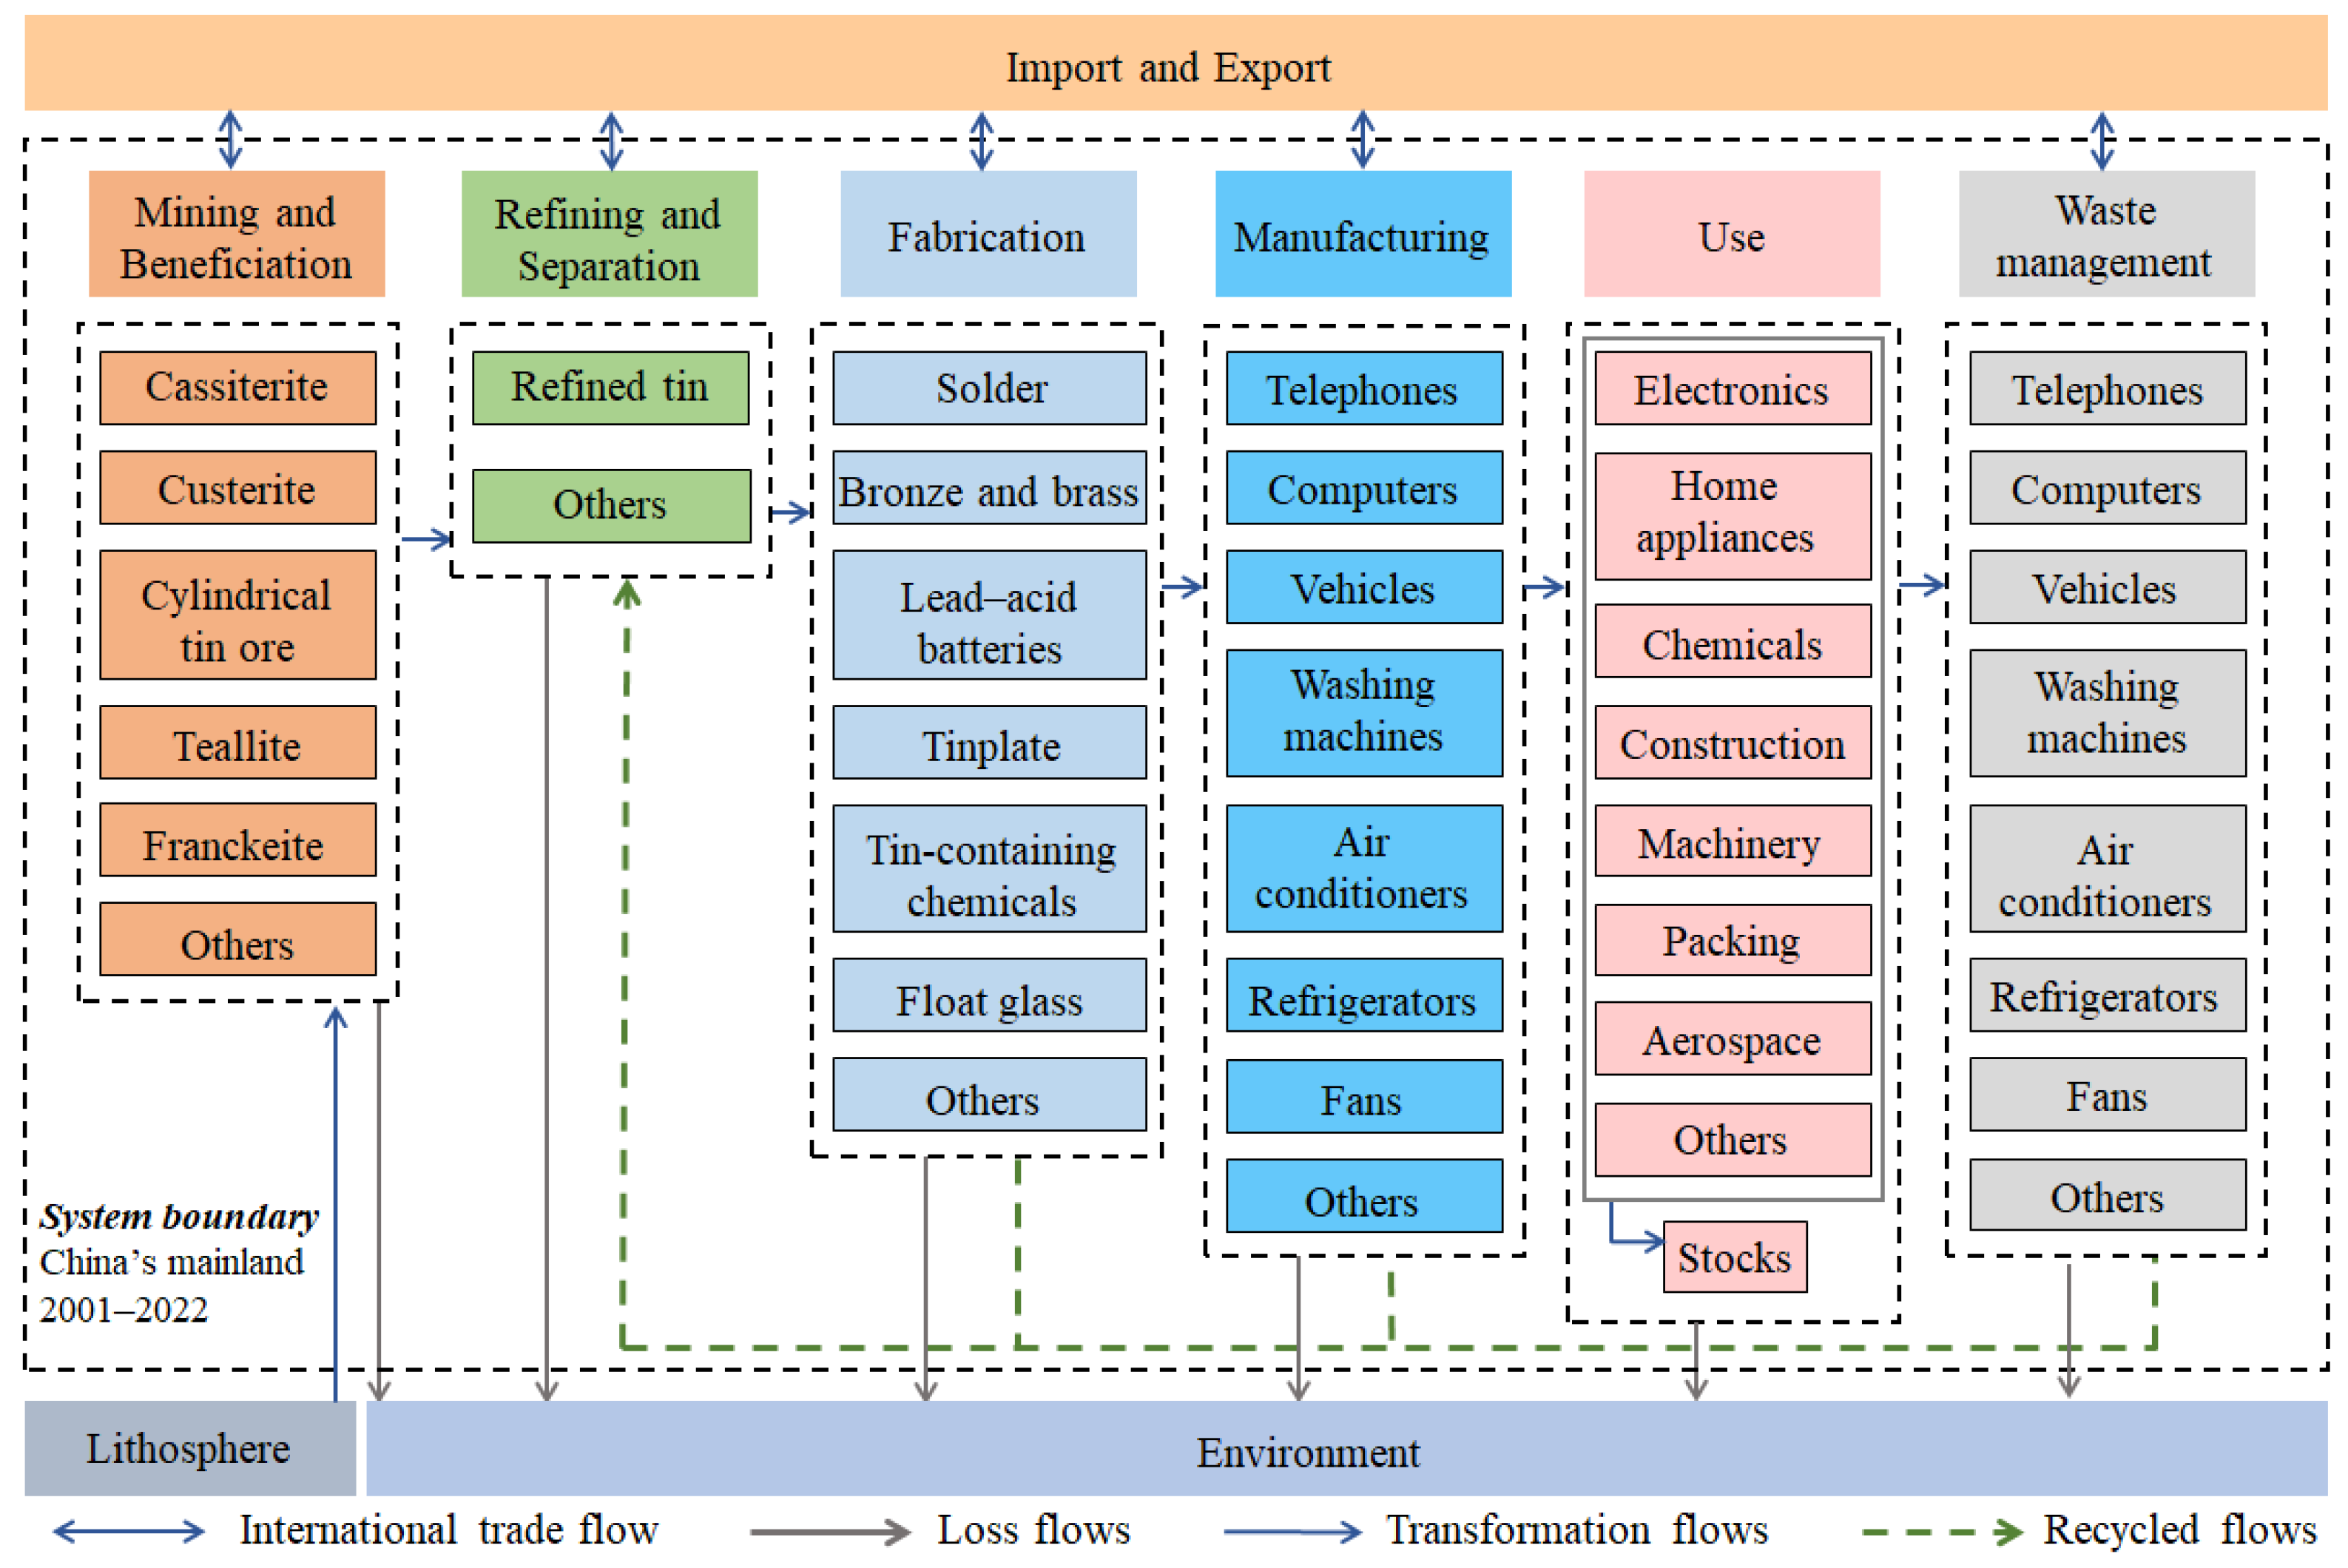
Figure 1. Framework of tin material flow analysis in China.
Systems 13 00622 g001
Figure 2. China’s tin flows and stocks in the period of 2001 to 2022.
Systems 13 00622 g002
Figure 3. Contribution of tin-containing intermediate products to tin consumption: (a) output of intermediate products; (b) contributions of intermediate products.
Systems 13 00622 g003
Figure 4. Percentages of different tin-containing final products in overall tin consumption: (a) outputs of final products; (b) contributions of various final products.
Systems 13 00622 g004
Figure 5. Trends in in-use tin stocks and EoL tin flows between 2001 and 2022: (a) in-use stock (Mt); (b) end-of-life flow (Mt).
Systems 13 00622 g005
Figure 6. Trade evolution of China’s tin-containing products between 2001 and 2022.
Systems 13 00622 g006
Figure 7. Trends in the trade of China’s tin-containing final products between 2001 and 2022: (a) import of final products (Kt); (b) export of final products (Kt).
Systems 13 00622 g007
Disclaimer/Publisher’s Note: The statements, opinions and data contained in all publications are solely those of the individual author(s) and contributor(s) and not of MDPI and/or the editor(s). MDPI and/or the editor(s) disclaim responsibility for any injury to people or property resulting from any ideas, methods, instructions or products referred to in the content.