
Automated Parcel Locker Configuration Using Discrete Event Simulation


Abstract
1. Introduction
- How can automated parcel locker stations be optimally configured—in terms of the number and mix of locker types (small, medium, large)—to accommodate stochastic demand flows characterized by random arrival rates, heterogeneous parcel size distributions, stochastic dwell time, and operational flexibility (dynamic parcel-to-locker allocation), while maximizing service-level performance (delivery success rate)?
- Do delivery quality standards (on-time delivery rate) affect the lockers’ feasible configuration?
- How do the key performance metrics for companies (locker utilization rate, variation of undelivered parcels inventory) balance with customers’ satisfaction and experience?
- It develops a methodological framework and simulation tool to optimize APL configuration.
- It demonstrates how stochastic demand and heterogeneous parcel sizes limit the possible locker configurations while balancing resource capacity and customer satisfaction in terms of on-time successful delivery.
- It integrates discrete event simulation and time-series econometrics to investigate the company’s operational performance metrics (including locker utilization rates and fluctuations in undelivered parcel inventory).
- It provides actionable recommendations for improving capacity planning for APL last-mile deliveries.
2. Modelling and Simulation Methodology
- Preventing overcrowding (predicts how many compartments are necessary at each location, helps avoid full lockers that annoy customers);
- Saving space in busy areas (determines the smallest possible locker size that still meets demand, important for dense urban areas where space is limited);
- Improving delivery efficiency (shows the right balance between small, medium, and large compartments, reduces wasted space from wrong-sized compartments);
- Saving money (prevents buying oversized lockers that are not fully used, avoids the cost of adding more lockers later);
- Matching local needs (customizes capacity based on neighborhood characteristics, residential areas might need different setups than business districts).
3. Computational Experiments and Results
- The number of generated parcels per type;
- The parcels’ dwell time;
- The number of parcels delivered on-time;
- The undelivered parcel inventory at the end of each day;
- The number of parcels distributed in distinct size lockers.
- is the margin of error of the probability;
- —is the estimated probability for on-time delivery;
- —is the sample size;
- —is the z score (.
- is the time series of the end-of-day undelivered x parcels (x is the size of the parcels, i.e., large, medium, small);
- —the detrended time series;
- —first difference of the detrended series;
- α—the key coefficient, β—detrended series coefficients;
- —the coefficients of the lags;
- —the error;
- p—the lag order of the autoregressive process.
- —unit root exists (non-stationary time series);
- —the time series is stationary.
4. Discussion
5. Conclusions
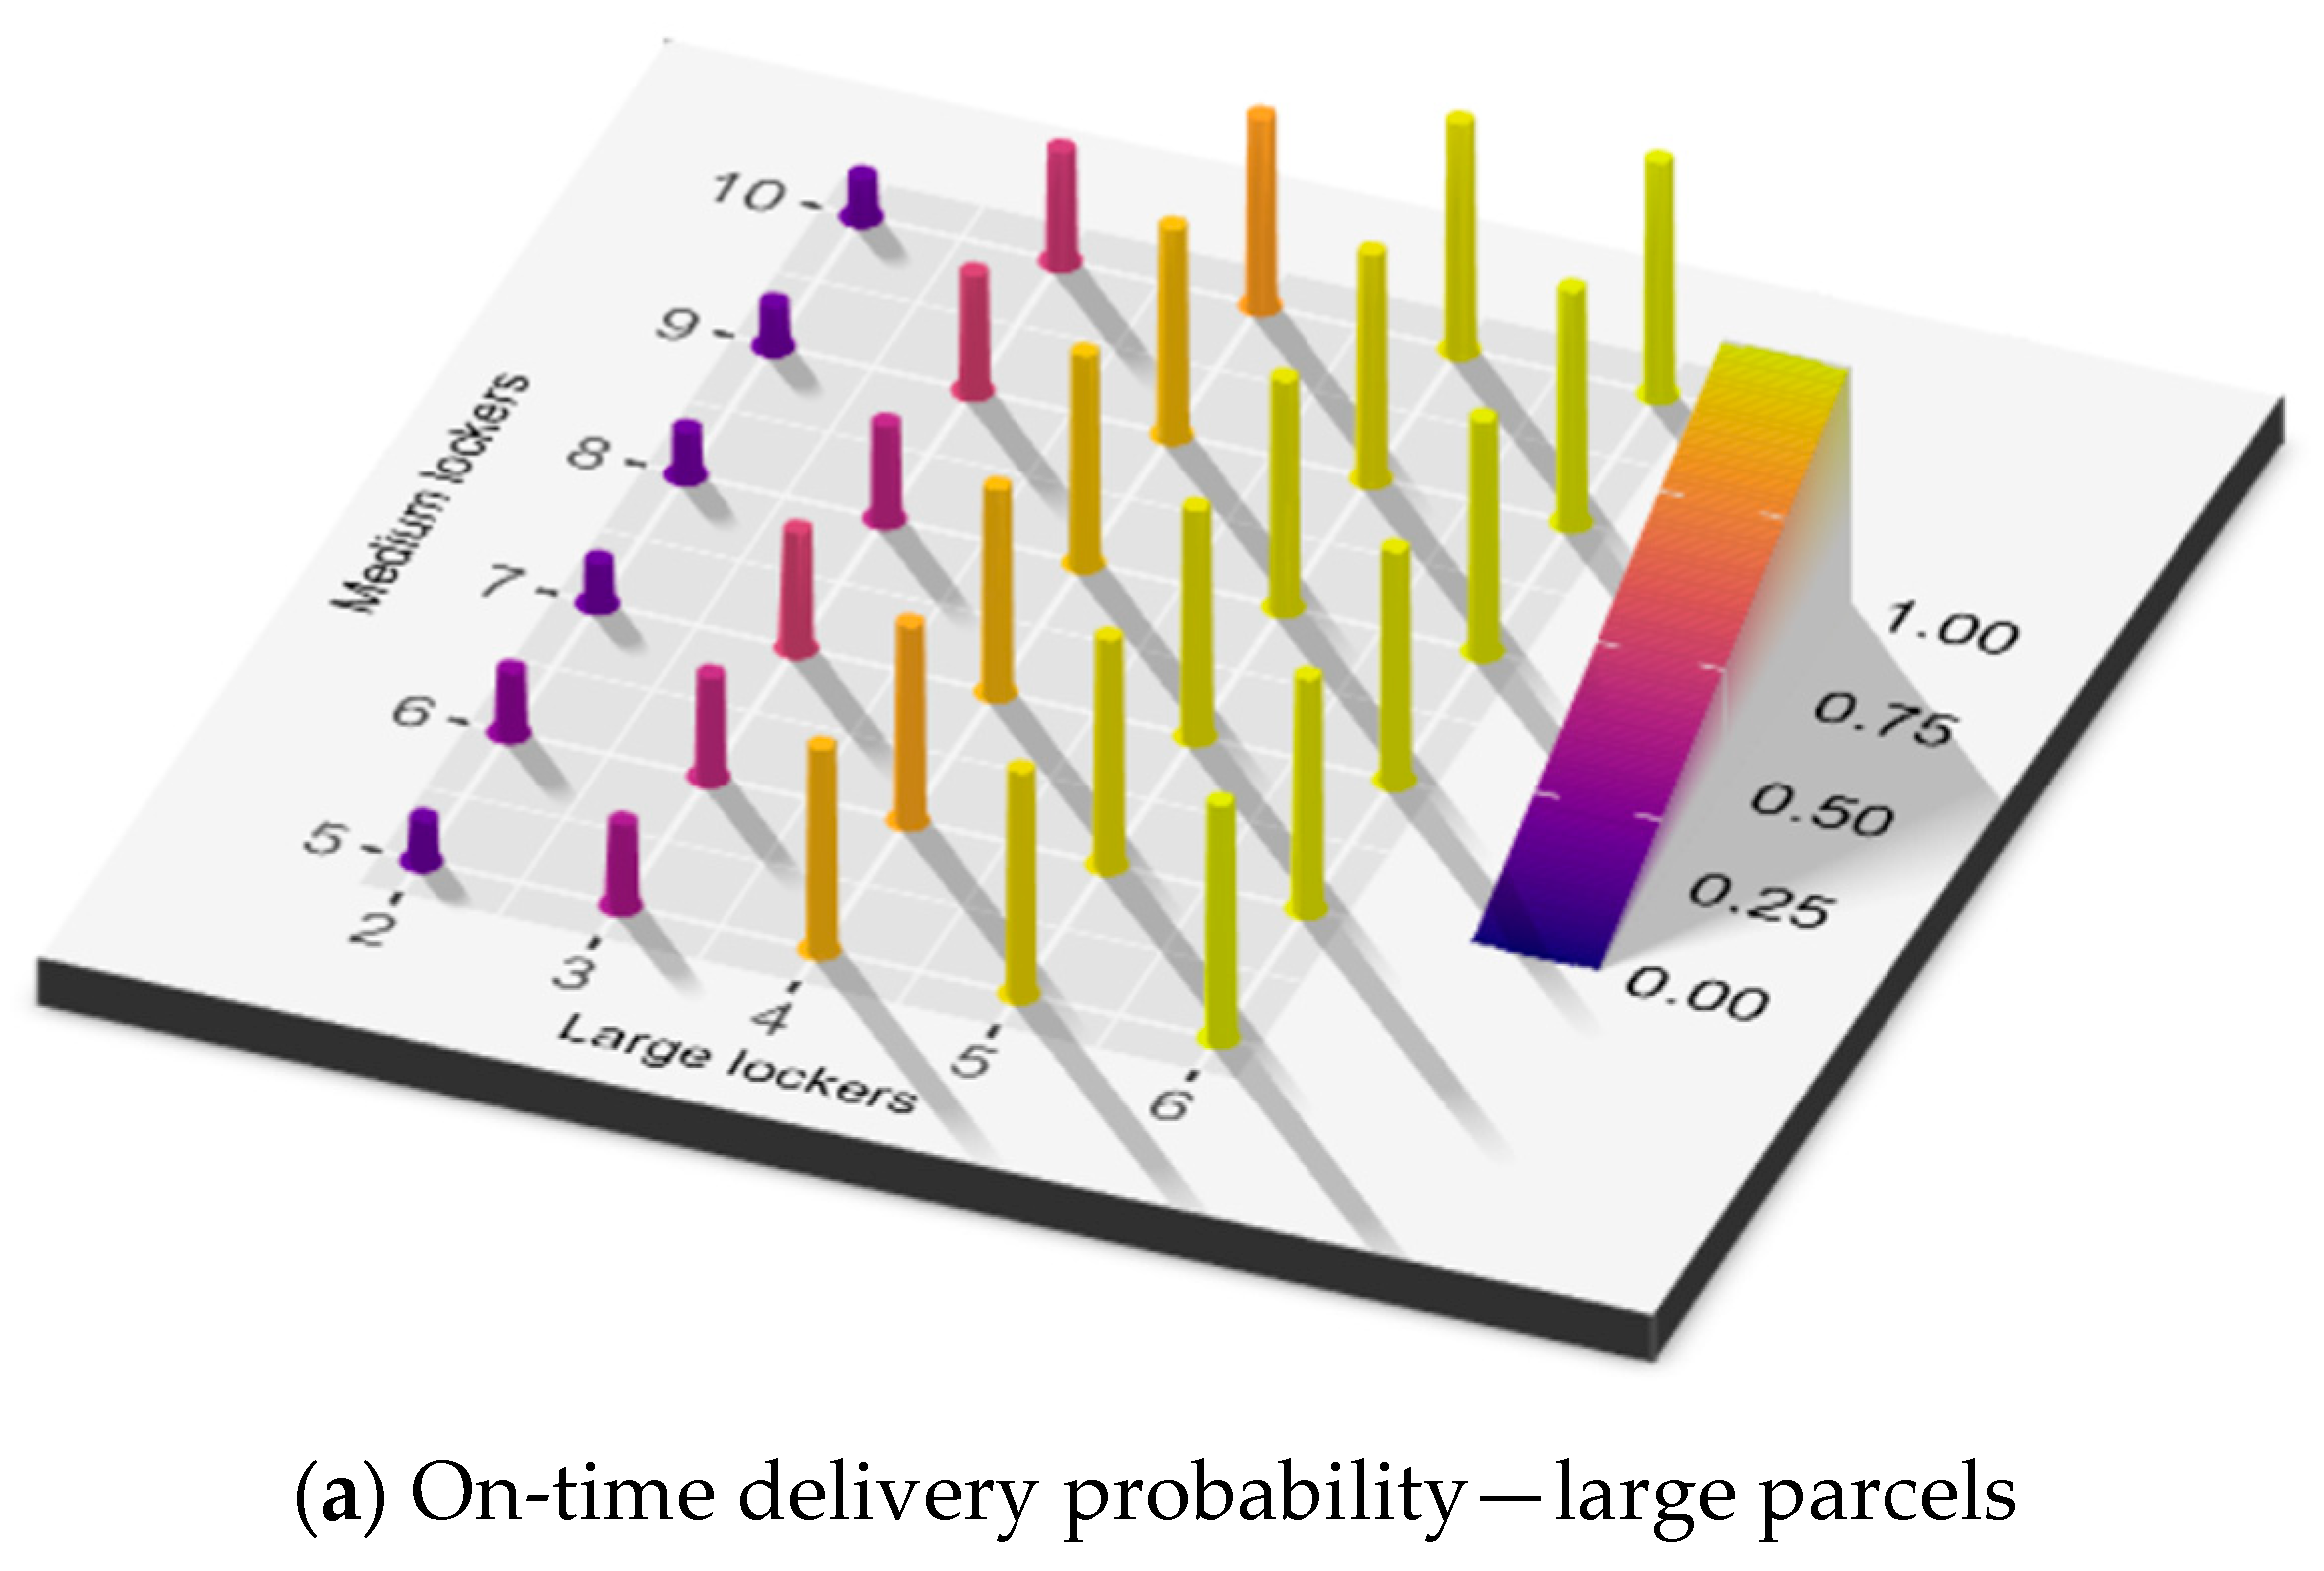
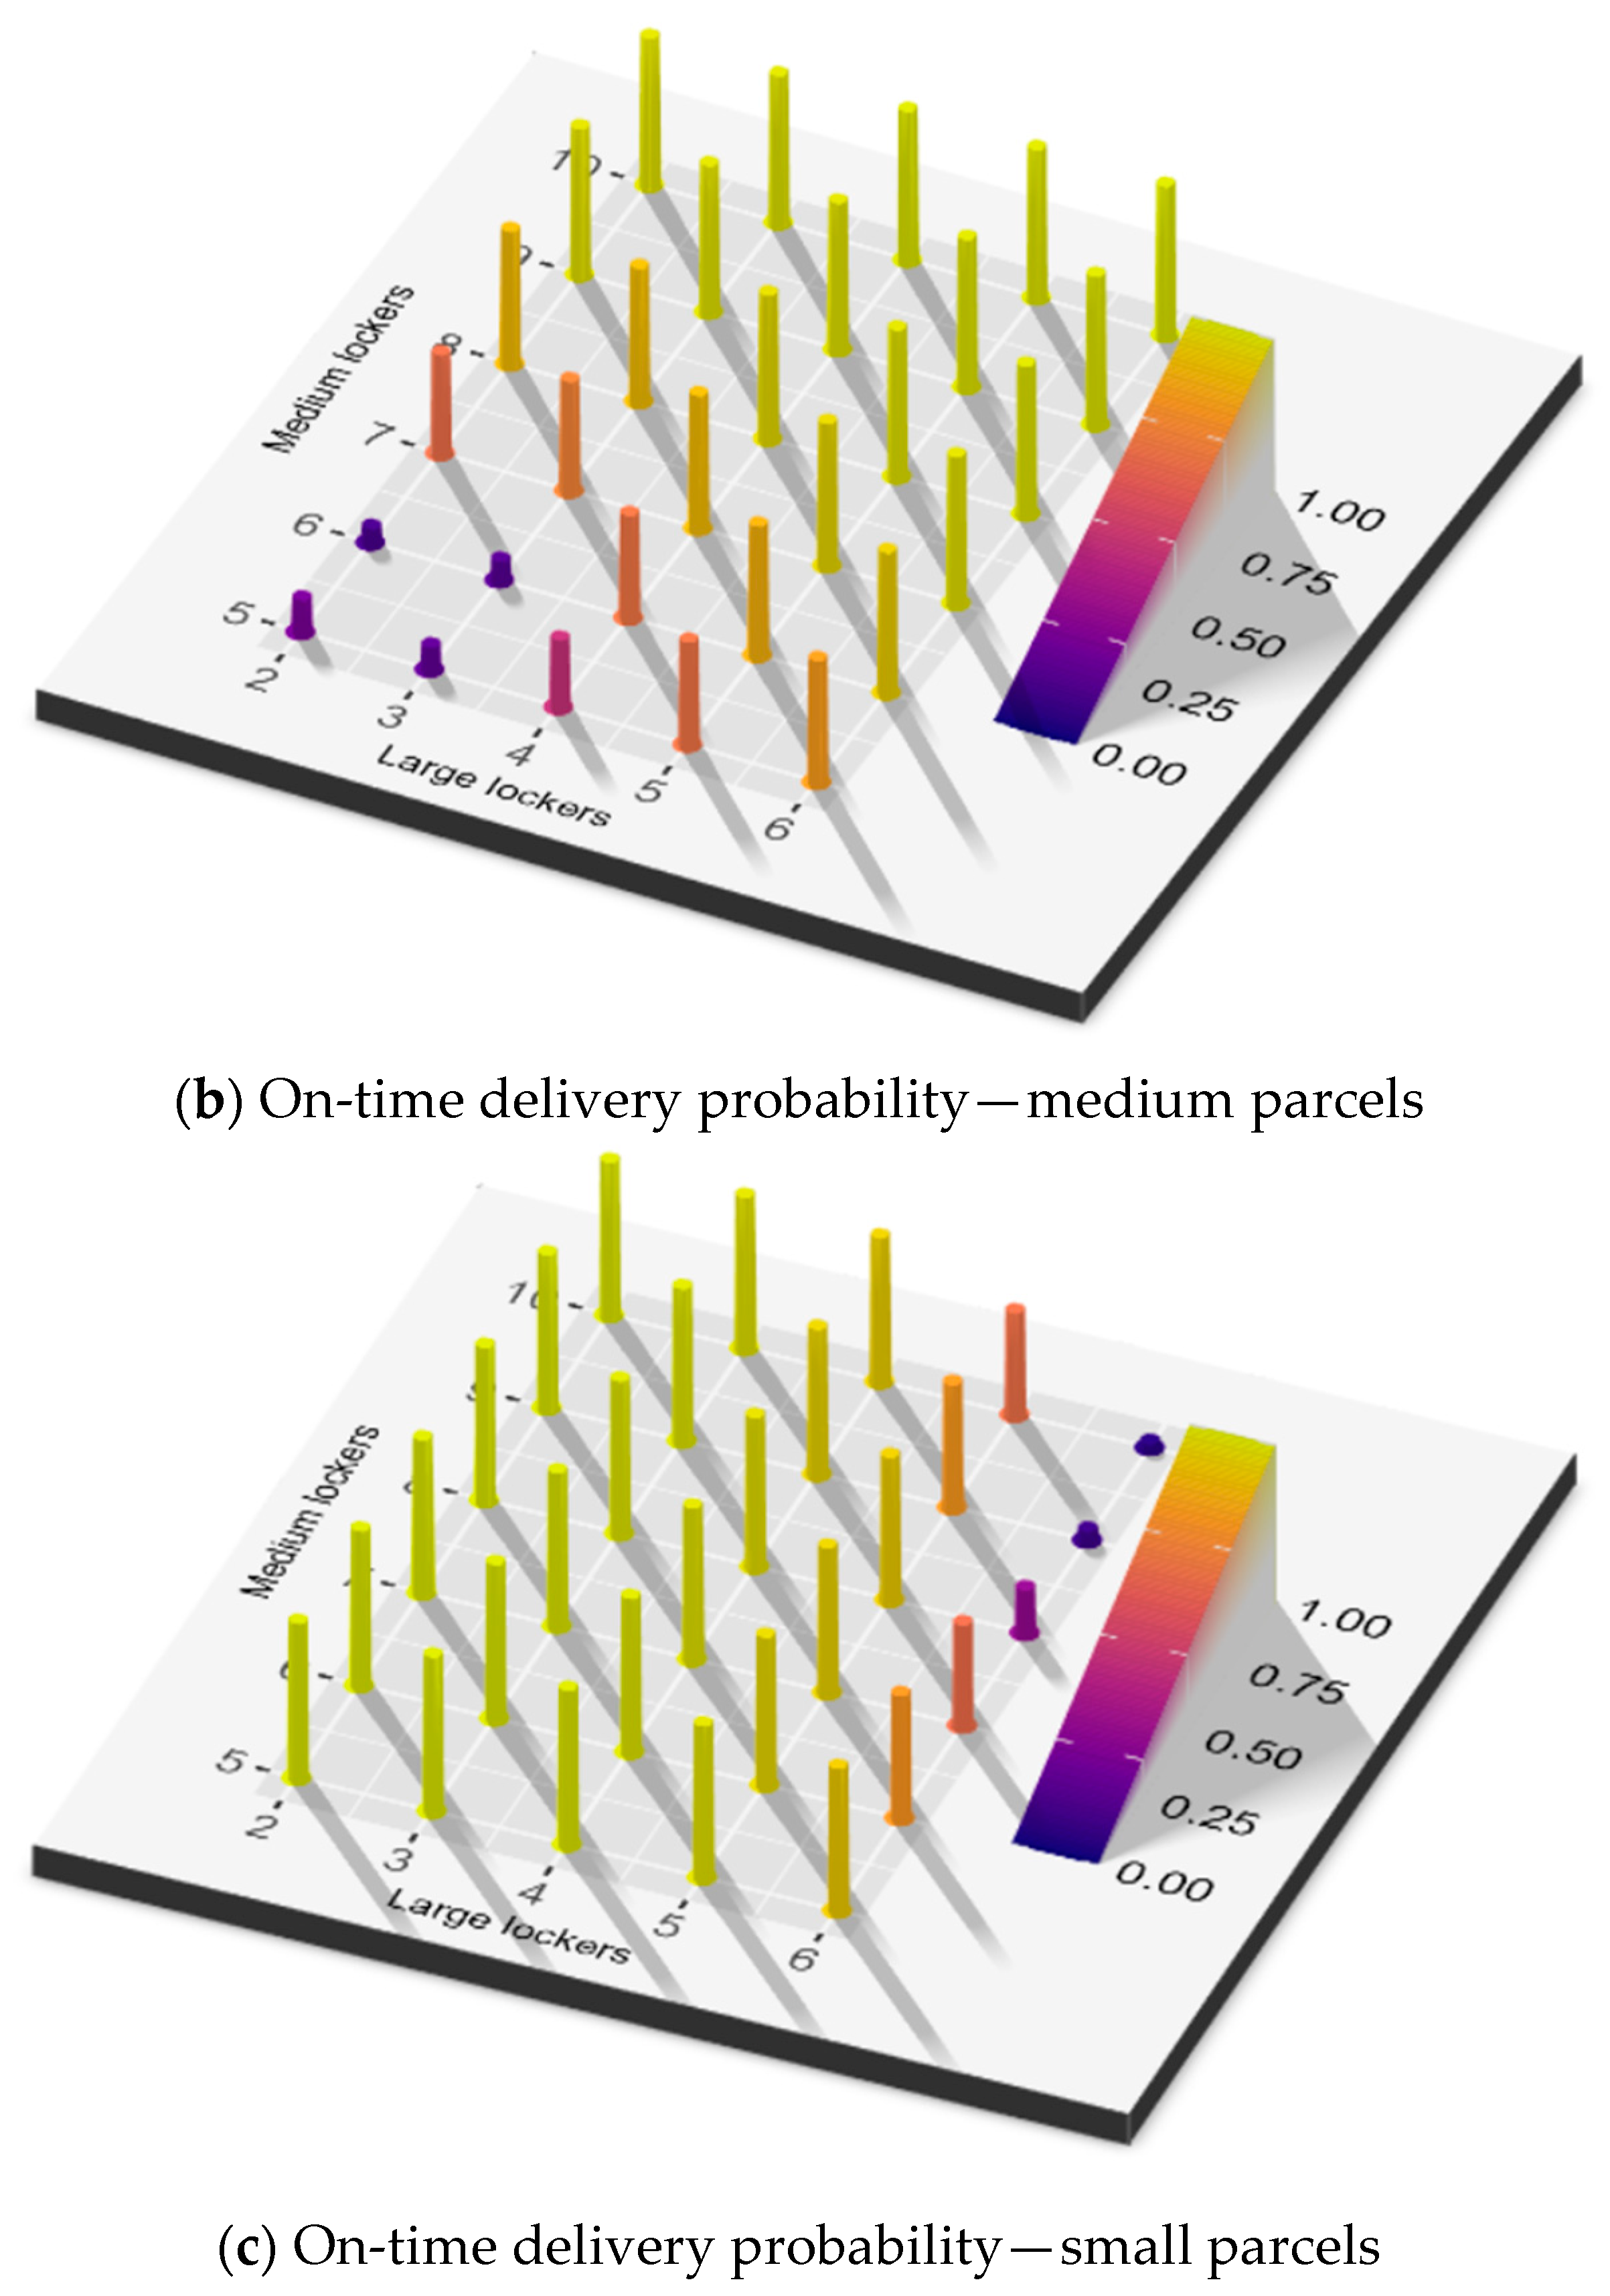
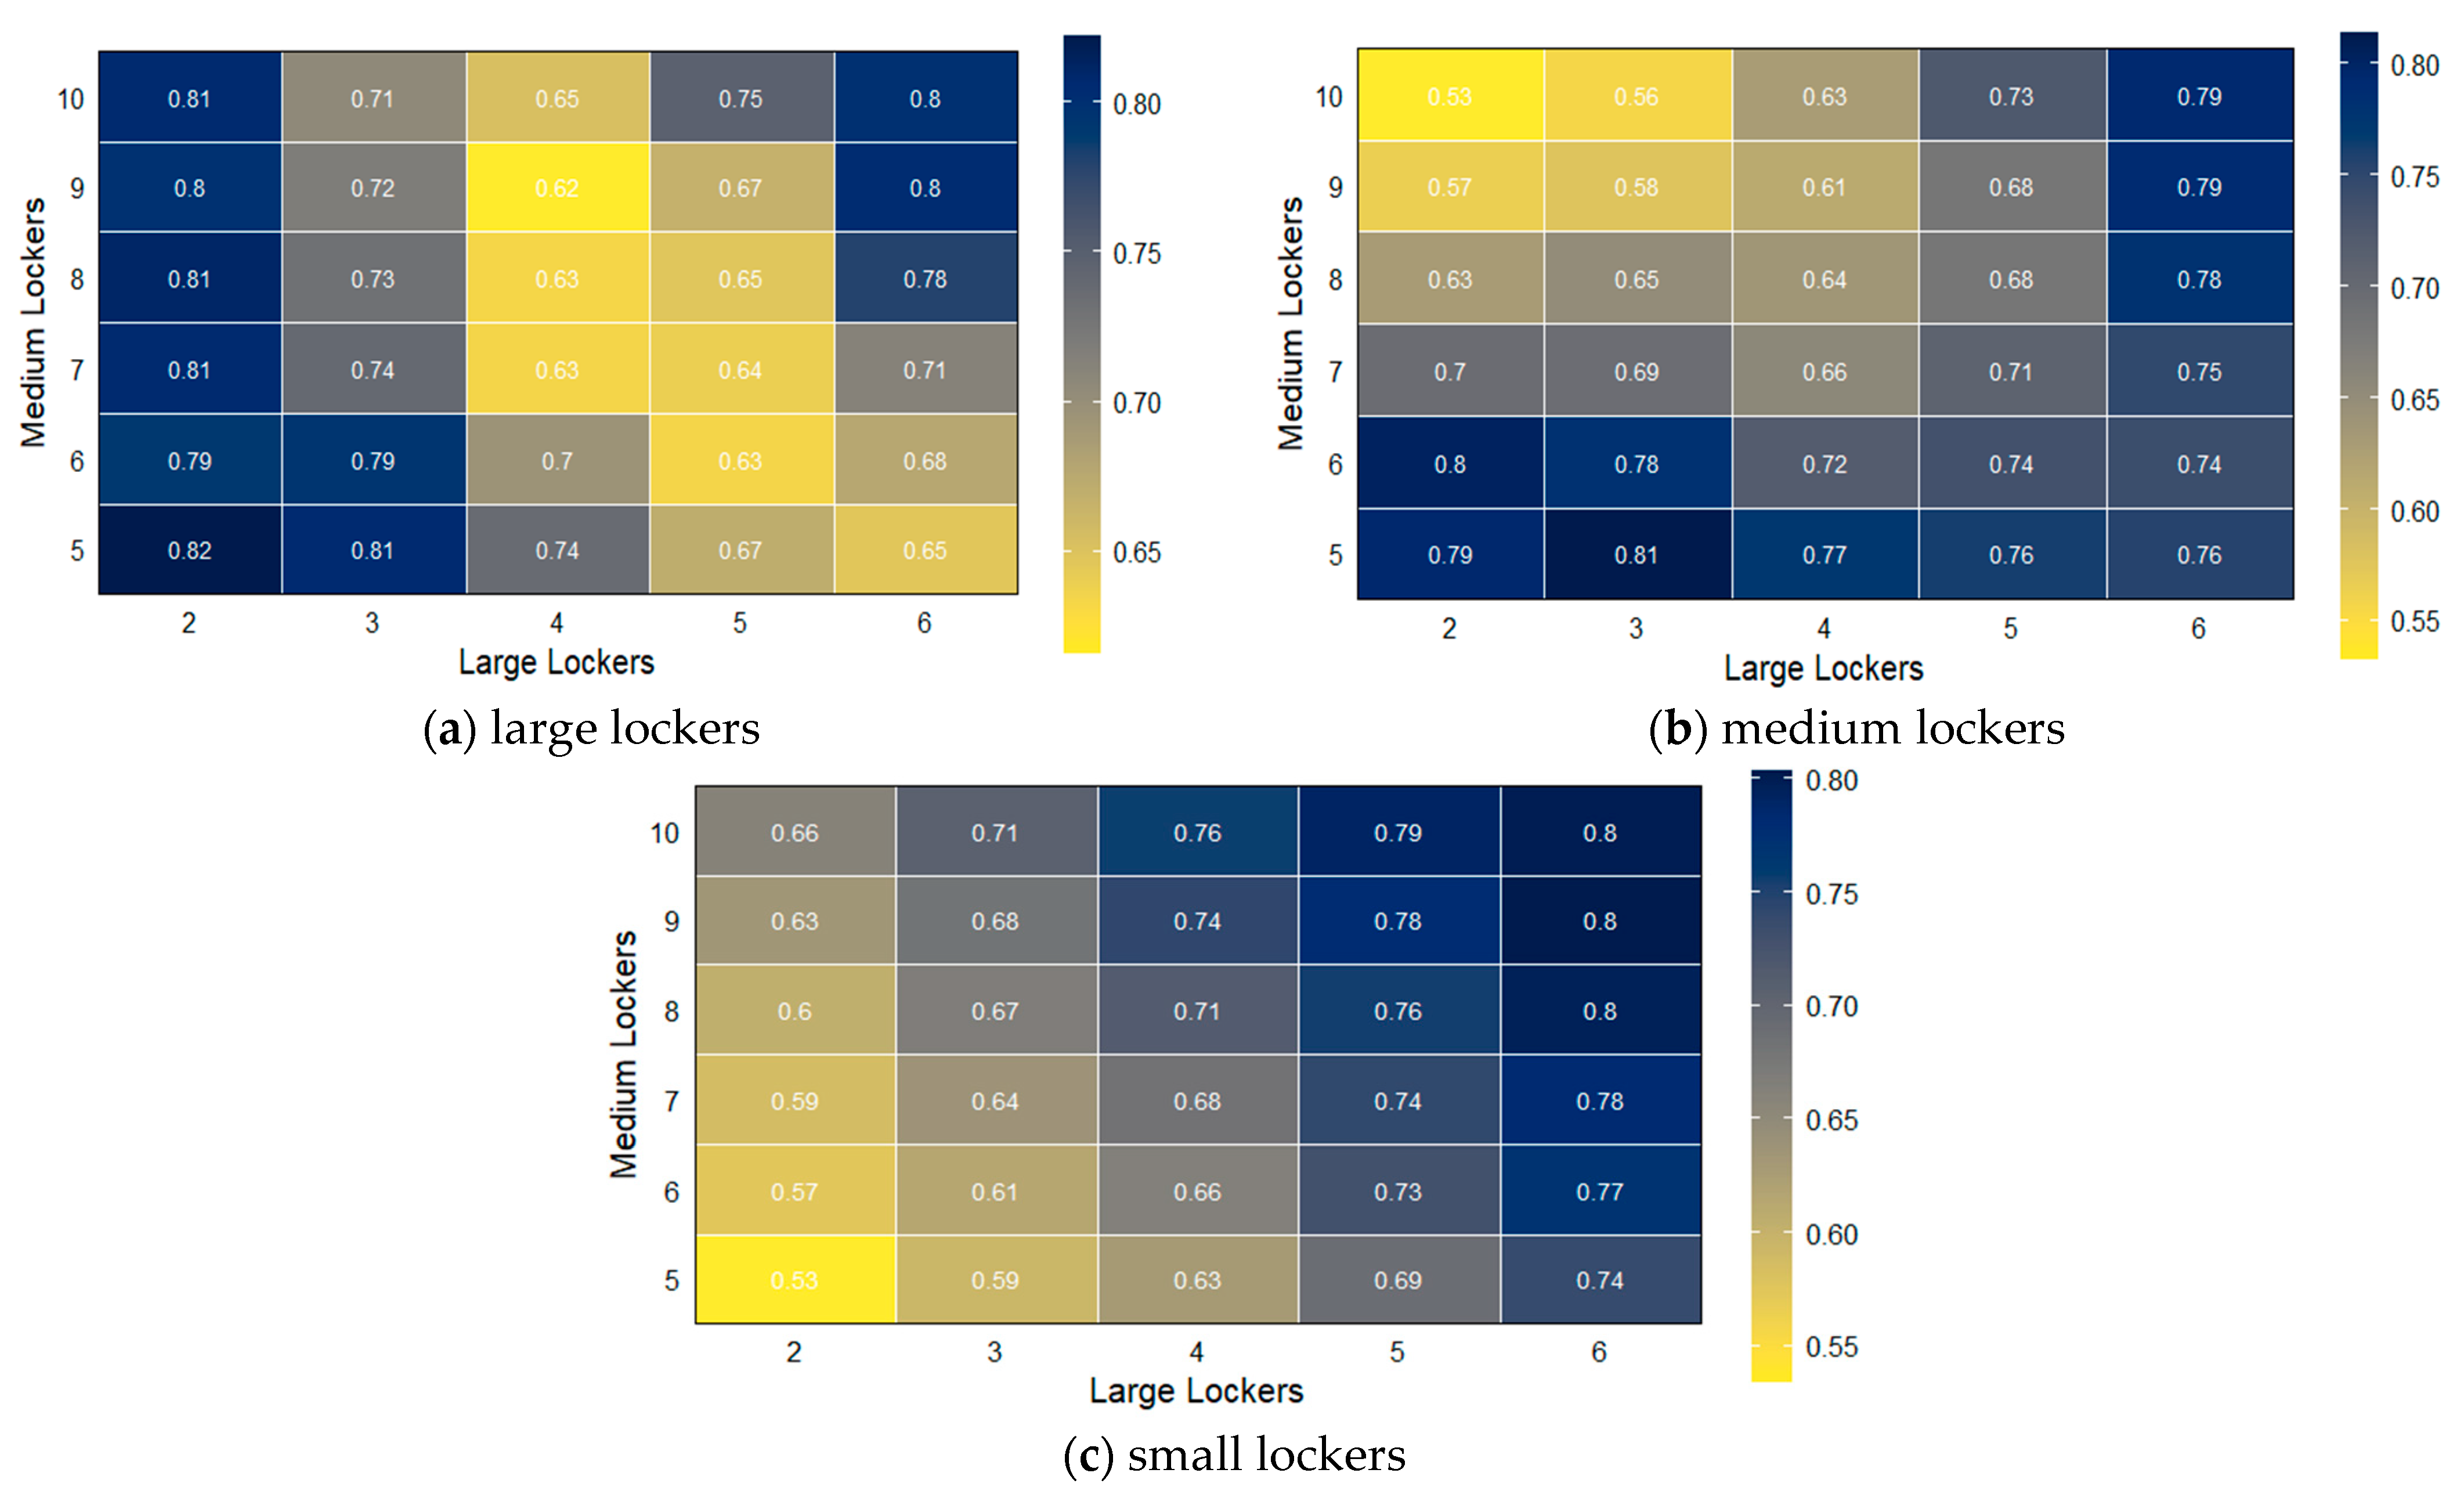
- Optimal locker configuration for service efficiency: Configuration of locker types significantly influences the system’s ability to maintain high customers service levels, as measured by on-time parcel delivery probabilities. The higher the customers’ satisfaction target, the smaller the number of feasible configurations. A small number of large lockers (typically ≥ 4 units for testing dataset) is essential to accommodate large parcels and prevent service degradation. While additional large lockers enable flexible storage of smaller parcels, they simultaneously reduce available capacity for medium and small lockers, creating a critical system design compromise.
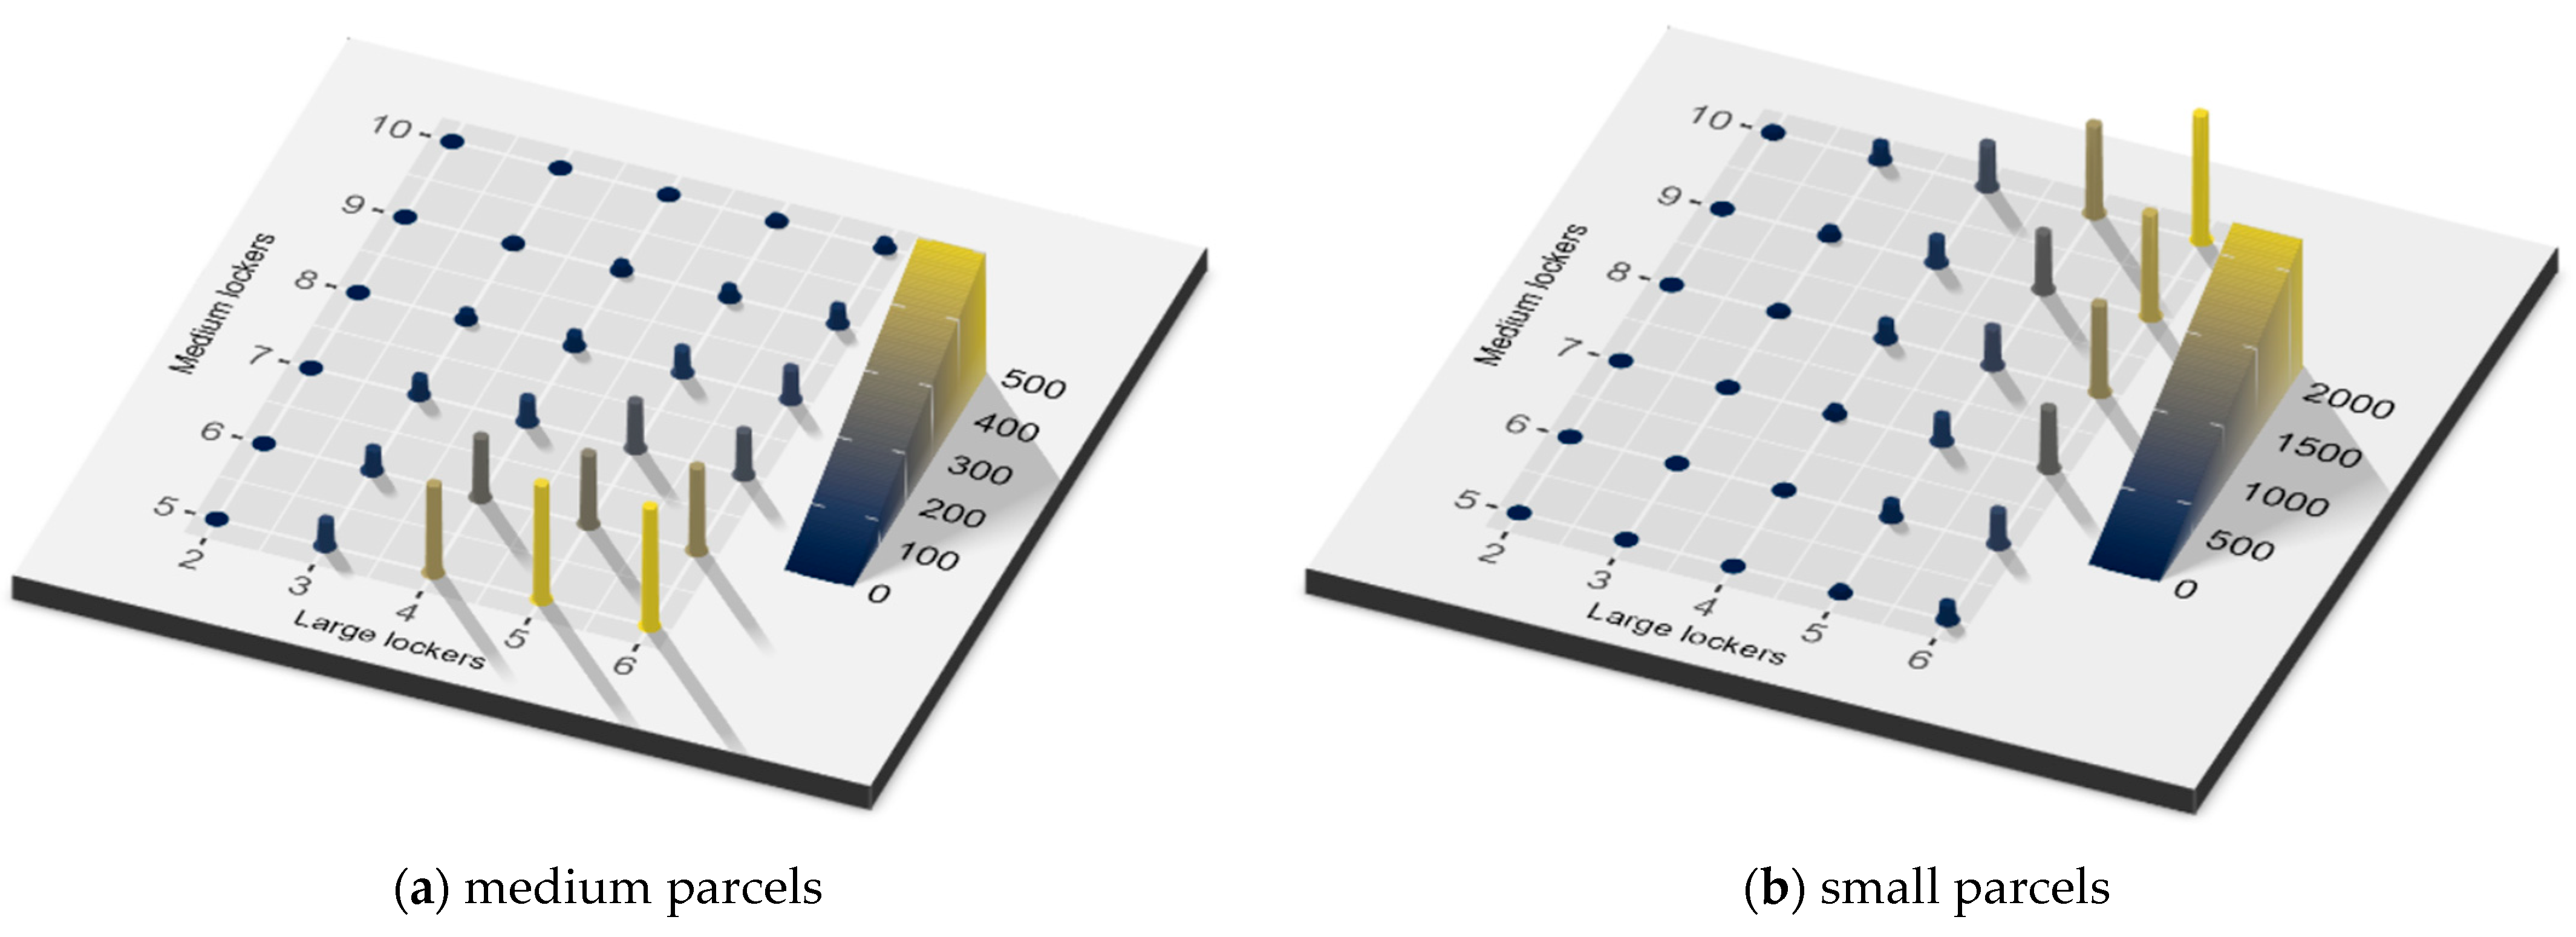
- Utilization patterns and spatial efficiency: While flexibility in locker allocation helps manage excess demand in some configurations, it may also create resource competition among parcel types. Large lockers show a central-to-peripheral utilization gradient, while medium and small lockers display bidirectional utilization gradients but in opposite trends. This nonlinear relationship underscores that optimal APLs configurations must balance absolute locker counts with their size-dependent functional interdependencies.
- System resilience and delayed parcels inventory stationarity: Dickey–Fuller GLS tests confirm stationarity in undelivered inventories, indicating inherent system stability despite daily fluctuations, a critical feature for long-term logistics planning.
Author Contributions
Funding
Data Availability Statement
Conflicts of Interest
References
- World Economic Forum. The Future of the Last-Mile Ecosystem; World Economic Forum: Geneva, Switzerland, 2021.
- Van Eck, N.J.; Waltman, L. Visualizing Bibliometric Networks. In Measuring Scholarly Impact: Methods and Practice; Ding, Y., Rousseau, R., Wolfram, D., Eds.; Springer: Berlin/Heidelberg, Germany, 2014; pp. 285–320. [Google Scholar]
- Freitas, H.; Andrade, C.; Campos, C. Collection and delivery points in the last mile of cargo transportation: Sustainability benefits and challenges. Ann. Environ. Sci. Toxicol. 2023, 7, 061–065. [Google Scholar] [CrossRef]
- Pan, S.; Zhang, L.; Thompson, R.G.; Ghaderi, H. A parcel network flow approach for joint delivery networks using parcel lockers. Int. J. Prod. Res. 2020, 59, 2090–2115. [Google Scholar] [CrossRef]
- Orenstein, I.; Raviv, T.; Sadan, E. Flexible parcel delivery to automated parcel lockers: Models, solution methods and analysis. EURO J. Transp. Logist. 2019, 8, 683–711. [Google Scholar] [CrossRef]
- Iwan, S.; Kijewska, K.; Lemke, J. Analysis of Parcel Lockers’ Efficiency as the Last Mile Delivery Solution—The Results of the Research in Poland. Transp. Res. Procedia 2016, 12, 644–655. [Google Scholar] [CrossRef]
- Savelsbergh, M.; Van Woensel, T. 50th Anniversary Invited Article—City Logistics: Challenges and Opportunities. Transp. Sci. 2016, 50, 579–590. [Google Scholar] [CrossRef]
- Lachapelle, U.; Burke, M.; Brotherton, A.; Leung, A. Parcel locker systems in a car dominant city: Location, characterisation and potential impacts on city planning and consumer travel access. J. Transp. Geogr. 2018, 71, 1–14. [Google Scholar] [CrossRef]
- Yang, X.; Wang, C.; He, X.; Zhang, H.; Xu, G. Location Optimization for Community Smart Parcel Lockers Based on Bilevel Programming. J. Adv. Transp. 2023, 2023, 1998188. [Google Scholar] [CrossRef]
- Kurowski, M.; Sobolewski, M.; Koszorek, M. Geometrical Parcel Locker Network Design with Consideration of Users’ Preferences as a Solution for Sustainable Last Mile Delivery. Sustainability 2023, 15, 15114. [Google Scholar] [CrossRef]
- Grabenschweiger, J.; Doerner, K.F.; Hartl, R.F.; Savelsbergh, M. The vehicle routing problem with heterogeneous locker boxes. Cent. Eur. J. Oper. Res. 2021, 29, 113–142. [Google Scholar] [CrossRef]
- Edwards, J.B.; McKinnon, A.C.; Cullinane, S.L. Comparative Analysis of the Carbon Footprints of Conventional and Online Retailing: A “Last Mile” Perspective. Int. J. Phys. Distrib. Logist. Manag. 2010, 40, 103–123. [Google Scholar] [CrossRef]
- Deutsch, Y.; Golany, B. A Parcel Locker Network as a Solution to the Logistics Last Mile Problem. Int. J. Prod. Res. 2018, 56, 251–261. [Google Scholar] [CrossRef]
- De Oliveira, L.K.; De Oliveira, R.L.M.; De Sousa, L.T.M.; Caliari, I.D.P.; Nascimento, C.D.O.L. Analysis of Accessibility from Collection and Delivery Points: Towards the Sustainability of the E-Commerce Delivery. Rev. Bras. Gest. 2019, 11, e20190048. [Google Scholar] [CrossRef]
- Reiffer, A.S.; Kübler, J.; Kagerbauer, M.; Vortisch, P. Agent-based model of last-mile parcel deliveries and travel demand incorporating online shopping behavior. Res. Transp. Econ. 2023, 102, 101368. [Google Scholar] [CrossRef]
- Wang, X.; Yuen, K.F.; Wong, Y.D.; Teo, C.C. E-Consumer Adoption of Innovative Last-Mile Logistics Services: A Comparison of Behavioural Models. Total Qual. Manag. Bus. Excell. 2018, 31, 1381–1407. [Google Scholar] [CrossRef]
- International Transport Forum. ITF Transport Outlook 2021; OECD Publishing: Paris, France, 2021. [Google Scholar] [CrossRef]
- Lagorio, A.; Pinto, R.; Golini, R. Research in Urban Logistics: A Systematic Literature Review. Int. J. Phys. Distrib. Logist. Manag. 2016, 46, 908–931. [Google Scholar] [CrossRef]
- Figliozzi, M.A. Carbon Emissions Reductions in Last Mile and Grocery Deliveries Utilizing Air and Ground Autonomous Vehicles. Transp. Res. Part D Transp. Environ. 2020, 85, 102443. [Google Scholar] [CrossRef]
- McKinnon, A.C.; Ge, Y. Use of a Synchronised Vehicle Audit to Determine Opportunities for Improving Transport Efficiency in a Supply Chain. Int. J. Logist. Res. Appl. 2004, 7, 219–238. [Google Scholar] [CrossRef]
- European Environment Agency. Electric Vehicles in Logistics: Lifecycle Assessment; EEA Report No 15/2022; Publications Office of the European Union: Luxembourg, 2022. [Google Scholar]
- Silva, V.; Amaral, A.; Fontes, T. Sustainable Urban Last-Mile Logistics: A Systematic Literature Review. Sustainability 2023, 15, 2285. [Google Scholar] [CrossRef]
- Melkonyan, A.; Gruchmann, T.; Lohmar, F.; Kamath, V.; Spinler, S. Sustainability assessment of last-mile logistics and distribution strategies: The case of local food networks. Int. J. Prod. Econ. 2020, 228, 107746. [Google Scholar] [CrossRef]
- Che, Z.-H.; Chiang, T.-A.; Luo, Y.-J. Multiobjective Optimization for Planning the Service Areas of Smart Parcel Locker Facilities in Logistics Last Mile Delivery. Mathematics 2022, 10, 422. [Google Scholar] [CrossRef]
- Serrano-Hernandez, A.; Martinez-Abad, S.; Ballano, A.; Faulin, J.; Rabe, M.; Chicaiza-Vaca, J. A Hybrid Modeling Approach for Automated Parcel Lockers as a Last-Mile Delivery Scheme: A Case Study in Pamplona (Spain). In Proceedings of the 2021 Winter Simulation Conference (WSC), Phoenix, AZ, USA, 12–15 December 2021. [Google Scholar] [CrossRef]
- Sawik, B.; Serrano-Hernandez, A.; Muro, A.; Faulin, J. Multi-Criteria Simulation-Optimization Analysis of Usage of Automated Parcel Lockers: A Practical Approach. Mathematics 2022, 10, 4423. [Google Scholar] [CrossRef]
- Rabe, M.; Chicaiza-Vaca, J.; Tordecilla, R.D.; Juan, A.A. A simulation-optimization approach for locating automated parcel lockers in urban logistics operations. In Proceedings of the 2020 Winter Simulation Conference (WSC), Orlando, FL, USA, 14–18 December 2020. [Google Scholar]
- Izco Berastegui, I.; Serrano, A.; Faulin, J.; Sawik, B. A Dynamic Forecast Demand Scenario Analysis to Design an Automated Parcel Lockers Network in Pamplona (Spain) Using a Simulation-Optimization Model. In Proceedings of the 2020 Winter Simulation Conference (WSC), San Antonio, TX, USA, 10–13 December 2023. [Google Scholar] [CrossRef]
- Iannaccone, G.; Marcucci, E.; Gatta, V. What Young E-Consumers Want? Forecasting Parcel Lockers Choice in Rome. Logistics 2021, 5, 57. [Google Scholar] [CrossRef]
- Sawik, B. Optimizing Last-Mile Delivery: A Multi-Criteria Approach with Automated Smart Lockers, Capillary Distribution and Crowdshipping. Logistics 2024, 8, 52. [Google Scholar] [CrossRef]
- Lee, H.J.; Lyu, J. Personal values as determinants of intentions to use self-service technology in retailing. Comput. Hum. Behav. 2016, 60, 322–332. [Google Scholar] [CrossRef]
- de Oliveira, L.K.; Morganti, E.; Dablanc, L.; de Oliveira, R.L.M. Analysis of the potential demand of automated delivery stations for e-commerce deliveries in Belo Horizonte, Brazil. Res. Transp. Econ. 2017, 65, 34–43. [Google Scholar] [CrossRef]
- Cieśla, M. Perceived Importance and Quality Attributes of Automated Parcel Locker Services in Urban Areas. Smart Cities 2023, 6, 2661–2679. [Google Scholar] [CrossRef]
- Lai, P.L.; Jang, H.; Fang, M.; Peng, K. Determinants of customer satisfaction with parcel locker services in last-mile logistics. Asian J. Shipp. Logist. 2022, 38, 25–30. [Google Scholar] [CrossRef]
- Adnan, M.; Pereira, F.; Azevedo, C.L.; Basak, K.; Lovric, M.; Raveau, S.; Zhu, Y.; Ferreira, J.; Zegras, C.; Ben-Akiva, M. SimMobility: A Multi-Scale Integrated Agent-Based Simulation Platform. In Transportation Research Record, Proceedings of the 95th Annual Meeting of the Transportation Research Board, Washington, DC, USA, 10–14 January 2016; The National Academies of Sciences, Engineering, and Medicine: Washington, DC, USA, 2016; Volume 2. [Google Scholar]
- Nikghadam, S.; Vanga, R.; Rezaei, J.; Tavasszy, L. Cooperation between Vessel Service Providers in Ports: An Impact Analysis Using Simulation for the Port of Rotterdam. Marit. Transp. Res. 2023, 4, 100083. [Google Scholar] [CrossRef]
- Liang, K.; Zhou, L.; Yang, J.; Liu, H.; Li, Y.; Jing, F.; Shan, M.; Yang, J. Research on a Dynamic Task Update Assignment Strategy Based on a “Parts to Picker” Picking System. Mathematics 2023, 11, 1684. [Google Scholar] [CrossRef]
- Simchi-Levi, D.; Kaminsky, P.; Simchi-Levi, E. Designing and Managing the Supply Chain, 4th ed.; McGraw-Hill: New York, NY, USA, 2021. [Google Scholar]
- Vargas-Muñoz, J.C.; Sanchez-Nitola, F.A.; Adarme Jaimes, W.; Rios, R. Enhancing Logistical Performance in a Colombian Citrus Supply Chain Through Joint Decision Making: A Simulation Study. Logistics 2025, 9, 30. [Google Scholar] [CrossRef]
- Rosca, E.; Rusca, F.; Rosca, M.A.; Rusca, A. Performance Analysis of Automated Parcel Lockers in Urban Delivery: Combined Agent-Based–Monte Carlo Simulation Approach. Logistics 2024, 8, 61. [Google Scholar] [CrossRef]
- Wan, J.; Wang, Y. Research on Optimization of E-Commerce Automated Storage Layout Simulation Based on Flexsim. In Proceedings of the 12th International Conference on Transportation and Traffic Engineering (ICTTE 2023), Wuhan, China, 12 February 2024. [Google Scholar] [CrossRef]
- Dickey, D.A.; Fuller, W.A. Distribution of the Estimators for Autoregressive Time Series with a Unit Root. J. Am. Stat. Assoc. 1979, 74, 427–431. [Google Scholar] [CrossRef] [PubMed]
- Elliott, G.; Rothenberg, T.J.; Stock, J.H. Efficient Tests for an Autoregressive Unit Root. Econometrica 1996, 64, 813–836. [Google Scholar] [CrossRef]
- Lütkepohl, H. New Introduction to Multiple Time Series Analysis; Springer: Berlin/Heidelberg, Germany, 2005. [Google Scholar]


| Item | Attribute | Type | Description | |
|---|---|---|---|---|
| Entities | Parcel | Serial number | Number | Entity ID. |
| Size | Text | The size of the parcel to match the right locker. There are three types of parcels: large, medium, small. | ||
| Creation time | Time stamp | The generation time. | ||
| Dwell time | Number | The time interval a parcel is stored into a locker. | ||
| Delivery person | Delivery moment | Time stamp | The moment the delivery process starts. | |
| Resources | Locker | Size | Text | There are three types of lockers: large, medium, small. The conventional unit locker has the dimensions of a small locker. The medium locker is equivalent to two conventional lockers, and the large locker with four conventional units. |
| State | Logical (Empty/Occupied) | Empty lockers are available for parcel storage, and a locker remains occupied for the duration of the parcel’s dwell time. |
| Module | Type | Role and Parameters | |
|---|---|---|---|
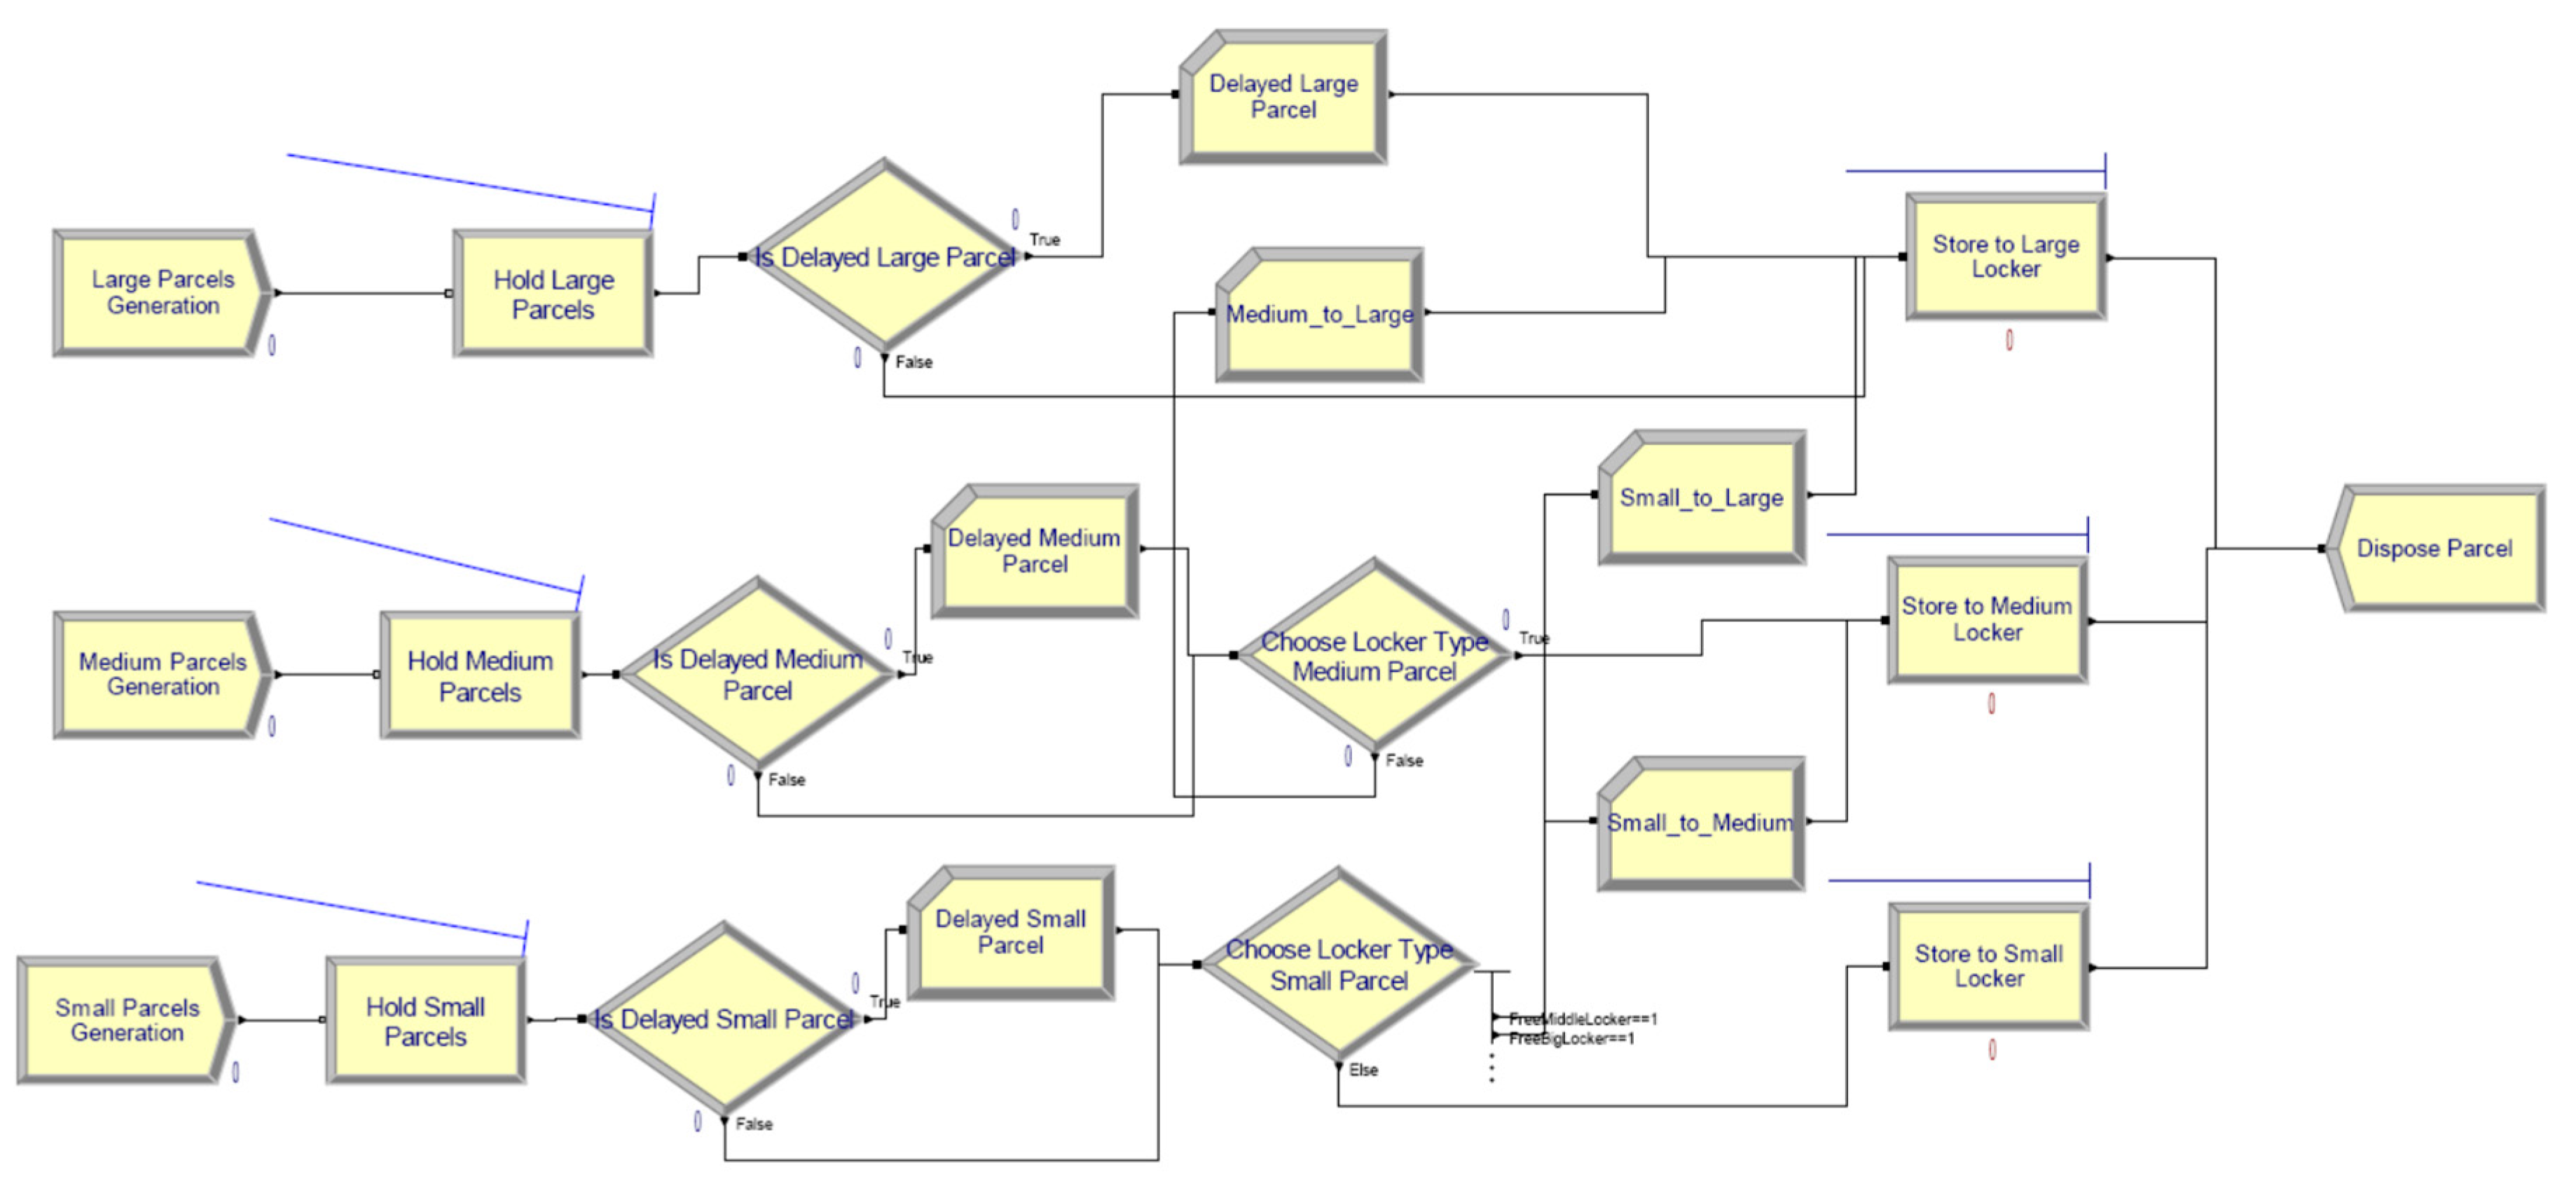
| Parcels | Large Parcels Generation | Create | Every day a random number of large parcels () are generated. |
| Medium Parcels Generation | Create | Every day a random number of medium parcels () are generated. | |
| Small Parcels Generation | Create | Every day a random number of small parcels () are generated. | |
| Hold Large Parcels | Hold | The large parcels are stored at the central warehouse () until empty lockers are available. The delivery person controls the parcel releasing process () by calculating the number of empty large lockers (). | |
| Hold Medium Parcels | Hold | The medium parcels are stored at the central warehouse () until empty lockers are available. The delivery person controls the parcel releasing process () by calculating the number of empty medium lockers () or remaining empty large lockers () after the accommodation of large parcels. | |
| Hold Small Parcels | Hold | The small parcels are stored at the central warehouse () until empty lockers are available. The delivery person controls the parcel releasing process () by calculating the number of empty small lockers () or remaining empty medium () and large lockers () after the accommodation of large and medium parcels. | |
| Is Delayed Large Parcel | Decide | It examines whether large parcels are delivered on the day they are generated or if delivery is postponed due to the unavailability of free lockers. It analyzes the time interval between the generation of the parcel and its actual delivery (TNOW–Entity.CreateTime). | |
| Is Delayed Medium Parcel | Decide | It examines whether medium parcels are delivered on the day they are generated or if delivery is postponed due to the unavailability of free lockers. It analyzes the time interval between the generation of the parcel and its actual delivery (TNOW–Entity.CreateTime). | |
| Is Delayed Small Parcel | Decide | It examines whether small parcels are delivered on the day they are generated or if delivery is postponed due to the unavailability of free lockers. It analyzes the time interval between the generation of the parcel and its actual delivery (TNOW–Entity.CreateTime). | |
| Delayed Large Parcel | Record | It records the delayed large parcels by incrementing the counter Delayed_Large_Parcel. | |
| Delayed Medium Parcel | Record | It records the delayed large parcels by incrementing the counter Delayed_Medium_Parcel. | |
| Delayed Small Parcel | Record | It records the delayed large parcels by incrementing the counter Delayed_Small_Parcel. | |
| Choose Locker Type Medium Parcel | Decide | An appropriate locker for the medium parcel is selected based on availability. If an empty medium locker is available, the parcel is stored there (higher priority). Otherwise, the parcel is placed in a free large locker (lower priority competing to large parcels). | |
| Choose Locker Type Small Parcel | Decide | An appropriate locker for the small parcel is selected based on availability. If an empty small locker is available, the parcel is stored there (higher priority). Otherwise, the parcel is placed in a free medium or a free large locker (lower priority competing to medium or large parcels). | |
| Medium to Large | Record | It records the number of medium parcels accommodated in large lockers by incrementing the counter . | |
| Small to Medium | Record | It records the number of small parcels accommodated in medium lockers by incrementing the counter . | |
| Small to Large | Record | It records the number of small parcels accommodated in large lockers by incrementing the counter . | |
| Store to Large Locker | Process | The large locker is seized, and its state becomes occupied until the parcel‘s dwell time elapses. Following this time, the parcel is picked up by customer and the locker is released. | |
| Store to Medium Locker | Process | The medium locker is seized, and its state becomes occupied until the parcel‘s dwell time elapses. Following this time, the parcel is picked up by customer and the locker is released. | |
| Store to Small Locker | Process | The small locker is seized, and its state becomes occupied until the parcel‘s dwell time elapses. Following this time, the parcel is picked up by customer and the locker is released. | |
| Dispose Parcel | Dispose | The parcels are disposed once they are picked up. | |
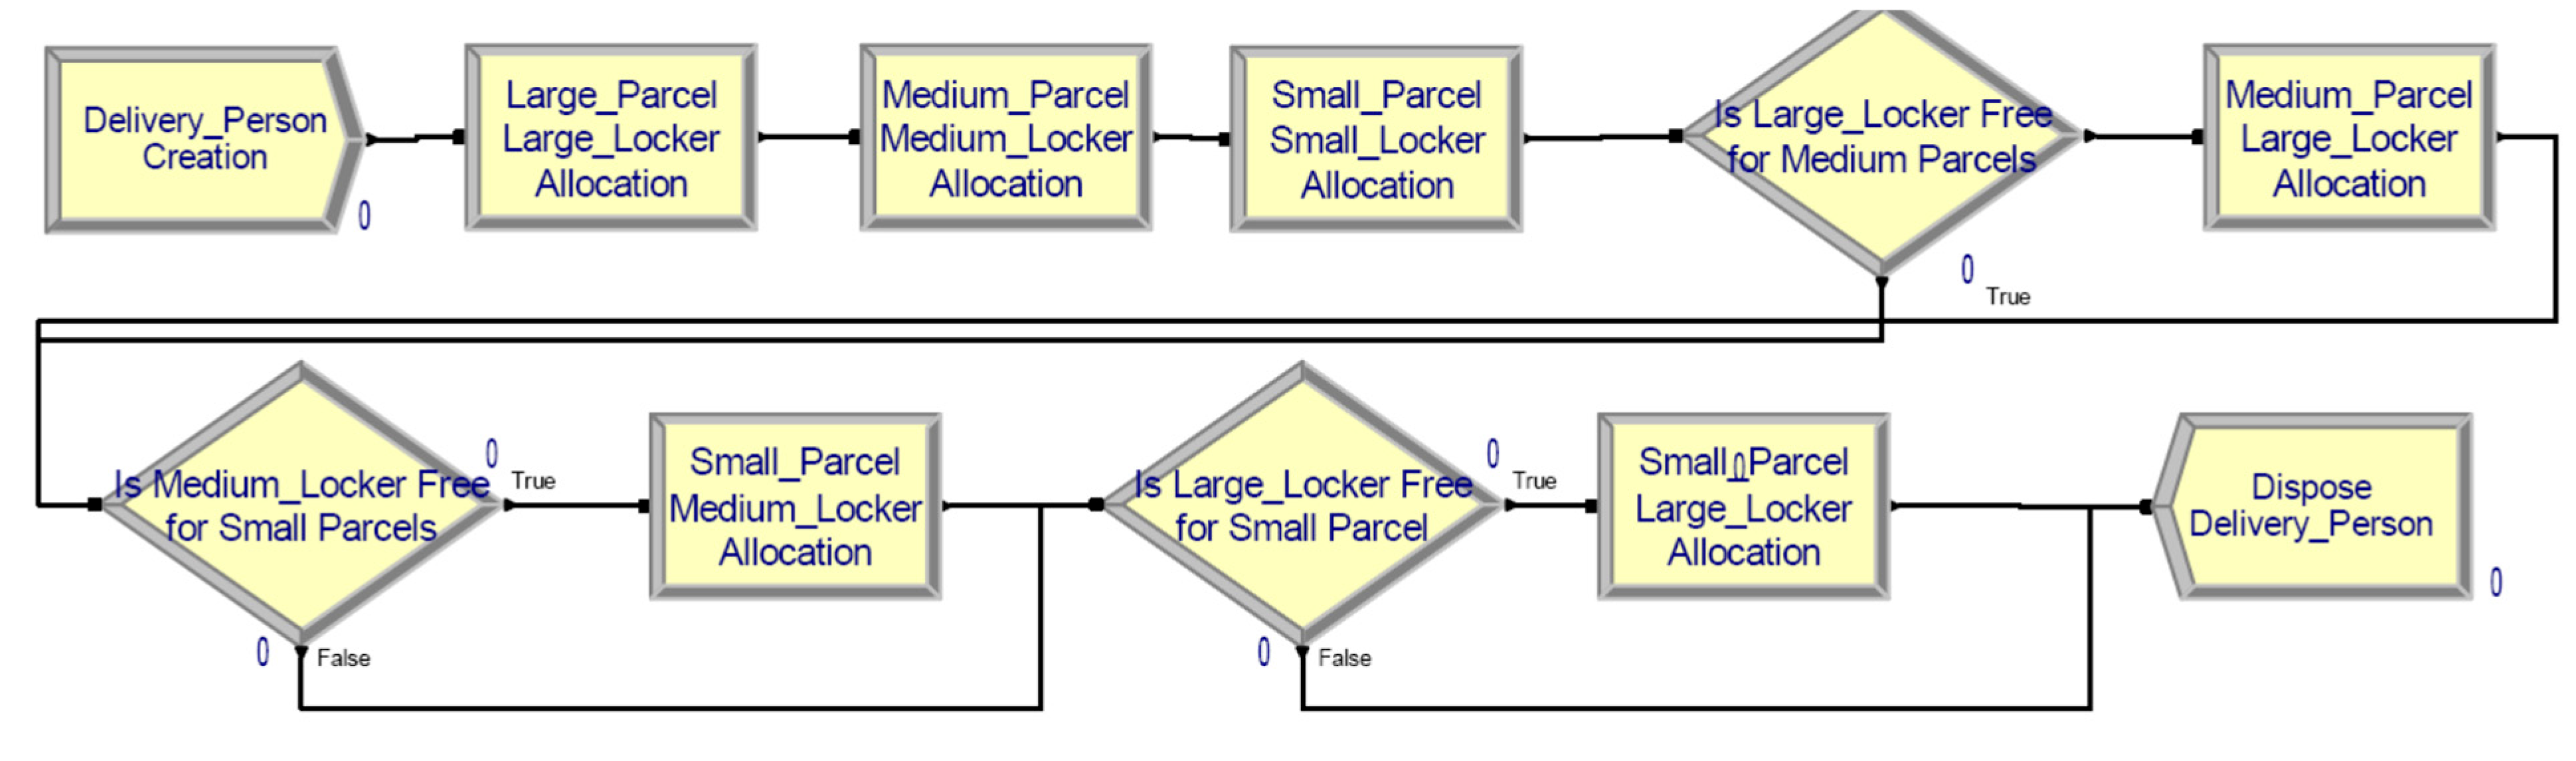
| Delivery Person | Delivery Person Creation | Create | It creates the delivery person as an entity in the system. The delivery person starts the activity daily at a conventional moment 0. |
| Large Parcel Large Locker Allocation | Signal | The large parcels are allowed to be transferred to the large lockers. The signal is transmitted to Hold Large Parcels module and the appropriate number of large parcels are released (see Equation (1)). | |
| Medium Parcel Medium Locker Allocation | Signal | The medium parcels are allowed to be transferred to the medium lockers. The signal is transmitted to Hold Medium Parcels module and the appropriate number of medium parcels are released (see Equation (4)). | |
| Small Parcel Small Locker Allocation | Signal | The small parcels are allowed to be transferred to the small lockers. The signal is transmitted to Hold Small Parcels module and the appropriate number of small parcels are released (see Equation (9)). | |
| Is Large Locker Free for Medium Parcels | Decide | The delivery person checks the availability of unoccupied large lockers () to determine whether medium parcels can be accommodated. | |
| Medium Parcel Large Locker Allocation | Signal | If there are free large lockers, a signal is emitted, and the module Hold Medium Parcels releases the adequate number of medium parcels to be delivered into large lockers (see Equation (7)). | |
| Is Medium Locker Free for Small Parcels | Decide | The delivery person checks the availability of unoccupied medium lockers () to determine whether small parcels can be accommodated. | |
| Small Parcel Medium Locker Allocation | Signal | If there are free medium lockers, a signal is emitted, and the module Hold Small Parcels releases the adequate number of medium parcels to be delivered into medium lockers (see Equation (13)). | |
| Is Large Locker Free for Small Parcels | Decide | The delivery person checks the availability of unoccupied large lockers () to determine whether small parcels can be accommodated. | |
| Small Parcel Large Locker Allocation | Signal | If there are free large lockers, a signal is emitted, and the module Hold Small Parcels releases the adequate number of medium parcels to be delivered into large lockers (see Equation (4)). | |
| Dispose Delivery Person | Dispose | The delivery person is disposed after it completes its activity. |
| Item | Data | Type | Values/Range of Variation |
|---|---|---|---|
| Large parcel | Daily generation number | Uniform | [0, 4] |
| Dwell time | Stochastic discrete distribution | p(k) = [0.80; 0.15; 0.05], k = 0, 1, 2 | |
| Medium parcel | Daily generation number | Uniform | [2, 8] |
| Dwell time | Stochastic discrete distribution | p(k) = [0.80; 0.15; 0.05], k = 0, 1, 2 | |
| Small parcel | Daily generation number | Uniform | [20, 36] |
| Dwell time | Stochastic discrete distribution | p(k) = [0.80; 0.15; 0.05], k = 0, 1, 2 | |
| Delivery person | Interval between deliveries | Constant | 24 h |
| Conventional lockers | Capacity (number of lockers) | Constant | 70 |
| End-of-Day Inventory | Automated Parcel Lockers Configuration | ||
|---|---|---|---|
| 〈Ll, Lm, Ls〉 = 〈6, 5, 36〉 | 〈Ll, Lm, Ls〉 = 〈5, 6, 38〉 | 〈Ll, Lm, Ls〉 = 〈5, 7, 36〉 | |
| Large parcels | −8.57 | −7.53 | −7.98 |
| Medium parcels | −5.90 | −6.06 | −5.57 |
| Small parcels | −6.85 | −6.69 | −5.97 |
Disclaimer/Publisher’s Note: The statements, opinions and data contained in all publications are solely those of the individual author(s) and contributor(s) and not of MDPI and/or the editor(s). MDPI and/or the editor(s) disclaim responsibility for any injury to people or property resulting from any ideas, methods, instructions or products referred to in the content. |
© 2025 by the authors. Licensee MDPI, Basel, Switzerland. This article is an open access article distributed under the terms and conditions of the Creative Commons Attribution (CC BY) license (https://creativecommons.org/licenses/by/4.0/).
Share and Cite
Rosca, E.; Oprea, F.C.; Ilie, A.; Burciu, S.; Rusca, F. Automated Parcel Locker Configuration Using Discrete Event Simulation. Systems 2025, 13, 613. https://doi.org/10.3390/systems13070613
Rosca E, Oprea FC, Ilie A, Burciu S, Rusca F. Automated Parcel Locker Configuration Using Discrete Event Simulation. Systems. 2025; 13(7):613. https://doi.org/10.3390/systems13070613
Chicago/Turabian StyleRosca, Eugen, Floriana Cristina Oprea, Anamaria Ilie, Stefan Burciu, and Florin Rusca. 2025. "Automated Parcel Locker Configuration Using Discrete Event Simulation" Systems 13, no. 7: 613. https://doi.org/10.3390/systems13070613
APA StyleRosca, E., Oprea, F. C., Ilie, A., Burciu, S., & Rusca, F. (2025). Automated Parcel Locker Configuration Using Discrete Event Simulation. Systems, 13(7), 613. https://doi.org/10.3390/systems13070613