Article

Identifying Critical Risks in Low-Carbon Innovation Network Ecosystem: Interdependent Structure and Propagation Dynamics

by
Ruguo Fan
1,
Yang Qi
1,
Yitong Wang
1 and
Rongkai Chen
2,*
1
School of Economics and Management, Wuhan University, Wuhan 430072, China
2
School of Applied Economics, Renmin University of China, Beijing 100872, China
*
Author to whom correspondence should be addressed.
Systems 2025, 13(7), 599; https://doi.org/10.3390/systems13070599
Submission received: 7 June 2025 / Revised: 4 July 2025 / Accepted: 15 July 2025 / Published: 17 July 2025
(This article belongs to the Section Systems Practice in Social Science)

Abstract

Global low-carbon innovation networks face increasing vulnerabilities amid growing geopolitical tensions and technological competition. The interdependent structure of low-carbon innovation networks and the risk propagation dynamics within them remain poorly understood. This study investigates vulnerability patterns by constructing a two-layer interdependent network model based on Chinese low-carbon patent data, comprising a low-carbon collaboration network of innovation entities and a low-carbon knowledge network of technological components. Applying dynamic shock propagation modeling, we analyze how risks spread within and between network layers under various shocks. Our findings reveal significant differences in vulnerability distribution: the knowledge network consistently demonstrates greater susceptibility to cascading failures than the collaboration network, reaching complete system failure, while the latter maintains partial resilience, with resilience levels stabilizing at approximately 0.64. Critical node analysis identifies State Grid Corporation as a vulnerability point in the collaboration network, while multiple critical knowledge elements can independently trigger system-wide failures. Cross-network propagation follows distinct patterns, with knowledge-network failures consistently preceding collaboration network disruptions. In addition, propagation from the collaboration network to the knowledge network showed sharp transitions at specific threshold values, while propagation in the reverse direction displayed more gradual responses. These insights suggest tailored resilience strategies, including policy decentralization approaches, ensuring technological redundancy across critical knowledge domains and strengthening cross-network coordination mechanisms to enhance low-carbon innovation system stability.

1. Introduction

The global shift toward a low-carbon economy constitutes one of the foremost technological and organizational challenges of the 21st century. As climate-change concerns mount and nations advance their carbon neutrality pledges, low-carbon innovation has established itself as a pivotal catalyst for sustainable development and ecological modernization [1]. These innovations span a broad spectrum of technologies designed to curtail greenhouse gas emissions, enhance energy efficiency, and facilitate the shift from fossil fuels to renewable energy sources [2,3]. The development and dissemination of these technologies, however, unfold not in isolation but through intricate interactions among diverse stakeholders—research institutions, corporations, and governmental bodies—forming what can be conceptualized as a complex networked system: an innovation network ecosystem.
In recent years, geopolitical tensions, trade disputes, and global supply chain fragilities have progressively revealed the vulnerability of innovation networks. Intensifying technological rivalry between major economies has posed substantial challenges to the resilience and stability of low-carbon innovation ecosystems [4,5]. Trade barriers, technology export controls, and strategic decoupling policies have fractured previously cohesive innovation networks, potentially hindering the dissemination of essential low-carbon technologies [6,7]. These developments prompt fundamental questions regarding the resilience of low-carbon innovation networks and their capacity to endure mounting external pressures.
Low-carbon innovation networks possess unique characteristics that distinguish them from traditional innovation systems. These networks function under considerable policy constraints, confront substantial market uncertainties, and necessitate integration across varied technological domains [8,9]. Significantly, they exhibit a hierarchical, multi-tiered architecture comprising organizational levels (innovation entities such as corporations, universities, and research institutes) and technological levels (knowledge domains and intellectual components) that profoundly influences both their operational capacity and vulnerability. Central to this framework is a dual interdependent network configuration: primarily, a low-carbon collaboration network (LCCN) connecting innovation entities (corporations, universities, and research institutes) engaged in technological advancement; and secondarily, a low-carbon knowledge network (LCKN) interconnecting intellectual components embedded within patent literature. From complex systems theory perspective, such interdependent networks constitute a class of “networks of networks” characterized by emergent properties, nonlinear dynamics, and threshold effects that cannot be predicted by examining individual network layers in isolation [10]. These two network layers interact through complex dependency relationships—innovation actors develop and apply specific knowledge elements, while the evolution of knowledge domains influences the formation of new collaborations [11]. This interdependent structure significantly amplifies the impact of geopolitical tensions and trade conflicts. When export controls or sanctions impair a crucial innovation entity, the consequences cascade not only through immediate collaborations but also extend to knowledge domains dependent on that entity’s expertise, potentially precipitating additional failures among other innovation entities relying on those knowledge domains. This intricate propagation mechanism generates systemic vulnerabilities substantially surpassing those observed in less complex network structures, potentially culminating in catastrophic cascade failures throughout the innovation ecosystem—a phenomenon that complexity scientists designate as “systemic risk” or “network-induced fragility” [12,13,14]. Understanding this amplification effect is essential for developing strategies to enhance the resilience of low-carbon innovation systems in an increasingly fractured global environment.
The study of network vulnerability has a rich tradition in complex systems research, with applications ranging from infrastructure systems to trade networks [15,16,17,18]. Network science provides a powerful analytical framework for understanding how topological properties influence network resilience under various forms of perturbation [13,19]. Research on innovation network vulnerability has been examined from multiple perspectives, but it appears to face methodological constraints. On the one hand, from a static perspective, studies have investigated the structural properties of innovation networks and network resilience [20,21,22,23], though these approaches may not fully capture the dynamic nature of innovation processes. Static analyses tend to focus on structural properties rather than temporal interactions between innovation actors and knowledge elements, and they may not adequately account for feedback mechanisms that could amplify initial disruptions through cross-layer dependencies, potentially leading to an underestimation of systemic risks in innovation ecosystems. For example, Su et al. (2024) [24] developed a complex network-based technology resilience assessment framework that quantifies the historical trajectory and future path of energy technology resilience in China. Using patent data from the aerospace industry to build collaboration and knowledge networks, Huang et al. (2025) [25] investigated the impact of the internal knowledge network’s resilience to destruction, agility, and knowledge location on an organization’s resource-transformation efficiency in collaborative networks.
On the other hand, dynamic approaches have modeled how risk propagates through innovation networks, highlighting the potential for chain reactions and systemic failures [26,27,28,29]. For instance, Liu et al. (2024) [30] studied R&D network resilience under risk propagation from an organizational learning perspective by constructing a risk propagation model. Wang et al. (2019) [31] proposed a cascading failure model for R&D networks based on the SIR-CA model and analyzed its particular effect on the cascading failure of R&D networks through numerical simulation. However, these models appear to have certain limitations in that they often treat innovation networks as single-layer systems and may not fully capture the interdependent nature of collaboration and knowledge networks. These models may not adequately represent how disruptions in organizational relationships affect knowledge accessibility, or how knowledge-domain failures impact collaborative capacity, potentially providing incomplete assessments of vulnerability patterns and missing amplification effects that could occur through cross-network propagation.
Despite these valuable studies, significant research gaps remain in our understanding of low-carbon innovation network vulnerability. First, while considerable attention has been devoted to innovation networks generally, the multilayered structural characteristics and interdependency-induced vulnerabilities of low-carbon innovation networks remain underexplored. The complex hierarchical architecture—comprising both innovation actors and knowledge elements interconnected through dependency relationships—creates unique vulnerability patterns that conventional single-layer network analyses cannot adequately capture [32].
Second, the current geopolitical landscape has introduced targeted disruption scenarios that existing models fail to address. In an environment of strategic technological competition, restrictive measures increasingly target either critical technologies (knowledge elements) or key enterprises controlling these technologies (innovation actors). When export controls target a firm with critical technological capabilities, the impact cascades through the collaboration network and disrupts access to essential knowledge elements throughout the broader innovation ecosystem. Similarly, when restrictions affect specific technological domains, the effects reverberate through firms dependent on those knowledge elements, potentially paralyzing entire innovation subsystems. These strategic targeting mechanisms, particularly prominent in low-carbon technologies, given their economic and security significance, require analytical frameworks capable of capturing multi-level propagation dynamics.
Third, the existing research appears to lack comprehensive methodological frameworks for analyzing interdependent innovation networks. Current approaches tend to analyze knowledge networks and collaboration networks as separate entities rather than as interconnected components of a unified system [33,34], which may create challenges including potential difficulties in identifying critical vulnerabilities that trigger cross-layer cascading effects, limited understanding of amplification mechanisms through bidirectional feedback loops, and possible underestimation of risks that emerge from network interdependencies. Real-world examples of such risk underestimation include (1) knowledge transfer failures, where innovation projects collapse despite strong collaboration networks due to insufficient absorptive capacity and knowledge-stickiness barriers that are invisible when analyzing collaboration networks in isolation [35]; and (2) cross-network propagation failures, where disruptions in university–industry collaboration networks during COVID-19 unexpectedly triggered systematic breakdowns in knowledge transfer processes across entire innovation ecosystems [36]. This limitation is particularly consequential for low-carbon innovation, where technological development inherently depends on the interplay between knowledge elements and innovation actors. The complex dependency structures in low-carbon technologies, which integrate multiple knowledge domains and involve diverse innovation actors [37], necessitate an interdependent network approach to properly assess systemic vulnerabilities.
To address these research gaps, this study develops an interdependent network approach to analyzing the vulnerability of low-carbon innovation systems. Using comprehensive Chinese low-carbon patent data, we construct a realistic two-layer interdependent innovation network comprising both an LCCN connecting innovation actors and an LCKN representing co-occurrence relationships among knowledge elements. We perform dynamic analysis by developing a shock propagation model grounded in complex network theory. This model specifically designs cross-layer propagation mechanisms that capture how disturbances transmit both within each network layer and between the collaboration and knowledge layers through their dependent relationships. The propagation mechanisms incorporate threshold-based activation, weighted influence, and bidirectional feedback effects to realistically simulate how shocks cascade through the interdependent system. This empirically grounded network structure and theoretically informed modeling approach allows us to provide a more comprehensive assessment of systemic risks in low-carbon innovation ecosystems.
Our research makes several significant contributions to the literature. First, we advance theoretical understanding of innovation network vulnerability by developing a comprehensive analytical framework that explicitly accounts for the interdependence between knowledge elements and innovation actors (implemented in Section 2.3, Section 2.4 and Section 3.4). Second, we offer methodological innovations through the application of a dynamic shock propagation model specifically designed for multilayered networks, allowing for more accurate simulation of cascading failures across network boundaries (implemented in Section 2.3 and Section 2.4, and throughout Section 3). Third, we provide empirical insights into the structure and vulnerability patterns of China’s low-carbon innovation ecosystem, identifying critical nodes and potential intervention points for enhancing system resilience (implemented in Section 2.1, Section 2.2, Section 3.3 and Section 3.4).
This paper is organized as follows: Section 2 presents our data sources and methodological approach, including the construction of the interdependent network model and the shock propagation dynamics. Section 3 examines the dynamic propagation of shocks through the interdependent networks and identifies critical vulnerabilities. Finally, Section 4 discusses the implications of our findings for innovation policy and management strategies aimed at enhancing the resilience of low-carbon innovation systems.

2. Materials and Methods

2.1. Data Sources and Case Background

This study utilizes patent data drawn from the Dawei Innojoy Patent Database1, a comprehensive repository containing information on more than 180 million patents worldwide. This database provides detailed records of patent applications and grants, including applicant information, invention descriptions, filing dates, and International Patent Classification (IPC) codes, making it an invaluable resource for analyzing technological innovation systems.
The selection of China as the case context for this study is strategically motivated by several compelling characteristics that make it an ideal case for investigating innovation network vulnerability. China represents the world’s largest low-carbon innovation ecosystem by patent volume, accounting for over 50% of global low-carbon patents as of 2023 [38], which provides the scale and network density necessary to meaningfully test our interdependent network vulnerability models. This comprehensive coverage ensures that our findings are based on a robust dataset that captures the complexity of innovation network interactions. Beyond scale considerations, China’s position at the center of current technological competition and trade tensions makes it particularly relevant for studying how geopolitical pressures affect innovation network resilience [4]. The recent implementation of technology export controls, trade disputes, and strategic decoupling policies that directly target Chinese technologies creates a natural context for understanding vulnerability propagation in innovation networks under external pressure.
The structural characteristics of China’s low-carbon innovation system also align closely with our research objectives. The system exhibits high levels of interdependence between domestic and international actors, as well as complex knowledge-collaboration linkages that are essential for testing our theoretical framework. The presence of both state-owned enterprises such as State Grid Corporation (Beijing, China) and private companies, universities, and research institutes creates the multilayered network structure that our methodology is specifically designed to analyze. This diversity of actor types and institutional arrangements provides rich empirical variation for examining different vulnerability patterns across network layers. Furthermore, understanding the vulnerability patterns in China’s low-carbon innovation network carries significant implications for global climate objectives, given China’s central role in low-carbon technology development and deployment worldwide [39]. The insights derived from this case can inform both domestic resilience strategies and international cooperation frameworks for low-carbon innovation.
To identify patents specifically related to low-carbon technologies, we employed the IPC Green Inventory developed by the World Intellectual Property Organization (WIPO) as our search framework [40]. The IPC Green Inventory was established by the IPC Committee of Experts to facilitate the retrieval of patent information related to Environmentally Sound Technologies, as defined by the United Nations Framework Convention on Climate Change (UNFCCC). This classification system provides a structured approach to identifying patents across various domains of environmental technologies, including alternative energy production, transportation, waste management, agriculture, and administrative or regulatory aspects of environmental technologies.
The IPC Green Inventory offers several advantages for our research purposes. First, it provides a standardized and internationally recognized framework for identifying low-carbon technologies, enhancing the reproducibility and comparability of our findings. Second, it covers a comprehensive range of technological domains relevant to climate-change mitigation and adaptation, allowing us to capture the full spectrum of low-carbon innovations. Third, it has been developed by patent classification experts with specific attention to environmental technologies, ensuring high relevance and precision in identifying low-carbon patents [41,42].
Using the corresponding IPC codes from the Green Inventory, we conducted a systematic search in the Dawei Innojoy Patent Database to retrieve all relevant patents. Our search strategy focused on patents filed in China to capture the development of low-carbon technologies within the Chinese innovation system. The search encompassed patents filed by both domestic and international entities operating within China, providing a comprehensive view of the country’s low-carbon innovation landscape.
For each retrieved patent, we extracted several key data elements essential for constructing our interdependent network model. (1) Applicant information: Names and addresses of all organizations and individuals listed as patent applicants, which served as the basis for identifying nodes in the LCCN. (2) IPC codes: The complete set of IPC codes assigned to each patent at the subgroup level, which formed the basis for identifying nodes in the LCKN. (3) Application dates: The dates when patents were filed, allowing us to track the temporal evolution of the innovation networks (though our primary analysis focuses on the cumulative network structure).
Following the data extraction, we conducted an extensive cleaning and standardization process to ensure data quality and consistency. This included the harmonization of organization names to account for variations in how entities are recorded across different patent documents, the validation of IPC code assignments, and the removal of duplicate records. Additionally, patents with incomplete information or those that did not meet our inclusion criteria were excluded from the analysis. As a result of the data cleansing, a total of 189,943 patents ended up being eligible and were then used to build innovation networks.

2.2. Network Structure

We next describe the construction of an interdependent network system that captures collaborative relationships and knowledge flows in China’s low-carbon innovation ecosystem. The interdependent network consists of two distinct but interconnected layers: the LCCN and the LCKN, with cross-layer dependencies established through patent-based connections.
The LCCN represents the collaborative relationships between organizations engaged in low-carbon innovation activities. In this network, nodes represent entities such as universities, research institutions, corporations, and government agencies that have participated in the development of low-carbon technologies. An edge between two organizations indicates co-patenting activity, signifying their collaboration in producing low-carbon innovations. The strength of these connections is determined by the frequency of collaboration, with multiple joint patents resulting in stronger ties between entities. This approach aligns with established methodologies in innovation network analysis that use co-patenting as a proxy for collaborative relationships [43].
The LCKN captures the technological knowledge structure underlying low-carbon innovations. In this network, nodes represent technological components or knowledge elements, as identified by IPC codes at the subgroup level. These codes provide a granular categorization of the technological domains that constitute low-carbon innovations. An edge between two knowledge elements indicates their co-occurrence within the same patent document, suggesting technological proximity or complementarity between these components. The frequency of co-occurrence determines the strength of connections between knowledge elements, reflecting the intensity of their technological relationship. This approach builds on previous research that has used patent classification co-occurrence to map knowledge [44,45].
The interdependence between these two network layers is established through the patents themselves, which serve as bridging mechanisms connecting organizations to the knowledge elements they develop or utilize. Specifically, cross-layer dependencies are created when an organization (node in the LCCN) is linked to a knowledge element (node in the LCKN) through their association in patent documents. The strength of these interlayer connections is quantified based on the frequency with which an organization produces patents containing specific knowledge elements, reflecting the organization’s specialization in or reliance on particular technological domains.
This interdependent network structure provides a comprehensive framework for analyzing how risk propagates both within and between the collaborative and knowledge dimensions of the low-carbon innovation ecosystem. By modeling both the internal dynamics of each network layer and the cross-layer interactions, we can assess systemic vulnerabilities and identify critical components whose failure could trigger widespread cascading effects across both LCCN and LCKN layers throughout the innovation system.

2.3. Single-Layer Network Shock Propagation Model

Network shock propagation models have gained significant traction in analyzing systemic risks across complex systems, including financial networks, supply chains, and innovation ecosystems [46,47,48]. This section establishes the theoretical foundation and implementation of our single-layer network shock propagation model, which serves as the cornerstone for the more sophisticated interdependent network approach discussed subsequently.
The propagation of shocks in innovation networks can be conceptualized as a cascade process where disruptions diffuse through network connections with varying intensities [49,50]. Our approach adopts a threshold-based cascade model, which has demonstrated considerable utility in modeling contagion phenomena in socioeconomic networks [51]. Within this framework, each node, i , is characterized by a binary state variable,   S i ∈ {0,1}, representing normal functioning or cascade/failure state, respectively. The transition mechanism between states is governed by the weighted influence exerted by neighboring nodes, mathematically expressed as follows:
I i t = j N i w i j · S j t 1 j N i w i j
where N i denotes the set of neighboring nodes connected to node i , w i j represents the connection weight between nodes i and j , and S j t 1 indicates the state of node j in the preceding iteration. A node transitions from a normal to cascade state when the aggregated influence surpasses its resilience threshold, θ i :
S i t =   1 ,   i f   I i t > θ i   o r   S i t 1 = 1   0 ,   o t h e r w i s e  
These thresholds embody the resilience of entities to withstand external pressures or shocks. In our implementation, we employ a heterogeneous threshold approach where each node’s threshold is determined based on its specific characteristics.
In the context of low-carbon innovation networks, we apply this model separately to both the LCCN and the LCKN. The simulation process begins with an initialization phase, where seed nodes representing the initial shock are set to the cascade state, while all others remain in the normal state. The propagation then proceeds iteratively, with node states updated based on the influence levels and predetermined thresholds. This irreversible process continues until equilibrium is reached—when no new nodes enter the cascade state—or until a maximum iteration threshold is attained.
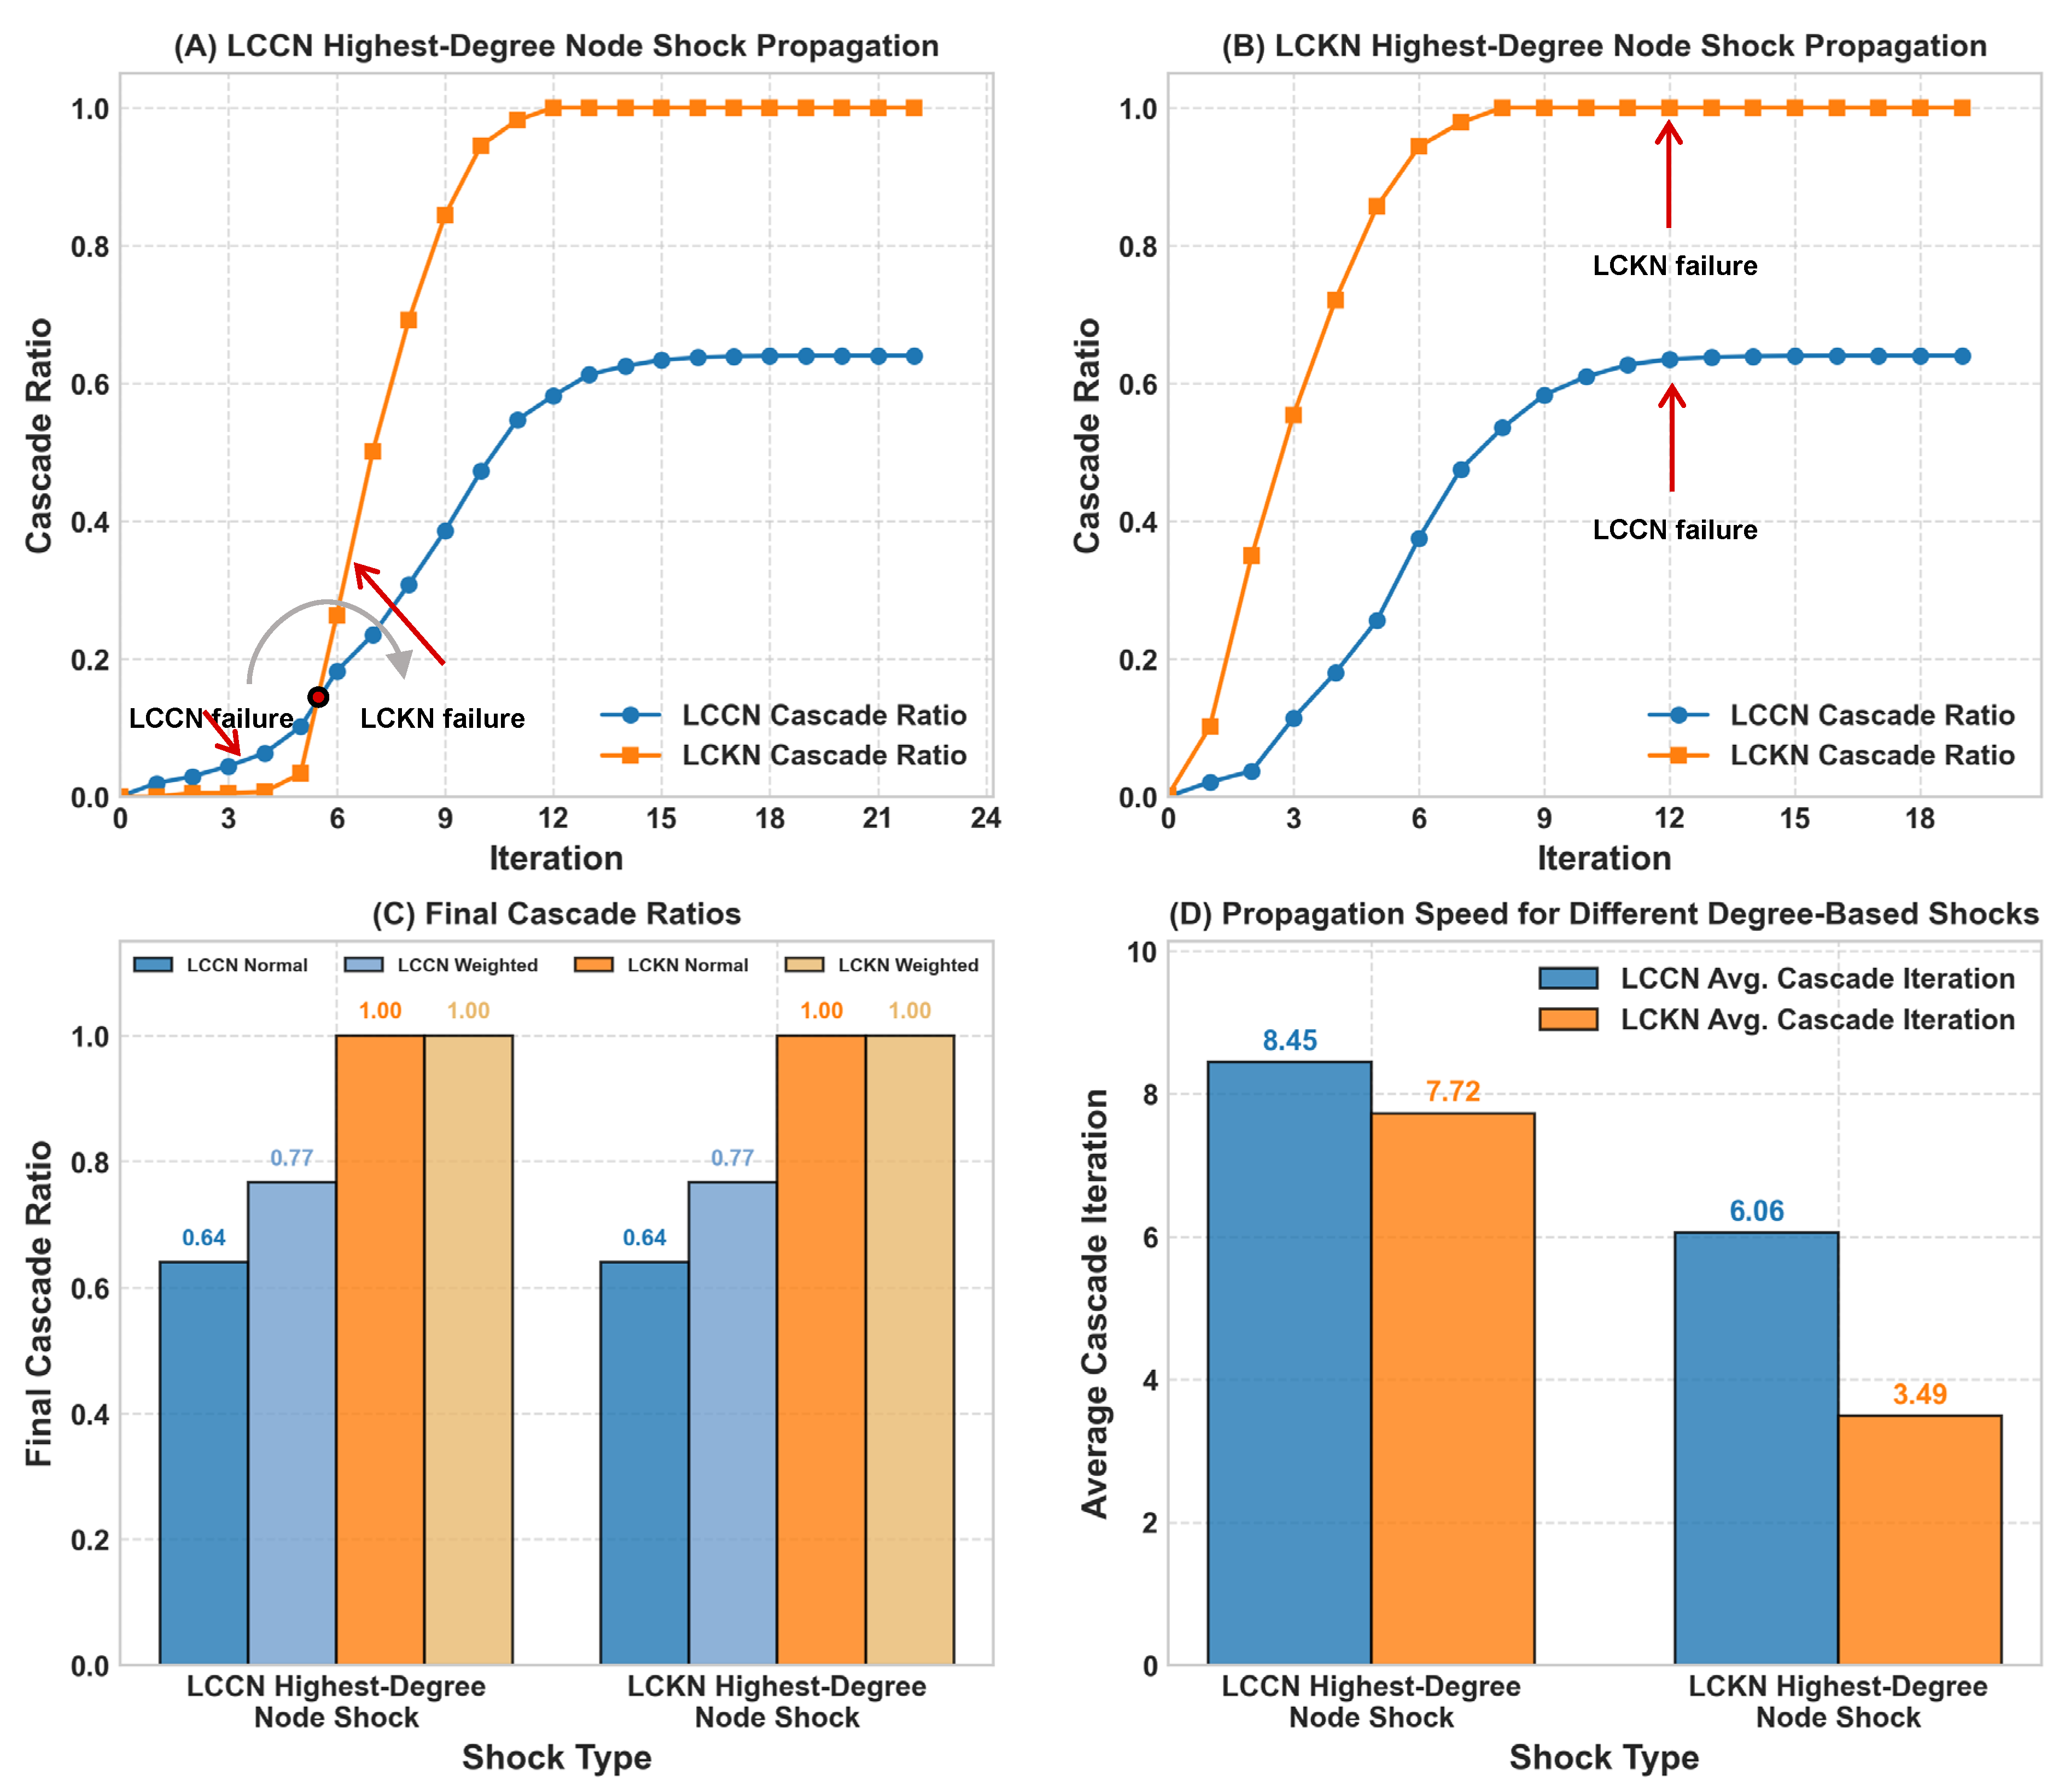
To quantify the impact of shock propagation, we employ several evaluation metrics. The cascade ratio represents the proportion of nodes that ultimately enter the cascade state, providing a measure of the overall system vulnerability. The weighted cascade ratio incorporates node importance by weighting the cascade proportion by node degree, offering insights into the functional impact of the cascade. Additionally, the average cascade iteration metric captures the temporal dynamics of the propagation process, indicating how rapidly shocks diffuse through the network.
While the single-layer model offers valuable insights into intra-network shock propagation dynamics, it does not account for the critical interdependencies between collaboration and knowledge networks. Therefore, we extend this model in the next section.

2.4. Interdependent Networks Shock Propagation Model

Innovation systems are intrinsically characterized by complex interdependencies across multiple network dimensions [52]. Particularly in low-carbon technology domains, the LCCN and LCKN exhibit intricate interactions that can substantially amplify or attenuate shock propagation. To capture these complex dynamics, we develop a comprehensive interdependent-networks shock propagation model that builds upon and extends the single-layer approach.
Our interdependent network model conceptualizes a two-layer network system. The interconnections between these layers are operationalized through a dependency matrix, where each element, d i j , quantifies the strength of dependency between node i in the LCCN and node j in the LCKN. The central innovation in this approach lies in the dual influence mechanism, whereby a node’s state evolution is determined by both intralayer connections (influences from within the same network) and interlayer dependencies (influences from the complementary network). This bidirectional influence framework enables a more realistic representation of shock propagation in complex innovation systems.
The mathematical formulation distinguishes between intralayer and interlayer influences for each node. The intralayer influence follows the formulation established in the single-layer model, calculated separately for each network:
For LCCN nodes,
I L C C N , i i n t r a t = j N L C C N , i w i j · S L C C N , j t 1 j N L C C N , i w i j
For LCKN nodes,
I L C K N , t i n t r a t = j N L C K N , i w i j · S L C K N , j t 1 j N L C K N , i w i j
The interlayer influence captures the impact of cascades from one network layer on nodes in the other. For LCCN nodes, the influence from LCKN is modulated by a knowledge redundancy parameter, r i , which represents the entity’s capacity to withstand knowledge network disruptions:
I L C C N , i i n t e r t = 1 r i · j D L C C N , i d i j · S L C K N , j t 1 j D L C C N , i d i j
Conversely, the influence from LCCN to LCKN nodes is calculated as follows:
I L C K N , i i n t e r t = j D L C K N , i d i j · S L C C N , j t 1 j D L C K N , i d i j
where D L C C N , i and D L C K N , i denote the sets of nodes in the opposite layer with dependencies to node i .
In our model, each node has a single resilience threshold that governs its response to both intralayer and interlayer influences. The state transition rules incorporate both influence types, with a node transitioning to the cascade state if either influence exceeds its threshold:
S L C C N , i t =   1 ,   i f   I L C C N , i i n t r a t > θ L C C N , i   o r   I L C C N , i i n t e r t > θ L C C N , i   o r   S L C C N , i t 1 = 1   0 ,   o t h e r w i s e  
S L C K N , i t =   1 ,   i f   I L C K N , i i n t r a t > θ L C K N , i   o r   I L C K N , i i n t e r t > θ L C K N , i   o r   S L C K N , i t 1 = 1   0 ,   o t h e r w i s e  
While alternative modeling approaches exist, including weighted aggregation conditions ( α I i n t r a + β I i n t e r > θ) that assume influences can compensate for each other, and min–max conditions ( I i n t r a > θ 1   A N D   I i n t e r > θ 2 ) that require simultaneous threshold breaches, we adopt the OR condition based on the specific characteristics of innovation networks. In innovation systems, knowledge resources and collaborative relationships function as complementary rather than substitutable assets. Organizations cannot compensate for knowledge-domain failures through stronger collaboration alone, nor can superior knowledge assets fully offset collaboration network breakdowns, as modern innovation inherently requires both knowledge access and collaborative capabilities for success. The OR condition therefore reflects the reality that failure in either domain can independently compromise an organization’s innovation capacity. Additionally, this approach provides a conservative risk assessment framework appropriate for policy applications, where identifying all potential failure pathways is essential for developing comprehensive resilience strategies in low-carbon innovation ecosystems.
The node-specific thresholds are heterogeneously determined based on their characteristics, following the established notion in the innovation diffusion and network resilience literature that different actors possess varying levels of resistance to external influences. For LCCN nodes, the threshold is calculated using knowledge diversity:
θ L C C N , i = α C + β C ·   K i L C K N
where α c is the base threshold, β c is the knowledge diversity coefficient, K i is the number of different knowledge elements utilized by node i , and L C K N is the total number of nodes in the knowledge network. This formulation reflects the theoretical assumption, supported by the organizational resilience literature, that entities with more diverse knowledge portfolios exhibit greater adaptability and resilience against external shocks [53]. Knowledge diversity serves as a form of strategic redundancy, allowing innovation entities to reconfigure their activities when faced with disruptions in specific knowledge domains.
For LCKN nodes, the threshold is based on usage frequency:
θ L C K N , i = α K + β K ·   U i L C C N
where α k is the base threshold, β k is the usage coefficient, U i is the number of different innovation entities utilizing knowledge element i , and L C C N is the total number of nodes in the collaboration network. This parameterization aligns with the knowledge stock perspective in innovation studies which suggests that more widely used knowledge elements tend to be more institutionalized, stable, and resistant to disruptions [54,55]. Widely diffused knowledge elements typically represent more mature, well-established areas of expertise with higher legitimacy and broader application potential, thereby exhibiting greater resilience to systemic shocks.
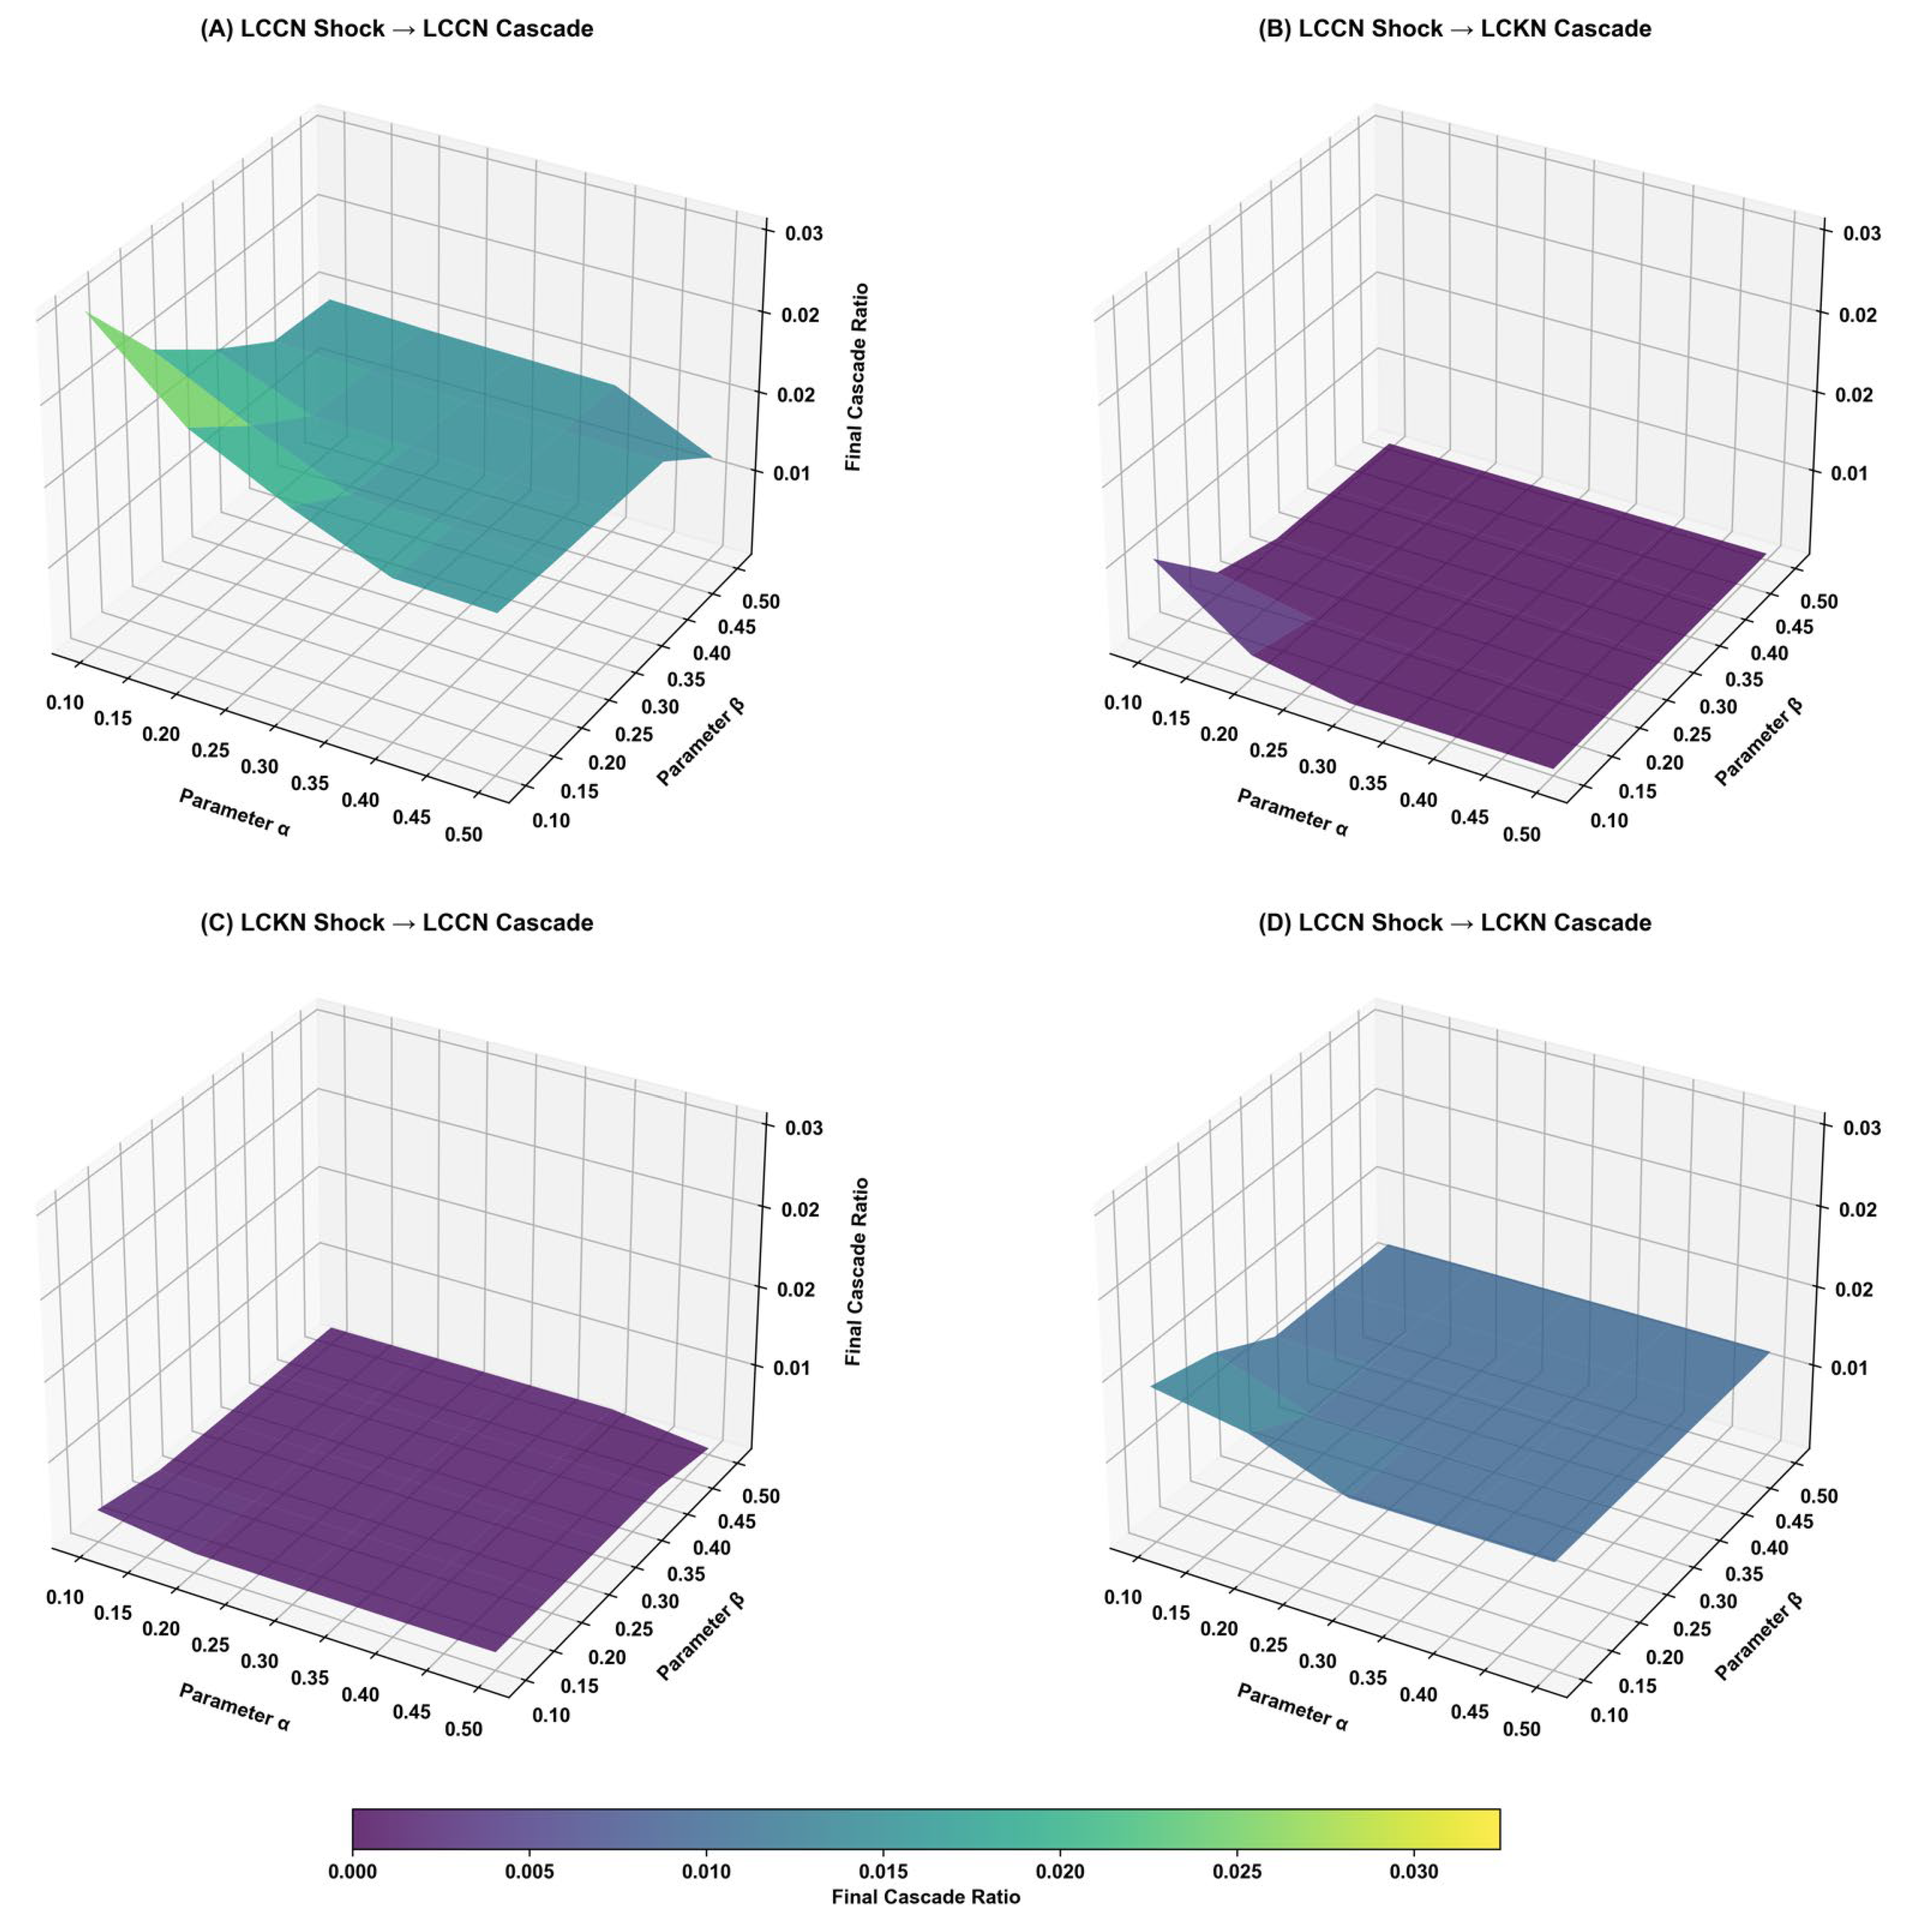
The calibration of the base threshold parameters ( α C and α K ) and diversity/usage coefficients ( β C and β K ) draws from empirical studies on innovation network resilience which suggest that threshold values in socio-technical systems typically fall within the 0.1–0.5 range [56]. To validate our parameter selection, we conducted a comprehensive sensitivity analysis examining how variations in α (0.10–0.50) and β (0.10–0.50) affect cascade outcomes across different shock scenarios (see Appendix A Figure A1). The sensitivity analysis reveals that our chosen moderate values (α = 0.2 and β = 0.3) produce stable cascade dynamics across all four propagation pathways, avoiding both excessive rigidity (which would prevent meaningful cascade propagation) and hypersensitivity (which would lead to deterministic outcomes regardless of shock characteristics). The analysis shows that cascade ratios remain relatively stable within ±0.005 variation around our chosen parameter values, while exhibiting appropriate responsiveness to different shock intensities and network structures. The propagation algorithm initiates with seed nodes set to the cascade state and proceeds iteratively. At each step, both intralayer and interlayer influences are calculated for all nodes, states are updated based on threshold conditions, and the process continues until equilibrium or until the maximum iteration limit is reached. The flow of Algorithm 1 is shown in the following table. The specific simulation parameters are set in Appendix B.
Algorithm 1. Low-Carbon Innovation Networks Shock Propagation Model.
Input: Network data, parameters (shock ratio, max iterations, random seed)
Output: Cascade metrics and proportion of affected nodes
1: Initialize procedure
2: Import two-layer low-carbon network (LCCN, LCKN, dependency matrix)
3: Initialize parameters (thresholds, max iterations)
4: Set initial shock nodes based on shock ratio or degree
5: while TIME-STEP ≠ STOP-TIME do
7:  foreach layer (LCCN, LCKN) do
8:    Compute intralayer cascade influence based on neighbor states
9:    Compute interlayer cascade influence based on dependency matrix
10:  Cascade State Update
11:  foreach node in LCCN and LCKN do
12:    Calculate total cascade influence
13:    Update node state if influence exceeds threshold
14:  TIME-STEP ← TIME-STEP + 1
15: Calculate cascade metrics and proportion of affected nodes

3. Results

3.1. Risk Propagation Dynamics Under Degree-Based Shocks

This section examines the propagation dynamics when highest-degree nodes in both the LCCN and LCKN experience targeted shocks. Figure 1 illustrates the evolution of cascade ratios, final impact, and propagation speeds across both network layers under different shock scenarios.
The temporal evolution of cascade ratios under LCCN highest-degree node shocks is depicted in Figure 1A. As clearly indicated by the annotations and arrows, when collaboration network nodes are directly targeted, LCCN failure initiates first (being the direct shock target), with cascade effects beginning around iteration 3. This initial failure then propagates across network boundaries, triggering subsequent LCKN failures. When the most connected nodes in the collaboration network are targeted, we observe distinct propagation patterns between the two interdependent networks. The LCKN (represented by the orange line with square markers) demonstrates a more rapid and extensive cascade effect, reaching a full cascade ratio of 1.0 by approximately iteration 12, indicating complete system failure. In contrast, the LCCN (represented by the blue line with circle markers) exhibits a more gradual and limited propagation, with the cascade ratio stabilizing at approximately 0.64 after iteration 12. The annotations clearly illustrate that while LCCN failure occurs first due to direct targeting, the knowledge network ultimately suffers more complete failure, while the collaboration network maintains partial resilience.
Figure 1B presents the evolution of cascade ratios when highest-degree nodes in the LCKN are targeted instead. The propagation patterns remain remarkably similar to those observed in the LCCN shock scenario, with the LCKN again reaching complete failure (cascade ratio of 1.0) by approximately iteration 6, while the LCCN stabilizes at the same 0.64 cascade ratio by iteration 9. This consistency across both shock scenarios suggests a fundamental asymmetry in vulnerability between the two network layers, with the knowledge network consistently more susceptible to cascading failures regardless of the initial shock source.
Panels (C) and (D) present complementary but necessarily distinct perspectives on cascading failure dynamics. The final cascade ratios for both networks under different shock types are summarized in Figure 1C, which introduces an additional dimension by comparing normal and weighted network configurations. For both LCCN and LCKN highest-degree node shocks, the final cascade ratios remain consistent across shock types: the LCCN reaches 0.64 under normal conditions and 0.77 under weighted conditions, while the LCKN consistently achieves the maximum cascade ratio of 1.0 in both normal and weighted scenarios. This consistency across shock sources further supports the finding that the knowledge network exhibits structural vulnerabilities that make it particularly susceptible to cascading failures, while the collaboration network maintains partial resilience regardless of where the initial shock originates. Panel (D) provides the essential temporal dimension by measuring propagation speed through average cascade iterations, offering critical insights into failure velocity that meaningfully complement the failure extent measurements shown in panel (C). This speed metric is essential for understanding system vulnerability dynamics and complements the extent measurements in panel (C) by revealing how quickly failures propagate through the interdependent networks. The LCCN highest-degree node shock scenario requires an average of 8.45 iterations in the LCCN layer and 7.72 iterations in the LCKN layer to reach their respective final states. Conversely, when the LCKN highest-degree nodes are targeted, the propagation speed increases dramatically, requiring only 6.06 iterations for the LCCN and just 3.49 iterations for the LCKN to reach their final states. This notable acceleration in propagation speed when the knowledge network is directly targeted (compared to when shocks originate in the collaboration network) suggests that the LCKN not only fails more completely but also fails more rapidly when directly shocked, indicating its position as a critical vulnerability within the interdependent system.
These findings reveal significant asymmetries in the propagation dynamics between the two network layers. The knowledge network consistently demonstrates higher vulnerability both in terms of final cascade extent and propagation speed, while the collaboration network exhibits partial resilience regardless of shock origin. Additionally, the substantially faster propagation when targeting LCKN highest-degree nodes highlights the knowledge network as the more vulnerable component in this interdependent system.

3.2. Random Shock Risk Assessment

In this section, we analyze the vulnerability of the interdependent low-carbon innovation networks to random shocks of varying intensities, comparing these results with the degree-based targeted shocks examined in the previous section. Figure 2 presents comprehensive insights into how both network layers respond to random failures across different shock ratios and their comparative resilience to targeted versus random disruptions.
Figure 2A illustrates the impact of random shocks originating in the LCCN at varying intensities (0.1% to 7.0% of nodes) on both network layers. The response curves reveal a clear threshold behavior in both networks. At low shock ratios (below 1%), minimal cascading effects are observed for either network. However, as the random shock ratio increases to 3.0%, both networks begin to show vulnerability, with the LCKN (orange line) showing a substantially steeper increase in its final cascade ratio compared to the LCCN (blue line). At the 7.0% random shock threshold, the LCKN reaches complete failure with a cascade ratio of 1.0, while the LCCN stabilizes at approximately 0.75. The horizontal dashed lines represent the cascade ratios achieved under highest-degree targeted shocks (approximately 0.64 for LCCN and 1.0 for LCKN), providing a benchmark for comparison. Notably, random failures affecting 7.0% of LCCN nodes produce cascade effects that exceed those from targeted highest-degree node shocks in the LCCN itself.
Figure 2B presents the complementary analysis when random shocks originate in the LCKN. The overall pattern exhibits similar threshold behavior, with little effects below 3% shock ratio and accelerated propagation beyond 3.0%. However, an important distinction emerges in the LCCN response curve (blue line), which shows near-zero impact until the 3.0% threshold before jumping dramatically to approximately 0.64 at the 7.0% shock level. This suggests that the collaboration network exhibits greater resilience to random shocks originating in the knowledge network until a critical threshold is reached. As in the previous scenario, the LCKN reaches complete failure at the 7.0% random shock level, reinforcing its position as the more vulnerable network layer regardless of where the initial disturbance originates.
The propagation dynamics in terms of speed are captured in Figure 2C, which focuses on how random shocks in the LCCN affect the average number of iterations required to reach the final cascade state measured in discrete time steps of the simulation process. Both networks display an inverse U-shaped relationship between shock ratio and propagation speed. This counter-intuitive U-shaped pattern reflects the underlying mechanics of cascading failure propagation: at low shock ratios (0.1–1.0%), the few initially failed nodes create limited cascade triggers, resulting in rapid convergence to a stable state with minimal overall impact. As shock ratios increase to moderate levels (3.0–5.0%), a critical mass of failed nodes creates extensive cascade chains that require more iterations to propagate through network dependencies, leading to slower convergence. However, at high shock ratios (7.0%), the massive initial failure creates such widespread system disruption that the remaining functional nodes quickly become overwhelmed, paradoxically accelerating the final collapse. The horizontal dashed lines represent the propagation speeds under highest-degree targeted shocks, providing an important reference point for comparison.
Figure 2D offers a direct comparison between highest-degree targeted shocks and random shocks affecting 5% of nodes in both networks. In the LCCN, degree-based shocks and random shocks produce nearly identical final cascade ratios (0.64 versus 0.52, respectively), suggesting that this network exhibits similar vulnerability to both shock strategies. In stark contrast, the LCKN shows a pronounced difference between degree-based and random shocks. While targeted highest-degree shocks lead to complete network failure (cascade ratio of 1.0), random shocks affecting 5% of nodes result in a significantly lower cascade ratio of approximately 0.66. This substantial difference indicates that the knowledge network is particularly vulnerable to strategic shocks targeting its most connected nodes, while demonstrating greater resilience to random failures.
These findings reveal important insights into the vulnerability profiles of the interdependent low-carbon innovation networks. The knowledge network consistently demonstrates higher susceptibility to cascading failures regardless of shock origin or type, confirming its critical position within the interdependent system. Both networks exhibit clear threshold behavior in response to random shocks, with little effects below 1% shock ratio and dramatically accelerated propagation beyond 3%. The comparative analysis between targeted and random shocks highlights that while the collaboration network shows similar vulnerability to both shock strategies, the knowledge network is significantly more vulnerable to targeted disruptions of its highest-degree nodes. This differential vulnerability may stem from the specific characteristics of low-carbon technologies, particularly technological path dependence and patent concentration patterns that create structural bottlenecks in the knowledge network. Indeed, the key knowledge areas we also identified in the analysis of Section 3.3 (H01L, H02J, G06F, and G01R) represent foundational technological paradigms where decades of cumulative innovation have created highly interconnected knowledge structures with limited alternative pathways [57]. The concentration of intellectual property around these core technologies creates patent thickets that amplify vulnerability propagation, as disruptions to any fundamental domain cascade through dependent technological areas more rapidly than through the more diversified collaboration network [58].

3.3. Critical Node Analysis Under Targeted Shocks

Next, this study examines the identification and impact assessment of critical nodes within both the LCCN and LCKN. By analyzing the cascade effects triggered by targeted shocks to specific nodes, we can identify the entities that pose the greatest systemic risk to the interdependent innovation networks. Figure 3 and Figure 4 provide complementary perspectives on these critical nodes, illustrating both their individual impact on system stability and their structural positions within the respective networks.
Figure 3 presents the final cascade ratios resulting from targeted shocks to specific critical nodes in both network layers. In Figure 3A, we observe that, among the top critical nodes in the LCCN, State Grid Corporation stands out as having the most significant impact, with a final cascade ratio of approximately 0.64. This substantially exceeds the impact of other entities, including Zhejiang University, Xi’an Jiao Tong University, Tsinghua University, Southeast University, Shanghai Jiao Tong University, North China Electric Power University, Huazhong University of Science and Technology, and China Electric Power Research Institute. This marked disparity suggests that State Grid Corporation occupies a uniquely influential position within the collaboration network, likely due to its extensive connections with multiple research institutions and industrial partners in the low-carbon innovation ecosystem. In fact, State Grid Corporation’s uniquely influential position stems from its dual role as both China’s policy-mandated monopoly electricity transmission operator and a technical coordination hub for low-carbon energy integration across multiple technological domains [59]. This institutional position creates extensive dependency relationships with research institutions, technology companies, and innovation projects throughout the low-carbon ecosystem, as the corporation serves as both a regulatory gatekeeper and a critical infrastructure provider for renewable energy deployment [60]. The combination of policy authority and technical centrality generates network dependencies that exceed those of purely academic or commercial entities.
Figure 3B reveals a strikingly different pattern in the LCKN, where multiple knowledge elements demonstrate the capacity to trigger complete system failure (cascade ratio of 1.0) when targeted. Specifically, H01L, H02J, G06F, and G01R all independently induce full cascade effects throughout the interdependent networks. These knowledge elements likely represent fundamental technological components or methodologies that are extensively utilized across various low-carbon innovations. Other knowledge elements demonstrate varying degrees of impact, with cascade ratios ranging from approximately 0 to 0.03. This heterogeneity in impact suggests a hierarchical structure of knowledge dependencies within the innovation ecosystem, with certain foundational technological components proving critical to overall system stability.
The structural context for these critical nodes is provided in Figure 4, which presents network visualizations of both the LCCN and LCKN.
Figure 4A displays the LCCN topology, revealing a dense, highly interconnected structure characteristic of collaborative research networks. The highlighted nodes, including State Grid Corporation, Tsinghua University, North China Electric Power University, Zhejiang University, and Xi’an Jiao Tong University, are positioned near the core of the network, confirming their central roles in facilitating collaboration across the low-carbon innovation ecosystem. State Grid Corporation’s prominent position within this central cluster aligns with its outsized impact on system stability as demonstrated in Figure 3A.
Figure 4B illustrates the LCKN structure, which exhibits a more centralized organization compared to the LCCN, with a dense core of highly connected knowledge elements. The labeled critical nodes (H02J, B01D, C02F, H01M, and G01R) are predominantly located within this central region, indicating their foundational role in the knowledge network. The visual proximity of these critical knowledge elements suggests significant interdependencies among these technological components, potentially explaining why disruptions to individual elements can trigger widespread cascading effects throughout the network, as observed in Figure 3B.
The complementary analysis of critical nodes through both their impact assessment (Figure 3) and structural positioning (Figure 4) reveals important insights into the vulnerability architecture of the interdependent low-carbon innovation networks. In the collaboration network, State Grid Corporation emerges as a singular point of vulnerability; its disruption could significantly impair collaborative innovation capacity. In contrast, the knowledge network exhibits multiple critical vulnerabilities, with several technological components capable of triggering complete system failure when compromised. This difference in vulnerability distribution between the two networks suggests that while the collaboration network’s resilience could be enhanced by reducing dependence on a single central entity, the knowledge network may require more diversified protection strategies addressing multiple critical technological components.

3.4. Layer Interaction and Cross-Network Propagation Assessment

This section examines the complex interactions between the LCCN and LCKN, focusing on how disruptions propagate across network boundaries and how the strength of interlayer dependencies influences system-wide vulnerability.
Figure 5A illustrates the evolutionary dynamics of cascade propagation when high-degree nodes in the LCCN experience targeted shocks. The dual-axis chart tracks the number of newly cascaded nodes in each iteration for both network layers. The LCCN (blue bars, left axis) exhibits a gradual increase in newly affected nodes, peaking at approximately 7000 nodes around iteration 10, followed by a steady decline as the cascade process approaches completion. In contrast, the LCKN (orange bars, right axis) shows an earlier peak in cascade activity around iterations 6–7, with approximately 140 newly affected nodes per iteration. This temporal asynchrony suggests that while the initial shock originates in the collaboration network, the knowledge network experiences accelerated failure propagation, reaching its maximum cascade velocity before the originating network does. Figure 5B presents the scenario when high-degree nodes in the LCKN are targeted. Here, we observe a more synchronized propagation pattern between the two networks. It can be noticed that the evolutionary dynamics of this scenario is similar to Figure 5A. That is, shocks to different layers of the network present similar shock paths in the interdependent network system.
To explore the relationship between the propagation dynamics of these two networks in more detail, Figure 5C plots the correlation coefficient between newly cascaded nodes in both networks is plotted against time lag (measured in iterations). The correlation reaches its maximum value of approximately 1.0 at a negative time lag of −1 or −2 iterations, indicating that peak cascade activity in the LCKN may precede peak activity in the LCCN by about one or two iterations. This finding formalizes the observation from Figure 5A,B that the knowledge network typically experiences accelerated failure propagation compared to the collaboration network. The overall trend of the correlation curves, with higher correlation values for negative time lags (LCKN leads) than for positive time lags (LCCN leads), suggests that disruptions propagate more efficiently from the knowledge network to the collaboration network than in the reverse direction.
Figure 5D maps the interlayer dependency relationships between the top 10 nodes (by degree) in each network, with color intensity representing dependency strength. Several critical dependency clusters emerge from this analysis. State Grid Corporation exhibits particularly strong dependencies with knowledge elements H02J, G06F, and G06Q, while Guangdong Power Grid Co. (Guangzhou, China) shows strong connections with H02J. Tsinghua University demonstrates significant dependencies with H02J and H01L, while Sinopec Corporation (Beijing, China) is strongly connected with B01D. These concentrated dependency relationships identify potential vulnerability pathways through which shocks can propagate between network layers. The heterogeneous distribution of dependency strengths, with certain entity–knowledge pairs exhibiting substantially stronger connections than others, suggests that cross-layer propagation is likely to follow preferential pathways rather than diffusing uniformly across all possible interlayer connections.
Figure 6 extends the analysis by examining how different interlayer dependence thresholds and shock intensities affect the final cascade ratios under different propagation scenarios, and it also serves as a robustness check for the model. The comprehensive parameter exploration across threshold values from 0.10 to 0.90 and shock intensities from 0.01 to 0.20 constitutes a systematic sensitivity analysis that reveals how system vulnerability responds to parameter variations. Four 3D surface plots illustrate the cascade results for all possible combinations of shock origin and destination networks.
The top-left panel (LCCN shock → LCCN cascade) shows that when shocks originate within the collaboration network, cascade ratios increase gradually with shock intensity but demonstrate low sensitivity to interlayer threshold variations across the entire 0.10–0.90 range. This suggests that internal propagation within the LCCN is primarily driven by intralayer connectivity rather than cross-network effects.
The top-right panel (LCCN shock → LCKN cascade) reveals a dramatically different pattern, with sharp transitions in cascade ratios as both parameters vary. The sensitivity analysis demonstrates critical threshold at approximately 0.30, where cascade ratios exhibit abrupt transitions from complete failure to partial failure states. At high shock intensities (>0.15) and low interlayer thresholds (<0.30), the knowledge network experiences complete failure (cascade ratio of 1.0). However, as the interlayer threshold increases, we observe abrupt drops in cascade ratios, creating a step-like surface. This indicates that the propagation from collaboration to knowledge networks is highly sensitive to the strength of interlayer coupling, with well-defined critical thresholds.
The bottom-left panel (LCKN shock → LCCN cascade) shows a more gradual response surface, with cascade ratios increasing steadily as shock intensity increases and interlayer threshold decreases. The sensitivity analysis reveals moderate threshold responsiveness, with smooth transitions rather than abrupt changes. The absence of sharp transitions suggests that when shocks originate in the knowledge network, their propagation to the collaboration network occurs through more distributed pathways, making the system less sensitive to specific threshold values.
The bottom-right panel (LCKN shock → LCKN cascade) demonstrates that when shocks originate within the knowledge network, the system exhibits extreme sensitivity to shock intensity but limited response to interlayer threshold variations. Even at low shock intensities, the knowledge network approaches complete failure (cascade ratio of 1.0) across most interlayer threshold values, indicating that internal propagation within the LCKN is primarily determined by its intrinsic vulnerability rather than cross-network interactions.

4. Discussion

4.1. Findings

This study investigated the propagation dynamics and vulnerability structures in interdependent low-carbon innovation networks by constructing and analyzing a two-layer system comprising an LCCN and an LCKN based on Chinese patent data. We applied shock propagation models to examine how disturbances spread within and between these networks under various shock scenarios, including degree-based targeted shocks, random shocks, and specific critical node shocks. Our analysis revealed several key findings with important theoretical and practical implications.
A striking discovery is the difference in vulnerability between the two network layers. Throughout all shock scenarios, the knowledge network consistently demonstrated greater susceptibility to cascading failures than the collaboration network, both in terms of propagation extent and speed. While the LCKN typically experienced complete system failure (cascade ratio of 1.0), the LCCN exhibited partial resilience, with cascade ratios stabilizing around 0.64 regardless of shock origin. This difference suggests that technological knowledge components in low-carbon innovation systems represent more critical and potentially fragile elements than collaborative relationships between institutions. This finding contributes to the growing literature on interdependent network resilience by demonstrating that different layers within innovation systems can exhibit fundamentally different vulnerability characteristics [26,
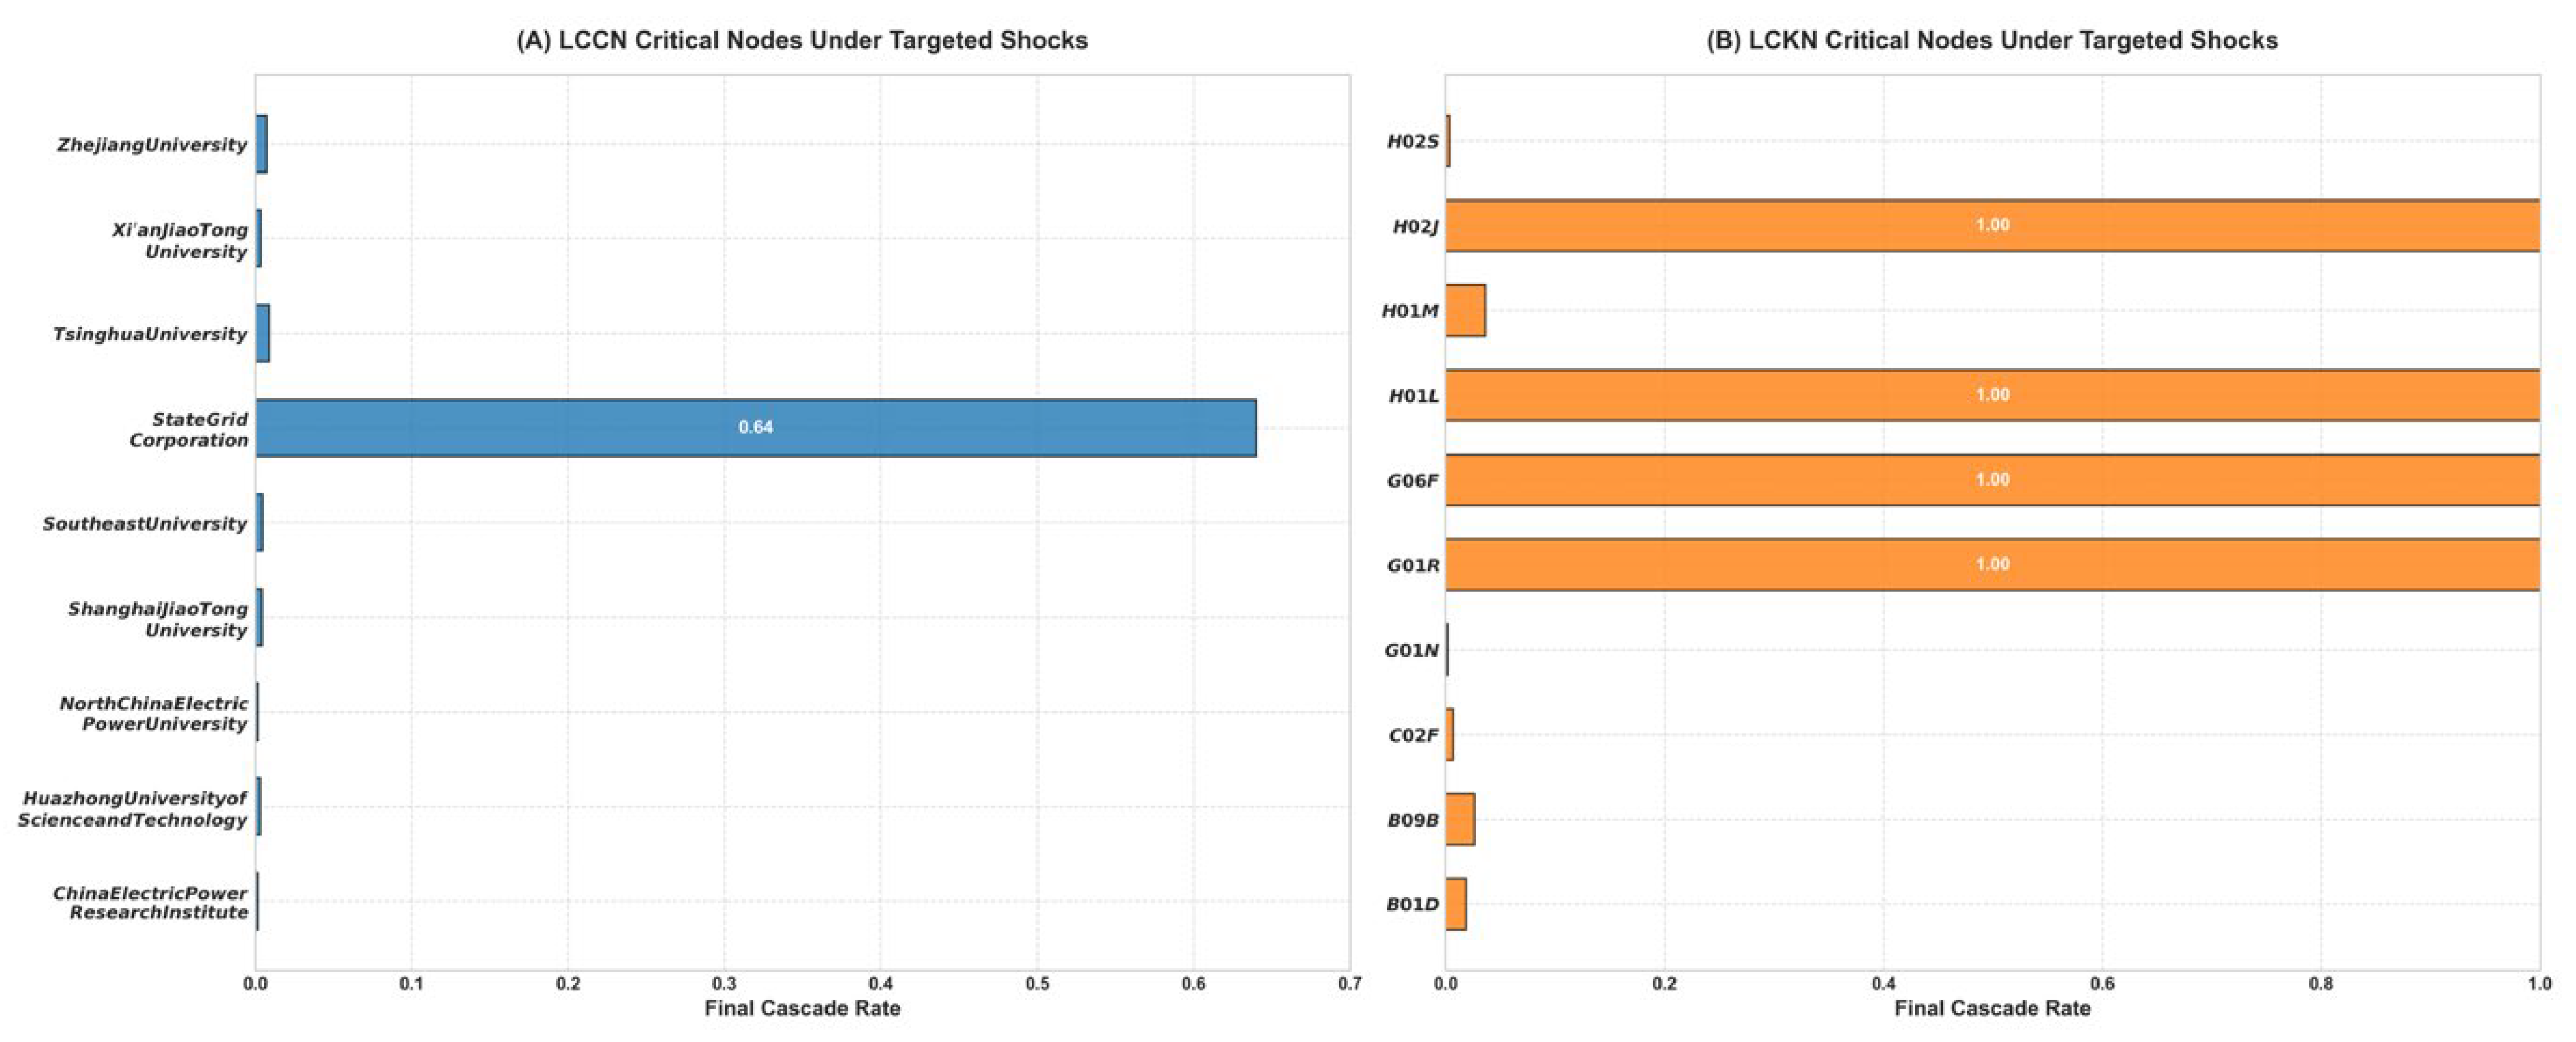
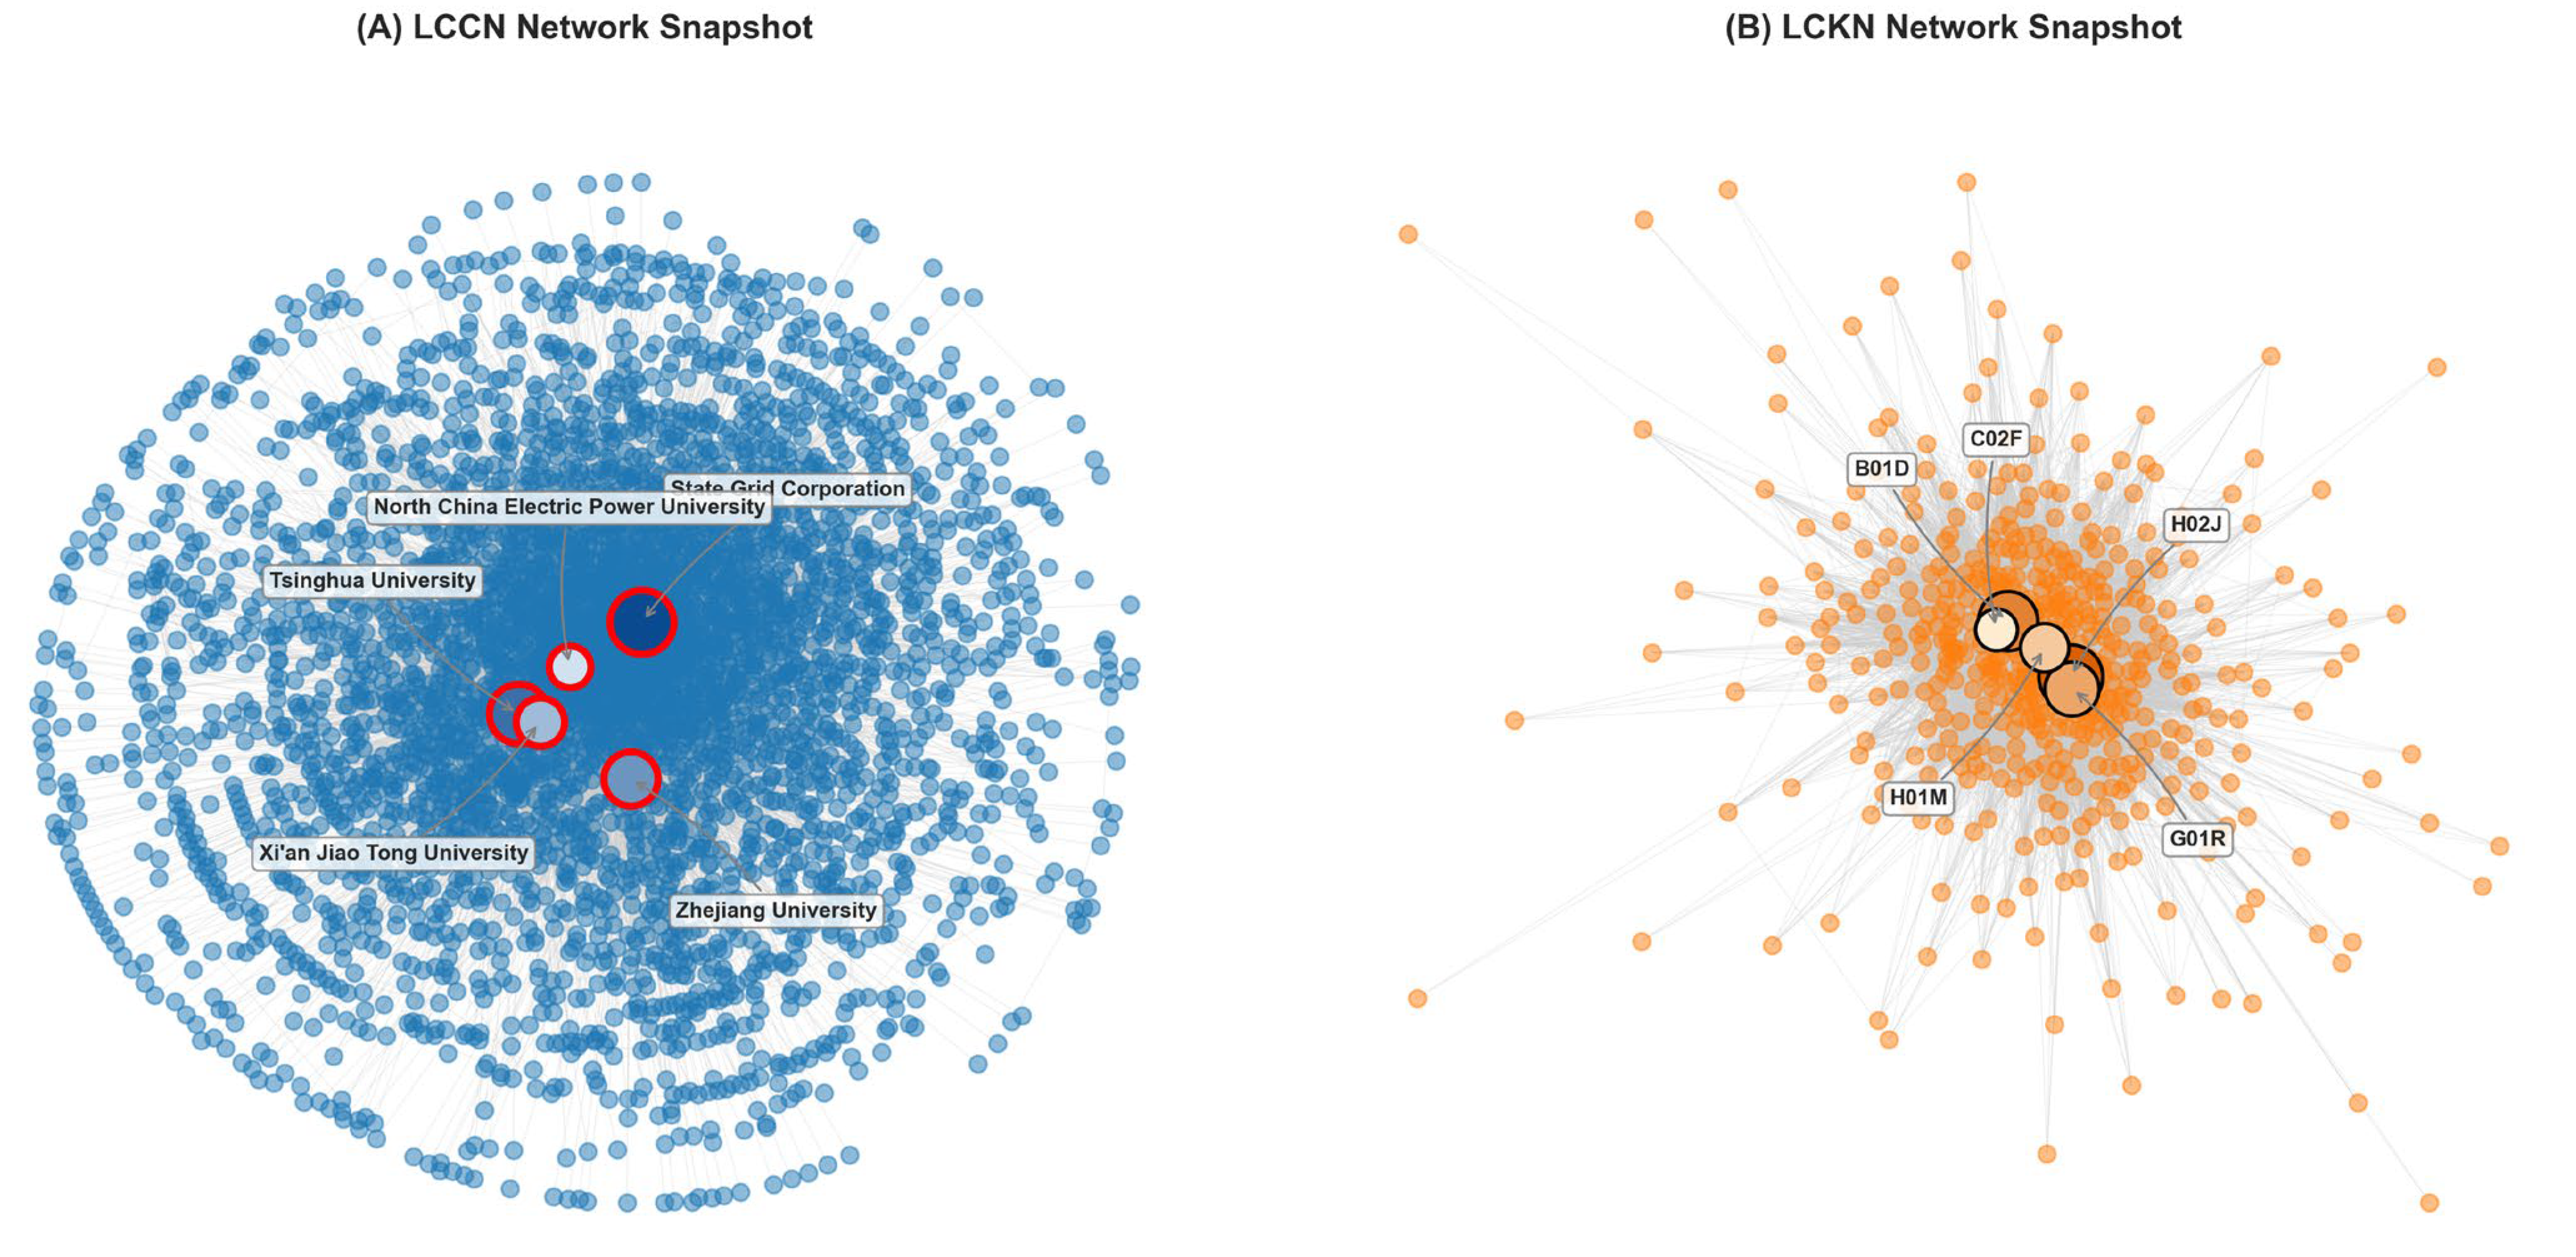
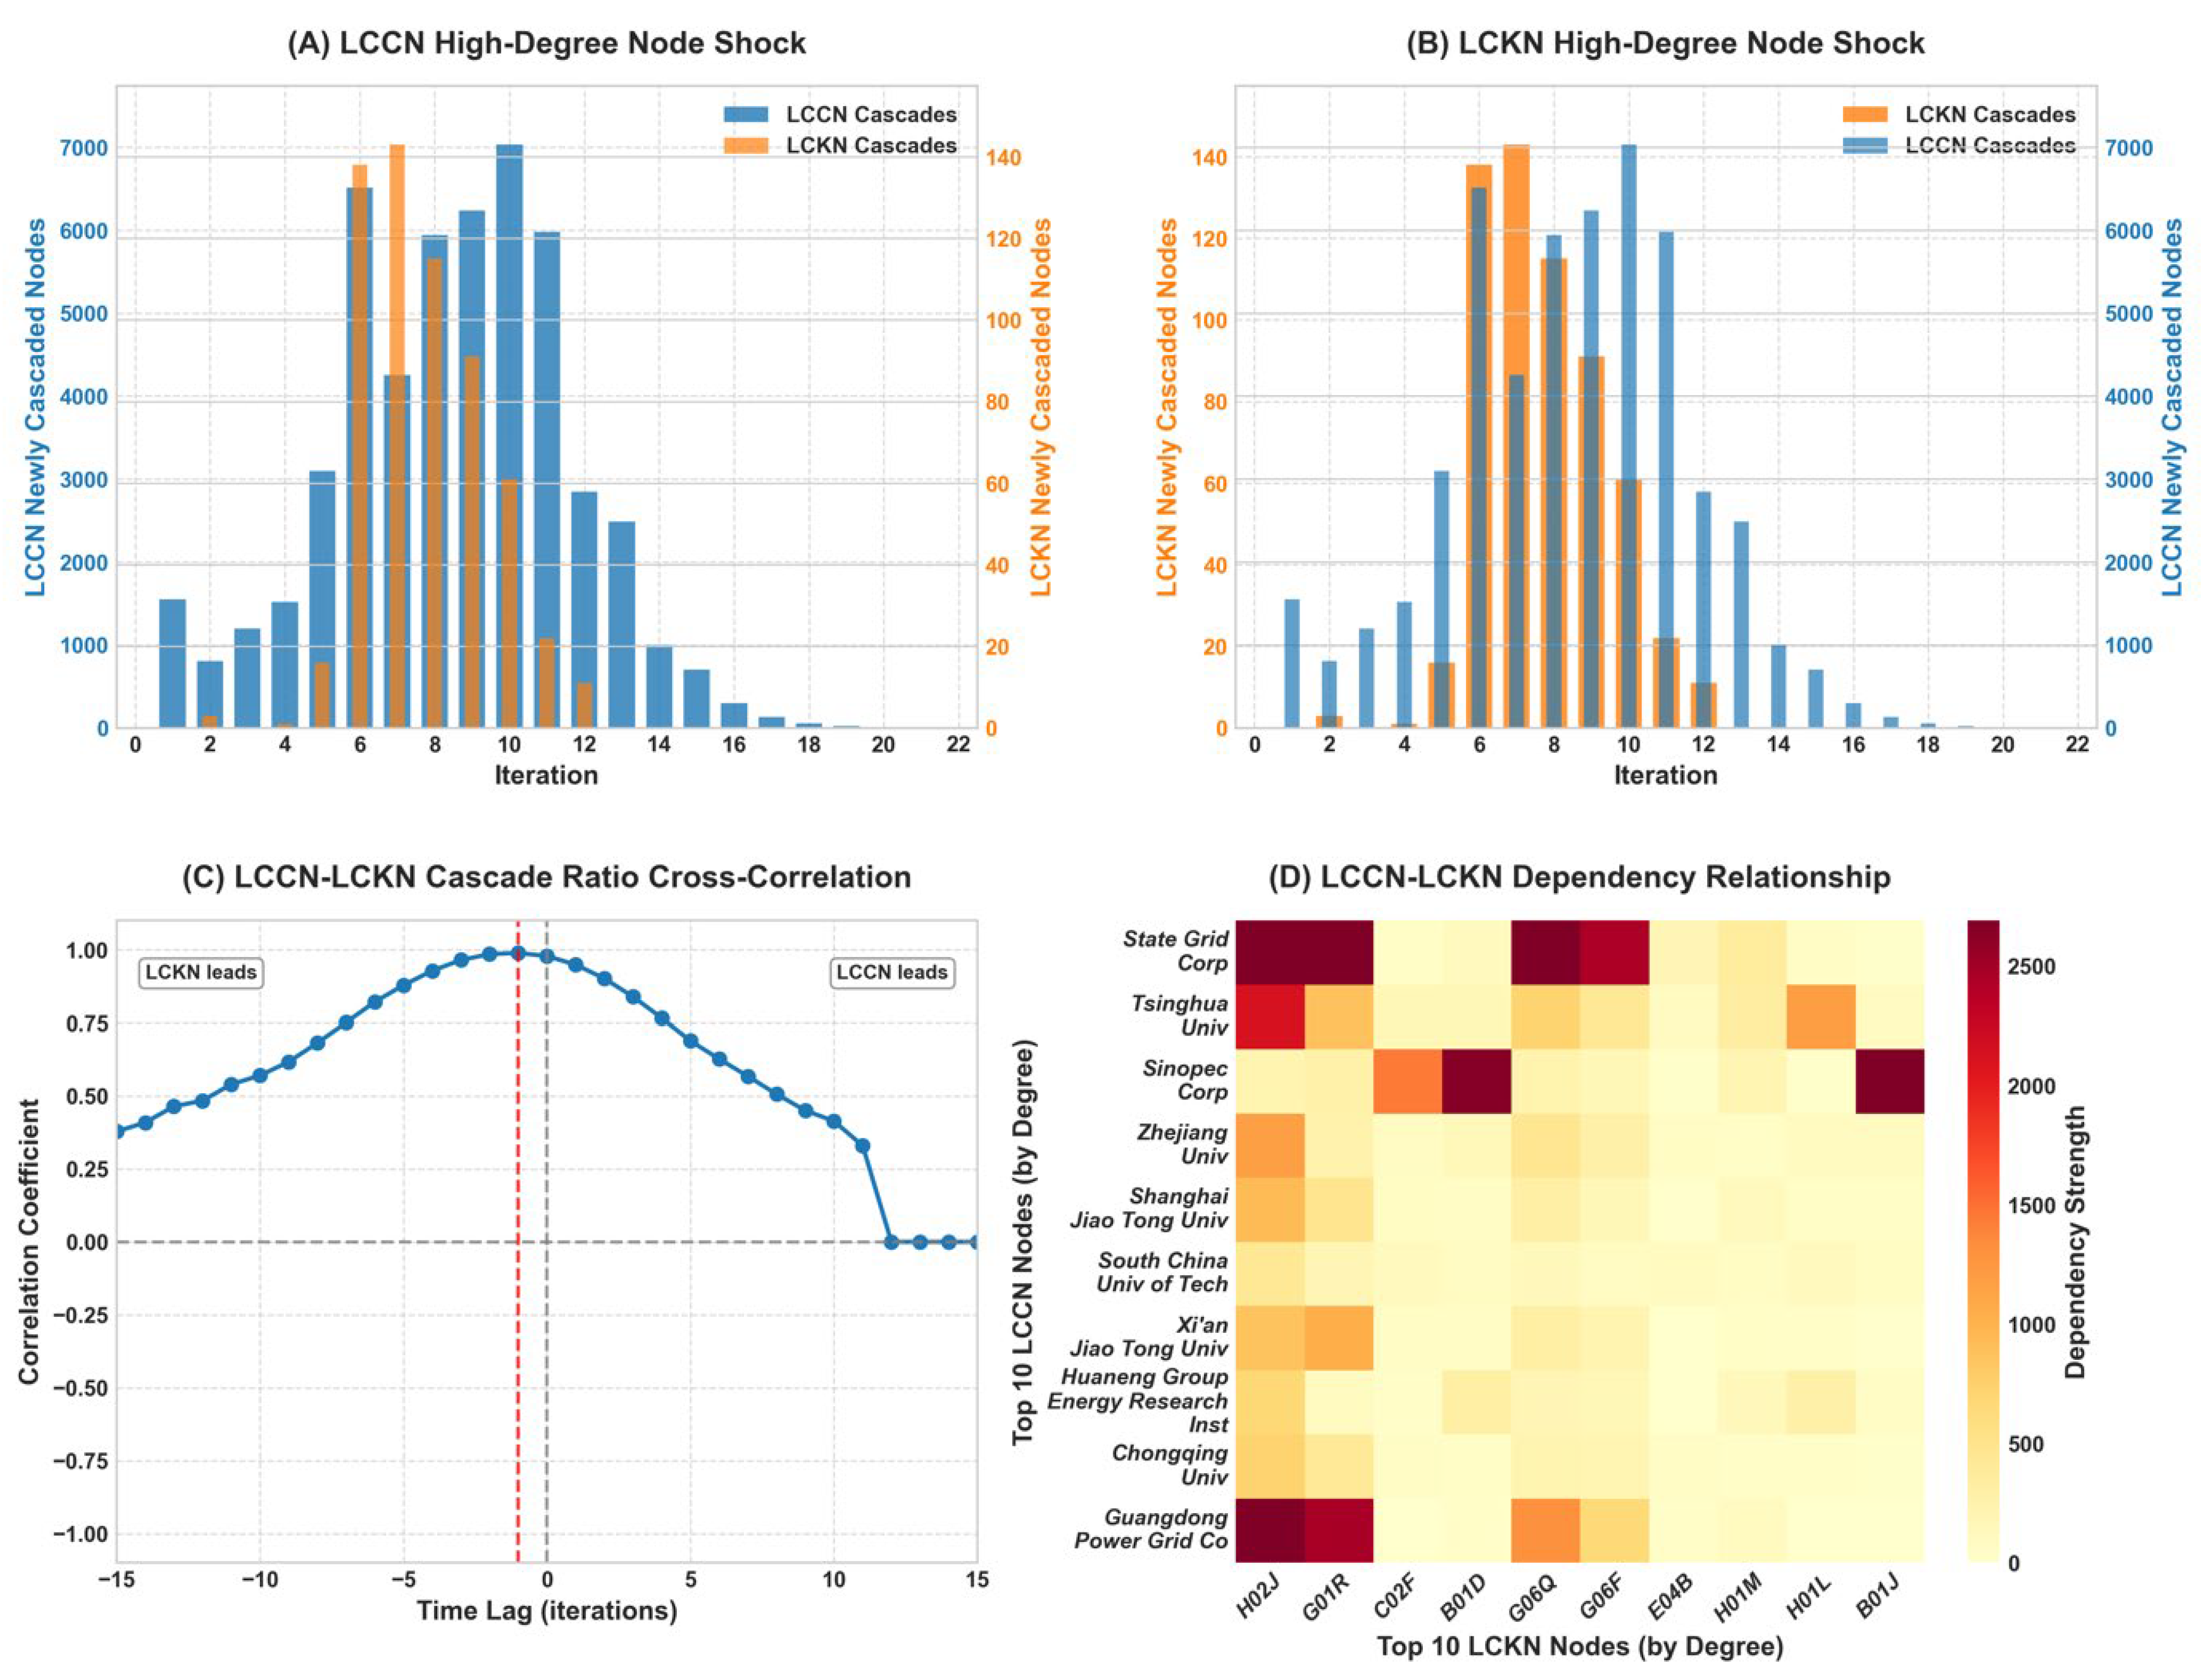
32]. While most existing studies focus on single-layer innovation networks, our results suggest that the multilayer approach reveals critical asymmetries in system robustness that would otherwise remain hidden. The analysis further revealed distinct critical node patterns: the LCCN featured a single critical vulnerability point (State Grid Corporation), whereas the LCKN contained multiple critical nodes (H02J, H01L, G06F, and G01R), each capable of independently triggering complete system failure.
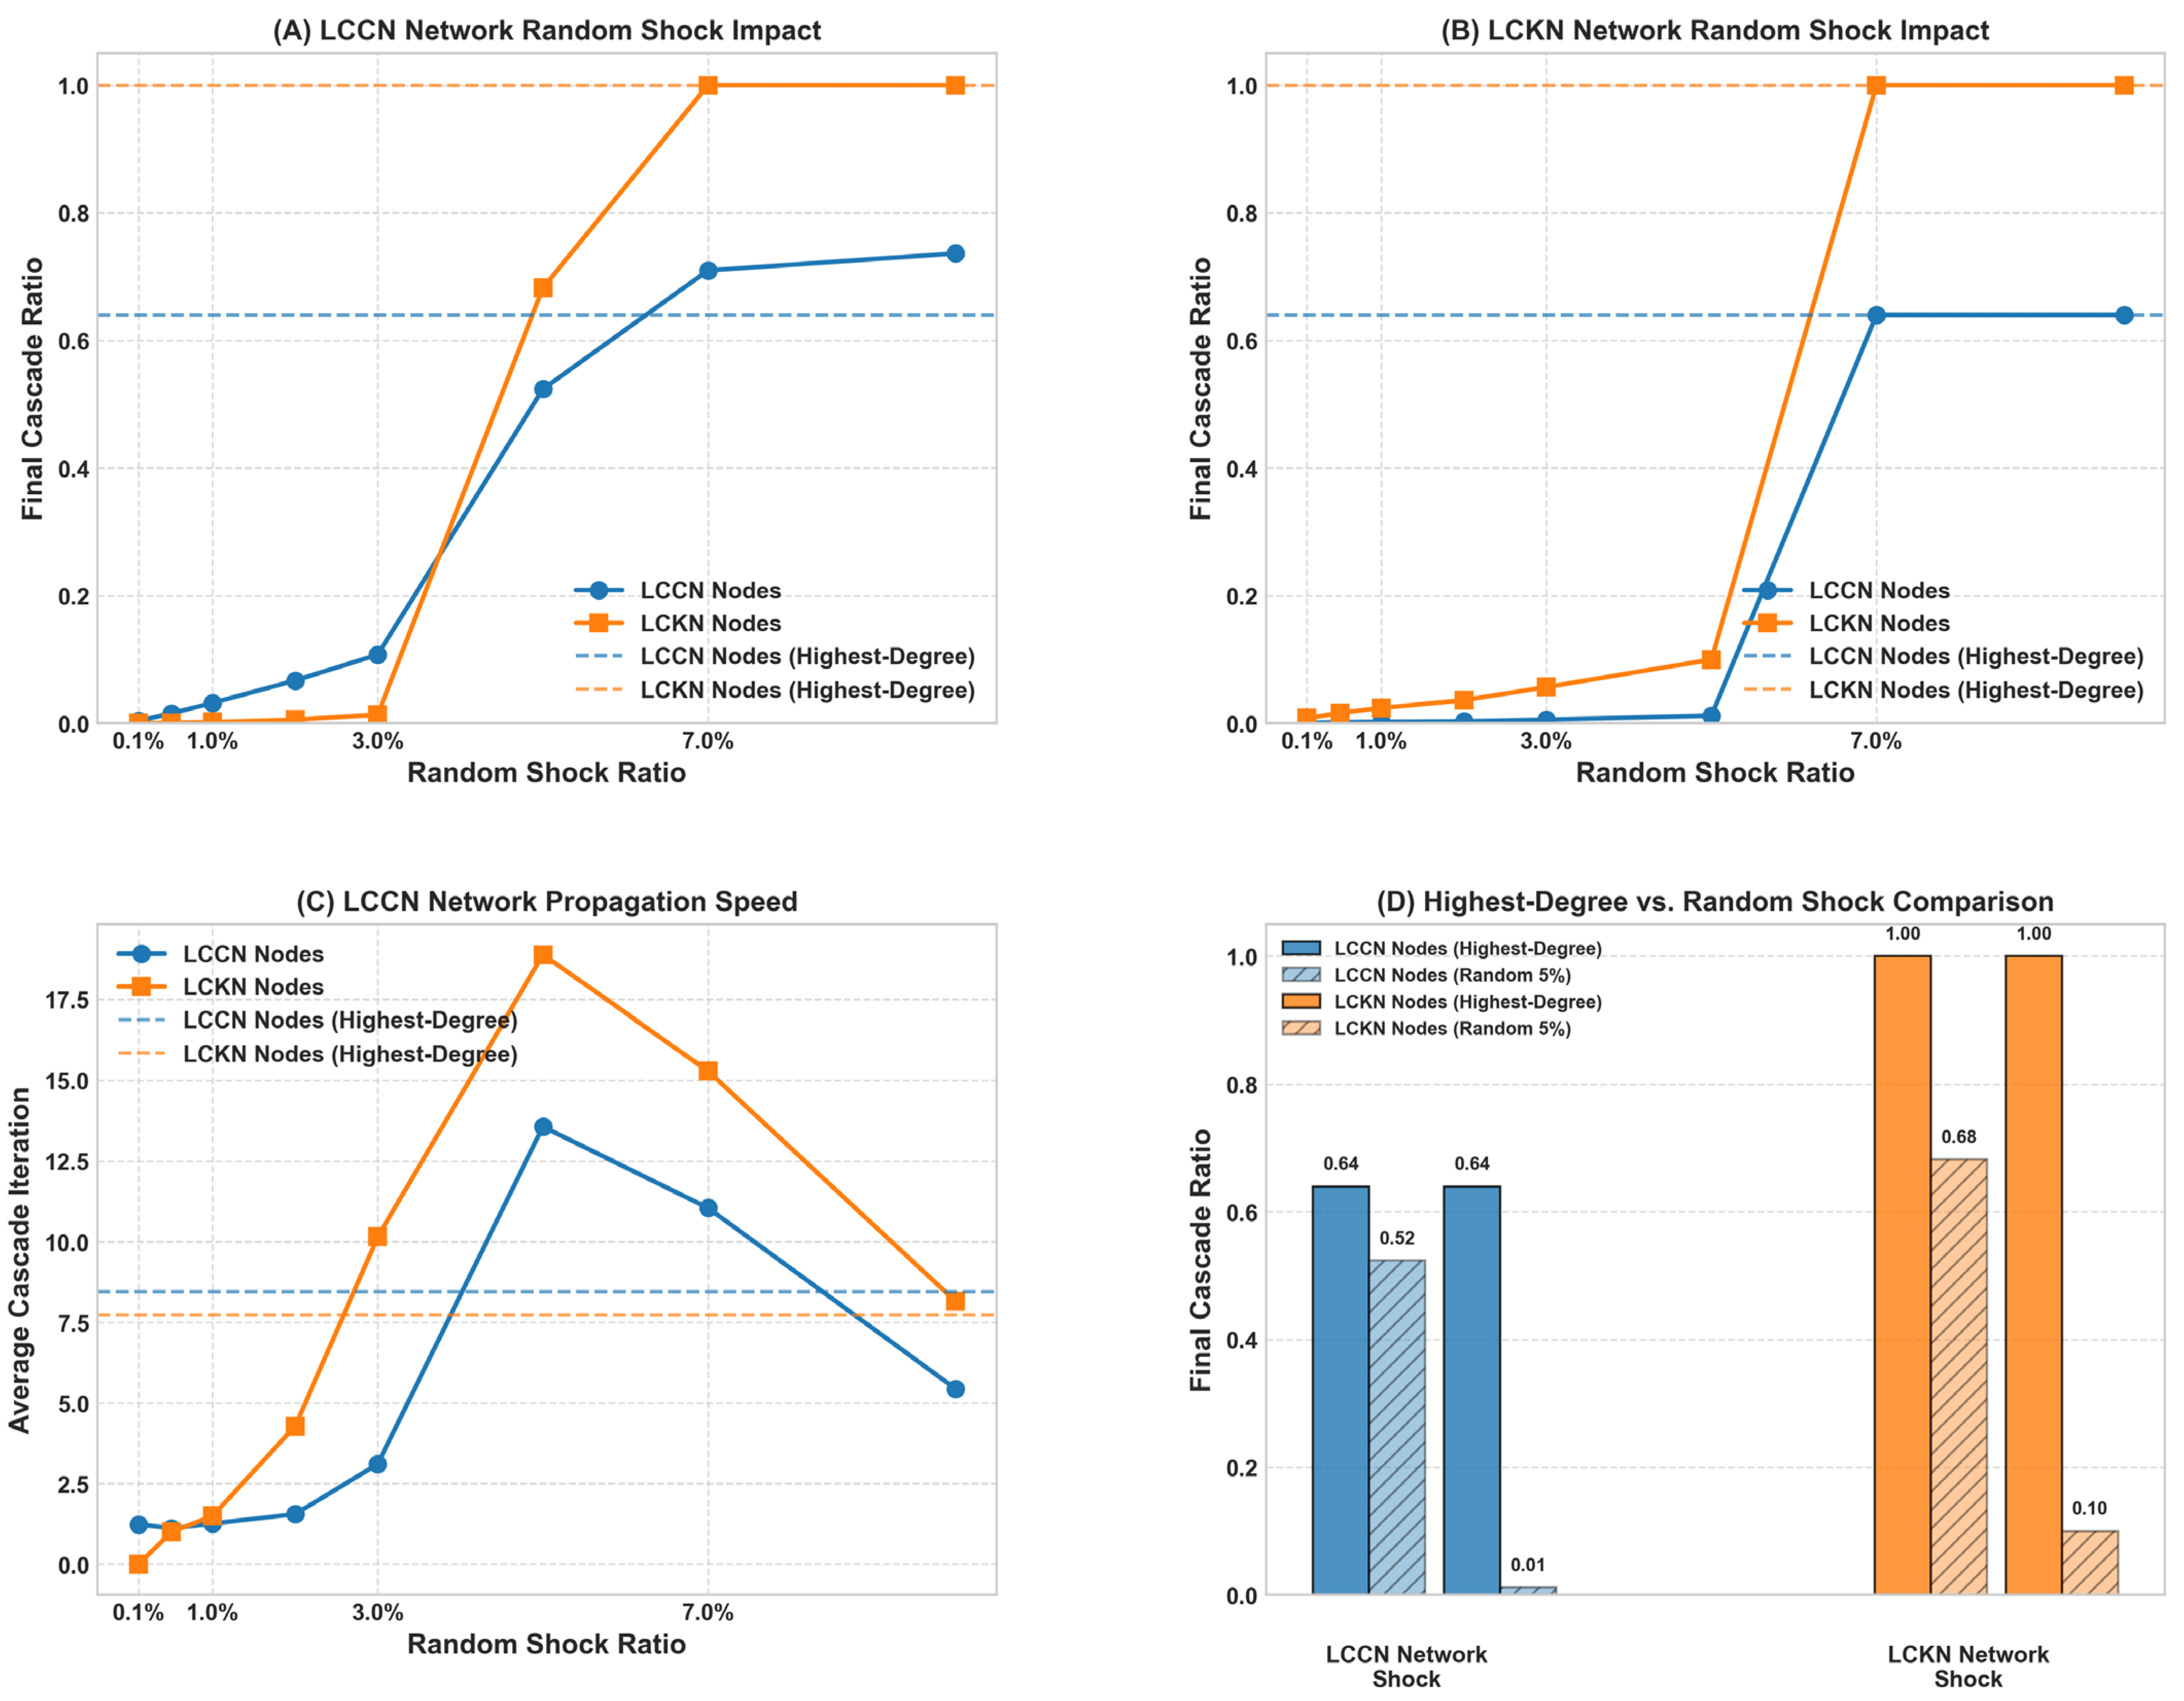
The comparison between targeted and random shocks revealed that while the collaboration network exhibited similar vulnerability to both strategies, the knowledge network was significantly more susceptible to strategic shocks targeting its highest-connected nodes. This differential response to shock strategies across network layers represents an important extension to previous research on network resilience, which has typically focused on single-layer networks [61]. Our findings suggest that protection strategies need to be tailored to the specific vulnerability profiles of each network layer within interdependent systems.
The identification of critical nodes through targeted shock analysis revealed distinct vulnerability architectures in each network layer. In the collaboration network, State Grid Corporation emerged as a singular point of vulnerability, with its disruption producing substantially greater systemic impact than any other entity. In contrast, the knowledge network exhibited multiple critical vulnerabilities, with several technological components (particularly H01L, H02J, G06F, and G01R) capable of triggering complete system failure. This difference in vulnerability distribution suggests that while the collaboration network’s resilience depends heavily on a single keystone organization, the knowledge network’s stability relies on multiple foundational technological components.
Our temporal analysis of cross-network propagation revealed that disruptions typically spread more rapidly through the knowledge network than through the collaboration network, with peak cascade activity in the LCKN consistently preceding peak activity in the LCCN. This temporal lead of knowledge-network failures, formalized through cross-correlation analysis, suggests that disruptions to technological knowledge components can serve as early warning indicators for subsequent failures in collaborative structures.
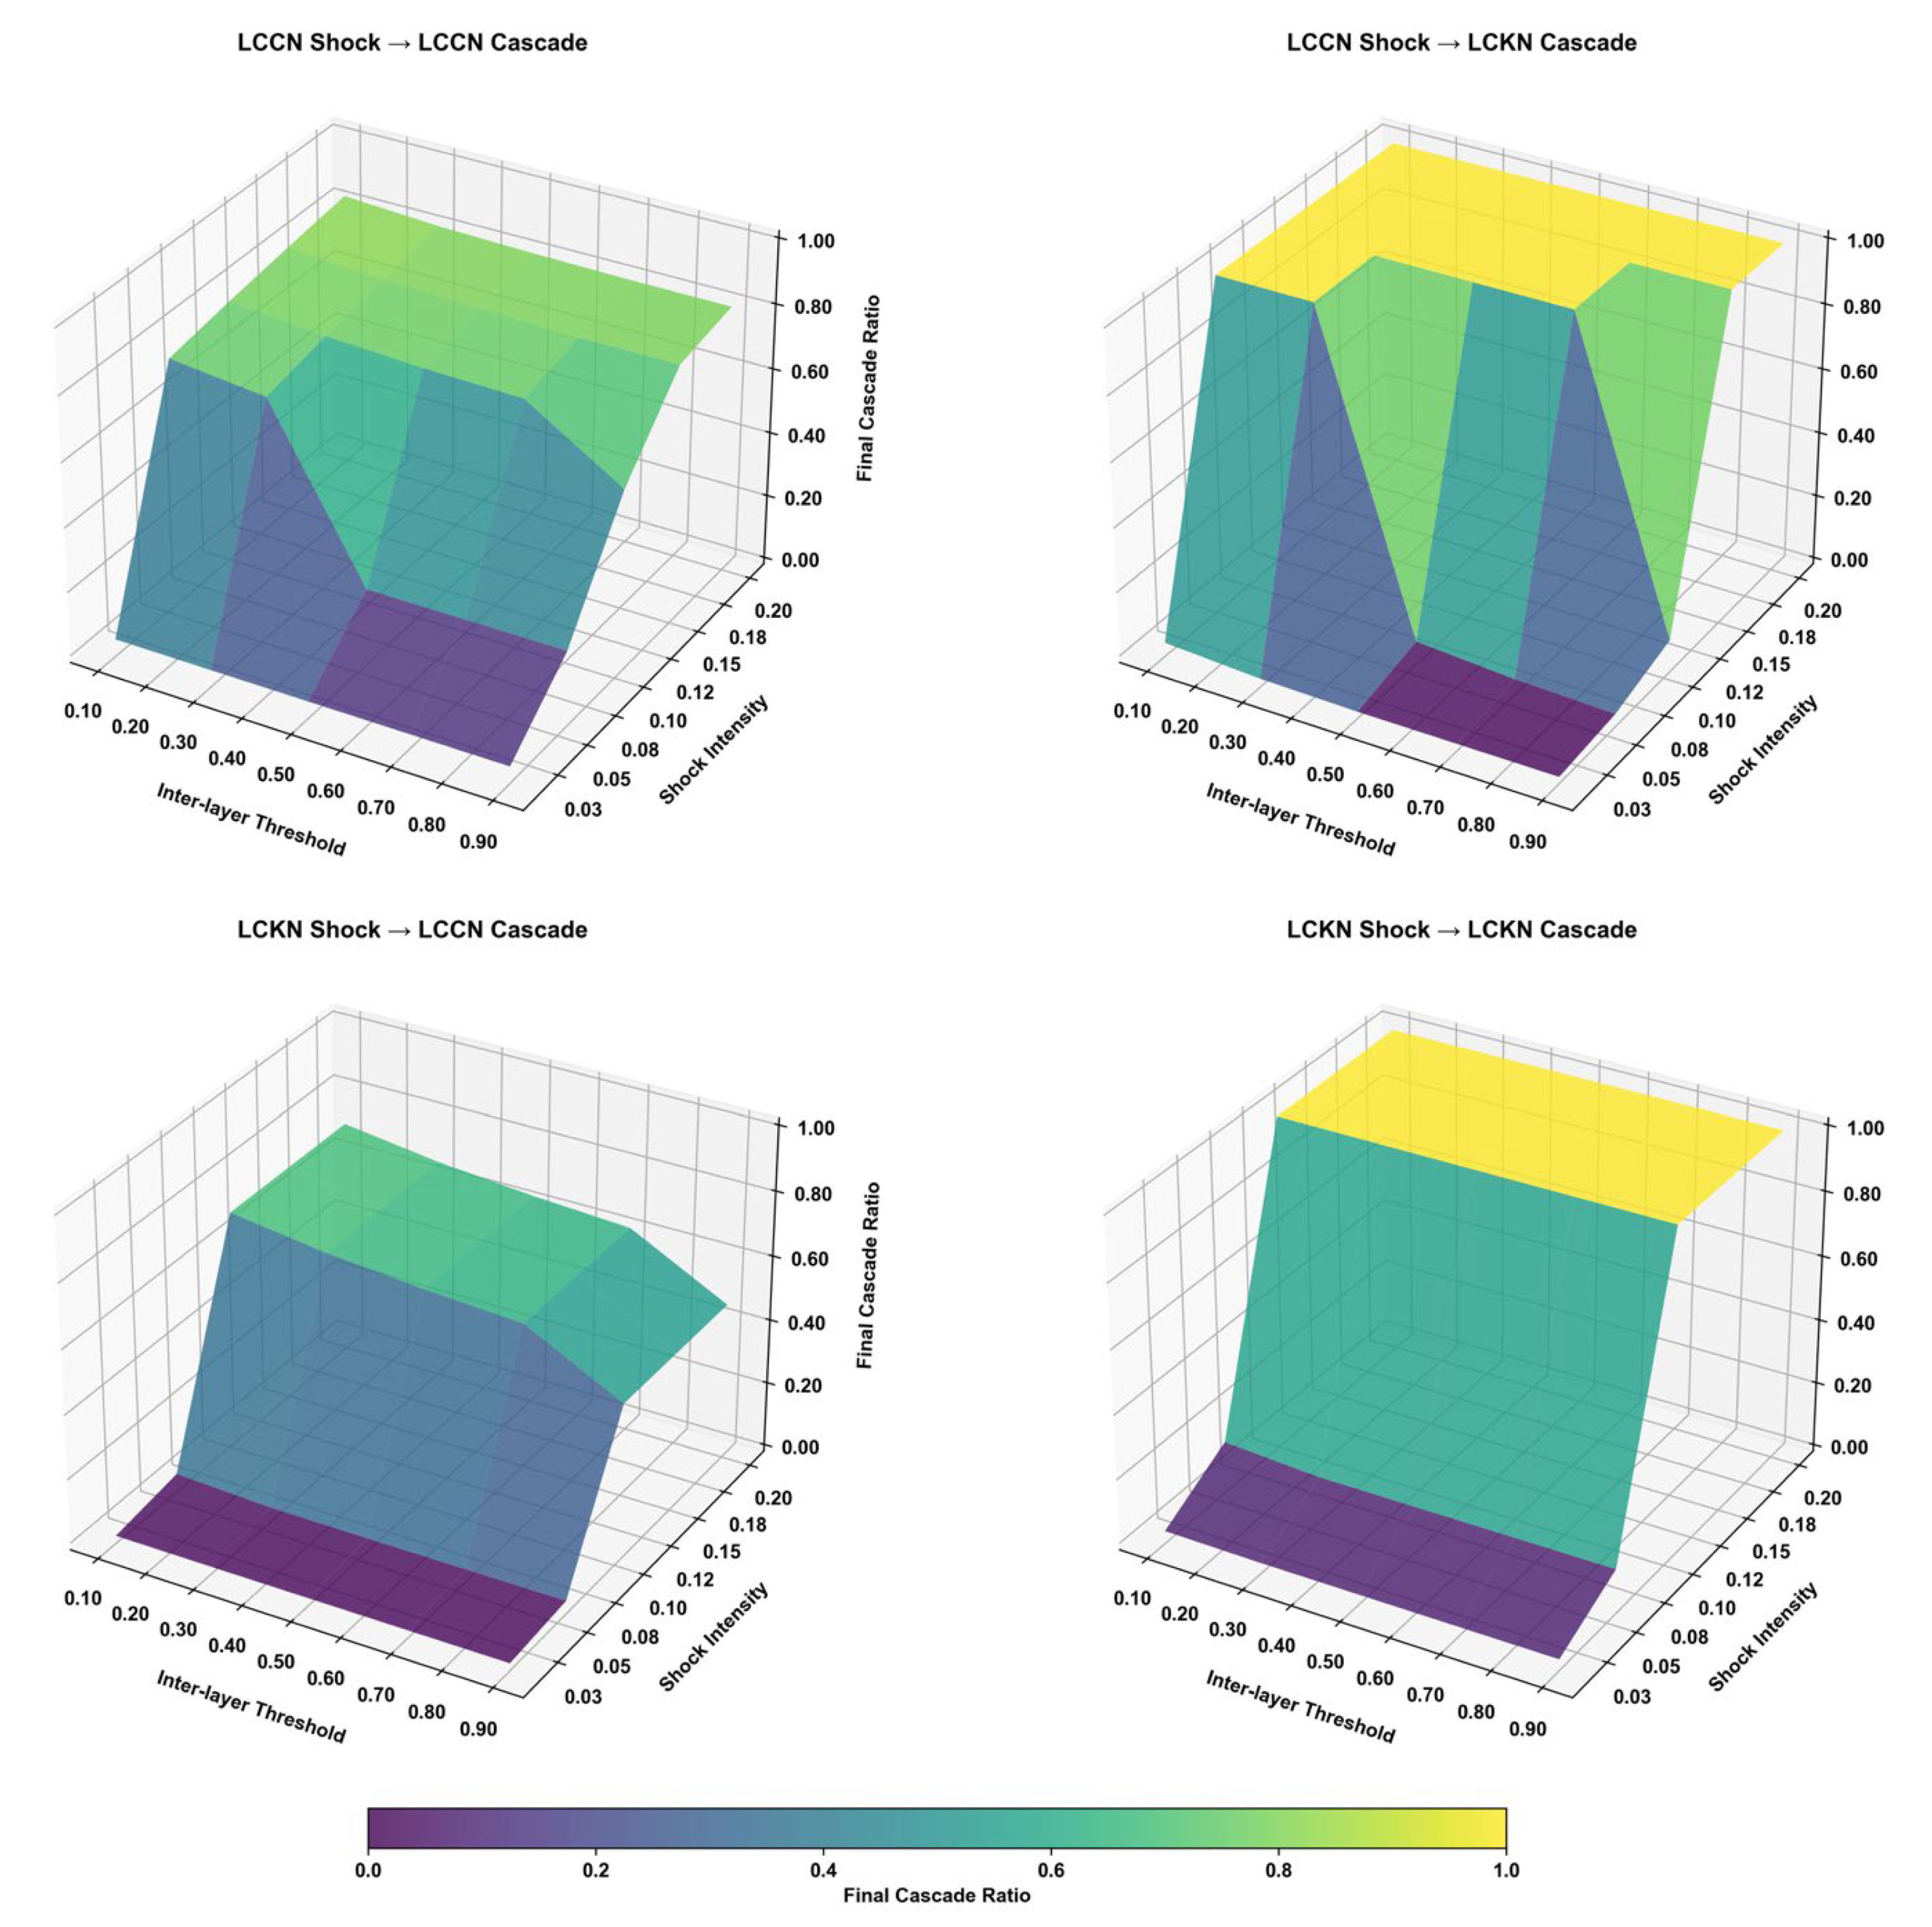
The analysis of interlayer dependency thresholds and shock intensities revealed that cross-network propagation between the LCCN and LCKN exhibits distinct regimes with different sensitivity patterns. Most notably, propagation from the collaboration network to the knowledge network showed sharp transitions at specific threshold values, while propagation in the reverse direction displayed more gradual responses. These findings suggest that the strength of coupling between network layers plays a crucial role in determining system-wide vulnerability, with certain critical thresholds marking transitions between stable and unstable regimes.

4.2. Theoretical Contributions

Our research makes several significant theoretical contributions. First, we extend the application of interdependent network theory [14,62] to innovation systems, demonstrating that the two-layer approach reveals vulnerability patterns invisible to traditional single-network analyses. Second, we contribute methodologically by developing shock propagation models specifically designed for innovation networks, building upon existing cascade models [49,50,61] while incorporating threshold-based activation and bidirectional feedback mechanisms unique to innovation contexts. Third, we provide evidence of asymmetric vulnerability patterns in innovation systems, where knowledge networks consistently show greater fragility than collaboration networks across multiple shock scenarios.

4.3. Policy Implications

From a practical perspective, our findings offer valuable guidance for enhancing the resilience of low-carbon innovation systems. The identification of critical knowledge vulnerabilities in semiconductor devices (H01L), electric power systems (H02J), digital data processing (G06F), and electric measurement technologies (G01R) suggests that policymakers should prioritize technological diversification in these domains. This includes funding parallel research tracks for critical technologies, establishing technology backup repositories, and creating distributed expertise development programs to prevent single points of failure in essential knowledge areas.
The identification of State Grid Corporation as a singular vulnerability point necessitates targeted risk mitigation measures. Policymakers should implement collaboration diversification requirements for critical infrastructure entities, establish maximum collaboration concentration thresholds, and create regulatory frameworks that prevent over-reliance on single organizations in innovation processes. Additionally, strategic resilience auditing programs should regularly assess keystone organizations and develop contingency plans for potential disruptions.
Our findings on cross-network propagation dynamics suggest that innovation policy should focus on optimizing coupling between collaborative and knowledge networks. This includes promoting modular innovation architectures that maintain functional connections while preventing cascade propagation, and establishing monitoring systems for critical technological knowledge components. The temporal lead of knowledge-network failures provides opportunities for early warning systems that can detect vulnerabilities before they trigger system-wide cascade effects.
For innovation management, our research highlights the importance of considering both collaborative relationships and knowledge interdependencies when assessing vulnerability in technological innovation systems. Traditional approaches focusing solely on organizational networks may underestimate systemic risk by failing to account for the potentially greater vulnerability of knowledge components. The observed asymmetry in propagation speeds further suggests that monitoring technological knowledge elements could provide early warning signals for potential disruptions to collaborative innovation capacity.

4.4. Limitations

This study has several limitations that suggest directions for future research. First, our analysis is based on patent data from China’s low-carbon innovation system, and the observed patterns may not generalize to other technological domains or national innovation systems [63]. Future studies could extend this approach to other contexts to assess the robustness of our findings. Second, our models treat all nodes within each network category as functionally equivalent, whereas real-world innovation systems likely exhibit heterogeneity in node functions and failure modes. More granular modeling approaches incorporating functional diversity could provide additional insights into systemic vulnerability. Third, while our shock propagation simulation captures dynamic cascading processes over time, the underlying network structure remains static throughout the analysis. Real innovation networks continuously evolve through the formation and dissolution of collaborative relationships and the emergence of new knowledge domains. Incorporating temporal network evolution—where network topology itself changes dynamically—into propagation models represents an important direction for future research that could reveal how network structural changes interact with failure propagation dynamics [62].

5. Conclusions

The global transition toward a low-carbon economy represents one of the most critical challenges of the 21st century, requiring unprecedented levels of innovation coordination across diverse technological domains and organizational entities. In the context of increasing geopolitical tensions and technological competition, understanding the vulnerability patterns of low-carbon innovation networks has become essential for ensuring the stability and continuity of sustainable technological development. The interdependent nature of modern innovation systems, where collaboration networks and knowledge networks are deeply interconnected, creates complex vulnerability patterns that traditional single-layer approaches cannot adequately capture.
This research addressed this critical knowledge gap through a comprehensive interdependent network analysis approach, employing a two-layer network model based on Chinese low-carbon patent data and dynamic shock propagation modeling to examine how disturbances cascade through interdependent innovation ecosystems. The methodological framework successfully integrated collaboration and knowledge network analysis while incorporating threshold-based activation mechanisms and bidirectional feedback effects to realistically simulate cascade dynamics across multiple shock scenarios.
The study’s empirical contributions demonstrate that interdependent low-carbon innovation networks exhibit previously unrecognized vulnerability patterns characterized by systematic asymmetries between network layers, distinct critical node architectures, and complex temporal propagation dynamics. These insights fundamentally challenge conventional approaches to innovation system analysis and reveal the limitations of single-layer vulnerability assessments. From a theoretical perspective, this research extends interdependent network theory to innovation systems while developing novel shock propagation models that capture the unique characteristics of socio-technical innovation networks.
The practical significance of these findings extends beyond academic understanding to provide actionable frameworks for enhancing innovation-system resilience. The identification of specific vulnerability patterns enables the development of targeted protection strategies, early warning systems, and policy interventions that can help ensure the continuity of low-carbon innovation efforts in an increasingly uncertain global environment. Ultimately, this research contributes to the broader goal of building more robust and adaptive innovation ecosystems capable of supporting sustainable technological transitions while maintaining resilience against external disruptions and systemic risks.

Author Contributions

Conceptualization, R.C. and R.F.; methodology, Y.Q.; software, Y.Q. and Y.W.; validation, R.C., Y.Q. and Y.W.; formal analysis, Y.Q.; investigation, Y.W.; writing—original draft preparation, Y.W.; writing—review and editing, R.F.; visualization, Y.W. All authors have read and agreed to the published version of the manuscript.

Funding

This research was funded by Project of the National Social Science Foundation of China (grant number no. 24VRC085) and Major Projects of the National Social Science Foundation of China (grant number no. 20&ZD155).

Data Availability Statement

Data will be made available upon request.

Conflicts of Interest

The authors declare no conflicts of interest.

Appendix A

Figure A1. Sensitivity analysis for threshold parameters α and β. Four 3D surface plots showing how variations in base threshold parameters affect final cascade ratios for different shock propagation scenarios: (A) PCN shock → PCN cascade; (B) PCN shock → KCN cascade; (C) KCN shock → PCN cascade; and (D) KCN shock → KCN cascade. The analysis validates the stability of our chosen parameter values (α = 0.2, β = 0.3) across the parameter space.
Systems 13 00599 g0a1
Table A1. Key IPC codes, along with corresponding technological areas.
IPC CodeTechnological Area
H02SGeneration of electric power by conversion of infra-red radiation, visible light, or ultraviolet light, e.g., using photovoltaic (PV) modules.
H02JCircuit arrangements or systems for supplying or distributing electric power; systems for storing electric energy; and general switching arrangements for electric power.
H01MMethods or devices for the direct conversion of chemical energy into electrical energy, e.g., accumulators, primary cells, and fuel cells.
H01LSemiconductor devices and electric solid-state devices not otherwise provided for.
G06FElectric digital data processing.
G01RMeasuring electric variables; measuring magnetic variables; measuring arrangements characterized by the use of electric or magnetic variables; and measuring arrangements for electric or magnetic variables.
G01NInvestigating or analyzing materials by determining their chemical or physical properties.
C02FTreatment of water, wastewater, sewage, or sludge.
B09BDisposal of solid waste; and disposal of hazardous or radioactive waste.
B01DSeparation processes or apparatus involving the use of physical or physicochemical operations.

Appendix B. Simulation Parameters

Core Simulation Settings
(1)
Maximum iterations per simulation: 50 propagation steps.
(2)
Convergence conditions: Simulation terminates when either (1) no new nodes enter cascade state in current iteration or (2) maximum iteration limit is reached.
(3)
Random seed: 42 (ensures reproducible results for stochastic components).
Parameter Exploration Ranges
(4)
Shock intensities: Varied from 0.1% to 7.0% of network nodes (random shocks).
(5)
Interlayer thresholds: Explored range from 0 to 0.90 (Figure 6 analysis).
(6)
Node selection methods: Highest-degree targeted, random selection, and specific critical nodes.
(7)
Shock origins: Both LCCN and LCKN networks examined.

Note

1
Available online: https://pat.daweisoft.com (accessed on 15 February 2025).

References

  1. Aleluia Reis, L.; Vrontisi, Z.; Verdolini, E.; Fragkiadakis, K.; Tavoni, M. A Research and Development Investment Strategy to Achieve the Paris Climate Agreement. Nat. Commun. 2023, 14, 3581. [Google Scholar] [CrossRef]
  2. Peñasco, C.; Anadón, L.D.; Verdolini, E. Systematic Review of the Outcomes and Trade-Offs of Ten Types of Decarbonization Policy Instruments. Nat. Clim. Change 2021, 11, 257–265. [Google Scholar] [CrossRef]
  3. Helveston, J.P.; He, G.; Davidson, M.R. Quantifying the Cost Savings of Global Solar Photovoltaic Supply Chains. Nature 2022, 612, 83–87. [Google Scholar] [CrossRef]
  4. Han, P.; Jiang, W.; Mei, D. Mapping U.S.–China Technology Decoupling: Policies, Innovation, and Firm Performance. Manag. Sci. 2024, 70, 8386–8413. [Google Scholar] [CrossRef]
  5. Liu, Q.; Chen, R.; Yu, Q. Improving Sustainable Performance of China’s New Energy Industry through Collaborative Innovation Network Resilience. Renew. Sustain. Energy Rev. 2024, 201, 114625. [Google Scholar] [CrossRef]
  6. Lin, X.; Zhang, P.; Yang, Z.; Chen, S. US Sanctions and Corporate Innovation: Evidence from Chinese Listed Firms. Int. Rev. Econ. Financ. 2025, 98, 103935. [Google Scholar] [CrossRef]
  7. Cui, L.; Jiang, Y. Quantitative Analysis of the U.S. Chip Embargo and China’s Export Controls on GaGe and Graphite. Comput. Ind. Eng. 2025, 200, 110860. [Google Scholar] [CrossRef]
  8. Liu, Q.; Chen, R.; Gao, Q.; Yue, W. Improving Sustainable Development Performance of New Energy Industry through Green Innovation Network Evolution Empowered by Digitalization: Based on Temporal Exponential Random Graph Model. Energy Convers. Manag. 2025, 324, 119253. [Google Scholar] [CrossRef]
  9. Fan, R.; Chen, R. Promotion Policies for Electric Vehicle Diffusion in China Considering Dynamic Consumer Preferences: A Network-Based Evolutionary Analysis. Int. J. Environ. Res. Public Health 2022, 19, 5290. [Google Scholar] [CrossRef]
  10. Kenett, D.Y.; Perc, M.; Boccaletti, S. Networks of Networks—An Introduction. Chaos Solitons Fractals 2015, 80, 1–6. [Google Scholar] [CrossRef]
  11. Brennecke, J.; Rank, O. The Firm’s Knowledge Network and the Transfer of Advice among Corporate Inventors—A Multilevel Network Study. Res. Policy 2017, 46, 768–783. [Google Scholar] [CrossRef]
  12. Berkes, F.; Colding, J.; Folke, C. Navigating Social-Ecological Systems: Building Resilience for Complexity and Change; Cambridge University Press: Cambridge, UK, 2008; ISBN 1-139-43479-9. [Google Scholar]
  13. Gao, J.; Barzel, B.; Barabási, A.-L. Universal Resilience Patterns in Complex Networks. Nature 2016, 530, 307–312. [Google Scholar] [CrossRef] [PubMed]
  14. Buldyrev, S.V.; Parshani, R.; Paul, G.; Stanley, H.E.; Havlin, S. Catastrophic Cascade of Failures in Interdependent Networks. Nature 2010, 464, 1025–1028. [Google Scholar] [CrossRef] [PubMed]
  15. Cheng, A.L.; Fuchs, E.R.H.; Karplus, V.J.; Michalek, J.J. Electric Vehicle Battery Chemistry Affects Supply Chain Disruption Vulnerabilities. Nat. Commun. 2024, 15, 2143. [Google Scholar] [CrossRef] [PubMed]
  16. Laber, M.; Klimek, P.; Bruckner, M.; Yang, L.; Thurner, S. Shock Propagation from the Russia–Ukraine Conflict on International Multilayer Food Production Network Determines Global Food Availability. Nat. Food 2023, 4, 508–517. [Google Scholar] [CrossRef]
  17. Li, J.; Liu, M.; Shan, Y.; Yang, J.; Fang, W.; Ma, Z.; Bi, J. Mapping the Water-Economic Cascading Risks within a Multilayer Network of Supply Chains in China. Environ. Sci. Technol. 2025, 59, 7960–7972. [Google Scholar] [CrossRef]
  18. Qu, S.; She, Y.; Zhou, Q.; Verschuur, J.; Zhao, L.-T.; Liu, H.; Xu, M.; Wei, Y.-M. Modeling the Dynamic Impacts of Maritime Network Blockage on Global Supply Chains. Innovation 2024, 5, 100653. [Google Scholar] [CrossRef]
  19. Chen, R.; Fan, R.; Wang, D.; Yao, Q. Effects of Multiple Incentives on Electric Vehicle Charging Infrastructure Deployment in China: An Evolutionary Analysis in Complex Network. Energy 2022, 264, 125747. [Google Scholar] [CrossRef]
  20. Wang, X.; Qiu, L.; Hu, F.; Hu, H. Characteristics and Influencing Factors of the Industry-University-Research Collaborative Innovation Network in China’s New Energy Vehicle Industry. Energy Strategy Rev. 2024, 55, 101505. [Google Scholar] [CrossRef]
  21. Hu, F.; Mou, S.; Wei, S.; Qiu, L.; Hu, H.; Zhou, H. Research on the Evolution of China’s Photovoltaic Technology Innovation Network from the Perspective of Patents. Energy Strategy Rev. 2024, 51, 101309. [Google Scholar] [CrossRef]
  22. Ding, J.; Du, D.; Duan, D.; Xia, Q.; Zhang, Q. A Network Analysis of Global Competition in Photovoltaic Technologies: Evidence from Patent Data. Appl. Energy 2024, 375, 124010. [Google Scholar] [CrossRef]
  23. Liu, H.; Yang, N.; Yang, Z.; Zhang, Y.; Li, R. Using Combined Network-Based Approaches to Analyze Risk Interactions in R&D Alliance. J. Oper. Res. Soc. 2021, 72, 2460–2471. [Google Scholar] [CrossRef]
  24. Su, R.; Chen, B.; Wang, S.; Duan, C. Energy Technical Resilience Assessment Based on Complex Network Analysis—A Case Study of China. Appl. Energy 2024, 364, 123231. [Google Scholar] [CrossRef]
  25. Huang, Y.; Yang, N.; Fawad Sharif, S.M.; Dong, C.; Wang, Y.; Yang, H. Why Established Collaborative Networks Fail to Drive Organizational Innovation Efficiency—From an Internal Knowledge Network Perspective. Eur. J. Innov. Manag. 2025. [Google Scholar] [CrossRef]
  26. Liu, H.; Yang, N.; Yang, Z.; Zhang, Y.; Lin, J. Modeling and Simulations of the Cascading Failure of Multiple Interdependent R&D Networks under Risk Propagation. Phys. Lett. A 2019, 383, 2443–2450. [Google Scholar] [CrossRef]
  27. Mao, C.; Yu, X.; Zhou, Q.; Harms, R.; Fang, G. Knowledge Growth in University-Industry Innovation Networks—Results from a Simulation Study. Technol. Forecast. Soc. Change 2020, 151, 119746. [Google Scholar] [CrossRef]
  28. Konno, T. Network Effect of Knowledge Spillover: Scale-Free Networks Stimulate R&D Activities and Accelerate Economic Growth. Phys. Stat. Mech. Its Appl. 2016, 458, 157–167. [Google Scholar] [CrossRef]
  29. Qian, Q.; Ren, J. Executive Myopia, Industry Partners, and Financial Performance: A Simulation Study Using Complex Network and Propagation Model. Environ. Dev. Sustain. 2024, 1–32. [Google Scholar] [CrossRef]
  30. Liu, H.; Su, B.; Guo, M.; Wang, J. Exploring R&D Network Resilience under Risk Propagation: An Organizational Learning Perspective. Int. J. Prod. Econ. 2024, 273, 109266. [Google Scholar] [CrossRef]
  31. Wang, J.; Yang, N.; Zhang, Y.; Song, Y. Modeling and Simulation of the Cascading Failure of R&D Network Considering the Community Structure. Phys. Stat. Mech. Its Appl. 2019, 522, 43–53. [Google Scholar] [CrossRef]
  32. Shi, X.; Wang, J.; Wang, Y. Research on Cascade Propagation of Collaborative Innovation Risks in Industrial Clusters Considering Entities Heterogeneity. Int. J. Comput. Intell. Syst. 2025, 18, 65. [Google Scholar] [CrossRef]
  33. Ouyang, X.; Liu, L.; Chen, W.; Wang, C.; Sun, X.; He, C.; Liu, G. Systematic Risks of the Global Lithium Supply Chain Network: From Static Topological Structures to Cascading Failure Dynamics. Environ. Sci. Technol. 2024, 58, 22135–22147. [Google Scholar] [CrossRef]
  34. Wang, J.; Tan, X.; Liu, D. Critical Risks in an Industry Chain-Based Global Lithium Supply Networks: Static Structure and Dynamic Propagation. Process Saf. Environ. Prot. 2025, 198, 107137. [Google Scholar] [CrossRef]
  35. Fioravanti, V.L.S.; Stocker, F.; Macau, F. Knowledge Transfer in Technological Innovation Clusters. Innov. Manag. Rev. 2023, 20, 43–59. [Google Scholar] [CrossRef]
  36. Jialu, S.; Zhiqiang, M.; Binxin, Z.; Haoyang, X.; Fredrick Oteng, A.; Hu, W. Collaborative Innovation Network, Knowledge Base, and Technological Innovation Performance-Thinking in Response to COVID-19. Front. Psychol. 2021, 12, 648276. [Google Scholar] [CrossRef]
  37. Cervantes, M.; Criscuolo, C.; Dechezleprêtre, A.; Pilat, D. Driving Low-Carbon Innovations for Climate Neutrality. In OECD Science Technology and Industry Policy Papers; No. 143; OECD: Paris, France, 2023; Available online: https://www.oecd.org/content/dam/oecd/en/publications/reports/2023/03/driving-low-carbon-innovations-for-climate-neutrality_4260ec80/8e6ae16b-en.pdf (accessed on 10 June 2025).
  38. China National Intellectual Property Administration. Report on Statistical Analysis of Green and Low-Carbon Patents; CNIPA: Beijing, China, 2024. [Google Scholar]
  39. Fan, R.; Chen, R.; Wang, Y.; Wang, D.; Chen, F. Simulating the Impact of Demand-Side Policies on Low-Carbon Technology Diffusion: A Demand-Supply Coevolutionary Model. J. Clean. Prod. 2022, 351, 131561. [Google Scholar] [CrossRef]
  40. León, L.R.; Bergquist, K.; Wunsch-Vincent, S.A.; Xu, N.; Fushim, K. Measuring Innovation in Energy Technologies: Green Patents as Captured by WIPO’s IPC Green Inventory; SSRN: Rochester, NY, USA, 2023. [Google Scholar]
  41. Meng, C.; Lin, Y. The Impact of Supply Chain Digitization on the Carbon Emissions of Listed Companies—A Quasi-Natural Experiment in China. Struct. Change Econ. Dyn. 2025, 73, 392–406. [Google Scholar] [CrossRef]
  42. Ma, J.; Li, Q.; Zhao, Q.; Liou, J.; Li, C. From Bytes to Green: The Impact of Supply Chain Digitization on Corporate Green Innovation. Energy Econ. 2024, 139, 107942. [Google Scholar] [CrossRef]
  43. Barbosa, S.; Sáiz, P.; Zofío, J.L. The Emergence and Historical Evolution of Innovation Networks: On the Factors Promoting and Hampering Patent Collaboration in Technological Lagging Economies. Res. Policy 2024, 53, 104990. [Google Scholar] [CrossRef]
  44. Wang, C.; Rodan, S.; Fruin, M.; Xu, X. Knowledge Networks, Collaboration Networks, and Exploratory Innovation. Acad. Manag. J. 2014, 57, 484–514. [Google Scholar] [CrossRef]
  45. Ba, Z.; Mao, J.; Ma, Y.; Liang, Z. Exploring the Effect of City-Level Collaboration and Knowledge Networks on Innovation: Evidence from Energy Conservation Field. J. Informetr. 2021, 15, 101198. [Google Scholar] [CrossRef]
  46. Carvalho, V.M.; Nirei, M.; Saito, Y.U.; Tahbaz-Salehi, A. Supply Chain Disruptions: Evidence from the Great East Japan Earthquake. Q. J. Econ. 2021, 136, 1255–1321. [Google Scholar] [CrossRef]
  47. Acemoglu, D.; Ozdaglar, A.; Tahbaz-Salehi, A. Systemic Risk and Stability in Financial Networks. Am. Econ. Rev. 2015, 105, 564–608. [Google Scholar] [CrossRef]
  48. Liu, X.; Li, D.; Ma, M.; Szymanski, B.K.; Stanley, H.E.; Gao, J. Network Resilience. Phys. Rep. 2022, 971, 1–108. [Google Scholar] [CrossRef]
  49. Zhao, J.; Wei, J.; Yu, L.; Xi, X. Robustness of Knowledge Networks under Targeted Attacks: Electric Vehicle Field of China Evidence. Struct. Change Econ. Dyn. 2022, 63, 367–382. [Google Scholar] [CrossRef]
  50. Zhao, J.; Bai, A.; Xi, X.; Huang, Y.; Wang, S. Impacts of Malicious Attacks on Robustness of Knowledge Networks: A Multi-Agent-Based Simulation. J. Knowl. Manag. 2020, 24, 1079–1106. [Google Scholar] [CrossRef]
  51. Centola, D.; Eguíluz, V.M.; Macy, M.W. Cascade Dynamics of Complex Propagation. Phys. Stat. Mech. Its Appl. 2007, 374, 449–456. [Google Scholar] [CrossRef]
  52. Feng, Z.; Cai, H.; Chen, Z.; Zhou, W. Influence of an Interurban Innovation Network on the Innovation Capacity of China: A Multiplex Network Perspective. Technol. Forecast. Soc. Change 2022, 180, 121651. [Google Scholar] [CrossRef]
  53. Xie, X.; Zhu, Q. Exploring an Innovative Pivot: How Green Training Can Spur Corporate Sustainability Performance. Bus. Strategy Environ. 2020, 29, 2432–2449. [Google Scholar] [CrossRef]
  54. North, D.C. Institutions, Institutional Change and Economic Performance; Cambridge University Press: Cambridge, UK, 1990. [Google Scholar]
  55. Meyer, J.W.; Rowan, B. Institutionalized Organizations: Formal Structure as Myth and Ceremony. Am. J. Sociol. 1977, 83, 340–363. [Google Scholar] [CrossRef]
  56. Watts, D.J. A Simple Model of Global Cascades on Random Networks. Proc. Natl. Acad. Sci. USA 2002, 99, 5766–5771. [Google Scholar] [CrossRef] [PubMed]
  57. Thrane, S.; Blaabjerg, S.; Møller, R.H. Innovative Path Dependence: Making Sense of Product and Service Innovation in Path Dependent Innovation Processes. Res. Policy 2010, 39, 932–944. [Google Scholar] [CrossRef]
  58. Jiang, L.; Zou, F.; Qiao, Y.; Huang, Y. Patent Analysis for Generating the Technology Landscape and Competition Situation of Renewable Energy. J. Clean. Prod. 2022, 378, 134264. [Google Scholar] [CrossRef]
  59. Pan, E.; Liu, S.; Liu, J.; Qi, Q.; Guo, Z. The State Grid Corporation of China’s Practice and Outlook for Promoting New Energy Development. Energy Convers. Econ. 2020, 1, 71–80. [Google Scholar] [CrossRef]
  60. Rikap, C. Becoming an Intellectual Monopoly by Relying on the National Innovation System: The State Grid Corporation of China’s Experience. Res. Policy 2022, 51, 104472. [Google Scholar] [CrossRef]
  61. Ma, T.; Hong, W.; Cao, Z.; Zhang, L.; Yang, X. Connection Patterns and Resilience Simulation of Innovation Network in the Context of Technology Transfer: A Case Study of Strategic Emerging Industries in the Guangdong-Hong Kong-Macao Greater Bay Area. Sustain. Cities Soc. 2024, 106, 105396. [Google Scholar] [CrossRef]
  62. Boccaletti, S.; Bianconi, G.; Criado, R.; Del Genio, C.I.; Gómez-Gardenes, J.; Romance, M.; Sendina-Nadal, I.; Wang, Z.; Zanin, M. The Structure and Dynamics of Multilayer Networks. Phys. Rep. 2014, 544, 1–122. [Google Scholar] [CrossRef]
  63. Li, Q.; Du, D.; Yu, Y. Scaling and Network Evolution of Technology Transfer in US Cities. Nat. Cities 2025, 2, 316–326. [Google Scholar] [CrossRef]
Figure 1. Risk propagation dynamics under degree-based shocks. (A) Evolution of cascade ratios of two-layer networks with iterations under LCCN degree-based shocks. (B) Evolution of cascade rate of two-layer networks with iterations under LCKN degree-based shocks. (C) Final cascade ratios for two-layer networks under degree-based shocks. (D) Propagation speed for different degree-based shocks.
Systems 13 00599 g001
Figure 2. Propagation dynamics under random shocks. (A) Effect of different LCCN random shocks on two-layer networks. (B) Effect of different LCKN random shock rates on two-layer networks. (C) Effect of different LCCN random shock ratios on the propagation speed of a two-layer network. Propagation speed is measured in average cascade iterations (discrete simulation time steps) required to reach the final cascade state. (D) Comparison of degree-based and random shocks.
Systems 13 00599 g002
Figure 3. The final cascade rate of shocks on different critical nodes of the interdependent network.
Systems 13 00599 g003
Figure 4. Snapshots of the network structure of (A) LCCN and (B) LCKN.
Systems 13 00599 g004
Figure 5. Interaction and correlation of propagation dynamics in interdependent networks. (A,B) Evolutionary dynamics of the highest-degree node shocks to the LCCN and LCKN. (C) Cross-correlation coefficient of the number of newly cascaded nodes at each iteration between the two network layers under shock conditions. (D) Strength of interlayer dependency of key nodes in the constructed interdependent networks (color scale represents dependency strength: dark red = highest dependency, yellow = moderate dependency, and light colors = low dependency).
Systems 13 00599 g005
Figure 6. Effect of different interlayer thresholds with different random shock intensities on the final cascade ratios: Top left panel: LCCN shock → LCCN cascade; Top right panel: LCCN shock → LCKN cascade; Bottom left panel: LCKN shock → LCCN cascade; Bottom right panel: LCKN shock → LCKN cascade. Axes represent shock intensity (0.03–0.20, proportion of initially failed nodes), interlayer threshold (0.10–0.90, dependency strength parameter), and final cascade ratio (0–1, proportion of ultimately failed nodes).
Systems 13 00599 g006
Disclaimer/Publisher’s Note: The statements, opinions and data contained in all publications are solely those of the individual author(s) and contributor(s) and not of MDPI and/or the editor(s). MDPI and/or the editor(s) disclaim responsibility for any injury to people or property resulting from any ideas, methods, instructions or products referred to in the content.

