Article

Developing a Dynamic Simulation Model for Point-of-Care Ultrasound Assessment and Learning Curve Analysis

by
Sandra Usaquén-Perilla
1,2,*,
Laura Valentina Bocanegra-Villegas
3 and
Jose Isidro García-Melo
1
1
Faculty of Engineering, Universidad del Valle, Cali 760042, Colombia
2
Biomedical Engineering Program, Universidad Militar Nueva Granada, Cajicá 250747, Colombia
3
Industrial Engineering Department, National Technological Institute of Mexico TecNM, Orizaba 94300, Mexico
*
Author to whom correspondence should be addressed.
Systems 2025, 13(7), 591; https://doi.org/10.3390/systems13070591
Submission received: 25 April 2025 / Revised: 4 July 2025 / Accepted: 6 July 2025 / Published: 16 July 2025
(This article belongs to the Special Issue System Dynamics Modeling and Simulation for Public Health)

Abstract

The development of new diagnostic technologies is accelerating, and budgetary constraints in the health sector necessitate a systematic decision-making process to acquire emerging technologies. Health Technology Assessment methodologies integrate technology, clinical efficacy, patient safety, and organizational and financial factors in this context. However, these methodologies do not include the learning curve, a critical factor in operator-dependent technologies. This study presents an evaluation model incorporating the learning curve, developed from the domains of the AdHopHTA project. Using System Dynamics (SD), the model was validated and calibrated as a case study to evaluate the use of Point-of-Care Ultrasound (POCUS) in identifying dengue. This approach allowed for the analysis of the impact of the learning curve and patient demand on the revenues and costs of the healthcare system and the cost–benefit indicator associated with dengue detection. The model assesses physician competency and how different training strategies and frequencies of use affect POCUS adoption. The findings underscore the importance of integrating the learning curve into decision-making. This study highlights the need for further investigation into the barriers that limit the effective use of POCUS, particularly in resource-limited settings. It proposes a framework to improve the integration of this technology into clinical practice for early dengue detection.

1. Introduction

The rapid growth of diagnostic possibilities and the need for efficient health system resource use necessitate the urgent need for systematic solutions to reduce inefficiencies [1]. The fundamental role of technology assessment is recognized as multidisciplinary policy research in the generation of evidence to inform the prioritization, selection, introduction, distribution, and management of health technologies.
Different guidelines have been developed to conduct the Health Technologies Assessment. The literature refers to two pioneering models: the mini-HTA developed by the Danish Agency in 2005 [2], and the Core model developed by the EUnetHTA in 2006 [3]. Another recently released model is the mini-HTA model developed under the AdHopHTA project in 2015 [4,5]. However, the learning curves within the assessment domains are not systematically considered.
The MedtecHTA project 2013–2016 [6], aimed at analyzing existing methodologies for the assessment of medical devices, recommended incorporating learning curves in decision analysis models. Other publications propose these same challenges based on the unique characteristics of medical devices that have not yet been addressed and the impact on organizational changes with the acquisition of new technology [7,8,9].
A literature review for between 2012 and 2023 reaffirmed the need to include learning curve in the evaluation of operator-dependent technologies. Table 1 presents an analysis of the domains developed by other studies and evaluation models.
Dengue, a rapidly spreading viral disease, has increased 30 times over the past half-century, with 390 million people infected annually, and 96 million manifesting clinically. In 2019, 5.2 million people were at risk of dengue infection [26,27].
WHO (World Health Organization) guidelines recommend classifying the disease into dengue without warning signs, dengue with warning signs, or severe dengue for timely and appropriate clinical management. It also indicates abdominal ultrasound to detect plasma leakage; a symptom associated with severe dengue. Studies refer to POCUS as a predictor or prognostic sign of severe dengue, even in children [28,29]. Nevertheless, the use of POCUS for endemic infectious diseases in tropical regions has been limited. Only two protocols have been investigated and routinely implemented in treating tropical infectious diseases: focused assessment with sonography for HIV-associated TB (FASH) and echinococcosis (FASE) [30].
The usefulness of point-of-care ultrasound (POCUS) in terms of accessibility to diagnostic methods in low-resource settings is clear and is considered an extension of the physical examination. Nonetheless, it is important to formalize the scanning and training protocols for infectious diseases [31,32]. The tasks of identifying the training hours required to achieve competency in image acquisition, interpretation, and cognitive foundations and assessing the maintenance of these competences are still an unexamined area of research [33]. Ultrasound image acquisition and interpretation are operator-dependent skills. Cumulative sum control charts (CUSUM) and the CUSUM learning curve (LC-CUSUM) are statistical techniques that can help validate learning curve, considering that they determine the point at which competence is achieved or lost over time [34,35].
Modeling healthcare systems is complex; conventional simulation strategies do not fully address the multiplicity of medical care and the process of care for diseases and pathologies. System Dynamics is a mathematical modeling methodology to analyze and evaluate the behavior of complex systems, considering the interaction between elements, facilitating a holistic understanding. This methodology is widely used in various fields such as System Dynamics and can be applied to health systems [36,37,38], the study of diseases and epidemics [39,40], health policy analysis [41,42,43], resource management [43,44,45], and care capacity [46,47,48], among others, to study dynamic systems that involve feedback loops and time delays. By capturing the interdependencies and feedback mechanisms within a system, System Dynamics facilitates informed decision-making by simulating different scenarios and predicts the long-term consequences of their actions. This can be particularly useful in policy formulation, assessing the potential impact of different interventions on the system as a whole. Additionally, System Dynamics provides a visual representation of the system, which can help stakeholders better understand the underlying dynamics and complexities. Overall, System Dynamics offers a powerful tool for decision-making and problem-solving, by providing a comprehensive and dynamic perspective on complex systems [49].
The quantitative information gathered from this research will be crucial for decision-making regarding the inclusion and development of necessary skills in the healthcare sector about diagnosis of dengue.
System Dynamics (SD) has been successfully used to model the early management of COVID-19 and its implications for the Indonesian health system [40]. SD has been evaluating the economic effects of healthcare in low- and middle-income settings [50].
This study uses the SD method to look at how variables affect the learning curve’s behavior over time in a simulation model. The model combines four assessment areas suggested by the AdHopHTA project with learning curve [4]. It is then tested using the SD method to classify a tropical disease like dengue, which spreads quickly [51,52]. These relationships create balancing and reinforcing loops that make it possible to think about using POCUS technology for other emergency service diagnoses [6,7,8,53].
The objectives of this work are (1) to present a conceptual model that integrates the four assessment domains suggested by the AdHopHTA project in 2015 [4] with the learning curve, and (2) to verify and calibrate said conceptual model using the SD method in the classification of a tropical disease such as dengue, characterized by a high spread rate.

2. Materials and Methods

2.1. POCUS Assessment Framework

To identify the theoretical elements of the model such as domains and assessment criteria, the models currently used at the hospital level were studied. The mini-HTA model of AdHopHTA [4] and different assessments carried out under the AdHopHTA mini-HTA model were analyzed, including the assessment of Focused Assessment Sonography for Trauma (FAST). Interviews were conducted with physicians who use POCUS equipment in the emergency area in Colombian and Spanish hospitals.
The general process of emergency care for patients with suspected dengue was studied, specifically the classification of dengue. Once the process was understood, the causal relationships were identified and grouped into four assessment domains.

2.2. Learning Curve

The LC-CUSUM and CUSUM control charts are statistical techniques that enable the quantitative evaluation of discrete variables. They offer immediate retrospective or prospective feedback, individualized evaluation of the learning curve [40], and the ability to define and achieve specific learning objectives and proficiencies [41]. Studies carry out a critical analysis of CUSUM and support its use in this sense, mainly if you want to quickly detect changes in performance in real time with binary data with predefined acceptable and unacceptable levels of proficiency [19].
The learning curve was modeled using the LC-CUSUM and CUSUM control charts, considering its applicability in medical processes, such as cardiac surgery or disease outbreaks. LC-CUSUM indicates when a process has reached a state of control, indicating that a physician has achieved an appropriate level of performance. While CUSUM detects changes in the process, indicating when it has deviated from its control state [54]. For LC-CUSUM, the null hypothesis was defined as H0: “performance is inadequate” (i.e., the process is out of control because competence has not been achieved) and the alternative hypothesis as H1: “performance is adequate” (i.e., the process is under control because competence has been achieved or maintained). On the contrary, in the CUSUM, we consider the null hypothesis as H0: “competence remains adequate” (i.e., the process is under control) and the alternative hypothesis, H1: “competence is lost” (i.e., the process is out of control).
Two key parameters are P0, which represents the rate of failure considered unacceptable, and P1, which signifies a failure rate that is deemed acceptable. These parameters play a crucial role in setting the control limit (H) on the charts. When this limit is exceeded, it indicates either the achievement of proficiency (in the case of LC-CUSUM) or the loss of it (in the case of CUSUM). Based on these parameters, the Average Run Length (ARL) for detecting a signal under the null hypothesis (ARL0) and the alternative hypothesis (ARL1) is estimated. This represents the average number of procedures (diagnostic ultrasound imaging) to detect a signal under H0 and H1.
According to an expert radiologist and references [42,43], P0 = 0.3 and P1 = 0.1 were determined for LC CUSUM and P0 = 0.1 and P1 = 0.2 for CUSUM. Finally, a Monte Carlo simulation was performed to establish appropriate H and ARLs. For LC-CUSUM the limit was H: 2.5 and for CUSUM it was H: 1.5. The performance of LC-CUSUM in terms of the Average Run Length (ARL0) was 98 procedures under the null hypothesis and 17 procedures under the alternative hypothesis (ARL1). For CUSUM the ARL0 was 99 procedures and ARL1 was 23 procedures on average. The learning curve design parameters were taken from Usaquén-Perilla et al., 2023 [55].
In the model, each time a patient with suspected dengue was admitted, the sequential score  S t = 0 , S t 1 + W t    was calculated, which represents the accumulated sum of the deviations of the data with respect to an objective value (y axis of the learning curve) and Wt is determined based on the next equation:
W t = L o g 1 P 1 1 P 0             i f   X t = 0   s u c c e s s L o g P 1 / P o                                   i f   X t = 1   ( f a i l u r e )
In this work, the sequence St was modeled as a Bernoulli distribution (simulated in STELLA as a binomial distribution with N = 1) with an 80% probability of success. It is possible to adjust this parameter in the simulation.
The conceptual model of the learning curve is presented in Figure 1. Once trained, the physician enters a monitoring phase. If they lose competency, they must undergo retraining. Finally, their acquisition, and maintenance of competency will be assessed.

2.3. Case Study

The case study was based on a prospective cohort study conducted at a first-level care Public Health Institution in Cali, Colombia. The included participants correspond to patients who attended the emergency department between 12 April 2019 and 20 March 2020 and were considered by the treating physician with a diagnosis of dengue virus disease. The participants gave written informed consent. The ethics committee of the Universidad del Valle (Number: 022-018) and the University of Minnesota (STUDY00004437) approved this study. Other data on patient demand were approved by the Institutional Review Board of the case study institution under the project Point-of-Care Ultrasound biomedical equipment evaluation model (POCUS) considering the learning curve: case application of dengue screening.
SD was used to study the behavior of the conceptual model, specifically the Stella Architect software (www.iseesystems.com) at version 2.1.1. The modules of patient demand, POCUS service, ponderation, training, and POCUS-Dengue costs were designed.
For each assessment domain, the information for the emergency care variables of the institution was gathered. The database literature was reviewed from different sources: Medline and Embase via Ovid, Medline via PubMed, Cochrane Library via Wiley, Global Index Medicus, ClinicalTrials.gov, World Health Organization International, Clinical Trials Registry (WHO ICTRP), WHO Library Database (WHOLIS), Open-grey.eu, and Scopus between 2018 and 2021. Administrative and commercial data were accessed from cross-references.
Lastly, a sensitivity analysis was carried out to understand the impact on certain assessment domains and criteria of modifying variables linked to the organizational structure of the service that requires the POCUS equipment, among other types of analysis.

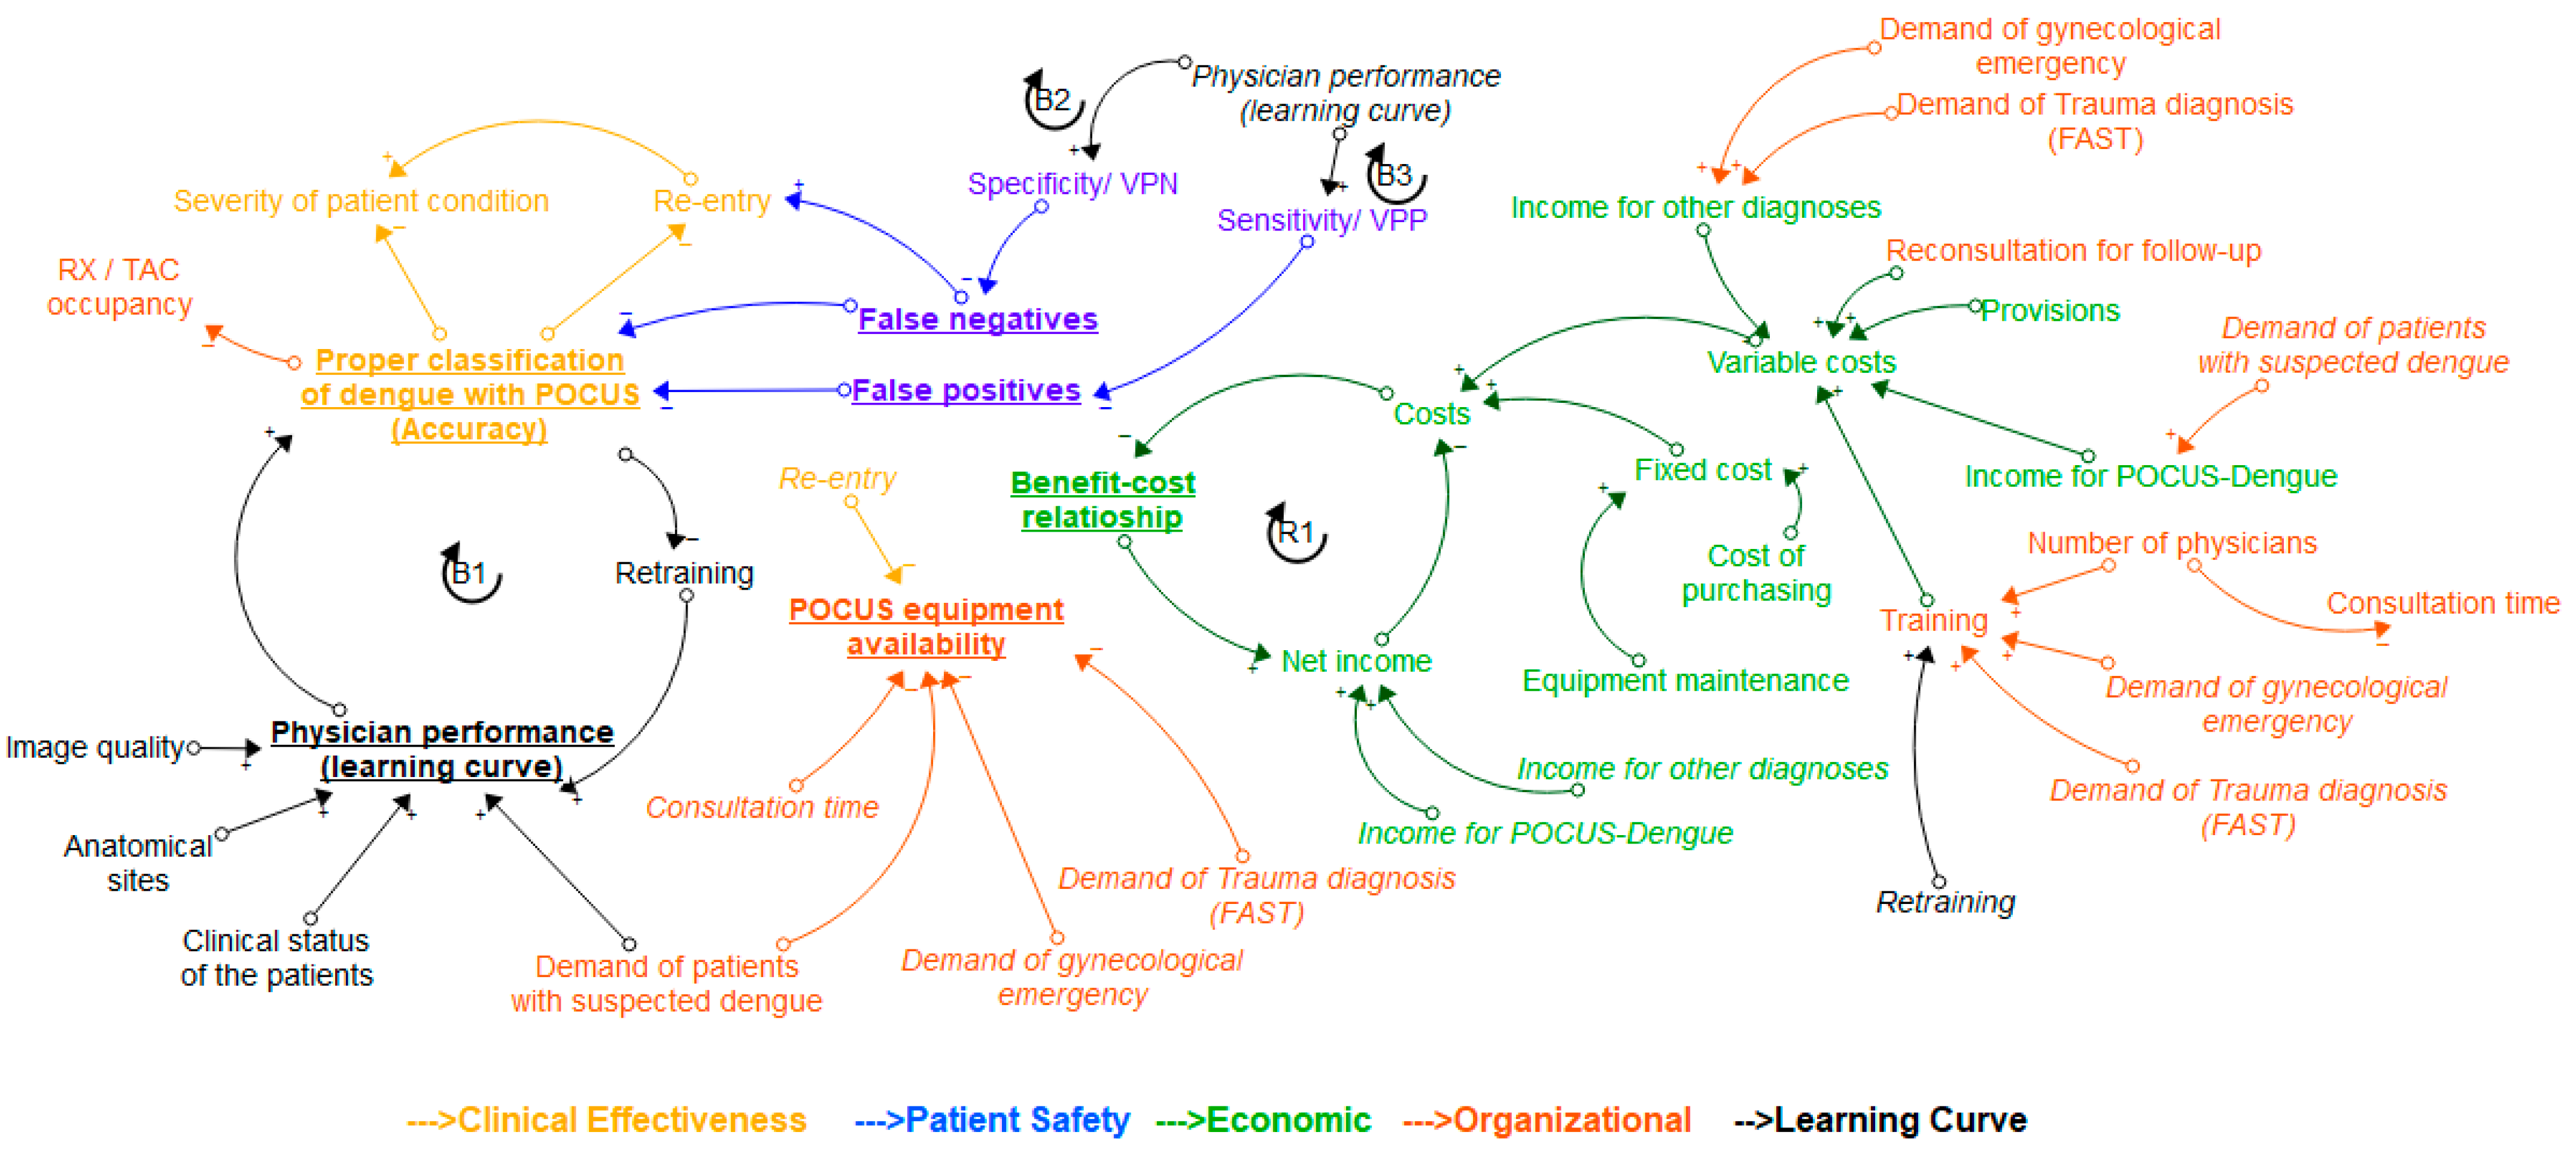
2.4. About the Conceptual Model

In general, causal diagrams are composed of variables connected by arrows showing a cause–effect relationship “Physician performance (Learning curve)” -> “Proper classification of dengue with POCUS”, positive or negative. The plus sign (+) at the head of the arrow of the consequence variable (proper classification of dengue with POCUS) shows a positive causal relationship, indicating that, if “Physician performance (Learning curve)” improves, “Proper classification of dengue with POCUS” will also improve; or vice versa, if “Physician performance (Learning curve)” worsens, “Proper classification of dengue with POCUS” will also decrease. Therefore, a change in the variable “Physician performance (Learning curve)” (cause) causes a change in the variable “Proper classification of dengue with POCUS” (effect) in the same direction. A negative causal relationship, symbolized by the “minus” (−) sign at the head of the arrow (Net income -> Costs), indicates that, if “Net income” increases, “Costs” will decrease; or vice versa. Thus, in a negative causal relationship, the change in the variable “Net income” (cause), produces a change in the variable “Costs” (effect) in the opposite direction [49,56].
In our conceptual model represented in Figure 2, the clinical effectiveness domain includes proper classification of dengue with POCUS, (accuracy), readmission rate, and patient severity based on progression. The safety domain considers false negative and positive rates. The organizational domain evaluates the average time between ultrasound and training, excluding infrastructure due to equipment portability. The economic domain analyzes fixed and variable costs to assess the use of technology.
The feedback loops (Figure 2) that represent the dynamics of the subsystems are described below:
  • Loop B1 (Balancing): It represents the relationship between proper classification of dengue with POCUS and physician performance (learning curve). When the physician’s performance improves, as evaluated and monitored through the learning curve, the number of patients properly diagnosed will increase, resulting in a lower amount of retraining. More retraining will lead to an improvement in the performance of the physician observed in the learning curve.
  • Loop B2 (Balancing): As physician performance improves, specificity increases, and false negatives decrease. The more false negatives there are, the fewer patients are properly classified. Higher accuracy requires less training. The more training a physician receives, the better their performance becomes.
  • Loop B3 (Balancing): As physician performance improves, sensitivity increases, and the number of false positives decreases. The more false positives there are, the fewer patients are properly classified. Higher accuracy requires less training. The more training a physician receives, the better their performance becomes.
  • Loop R1 (Reinforcing): As total costs rise, the cost–benefit ratio falls, and as this ratio rises, net income also rises. To boost net income, costs need to decrease.
Other important relationships found were retraining -> training -> variable costs, which ultimately will affect the indicated cost–benefit.
Enhanced physician performance will decrease the number of false positives and false negatives, thereby improving the patient safety indicator. Additionally, it will influence diagnostic accuracy and reduce re-entry, increasing the availability of biomedical equipment for new patients. Table 2 presents the description of the main variables of the causal diagram.

3. Results

3.1. About the Case Study

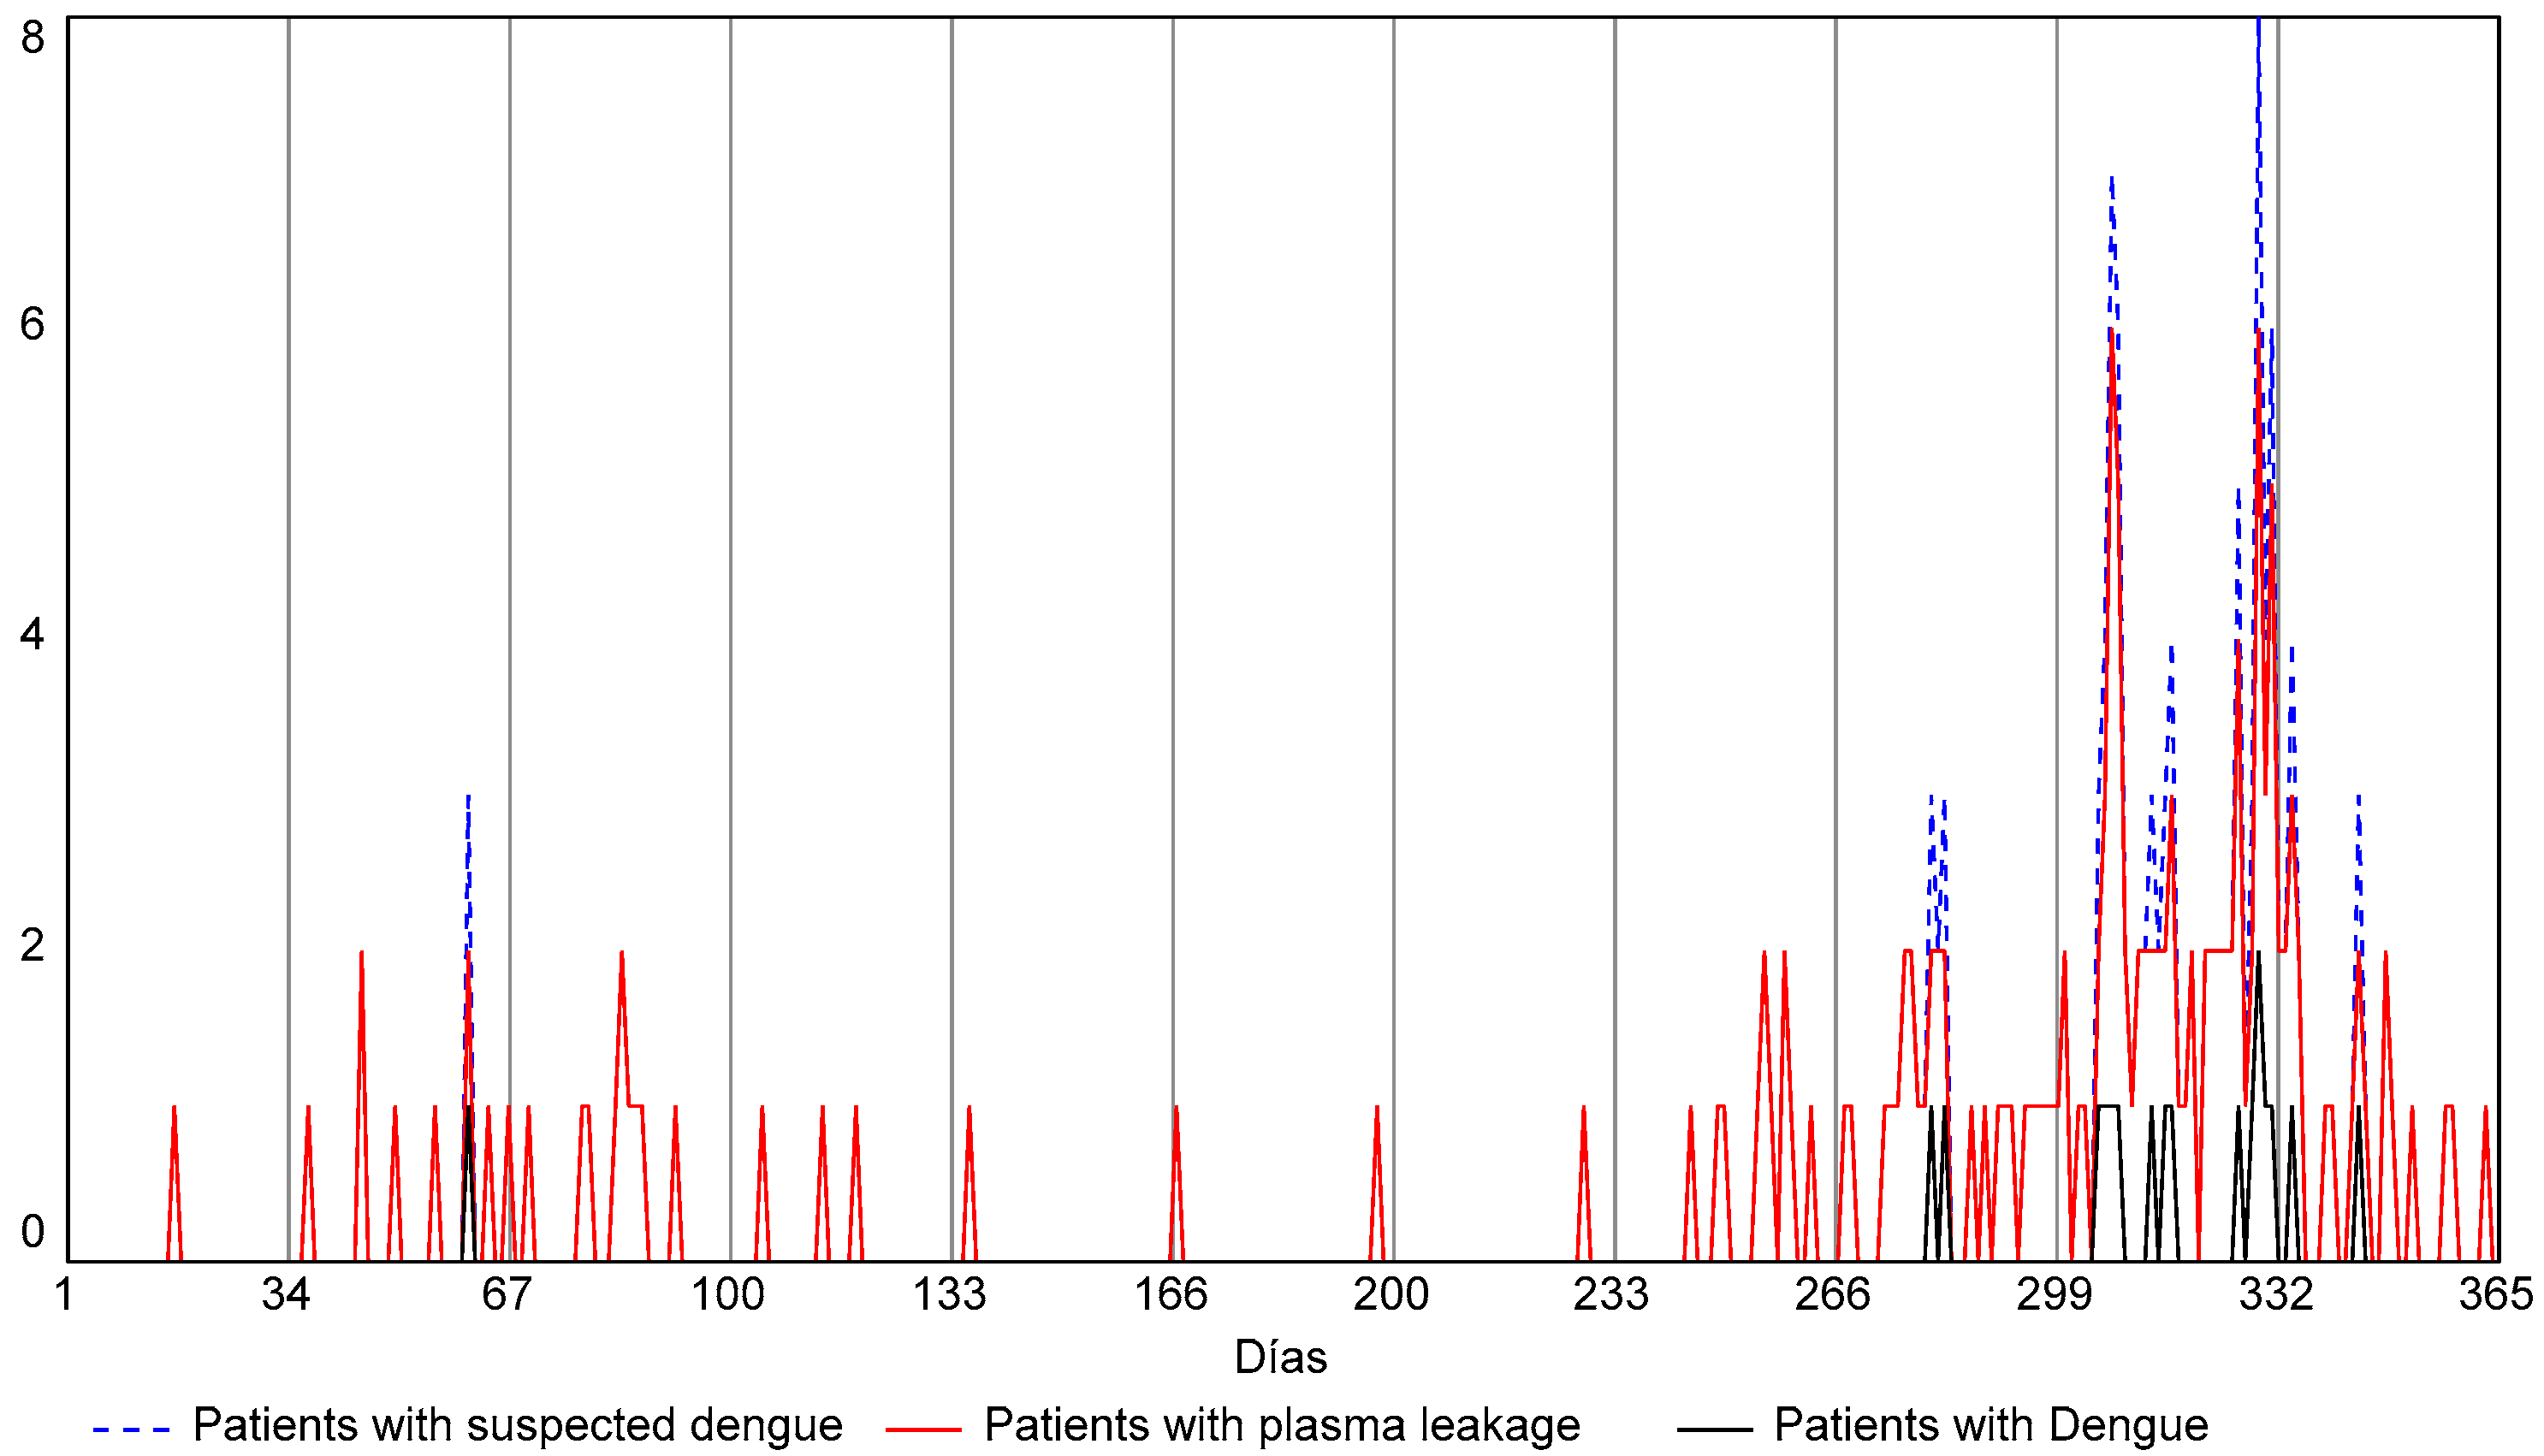
3.1.1. Patient Demand Module

This module analyzes patient demand at different stages of dengue: suspicion, confirmation, re-entry, recovery at home, hospitalization, or referral to other institutions. Demand was simulated using a Poisson distribution based on daily data from the case study. Fifty-six percent (100/178) of cases were confirmed (IgM positive). Readmission was also possible if the patient presented symptoms after a false negative result, with a rate of 0.29 (52/178). Although the original study did not include readmission data, the model allows for adjustment for this parameter. The Wilcoxon test showed no significant differences between the simulated and real data (p = 0.476) (Figure 3).
The following equations represent the behavior of the model: Dc are the patients confirmed to have dengue; Od are the patients with other diagnoses; PHyR are the patients that recovered in the hospital and were referred; PH patients that are hospitalized in the institution; PR patients that were referred immediately; and PRd patients that were referred after a few days. Considering the cohort study and the routine checkup of patients, the hospitalization rate was set at 0.67 (67/100), the immediate referral rate at 0.02 (2/100), and the rate of being referred after a few days at 0.13 (9/67).
P w i t h   s y m p t o m   ( t ) = P w i t h   s y m p t o m ( t o ) + 0 t ( P w i t h   s y m p t o m D c O d ) d t
P H y R ( t ) = P H y R ( t o ) + 0 t ( P H y R + P H + P R + P R d ) d t

3.1.2. Pocus Healthcare Module

Based on a cohort study, this module calculates the number of patients with and without plasma leaks using a rate of 0.83 (149/178). It is assumed that all patients suspected of having dengue undergo POCUS testing. If there is lung involvement and the physician is untrained, the patient is referred to radiology for a chest X-ray, with a utilization rate of 0.511 (91/178). True, false positive, and false negative values are calculated using specific formulas, and sensitivity and specificity are based on a literature reference [28], although parameters can be adjusted in the model.
V P _ c a l c u l a t e d = P a t i e n t s   w i t h   l e a k a g e S e n s i t i v i t y 100
V N _ c a l c u l a t e d = P a t i e n t s   w i t h o u t   l e a k a g e S p e c i f i c i t y 100
F P _ c a l c u l a t e d = V N _ c a l c u l a t e d V P P _ l i t e r a t u r e V P _ c a l c u l a t e d
F N _ c a l c u l a t e d = V N _ c a l c u l a t e d V P N _ l i t e r a t u r e V N _ c a l c u l a t e d
The model delivered a total of 159 patients with plasma leakage, which represents a 6% error compared to real data. According to simulations, if the physician were trained enough from day 1 and never lost said skillset, the POCUS test would be performed for dengue screening on 177 patients. Given the effect of the learning curve and the base scenario of 20% failure probability, if 112 patients entered the emergency room when the physician was untrained to carry out the POCUS test, and 57 of them would take a chest X-ray. Therefore, the POCUS test was performed on 46 patients (177–112). In Figure 4, when the red dotted signal “reached proficiency status” reaches the value of 1, the patients will be not sent to the radiology department, and the insurance company will be charged for the POCUS test.

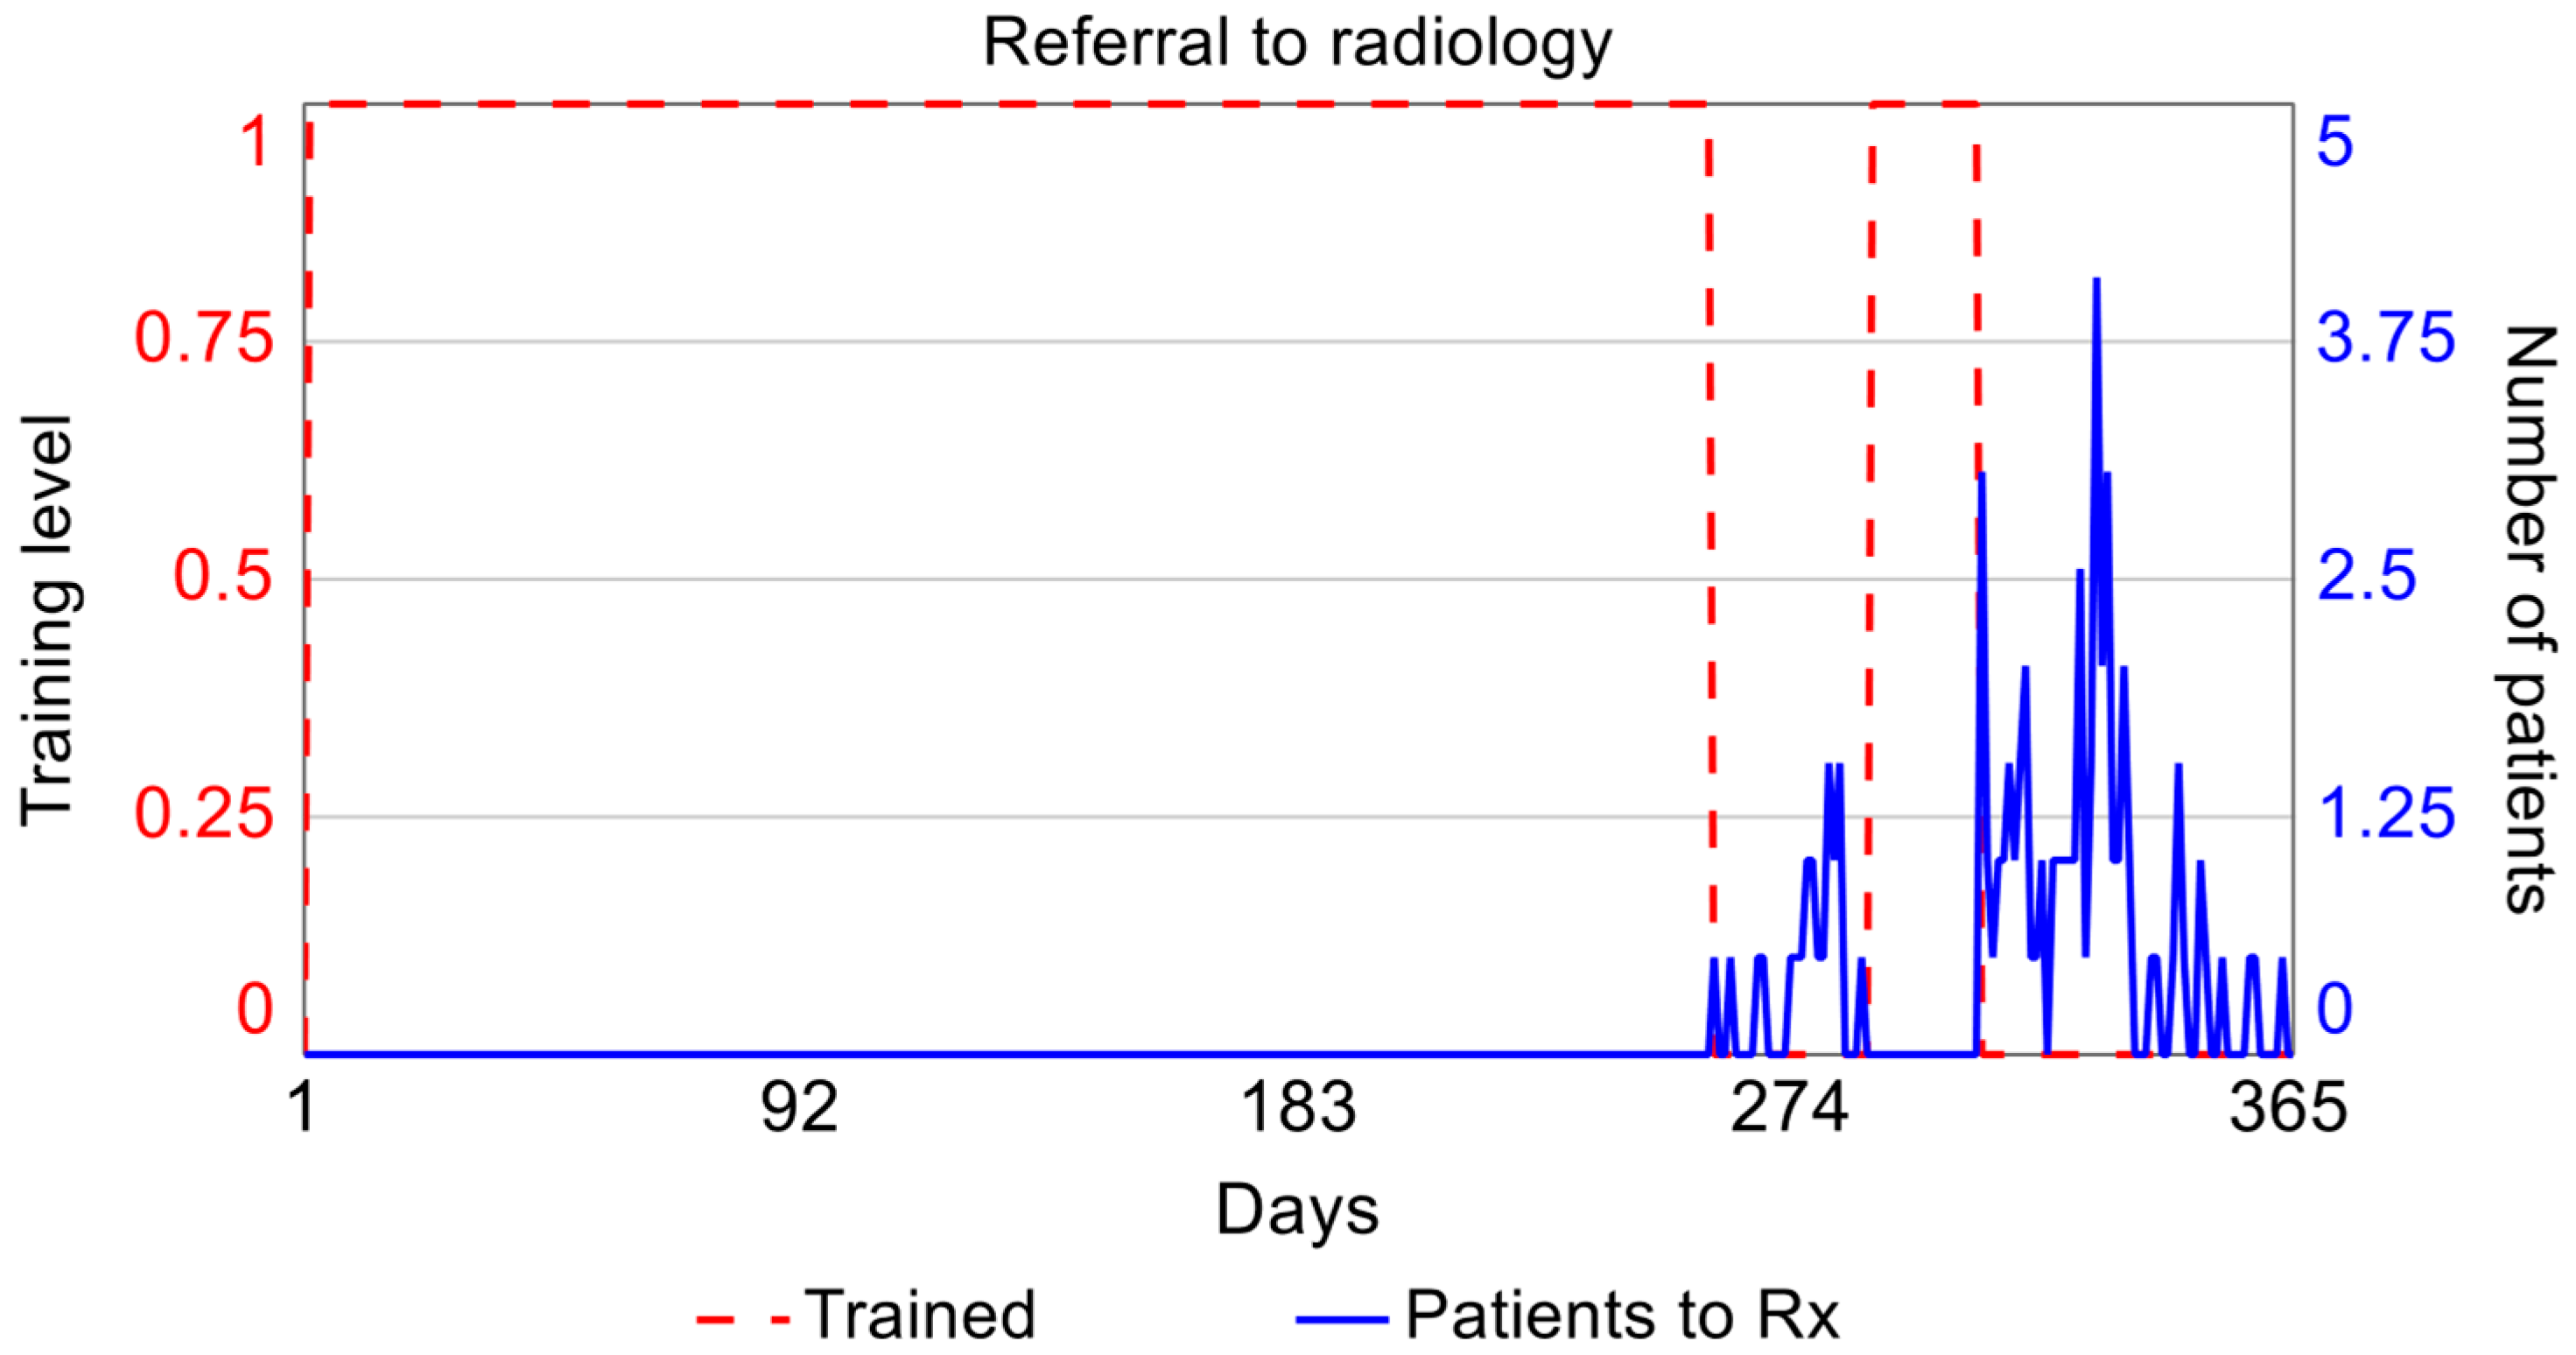
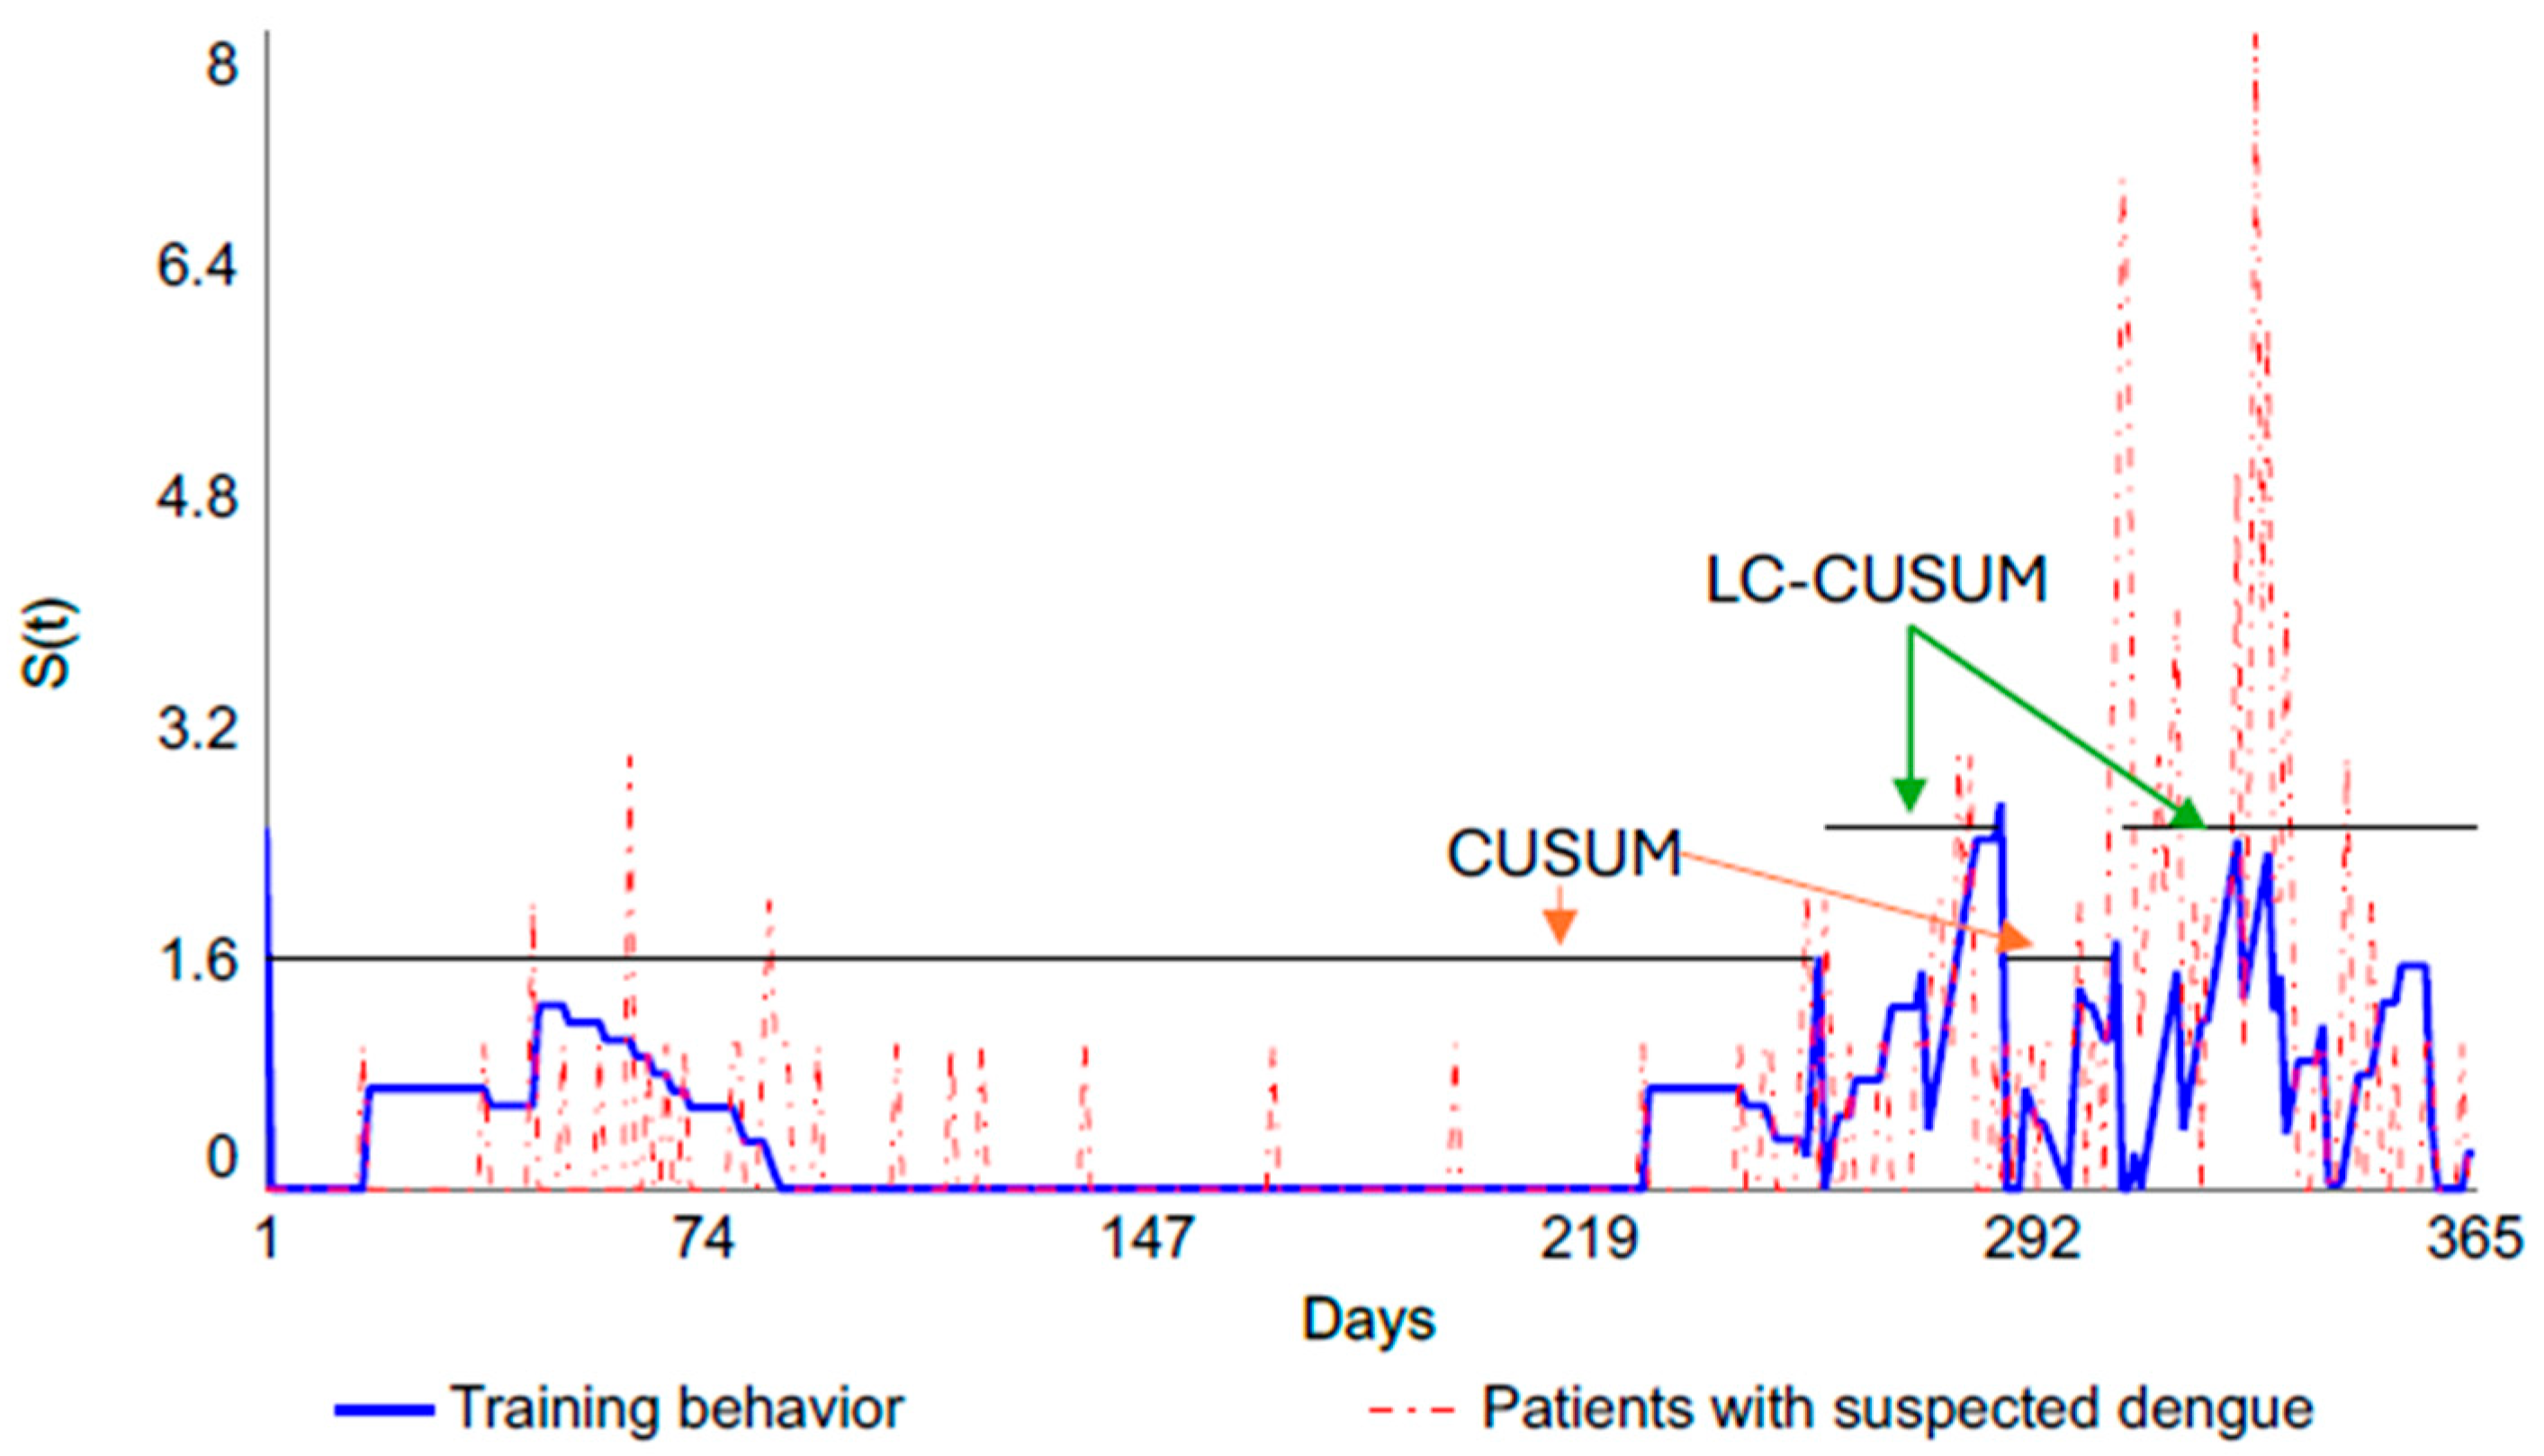
3.1.3. Ponderation and Training Module

The learning curve obtained in the base scenario of an 80% success rate for the physician is presented in Figure 5 (solid blue line). Considering that the individual was trained and certified in year 0, CUSUM competency monitoring is conducted at the start of the simulation. They maintain their competency until day 257, regain it on day 290, lose it on day 306, and do not regain it afterward. The black line in Figure 6 depicts the moments in which the training must be repeated, which are days 257 and 306.

3.1.4. POCUS-Dengue Cost Module

This module calculates the fixed costs associated with the purchase, use, and annual maintenance of biomedical training equipment, using Colombian market values as a reference. Two ultrasound systems, with different transducers and imaging modes, are considered: one at COP 25,000,000 (Lumify Phillips) and another at COP 101,000,000 (Sonosite Edge 2). A useful life of 8 years and an annual preventive maintenance cost of 4% of the purchase price are assumed. Fixed costs include POCUS-Dengue training, based on a 90 h certification in emergency medicine and critical care, aimed at specialist physicians caring for critically ill patients. The training covers the physical principles of ultrasound, basic echocardiography (FOCUS), lung and pleural ultrasound, FAST, aortic ultrasound, deep vein thrombosis (DVT), and ultrasound-guided vascular access.
The costs of the POCUS-Dengue procedure include the retraining of physicians who have lost their skills and the staff needed to cover shifts during training. The model calls for training at least three general physicians, one per shift in the emergency department, although this number is adjustable. Variable costs include supplies such as gel and wipes and periodic retraining to renew certification.
In terms of the income received by the healthcare institution from the insurance company due to the POCUS service, the fee corresponds to the one presented in the Fee Manual for Colombia. This income is only factored under the premise that the physician is trained to perform the test on 46 patients. The costs and projection of income were determined throughout the equipment lifecycle.
The dengue patient demand involved an analysis of the track record of Colombia. Between 2014 and 2022, it was found that 2019 was an epidemiological year, and there was no increased tendency afterwards. Hence, the model contemplates demand throughout the product lifecycle.
A 5% projection of costs and income was estimated, using as a reference the salary increase in Colombia between 2017 and 2021. The return on investment (ROI) was determined, as were the net present value and the cost–benefit ratio. A social discount of 9% was applied, as established by the National Department of Planning for the assessment of investment projects in the public sector.
In the base scenario, the cost–benefit ratio is 0.54, meaning that costs exceed benefits, and the ROI is negative for every year of the simulation, marking the lifecycle of the POCUS equipment. The main equations of each module are shown in the Supplementary Materials.

3.1.5. Sensitivity Analyses

Two sensitivity analyses will be implemented. In scenario zero (0), without a learning curve, the cost–benefit ratio is less than 1, which makes the investment financially unfeasible. Additionally, the false negatives, false positives, and clinical effectiveness could not be quantified for the hospital acquiring the technology. Without a learning curve, 177 exams would be performed, so the range of availability of the POCUS equipment would be similar to that of scenario 1. The decision to acquire POCUS technology under the zero (0) scenario is quite complex, as there is no information available on patient safety and clinical effectiveness in the specific hospital setting. The AdHopHTA project’s mini-HTA model recommends seeking evidence in the scientific literature. However, studies on POCUS-Dengue technology indicate a sensitivity greater than 80% and a highly variable specificity (13.2–100%) for detecting the presence or absence of plasma leak. In this type of testing, high sensitivity is crucial; that is, a test with no false negatives, meaning it detects a plasma leak when present and does not rule it out.
In scenario 1, with a 50% probability of success, the emergency physician certified at the beginning of the monitoring period loses competency on day 52 and undergoes retraining. However, they do not regain competency; that is, the emergency physician remains in the training phase from day 53 to day 365, allowing for only five exams to be billed to the EPS. The cost–benefit ratio is 0.02, rendering the investment unviable. Avoidable costs are minimal. With an 80% probability of success, two retrainings are necessary, and the cost–benefit ratio does not exceed 1, making the investment financially unviable. With a 100% probability of success, while the cost–benefit ratio does not exceed 1, it represents an improvement compared to the other success probabilities. This highlights the impact of the learning curve on the cost–benefit ratio and cost avoidance.
Regarding patient safety, and considering the influence of the learning curve, an increase in false positives (FP) and false negatives (FN) is evident for the 50% probability of success when compared to the 80% and 100% probabilities of success. Clinical effectiveness displays a similar trend due to the learning curve’s influence. As for POCUS equipment availability, in this scenario, the model simulates 177 patients per year, presenting significant opportunities to enhance equipment occupancy. Details of the simulation scenarios are provided in Table 3.
The validation of the model was based on the coherence of units and extreme condition analysis. When a model is exposed to extreme conditions, the researchers can verify whether the model offers reasonable results and, thus, is error-free in its structure. The model showed consistent behavior in every module. One example of this is the demand behavior and Wilcoxon signed-rank test, with no significant difference between simulated and real data linked to the case study.

4. Discussion

The problem addressed in this work focused on studying the influence of the learning curve on Health Technology Assessment in the acquisition of POCUS equipment. As mentioned in the introduction, some studies highlight this addition as a challenge in the field of medical device assessment. However, from a methodological perspective, the existing literature tends to address staff education and training as organizational or legal components [10,11,12,16,17,60] without explicitly integrating the dynamics of the learning curve. This omission results in fragmented analyses that consider only the logistical aspects of training programs and the associated direct costs while failing to account for critical elements such as continuous retraining, the impact on patient safety, actual clinical effectiveness under operating conditions, and the economic consequences derived from variability in operator performance. Consequently, a comprehensive view of the technology adoption process, particularly relevant in user-skill-dependent technologies like POCUS, is lost. Although the European network EunetHTA recognizes the importance of the learning curve, its recommendation is limited to its consideration solely in the analysis of clinical effectiveness. This restricted perspective underestimates the collateral and systemic effects that may arise during the implementation phase. Finally, it is essential to emphasize that an adaptation period is necessary before formal evaluation, providing technology operators with sufficient time to acclimate to the new technology. Differences between medical research centers, such as teaching and non-teaching hospitals, for example, can introduce biases in the evaluation of technology. This operational heterogeneity reinforces the need to adopt holistic approaches, such as Systems Dynamics, that allow for more realistic and robust modeling of the interaction between clinical, organizational, economic, and human variables.
A conceptual model was developed and validated with a case study for an operator-dependent technology that applied the learning curve. The first result is an understanding of the learning curve and an identification of a valid statistical tool for its representation within a systemic model. During the cohort study, specific factors that directly influence the training process were identified, which have been previously used to evaluate skills in medical specialties related to ultrasound [61]. These factors include familiarity with the medical equipment, selection of an adequate transducer, image quality, image pattern recognition, and insight interpretation. Furthermore, the development of an individual’s skills cannot be considered an isolated process, as it is influenced by multiple interrelated factors, including the student’s characteristics, the complexity of the procedure, the instructor’s profile, the learning environment, and the expected level of performance.
Although endoscopic ultrasound (POCUS) can be used in other tropical diseases such as schistosomiasis, hydatidosis (echinococcosis), Chagas disease, leptospirosis, etc. [62], the use of the model that integrates the diagnosis of other tropical diseases requires a specific analysis of the different administrative, technological, operational, and economic aspects that could be affected. Given this complexity, this work presents an assessment approach that integrates different theories and tools, supporting the acquisition of POCUS technology at the hospital level, taking dengue as a case study.
While there are guidelines for POCUS training, implementing quantitative tools to establish the point at which competency is acquired or lost for operator-dependent technologies is challenging. These technologies require methods to define individual reference points and monitor the learning process. The control graphs CUSUM and LC-CUSUM showcase the characteristics needed to assess learning curve by delivering feedback to the apprentice to improve until they recover competency. These intuitive control graphs helped analyze the behavior over time and thus understand the influence on other system variables.
The conceptual model built based on the assessment domains established in the AdHopHTA project in 2015 [4] led to the identification of the influence of the learning curve in the decision-making indicator: cost–benefit. The variable costs are influenced by the reimbursement that insurance companies earn from hospitals due to echography billing. This indicator is influenced by the income that is not earned when the physician loses the required skillset, leading the patient to take other diagnostic tests such as X-ray or CT scans. This indicator is also marked by the costs linked to the retraining process.
The analysis of the proposed model extracted the need to use the POCUS equipment for other uses to improve the cost–benefit ratio. The model evidenced that patient demand, along with learning curve behavior, has a significant impact on this variable. This is supported by the recommendations of the Royal College of Radiologists that the physician should not remain for more than three months without using these echography-related exploration skills [63]. In this sense, it could be used in the FAST service and gynecological emergency situations. This would increase the income earned by the hospital due to the reimbursement of services. Nonetheless, the training of physicians in these new skills must also be considered in the variable costs.
Another relevant aspect is the availability of medical equipment. Although the POCUS-Dengue test takes 20 min, the demand and alternative uses of the equipment could lead to excessive occupation, which could translate into increasing maintenance costs and cutting the lifecycle set by the manufacturer.
The model presents a degree of adaptability to different hospital environments, and the model parameters can be customized by the user according to the hospital specifications, installed capacity, available human resources, epidemiological context, and even new bibliographic references related to the behavior of the disease. Patient demand, checkup consultation rates, readmission rates, the number of physicians to be trained, and diagnosis sensitivity and specificity can be customized. This model can be adapted to assess other operator-dependent technologies, such as endoscopic ultrasound.

5. Conclusions

This work established the influence of the learning curve on economic and organizational indicators, mainly in the assessment of operator-dependent technologies such as POCUS. Variables such as patient demand and learning curve behavior had a significant impact on the income and costs of the healthcare system in dengue screening and ultimately the cost–benefit indicator. Applying the model requires an adequate definition of the various relationships established. For example, to evaluate the appropriateness of incorporating POCUS technology in low-income regions, it is necessary to investigate each assessment domain, specifying variables such as demand, economic aspects, clinical effectiveness, etc. The learning curve is a fundamental aspect.
The results of the learning curve study show that LC-CUSUM and CUSUM control charts are effective graphical techniques for assessing the learning curve and can be helpful in real-time monitoring once the learner reaches a level of competence.
This work developed a healthcare technology assessment model for operator-dependent technology, combining a systemic approach and learning curve to support healthcare managers’ decision-making. With the pivotal role of information technologies in the development of new technologies [64], future research should delve into the impact on the following domains: economic, organizational, clinical, and patient safety, including learning curve, investment, equipment maintenance and administrative processes, and integration of information technologies. Future research could focus on satisfaction associated with using POCUS, including physician–patient empathy and perceived patient trust. Several studies have indicated a positive experience [65,66]. POCUS provides patient safety without ionizing radiation. In this sense, this variable could affect the organizational level, which would require the generation of a new indicator based on patient interviews or bibliographic references. Future work will explore other real-world scenarios of operator-dependent technologies.
There are several limitations to our study. Firstly, although the model designed was based on scientific references and a case study was validated, in this sense, the result of the causal diagram of the POCUS evaluation model with the four evaluation domains and learning curve is not intended to be a rigorous and unique example of modeling; other key variables and causal relationships could come to light in other particular contexts, for example, in rural hospitals or those with great obstacles to training in POCUS technology.
Secondly, it considered the reimbursement system in terms of the revenue that the healthcare institution receives from the insurance company due to the POCUS service. However, other types of income or compensation that could be received, such as university hospitals or public subsidies, are not contemplated.
Thirdly, the influence of the learning curve was only considered for procedures performed with the POCUS-Dengue technology, and an extension of the model could include the effect of the learning curve in FAST and gynecological emergency situations.
This paper presents an approach to technology assessment in hospital settings, considering the learning curve. It integrates several generic tools for hospital settings, such as mini-HTA, and probabilistic tools, such as the learning curve CUSUM, for learning curve estimation. Additionally, considering the hybrid deterministic and probabilistic nature of the relationship between the model’s variables, a System Dynamics model is recommended. In this sense, the model can guide other authors in overcoming these challenges and contribute to developing strategies for technology assessment and selection in hospital settings.

Supplementary Materials

The following supporting information can be downloaded at https://www.mdpi.com/article/10.3390/systems13070591/s1.

Author Contributions

Conceptualization, S.U.-P. and J.I.G.-M.; methodology, S.U.-P. and J.I.G.-M.; software, S.U.-P. and L.V.B.-V.; validation, S.U.-P. and L.V.B.-V.; formal analysis, S.U.-P. and J.I.G.-M.; investigation, S.U.-P. and J.I.G.-M.; resources, J.I.G.-M.; data curation, L.V.B.-V.; writing—original draft preparation, S.U.-P. and L.V.B.-V.; writing—review and editing, S.U.-P. and L.V.B.-V.; visualization, S.U.-P. and L.V.B.-V.; supervision, J.I.G.-M.; project administration, J.I.G.-M.; funding acquisition, J.I.G.-M. All authors have read and agreed to the published version of the manuscript.

Funding

This research was funded by the Universidad del Valle, Cali, Colombia, CI: 21140.

Institutional Review Board Statement

The study was conducted in accordance with the Declaration of Helsinki and approved by the Institutional Review Board of the Universidad del Valle (Number: 022-018), the University of Minnesota (STUDY00004437), and the Red de Salud del Norte E.S.E (Number: ASI-019-2021).

Informed Consent Statement

Informed consent was obtained from all the subjects involved in the study.

Data Availability Statement

The original contributions presented in this study are included in the article/Supplementary Materials. Further inquiries can be directed to the corresponding author(s).

Acknowledgments

The authors are deeply thankful to Lyda Osorio and Jonathan D Kirsch and Daniela Zuluaga for their clinical, methodological, and analytical contribution to the case study data. Equally, the authors thank Jaime Mosquera for his contributions in the construction of the control charts for the case study.

Conflicts of Interest

The authors declare no conflicts of interest. The funder had no role in the design of the study, collection, analyses, or interpretation of data, writing of the manuscript, or the decision to publish the results.

Abbreviations

The following abbreviations are used in this manuscript:
SDSystem Dynamics
POCUSPoint-of-Care Ultrasound

References

  1. World Health Organization. Health Technology Assessment and Health Benefit Package Survey 2020/2021. 2021. Available online: https://www.who.int/teams/health-systems-governance-and-financing/economic-analysis/health-technology-assessment-and-benefit-package-design/survey-homepage (accessed on 1 March 2025).
  2. Dubromel, A.; Duvinage-Vonesch, M.A.; Geffroy, L.; Dussart, C. Organizational aspect in healthcare decision-making: A literature review. J. Mark. Access Health Policy 2020, 8, 1810905. [Google Scholar] [CrossRef]
  3. Kristensen, F.B.; Lampe, K.; Wild, C.; Cerbo, M.; Goettsch, W.; Becla, L. The HTA Core Model—10 Years of Developing an International Framework to Share Multidimensional Value Assessment. Value Health 2017, 20, 244–250. [Google Scholar] [CrossRef]
  4. Sampietro-Colom, L.; Lach, K.; Cicchetti, A.; Kidholm, K.; Pasternack, I.; Fure, B.; Rosenmöller, M.; Wild, C.; Kahveci, R.; Was-serfallen, J.B.; et al. The AdHopHTA handbook: A handbook of hospital-based Health Technology Assess-ment (HB-HTA); Public deliverable; The AdHopHTA Project (FP7/2007-13 grant agreement nr 305018); 2015. Available online: http://www.adhophta.eu/handbook (accessed on 5 July 2025).
  5. da Silva Galdino, J.P.; Camargo, E.B.; Silva Elias, F.T. Sedimentation of health technology assessment in hospitals: A scoping review. Cad. Saude Publica 2021, 37, e00352520. [Google Scholar] [CrossRef]
  6. Tarricone, R.; Torbica, A.; Drummond, M. Key Recommendations from the MedtecHTA Project. Health Econ. 2017, 26, 145–152. [Google Scholar] [CrossRef] [PubMed]
  7. Fuchs, S.; Olberg, B.; Panteli, D.; Perleth, M.; Busse, R. HTA of medical devices: Challenges and ideas for the future from a European perspective. Health Policy 2017, 121, 215–229. [Google Scholar] [CrossRef] [PubMed]
  8. Tarricone, R.; Torbica, A.; Drummond, M. Challenges in the Assessment of Medical Devices: The MedtecHTA Project. Health Econ. 2017, 26, 5–12. [Google Scholar] [CrossRef]
  9. Daubner-Bendes, R.; Kovács, S.; Niewada, M.; Huic, M.; Drummond, M.; Ciani, O.; Blankart, C.R.; Mandrik, O.; Torbica, A.; Yfantopoulos, J.; et al. Quo Vadis HTA for Medical Devices in Central and Eastern Europe? Recommendations to Address Methodological Challenges. Front. Public Health 2021, 8, 612410. [Google Scholar] [CrossRef]
  10. Sampietro-Colom, L.; Morilla-Bachs, I.; Gutierrez-Moreno, S.; Gallo, P. Development and Test of a Decision Support Tool for Hospital Health Technology Assessment. Int. J. Technol. Assess. Health Care 2012, 28, 460–465. [Google Scholar] [CrossRef]
  11. Miniati, R.; Frosini, F.; Cecconi, G.; Dori, F.; Gentili, G.B. Development of sustainable models for technology evaluation in hospital. Technol. Health Care 2014, 22, 729–739. [Google Scholar] [CrossRef]
  12. Ritrovato, M.; Faggiano, F.C.; Tedesco, G.; Derrico, P. Decision-oriented health technology assessment: One step forward in supporting the decision-making process in hospitals. Value Health 2015, 18, 505–511. [Google Scholar] [CrossRef]
  13. Miniati, R.; Frosini, F.; Cecconi, G.; Dori, F.; Gentili, G.B. Hospital-based expert model for health technology procurement planning in hospitals. In Proceedings of the 2014 36th Annual International Conference of the IEEE Engineering in Medicine and Biology Society, Chicago, IL, USA, 26–30 August 2014; pp. 3504–3507. [Google Scholar] [CrossRef]
  14. Frosini, F.; Miniati, R.; Grillone, S.; Dori, F.; Gentili, G.B.; Belardinelli, A. Integrated HTA-FMEA/FMECA methodology for the evaluation of robotic system in urology and general surgery. Technol. Health Care 2016, 24, 873–887. [Google Scholar] [CrossRef]
  15. Ivlev, I.; Vacek, J.; Kneppo, P. Multi-criteria decision analysis for supporting the selection of medical devices under uncertainty. Eur. J. Oper. Res. 2015, 247, 216–228. [Google Scholar] [CrossRef]
  16. Martelli, N.; Hansen, P.; Van Den Brink, H.; Boudard, A.; Cordonnier, A.L.; Devaux, C.; Pineau, J.; Prognon, P.; Borget, I. Combining multi-criteria decision analysis and mini-health technology assessment: A funding decision-support tool for medical devices in a university hospital setting. J. Biomed. Inform. 2016, 59, 201–208. [Google Scholar] [CrossRef] [PubMed]
  17. Martelli, N.; Devaux, C.; Van Den Brink, H.; Billaux, M.; Pineau, J.; Prognon, P.; Borget, I. Harmonizing health technology assessment practices in university hospitals: To what extent is the mini-hta model suitable in the French context? Int. J. Technol. Assess. Health Care 2017, 33, 307–314. [Google Scholar] [CrossRef] [PubMed]
  18. Muñoz Tiznado, P.D.L.Á. Adquisición de Equipo Médicos Basada en AHP-Caso de Estudio de Servicio de Salud Maule (SSM). Ph.D. Thesis, Universidad de Concepción–CHILE, Concepción, Chile, 2016. [Google Scholar]
  19. Margotti, A.E.; Ferreira, F.B.; Santos, F.A.; Garcia, R.; Member, S. Health Technology Assessment to Improve the Medical Equipment Life Cycle Management. In Proceedings of the 2013 35th Annual International Conference of the IEEE Engineering in Medicine and Biology Society (EMBC), Osaka, Japan, 3–7 July 2013; pp. 354–357. [Google Scholar]
  20. Grundy, Q. “Whether something cool is good enough”: The role of evidence, sales representatives and nurses’ expertise in hospital purchasing decisions. Soc. Sci. Med. 2016, 165, 82–91. [Google Scholar] [CrossRef]
  21. Pecchia, L.; Martin, J.L.; Ragozzino, A.; Vanzanella, C.; Scognamiglio, A.; Mirarchi, L.; Morgan, S.P. User needs elicitation via analytic hierarchy process. BMC Med. Inform. Decis. Mak. 2013, 13, 2. [Google Scholar] [CrossRef]
  22. Lasorsa, I.; Padoano, E.; Marceglia, S.; Accardo, A. Multi-criteria decision analysis for the assessment of non-clinical hospital services: Methodology and case study. Oper. Res. Health Care 2019, 23, 100171. [Google Scholar] [CrossRef]
  23. Hasegawa, M.; Komoto, S.; Shiroiwa, T.; Fukuda, T. Formal Implementation of Cost-Effectiveness Evaluations in Japan: A Unique Health Technology Assessment System. Value Health 2020, 23, 43–51. [Google Scholar] [CrossRef]
  24. Moshi, M.R.; Tooher, R.; Merlin, T. Development of a health technology assessment module for evaluating mobile medical applications. Int. J. Technol. Assess. Health Care 2020, 36, 252–261. [Google Scholar] [CrossRef]
  25. Schreier, J.; Genghi, A.; Laaksonen, H.; Morgas, T.; Haas, B. Clinical evaluation of a full-image deep segmentation algorithm for the male pelvis on cone-beam CT and CT. Radiother. Oncol. 2020, 145, 1–6. [Google Scholar] [CrossRef]
  26. Soneja, S.; Tsarouchi, G.; Lumbroso, D.; Tung, D.K. A Review of Dengue’s Historical and Future Health Risk from a Changing Climate. Curr. Environ. Health Rep. 2021, 8, 245–265. [Google Scholar] [CrossRef] [PubMed]
  27. Organización Mundial de la Salud [OMS]. Dengue. OMS. 2022. Available online: https://www.who.int/es/news-room/fact-sheets/detail/dengue-and-severe-dengue (accessed on 1 March 2025).
  28. Herath, H.M.M.T.B.; Udeshika, W.A.E.; Samarawickrama, S.S.M.; Yogendranathan, N.; Jayamali, W.D.; Kulatunga, A.; Rodrigo, C. Prediction of plasma leakage phase of dengue in resource limited settings. Clin. Epidemiol. Glob. Health 2019, 7, 279–282. [Google Scholar] [CrossRef]
  29. Dewan, N.; Zuluaga, D.; Osorio, L.; Krienke, M.-E.; Bakker, C.; Kirsch, J. Ultrasound in Dengue: A Scoping Review. Am. J. Trop. Med. Hyg. 2021, 104, 826–835. [Google Scholar] [CrossRef] [PubMed]
  30. Bélard, S.; Joekes, E.; Tamarozzi, F.; Heller, T.; Bustinduy, A.L.; Kuhn, W.; Brunetti, E.; Wallrauch, C.; Grobusch, M.P. Point-of-Care Ultrasound Assessment of Tropical Infectious Diseases—A Review of Applications and Perspectives. Am. J. Trop. Med. Hyg. 2015, 94, 8–21. [Google Scholar] [CrossRef]
  31. Brunetti, E.; Heller, T.; Richter, J.; Kaminstein, D.; Youkee, D.; Giordani, M.T.; Goblirsch, S.; Tamarozzi, F. Application of Ultrasonography in the Diagnosis of Infectious Diseases in Resource-Limited Settings. Curr. Infect. Dis. Rep. 2016, 18, 6. [Google Scholar] [CrossRef]
  32. Kaminstein, D.; Kuhn, W.T.; Huang, D.; Burleson, S.L. Perspectives on Point-of-Care Ultrasound Use in Pediatric Tropical Infectious Disease. Clin. Pediatr. Emerg. Med. 2019, 20, 128–140. [Google Scholar] [CrossRef]
  33. Díaz-Gómez, J.L.; Mayo, P.H.; Koenig, S.J. Point-of-Care Ultrasonography. N. Engl. J. Med. 2021, 385, 1593–1602. [Google Scholar] [CrossRef]
  34. Biau, D.J.; Williams, S.M.; Schlup, M.M.; Nizard, R.S.; Porcher, R. Quantitative and individualized assessment of the learning curve using LC-CUSUM. Br. J. Surg. 2008, 95, 925–929. [Google Scholar] [CrossRef]
  35. Woodall, W.H.; Rakovich, G.; Steiner, S.H. An overview and critique of the use of cumulative sum methods with surgical learning curve data. Stat. Med. 2020, 40, 1400–1413. [Google Scholar] [CrossRef]
  36. Fanta, G.B.; Pretorius, L. Sociotechnical factors of sustainable digital health systems: A system dynamics model. Health Policy Technol. 2023, 12, 100729. [Google Scholar] [CrossRef]
  37. Harrison, G.; Grant-Muller, S.M.; Hodgson, F.C. A review of transport-health system dynamics models. J. Transp. Health 2021, 22, 101138. [Google Scholar] [CrossRef]
  38. Nazarian-Jashnabadi, J.; Rahnamay Bonab, S.; Haseli, G.; Tomaskova, H.; Hajiaghaei-Keshteli, M. A dynamic expert system to increase patient satisfaction with an integrated approach of system dynamics, ISM, and ANP methods. Expert Syst. Appl. 2023, 234, 121210. [Google Scholar] [CrossRef]
  39. Zhang, J.; Wang, T. Urban resilience under the COVID-19 pandemic: A quantitative assessment framework based on system dynamics. Cities 2023, 136, 104265. [Google Scholar] [CrossRef]
  40. Aminullah, E.; Erman, E. Policy innovation and emergence of innovative health technology: The system dynamics modelling of early COVID-19 handling in Indonesia. Technol. Soc. 2021, 66, 101682. [Google Scholar] [CrossRef]
  41. Ghazvini, A.; Shukur, Z. System Dynamics in E-health Policy Making and the “Glocal” Concept. Procedia Technol. 2013, 11, 155–160. [Google Scholar] [CrossRef]
  42. Newell, B.; Siri, J. A role for low-order system dynamics models in urban health policy making. Environ. Int. 2016, 95, 93–97. [Google Scholar] [CrossRef]
  43. Payne-Sturges, D.C.; Ballard, E.; Cory-Slechta, D.A.; Thomas, S.B.; Hovmand, P. Making the invisible visible: Using a qualitative system dynamics model to map disparities in cumulative environmental stressors and children’s neurodevelopment. Environ. Res. 2023, 221, 115295. [Google Scholar] [CrossRef]
  44. Manshadi, Z.D.; Parivar, P.; Sotoudeh, A.; Morovati Sharifabadi, A. Modeling urban growth effects on carrying capacity in arid and semi-arid regions using system dynamics. Ecol. Modell. 2024, 487, 110565. [Google Scholar] [CrossRef]
  45. Urban, R.C.; Nakada, L.Y.K.; de Lima Isaac, R. A system dynamics approach for large-scale water treatment plant sludge management: A case study in Brazil. J. Clean. Prod. 2023, 419, 138105. [Google Scholar] [CrossRef]
  46. Nahavandi, N.; Gorji, M.A. The impact of inspection policies on reducing disease prevalence in public buildings: A systems dynamics approach. Build. Environ. 2022, 223, 109398. [Google Scholar] [CrossRef]
  47. Cirone, J.; Bendix, P.; An, G. A System Dynamics Model of Violent Trauma and the Role of Violence Intervention Programs. J. Surg. Res. 2020, 247, 258–263. [Google Scholar] [CrossRef] [PubMed]
  48. Rashwan, W.; Abo-Hamad, W.; Arisha, A. A system dynamics view of the acute bed blockage problem in the Irish healthcare system. Eur. J. Oper. Res. 2015, 247, 276–293. [Google Scholar] [CrossRef]
  49. Lane, J.D.; Sterman, D.C. Profiles in Operations Research; Springer: Berlin/Heidelberg, Germany, 2011; ISBN 9781441962805. [Google Scholar] [CrossRef]
  50. Cassidy, R.; Tomoaia-Cotisel, A.; Semwanga, A.R.; Binyaruka, P.; Chalabi, Z.; Blanchet, K.; Singh, N.S.; Maiba, J.; Borghi, J. Understanding the maternal and child health system response to payment for performance in Tanzania using a causal loop diagram approach. Soc. Sci. Med. 2021, 285, 114227. [Google Scholar] [CrossRef] [PubMed]
  51. Davahli, M.R.; Karwowski, W.; Taiar, R. A system dynamics simulation applied to healthcare: A systematic review. Int. J. Environ. Res. Public Health 2020, 17, 5741. [Google Scholar] [CrossRef] [PubMed]
  52. Barlas, Y. Formal aspects of model validity and validation in system dynamics. Syst. Dyn. Rev. 1996, 12, 183–210. [Google Scholar] [CrossRef]
  53. Cangelosi, M.; Chahar, A.; Eggington, S. Evolving Use of Health Technology Assessment in Medical Device Procurement—Global Systematic Review: An ISPOR Special Interest Group Report. Value Health 2023, 26, 1581–1589. [Google Scholar] [CrossRef]
  54. Biau, D.J.; Porcher, R. A method for monitoring a process from an out of control to an in control state: Application to the learning curve. Stat. Med. 2010, 29, 1900–1909. [Google Scholar] [CrossRef]
  55. Usaquén-Perilla, S.P.; Ropero-Rojas, D.; Mosquera-Restrepo, J.; Kirsch, J.D.; Kaltenborn, Z.P.; García-Melo, J.I.; Osorio-Amaya, L.E. Control charts to establish and monitor proficiency in the detection of pulmonary B-lines with Point of Care Ultrasound. Ing. y Univ. 2023, 27, 1–14. [Google Scholar] [CrossRef]
  56. Meadows, D.H.; Wright, D. Thinking in Systems: A Primer; Taylor & Francis: Milton Park, UK, 2008; Volume 2, ISBN 9781844077250. [Google Scholar] [CrossRef]
  57. Pusic, M.V.; Boutis, K.; Hatala, R.; Cook, D.A. Learning Curves in Health Professions Education. Acad. Med. 2015, 90, 1034–1042. [Google Scholar] [CrossRef]
  58. American College of Emergency Physicians. Emergency Ultrasound Standard Reporting Guidelines; ACEP: Irving, TX, USA, 2018. [Google Scholar]
  59. Balasubramanian, S.; Janakiraman, L.; Shiv Kumar, S.; Muralinath, S.; Shivbalan, S. A reappraisal of the criteria to diagnose plasma leakage in dengue hemorrhagic fever. Indian Pediatr. 2006, 43, 334–339. [Google Scholar]
  60. Ramsay, C.R.; Wallace, S.A.; Garthwaite, P.H.; Monk, A.F.; Russell, I.T.; Grant, A.M. Assessing the learning curve effect in health technologies. Lessons from the nonclinical literature. Int. J. Technol. Assess. Health Care 2002, 18, 1–10. [Google Scholar] [CrossRef] [PubMed]
  61. Tolsgaard, M.G.; Todsen, T.; Sorensen, J.L.; Ringsted, C.; Lorentzen, T.; Ottesen, B.; Tabor, A. International Multispecialty Consensus on How to Evaluate Ultrasound Competence: A Delphi Consensus Survey. PLoS ONE 2013, 8, e57687. [Google Scholar] [CrossRef] [PubMed]
  62. Díez-Vidal, A.; Martínez-Martín, P.; González-Muñoz, B.; Tung-Chen, Y. Point-of-care ultrasound in infectious diseases: Current insights and future perspectives. Clin. Infect. Dis. 2024, 79, 420–429. [Google Scholar] [CrossRef] [PubMed]
  63. The Royal College of Radiologists RCR. Ultrasound Training Recommendations for Medical and Surgical Specialties Third Edition Board of the Faculty of Clinical Radiology; BMUS: London, UK, 2017. [Google Scholar]
  64. Perez-Sanchez, A.; Johnson, G.; Pucks, N.; Soni, R.N.; Lund, T.J.S.; Andrade, A.J.; Le, M.-P.T.; Solis-McCarthy, J.; Wong, T.; Ashraf, A.; et al. Comparison of 6 handheld ultrasound devices by point-of-care ultrasound experts: A cross-sectional study. Ultrasound J. 2024, 16, 45. [Google Scholar] [CrossRef]
  65. Andersen, C.A.; Brodersen, J.; Rudbæk, T.R.; Jensen, M.B. Patients’ experiences of the use of point-of-care ultrasound in general practice–a cross-sectional study. BMC Fam. Pract. 2021, 22, 116. [Google Scholar] [CrossRef]
  66. Balmuth, E.A.; Luan, D.; Jannat-Khah, D.; Evans, A.; Wong, T.; Scales, D.A. Point-of-care ultrasound (POCUS): Assessing patient satisfaction and socioemotional benefits in the hospital setting. PLoS ONE 2024, 19, e0298665. [Google Scholar] [CrossRef]
Figure 1. Conceptual model of learning curve.
Systems 13 00591 g001
Figure 2. Causal diagram of the POCUS assessment model with all four assessment domains and learning curve.
Systems 13 00591 g002
Figure 3. Patient intake behavior. The model follows the behavior of the case study and exhibits an increase in intake for the second semester of the year.
Systems 13 00591 g003
Figure 4. The red dotted signal “reached proficiency status” is at 1, indicating that patients will not be sent to the radiology department.
Systems 13 00591 g004
Figure 5. Learning curve for base scenario of 80% success rate.
Systems 13 00591 g005
Figure 6. Behavior of the learning curve and retraining for base scenario of 80% success rate.
Systems 13 00591 g006
Table 1. Domains used for the evaluation of medical devices or medical equipment.
ReferenceHealth ProblemsTechnicalSafetyClinical EffectivenessEconomicEthicalOrganizationSocialLegalTrainingLearning Curve
HTA Core Model, [3]111111111
AdHopHTA Model, [4]111111111
Sampietro-Colom et al., 2012, [10]1 111 1 1
Miniati et al., 2014, [11] 11 1 1
Ritrovato et al., 2015, [12] 111111111
Miniati et al., 2014, [13] 1111 1 1
Frosini et al., 2016, [14] 1111
Ivlev et al., 2015, [15] 1
Martelli et al., 2016, [16] 1 111111
Martelli et al., 2017, [17] 1 111111
Muñoz 2016, [18] 1 1
Margotti et al., 2013, [19] 111
Grundy 2016, [20] 111 1
Pecchia et al., 2013, [21] 1 1
Lasorsa et al., 2019, [22]1 1 1 1
Hasegawa et al., 2020, [23] 1
Moshi et al., 2020, [24]111111111
Schreier et al., 2020, [25]1111 1
This study 111 1 11
Table 2. Main variables of the causal diagram.
VariableDescriptionRepresentation in the Model
Learning curveGraphically represents the relationship between learning effort (example: time, repetitions) and learning outcomes [57].LC-CUSUM and CUSUM control charts.
S t = 0 , S t 1 + W t
Demand of patients with suspected denguePatients who are admitted to the emergency department with fever and whose attending physicians have considered a diagnosis of dengue virus disease.Poisson distribution of the prospective cohort study data, in simulation time units of days. The function used in STELLA® generates a series of random numbers that fit a Poisson distribution.
Anatomical sitesIt refers to the anatomical location for taking the image or video.There is greater difficulty in achieving competence in certain anatomical points; in this sense, the model represents a single learning curve that should be the one that represents the highest degree of difficulty.
Image qualityIt refers to the image quality measurement scale of American College of Emergency Physicians [58].Image quality influences the success or failure of image interpretation and, consequently, the construction of the learning curve.
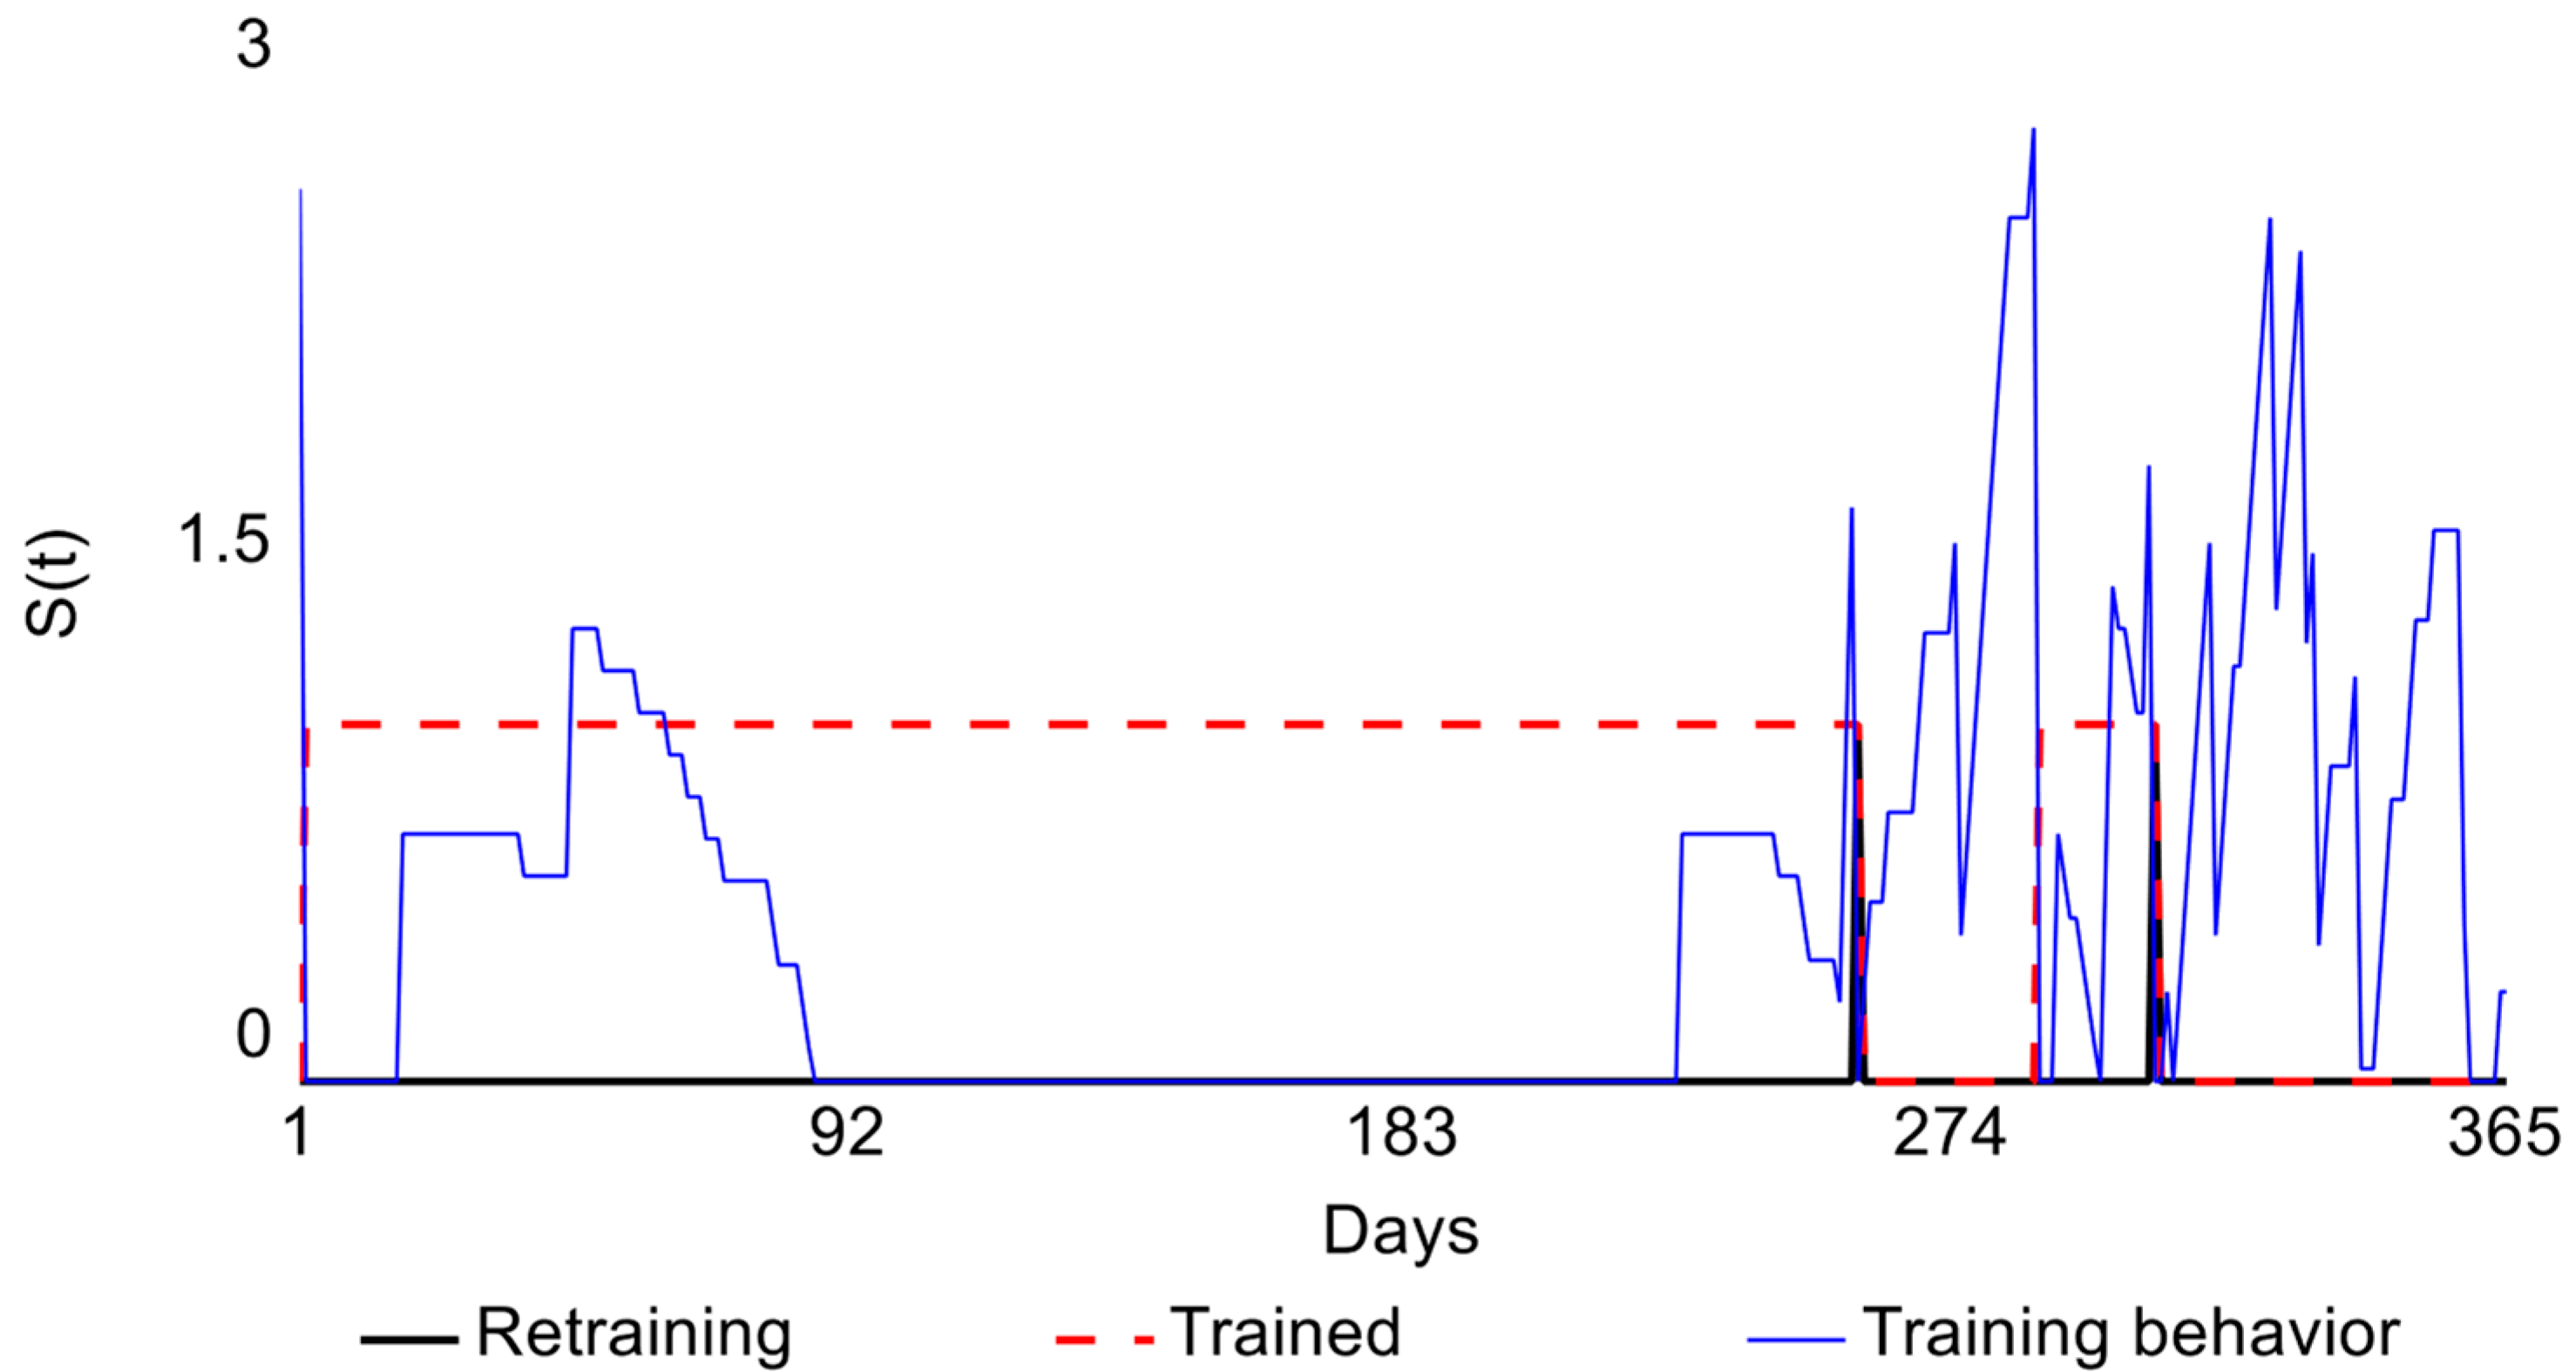
RetrainingMoment at which the physician loses competence during the monitoring stage.Point at which the limit (H) is exceeded on the CUSUM control chart.
Proper classification of dengue with POCUSRepresented by true negatives (POCUS diagnostic result as absence of plasma leak when the patient does not have this condition) and true positives (POCUS diagnostic result as presence of plasma leak when the patient actually has this condition).Calculated from sensitivity and specificity values presented in the literature [59]; see Equations (4)–(7).
Re-entry
reconsultation for follow-up
It is defined as patient admissions/visits to the emergency department for the same reason.
Although the prospective cohort study did not include information on readmissions, the simulation allows the user to enter this parameter.
Proportion of consultations.
Severity of patient conditionThis refers to the therapeutic approach followed for patients confirmed with IgM-positive dengue:
- Recovered at home.
- Recovered after hospitalization.
- Immediately referred to another hospital with a higher level of complexity.
- Recovered at another hospital.
Represented by means of the corresponding rates and flows taken from the cohort study.
CostsFixed costs: purchase price of equipment used in the emergency department, annual maintenance. Variable costs: costs of provisions needed for ultrasound, training courses and retraining, income from providing ultrasound procedures.Reference values of the Colombian market.
Number of physiciansIt refers to the number of emergency service physicians who will be trained.Number of emergency department physicians who were trained.
Consultation timeCalculated as the reference time for performing POCUS-Dengue, FAST, and gynecological emergency ultrasounds.Probability distribution according to the behavior of the cohort study times and reference values.
Demand of gynecological emergencyDemand from patients admitted to the emergency department with a diagnosis associated with gynecological emergencies.Poisson distribution of data from prospective cohort study conducted at a first-level care Public Health Institution in Cali, in simulation time units of days.
The function used in STELLA® generates a series of random numbers that fit a Poisson distribution.
Demand of trauma diagnosis (FAST)Demand from patients admitted to the emergency department with diagnoses associated with abdominal trauma.
EconomicBenefit–cost relationship
summation of benefits, brought to the present, divided by the sum of the also discounted costs.
B e n e f i t c o s t   r e l a t i o n s h i p = P r e s e n t   V a l u e   o f   b e n e f i t P r e s e n t   V a l u e   o f   c o s t
>1: means that revenues exceed costs, so the project is profitable.
=1: means there are neither profits nor losses; the project is not viable.
<1: indicates that costs exceed benefits, making the project unprofitable.
Patient safetyRelationship between false positives and false negatives within the total population. Although FP and FN are complementary indicators to specificity and sensitivity, they are considered patient safety indicators because adverse effects can occur from them. In other words, an FN could lead to an increase in the patient’s severity. F P = P a t i e n t s   w i t h o u t   l e a k a g e V N   c a l c u l a t e d   T o t a l   p a t i e n t s
F N = P a t i e n t s   w i t h   l e a k a g e V P   c a l c u l a t e d   T o t a l   P a c i e n t s
Clinical effectivenessAccuracy of POCUS technology.
Sum of true negatives and true positives within the total population
A c c u r a c y = V N   c a l c u l a t e d + V P   c a l c u l a t e d T o t a l   P a c i e n t s  
OrganizationalPOCUS equipment availability.
Relationship between calendar hours minus equipment occupancy hours and calendar hours. The analysis was conducted in the emergency department, where the calendar hours are 24 h per day.
A v a i l a b i l i t y = H c a l e n d a r H o c c u p a n c y     H c a l e n d a r
Table 3. Results of the sensitivity analysis.
VariableScenario 0
No Learning Curve
177 Patients
Scenario 1
with Learning Curve
177 Patients
Learning Curve (Success Probability)50%80%100%
Cost–Benefit Ratio0.540.020.20.78
Number of Retrainings0120
Patient Safety (Total = FN + FP)Cannot be determined for the hospital’s specific conditions109430
Clinical Effectiveness (Diagnostic Accuracy %)Cannot be determined for the hospital’s specific conditions38.4%75.7%100%
Organizational (Availability of POCUS, (range))95.1–99.9%95.1–99.9%95.1–99.9%95.1–99.9%
Disclaimer/Publisher’s Note: The statements, opinions and data contained in all publications are solely those of the individual author(s) and contributor(s) and not of MDPI and/or the editor(s). MDPI and/or the editor(s) disclaim responsibility for any injury to people or property resulting from any ideas, methods, instructions or products referred to in the content.

