Abstract
Remanufacturing in reverse logistics can not only support sustainable development but also provide a tractable way to achieve carbon neutrality. This study evaluates whether an original equipment manufacturer (OEM) should remanufacture outsource or authorize this reverse channel activity in the presence of government subsidies. Additionally, the model considers the equilibrium acquisition quantities, collection rates, prices, and effects of government subsidy under three reverse channel options: centralizing remanufacturing, outsourcing remanufacturing, and authorization remanufacturing. The analysis indicates that (i) a centralized approach with manufacturing and remanufacturing operations under a fixed government subsidy is always in the interest of the supply chain; (ii) that for the profit-maximizing third-party remanufacturer (3PR), the differentials in variable collection costs drive the strategy choice, and that a higher fixed scaling parameter of the collection cost favors outsourcing; and (iii) when the government aspires to reduce environmental effects and subsidy payments, the OEM and government have different reverse channel choice preferences. Surprisingly, profitability and environmental goals align under a high consumer acceptance of the remanufactured product. This paper extends the understanding of the remanufacturing strategy of an OEM and provides new insights on which reverse channel is optimal.
1. Introduction
Forced by increasing environmental pollution and resource scarcity, many governments have intensified green legislation and financial instruments regarding environmental protection, thereby leading to widespread concerns of remanufacturing operations [1]. Remanufacturing, a powerful tool to reduce environmental footprints and achieve carbon neutrality, is the process of dismantling, cleaning, and recycling end products [2]. Many companies active in the remanufacturing business have yielded satisfactory results [3]. For instance, Apple has focused on the collection of used iPhones and expanded its global recycling programs, thereby creating a truly closed-loop supply chain (CLSC) for recycled materials. The remanufacturing practices of the world’s leading automotive manufacturers, such as Mercedes-Benz, Volkswagen, Cummins, Toyota, Volvo, Bosch, and Renault, show that the remanufacturing of end-of-life automotive parts can make full use of the residual value of used products, save energy consumption, reduce pollutant emissions and extend product life cycles. By remanufacturing parts, it is possible to generate competitive pricing, create CO2 savings, save production materials, and realize considerable cost savings by recapturing value added to used materials.
This research is motivated by the coordination issues faced by many OEMs that have both manufacturing and remanufacturing operations in the presence of government subsidies. Although OEMs have technology and brand advantages in remanufacturing options, the combination of used product collection logistics and production processes inevitably brings concerns about transportation and inventory costs. In practice, three reverse channel options are available for an OEM: the centralizing channel model (Model C), outsourcing channel model (Model O), and authorization channel model (Model A). In Model C, an OEM performs the collection and remanufacturing operations, while also providing new products [4,5]. Caterpillar, for instance, established a remanufacturing division that announced a target for remanufacturing to increase sales and revenues from remanufactured products by 25% from 2018 to 2030 [6]. In Model O, an OEM performs the marketing of the remanufactured products whereas the third-party remanufacturer (3PR) provides the collecting and remanufacturing processes. As proof, Dell, known for its successful direct sales business strategy, outsources its product remanufacturing operations and sales [7,8]. Furthermore, Model A refers to the operation where the 3PR gets the proprietary rights from the OEM and resells remanufactured items without the involvement of the OEM. Industry leaders, such as IBM and Cisco, have chosen remanufacturing authorization as the strategy to enter the secondary market [9].
The government has the social responsibility for environmental protection and sustainable development. As a strong incentive for boosting domestic demand and promoting green industries, government subsidy plays an increasingly prominent role in CLSC operation decisions. For example, the United Kingdom’s government offers a series of grants to support collaboration among various entities to foster the development of green technology [10,11]. In recent years, the Chinese government has funded the development of green product development with many subsidy policies [12]. Demonstrating this, China’s Ministry of Finance announced that new energy vehicles purchased from 1 January 2024 to 31 December 2025 will be exempted from vehicle purchase tax (https://www.gov.cn/zhengce/zhengceku/202306/content_6887734.htm, accessed on 12 July 2025).
This study is motivated by the growing significance of remanufacturing in addressing global sustainability challenges, especially under increasing environmental regulations and resource constraints. While prior literature has examined remanufacturing strategies, there remains a critical gap in understanding how government subsidies interact with reverse channel choices—centralized, outsourced, or authorized—to affect both economic and environmental outcomes. Existing works rarely explore the strategic dynamics among OEMs, third-party remanufacturers, and governments in this context. In reality, governments often intervene to encourage sustainable practices, but their impact on OEMs’ operational decisions remains unclear. This paper fills this gap by developing a game-theoretic model that simultaneously considers reverse channel selection and government subsidy optimization. Our approach provides both theoretical and practical insights into how reverse logistics strategies should be structured to balance profitability with environmental benefits. Thus, this research investigates the impact of government subsidies for remanufactured products on pricing and reverse channel selection in CLSC and searches for reasons behind them. Specifically, this work seeks to answer the following questions:
- (1)
- What are the optimal product quantities, sales prices, collection rates, and profits of these three reverse channel selection models?
- (2)
- Could one of the reverse channel selection models dominate the other models in both supply chain profit and social welfare?
- (3)
- How do government subsidies affect the environment and the performance of each model?
To examine the above questions, this paper develops a game-theoretic model that combines an OEM, a 3PR, a government, and end consumers. We integrate the context of the CLSC with separate manufacturing and remanufacturing operations into the competitive pricing decision for new and remanufactured products. Moreover, we analyze and compare the equilibrium acquisition quantities, collection rates, prices, and effects of government subsidy under three reverse channel models from the perspective of the supply chain players. We discuss the impact of government subsidy on the overall profitability of the players, social welfare, and environmental protection. A numerical example is presented to explore the pricing behavior in various scenarios. Our analysis indicates the following: (i) A centralized approach with manufacturing and remanufacturing operations under fixed government subsidy is always in the interest of both the consumer surplus and supply chain profit. (ii) For the profit-maximizing 3PR, the differentials in variable collection costs drive strategy choice, and the higher fixed scaling parameter of the collection cost favors outsourcing. (iii) When the government aspires to reduce environmental effects and subsidy payments, the OEM and government have different reverse channel preferences. However, profitability and environmental goals align when consumers have a high acceptance of remanufactured products. We obtain intriguing new results that present a detailed explanation for real-world observations regarding how to mitigate the conflicts between profitability and environmental goals.
The remainder of this research is organized as follows. The literature review appears in Section 2. Section 3 is devoted to the model assumptions, notation, consumers’ purchase behavior, and demands. Section 4 characterizes each model’s optimal choices and evaluates the various reverse channel selection models in terms of profitability. In Section 5, we investigate the government’s optimal subsidy and present additional numerical examples, which are followed by the conclusions and findings in Section 6. Proofs of remarks and propositions are provided in Appendix A.
2. Literature Review
Atasu et al., Örsdemir et al. and Peng et al. provide extensive reviews of related literature on remanufacturing supply chains [13,14,15]. This section concentrates specifically on the three characteristic features that position the research in this literature: (a) reverse channel selection for remanufacturing, (b) pricing and product quantity decisions in a CLSC, and (c) government subsidies for remanufacturing operations.
Foundational research by Abbey and Guide Jr [8] establishes core remanufacturing operational challenges, while Atasu et al. [13] frame strategic trade-offs in product recovery. In the area of channel selection regarding remanufacturing operations, a stream of literature focuses on optimizing the reverse channel choice from the perspective of supply chain profit [16,17,18]. The general authorizing vs. outsourcing remanufacturing process is the subject of a vast amount of study in channel selection [12,19,20]. For instance, Zou et al. compare two alternative remanufacturing operations where the OEM can either authorize the 3PR to remanufacture or outsource remanufacturing processes to the 3PR [21]. More recently, Shi et al. have identified insights connecting internal remanufacturing processes and channel choice [6]. The results reveal that a centralized company with combined manufacturing and remanufacturing streams is intuitively preferred in direct selling. Ding et al. focus on the trade-offs between outsourcing and authorization strategies, emphasizing their impacts on stakeholder welfare [22]. Huang et al. explore global remanufacturing strategies and find that licensing may outperform self-operation under specific cost structures [23]. Wang et al. highlight the role of blockchain technology in mitigating consumers’ perceived risks regarding remanufactured products, showing that appropriate adoption strategies can improve remanufacturing rates and lead to triple-win outcomes for OEMs, recyclers, and the environment under specific conditions [24]. Zhou et al. propose a two-stage acquisition and remanufacturing method that incorporates demand and quality information updating, demonstrating improved adaptability and profit performance under uncertainty in reverse logistics [25]. The remanufacturing process in this study connects three sides of the supply chain: an OEM, a 3PR, and the government. Unlike these studies, our framework uniquely integrates government subsidies as a determinant in OEM channel strategy.
Another related stream of literature focuses on the pricing and product quantity decisions in a CLSC from game theoretical perspectives [26]. Taleizadeh and Sadeghi apply three game theory models (Nash, Nash-Stackelberg-first, and Nash-Stackelberg-second) to determine optimal pricing strategies in the competitive reverse supply chains [27]. Hosseini-Motlagh et al. study both the acquisition and transfer prices and analyze the effect of collection disruptions on the efficiency of a reverse supply chain with dual collection channels using a game theoretic approach [28]. Collection rates and pricing decisions about the remanufactured and new products are the main topics in two echelon supply chain system [29]. In an early work, Akan et al. provide a functional characterization of the supply chain members’ equilibrium pricing, production, and inventory solutions associated with a small optimality gap [30]. Mitra analyzes an economic model, in which a monopolist firm distributes various products to quality-conscious primary consumers and price-sensitive secondary consumers [31]. Ma et al. have studied pricing schemes under the coexistence of trade-old-for-new and trade-old-for-remanufactured models in CLSC [32]. The results show that providing these two programs simultaneously is not always profitable. Liao and Luo formulated the optimal pricing decision and green technology investment, then compared the impacts of the two allocation rules on these business decisions and total emissions [33]. In a similar spirit as He et al. [34], we contribute by not only comparing centralized vs. decentralized remanufacturing approaches but also drawing managerial insights into how government subsidy and remanufacturing equilibrium outcomes are affected by subsidy and product flows. Zhou and Li develop a game-theoretical model showing how vertical competition and consumer context jointly influence manufacturers’ product design decisions in closed-loop supply chains [35]. Cao et al. develop a discrete choice model to optimize remanufacturing technology portfolios, helping remanufacturers balance profitability and ESG goals amid EOL product quality variability [36]. Our contribution extends this stream by integrating government-subsidized remanufacturing volumes into pricing equilibria across three channel structures.
This paper is also connected with the literature on government policy, which incentivizes sustainable development in the supply chain [37,38]. In this regard, Liu et al. have established a quality-based pricing and recycling competition model in a dual-channel for waste electrical and electronic equipment [39]. Their analysis reveals that, even if the quality level of waste is quite high, the marginal impact of government subsidy is not promising. Huang et al. confirm the importance of government intervention as an approach to promoting green innovation and environmental protection [40]. Wang et al. develop a collaborative evolution process and define the marginal utility of government financial policy from the perspective of the straw power supply chain, with their results indicating that strategic government subsidy can support the development of a straw power generation system [41]. Khorshidvand et al. highlight the value of collaborative models under government subsidies [42]. Most operations management papers assume that the government subsidy is exogenous, without considering varying subsidy levels. By studying the decision problems faced by an OEM and the 3PR, we provide several new insights into how optimal government release subsidies should be adapted to the factors across diverse channels.
This paper develops a comprehensive game-theoretic model that combines all of the relevant aspects in a rigorous manner. We integrate the context of different remanufacturing modes into the competitive pricing decisions for new and remanufactured products. Moreover, we consider a government subsidy based on remanufactured product consumption and explore the optimal government policy with the purpose of maximizing players’ profit and social welfare under different remanufacturing processes. A detailed analysis is provided to elucidate the impact of government subsidy on equilibrium solutions. Despite using an approach that is in line with the existing research, we get intriguing new results that provide a possible explanation for real-world observations regarding the relationship between profitability and environmental goals. From the above analysis, we discover that our research questions are unstudied in the current literature. Table 1 summarizes the factors that are considered in the most relevant literature and our paper.

Table 1.
Factors considered in the literature and our paper.
3. Model and Initial Analysis
In this section, we outline basic model assumptions and consumers’ purchase decisions in the remanufacturing CLSC context.
3.1. Model Description and Assumptions
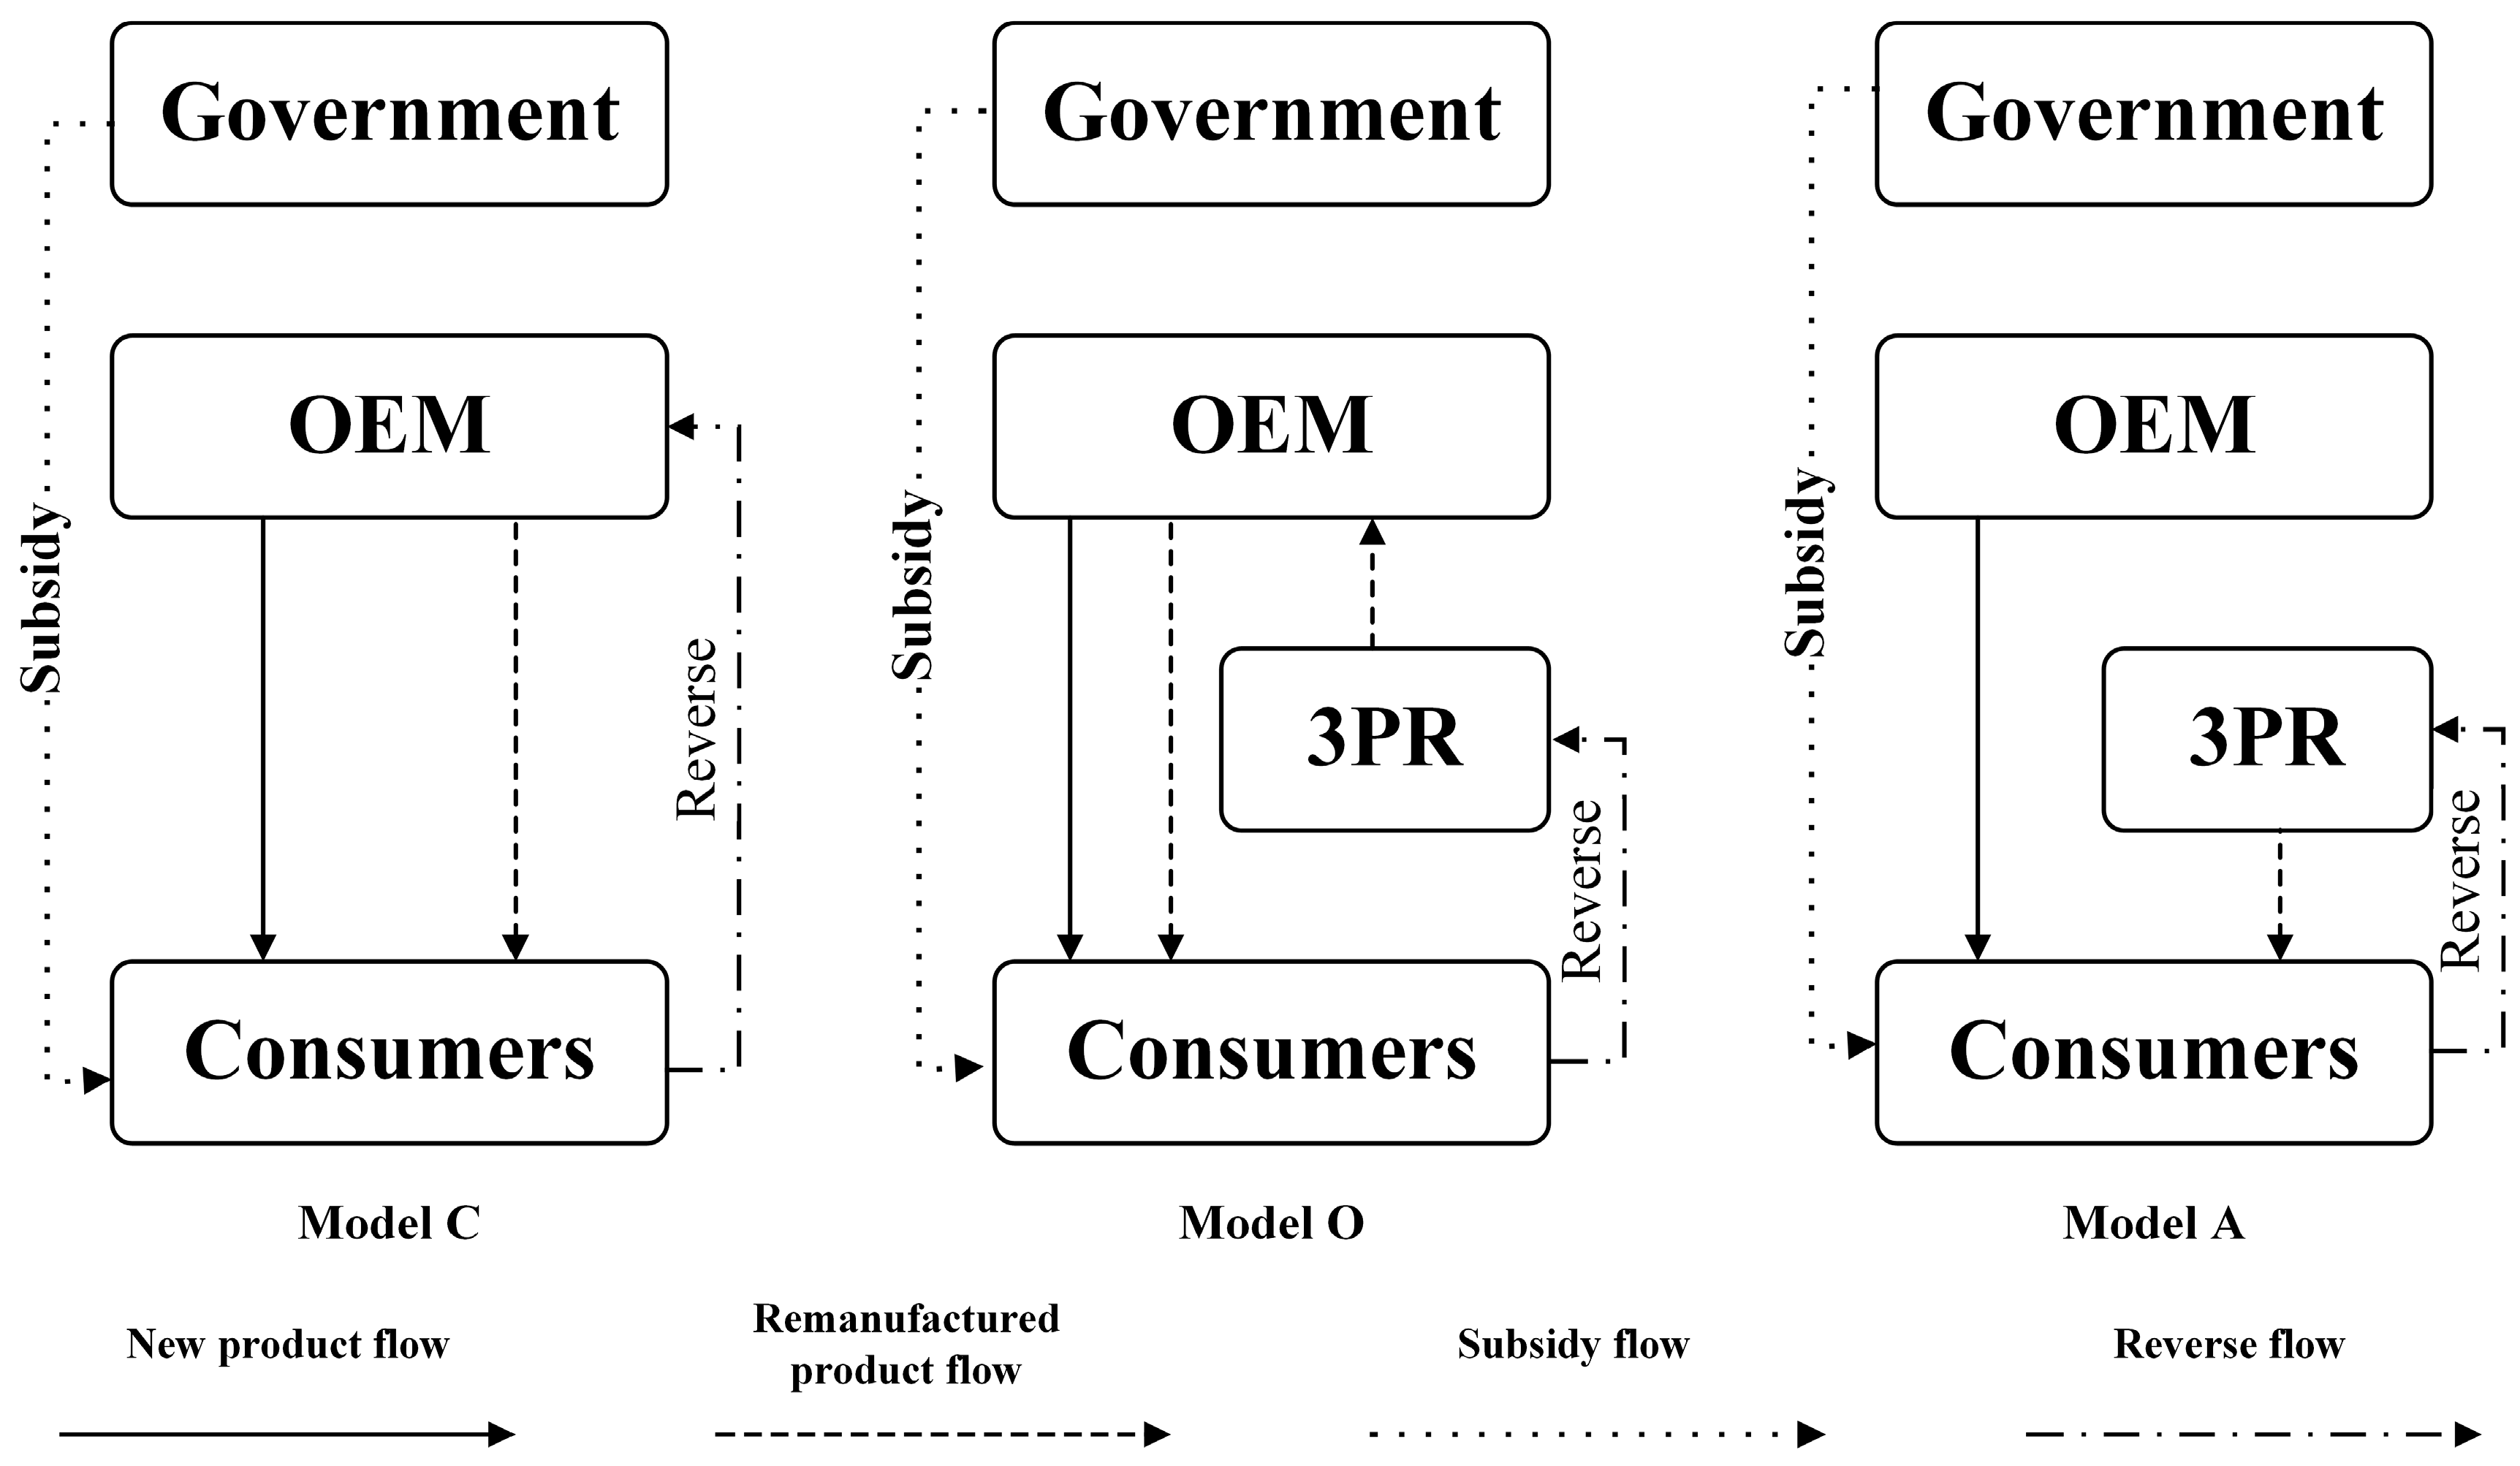
We consider three alternative reverse channel models in which the supply chain players collect used products, remanufacture products, and then sell to a downstream market. The three models (Model C, Model O, and Model A) differ in the processes needed to perform the manufacturing and remanufacturing. Model C implies that the OEM centralizes the manufacturing of new products, the collection of used products, and the remanufacturing marketing operations, whereas Model O denotes that the OEM outsources remanufacturing operations to the 3PR but retails both the new and remanufactured products. The remanufacturing process is subcontracted to the 3PR, and the OEM pays the 3PR an outsourcing fee. In contrast to these two models, Model A assumes that the OEM charges a patent license fee to allow the remanufacture of EOL products and market the remanufactured products. Figure 1 provides a visual illustration of the three reverse channel selection models. Table 2 summarizes the notation for variables used throughout this paper. An asterisk attached to a variable denotes the equilibrium solution for the given scenario.

Figure 1.
Reverse channel models in a CLSC with government subsidy.
Table 2.
Notations.
We model a dyadic supply chain with one OEM and one possible 3PR that sells new products (identified by subscript n) as well as a remanufactured version of used products (identified by subscript r), and determines their respective sales prices, and . The pair of sales prices interact with consumer preferences regarding product value to determine the market demand for each item. A consumer’s willingness-to-pay (WTP) for a new product with value is heterogeneous and uniformly distributed in the interval [0, 1]. We assume consumers’ WTP for remanufactured products is lower than that for new products, which indicates a vertical differentiation between the two products. Parameter models the consumer perception that the remanufactured product is inferior to the new product value. A consumer derives one of the following two net utility levels and from purchasing a new or remanufactured product, respectively. In addition, the government subsidizes the consumer who purchases the remanufactured item at s per unit to achieve sustainable development.
A consumer will purchase the type of product that conveys higher net utility, and no consumer will purchase if both types provide negative utility. We can derive the linear inverse demand functions through simple integral calculations, as commonly seen in the previous literature [14,43]. Normalizing the market scale of new and remanufactured products to 1 leads to the following linear inverse demand functions for the two product types:
Consistent with previous studies [13,32], we incorporate a cost component that captures economies or diseconomies of production volume and we assume that the unit cost of the remanufactured product is lower than that of the new product, i.e., . Clearly, some parts and components can be recycled, thereby avoiding upstream procurement issues, so the process of remanufacturing is always less expensive than manufacturing a new item. The cost of collecting end-of-life (EOL) products is assumed to be convex, increasing with the collected volume. Without loss of generality, we assume a collection cost function from previous research, where is the collection rate and is the scaling parameter [44].
3.2. Model Formulation and Solution
In this subsection, we analyze three remanufacturing models, C, O, and A. We hereafter utilize I = C, O, A to define the equilibrium solutions in the reverse channel selection models. In the following, we first center on the analysis of three remanufacturing models and derive the equilibrium outcomes. After that, we compare the equilibrium solutions and conduct parameter analysis to identify the optimal remanufacturing model from the perspectives of the OEM and the 3PR, respectively. For modeling convenience, we consider a single-period case, in which both new and remanufactured products are being sold in the same period.
3.2.1. Benchmark Centralized Model (Model C)
In the benchmark centralized model, the OEM sells new products and retains all remanufacturing operations simultaneously. In Model C, the OEM sets the quantity of the new products and decides the return rate of EOL products from market. From the demand functions of two product types, the optimization problem for Model C can be derived as follows:
Given the government subsidy , the OEM profit from selling new and remanufactured products is shown in the Equation (2). The terms represent sales profit from consumers who purchase new and remanufactured items and the collection cost. In addition, is necessary to ensure positive demands for both new and remanufactured products. The resulting equilibria of Model C are summarized in Table 2.
3.2.2. Outsourcing Model (Model O)
This part analyzes the outsourcing remanufacturing, in which the OEM finds an outside entity (the 3PR) to perform the remanufacturing processes. The sequence of events in Model O is as follows. The OEM, as the Stackelberg leader, sets the quantity of new products and pays the outsourcing fee. Then, the 3PR decides the return rate of EOL products from the market based on the given outsourcing fee. In this model, the Stackelberg optimization problem reduces to the following:
We solve the decision problems with backward induction to guarantee the sub-game perfect equilibrium. The equilibrium solutions are characterized analytically in Table 3.
Table 3.
Optimal solutions for models C, O, and A.
3.2.3. Authorization Model (Model A)
This part considers the authorization remanufacturing, in which the OEM manufactures new products and simultaneously charges patent license fees (paid by the 3PR). Both the collection of EOL products and the marketing of remanufactured products are performed by the 3PR. The sequence of events in Model A is as follows. The OEM, as the Stackelberg leader, sets the price per unit new product and the patent license fee per unit remanufactured product. Then, according to the license fee, the 3PR decides the collection rate of EOL products from the market. Then the Stackelberg optimization problem of Model A reduces to the following:
We solve the game by backward induction, with the mathematical details characterized in Table 3. To examine how government subsidy influences the alignment or conflict between the OEM and the 3PR, we compare the resulting equilibria of the three models in the following section.
4. Model Comparison and Parameter Analysis
In this section, we compare the optimal solutions under three reverse channel selection models and determine which choice is preferred by the OEM and the 3PR. To avoid the trivial case where the OEM and the 3PR have no incentive to undertake remanufacturing operations, we assume . Then we can examine the impact of the government subsidy on the equilibrium decisions, which are summarized in Table 4.
Table 4.
Impacts of the government subsidy on equilibrium outcomes.
Remark 1.
(a) The optimal price of the remanufactured product is increasing in the government subsidy; however, the government subsidy has no effect on the optimal price of the new product (i.e., );
(b) The quantity of remanufactured products is increasing in the government subsidy, and the quantity of new products is decreasing in the government subsidy (i.e., );
(c) The outsourcing fee, patent license fee, and collection rate of EOL products are increasing in the government subsidy (i.e., , and ).
Remark 1 indicates that the OEM charges a retail price for the new product that does not depend on the government subsidy. As the government subsidy increases, the supply chain player raises the retail price of the remanufactured product and increase total market coverage. Intuitively, a higher subsidy can cause price discrimination and weaken competition for new products. The OEM prefers an increase in government subsidy as this elevates demand and profit margin by more than enough to offset the loss of new products. It can be seen that a higher subsidy helps supply chain players to decrease the acquisition quantity of new products while expanding the acquisition quantity of remanufactured products and improving its profitability.
When the OEM chooses Model O (Model A), the outsourcing fee and the patent license fee per unit of remanufactured product increases with the subsidy. For the remanufactured product, a higher subsidy commands a higher outsourcing fee and patent license fee due to the retail price premium. These results align with the intuition that, when the subsidy increases, the players are more willing to improve the collection rate of EOL products to increase their net revenue share.
Next, we discuss how the government subsidy affects the supply chain’s performance under each channel selection model. Let , we then obtain the following result.
Remark 2.
(a) The OEM’s profit is increasing in government subsidy under three reverse channel models (i.e., );
(b) The 3PR’s profit is increasing in government subsidy (i.e., ); when , .
Remark 2 shows that a higher government subsidy increases both the probability of the OEM and 3PR, effectively making Model C a more suitable option for the OEM and making Model O a more attractive option for the 3PR. Furthermore, the impact of the government subsidy on the OEM’s revenue in Model A is smaller than that in Model O, and the impact in Model C is the largest. Consequently, the OEM’s profit increases more quickly with the government subsidy under the centralized model. This observation indicates that the centralizing model is highly influenced by the government subsidy. When the OEM has a strong power in its manufacturing and remanufacturing divisions, a higher government subsidy positively affects its profit.
The performance of the 3PR rises more steeply under outsourcing than under authorization model when is sufficiently large. This occurs because the 3PR can extract more value from the higher government subsidy when performing outsourcing remanufacturing than when conducting the remanufacturing itself. Specifically, in Model A, the sales revenue from remanufactured products is sufficient for the 3PR to overcome the production cost of the remanufactured items only when the scaling parameter of the collection cost is higher.
Next, we examine the optimal reverse channel selection model based on the three remanufacturing mechanisms from the perspectives of both the OEM and the 3PR. When the OEM adopts the different reverse channel selection models, the optimal pricing and ordering decisions for the supply chain members also change, leading to changes in its profit. Remark 3 describes the relationships of optimal quantities and profits under the three channel models.
Remark 3.
(a) Model A produces the highest quantity of the new products but Model C gives the highest quantity of the remanufactured products (i.e., and );
(b) Model C achieves the highest collection rate of end-of-life products (i.e.,);
(c) Model C can result in higher OEM profit than other channel models (i.e.,); the 3PR earns more profit in Model O than in Model A when the scaling parameter of the collection cost satisfies .
Remark 3(a) indicates that the optimal quantity of remanufactured products in the centralized reverse process (i.e., Model C) is higher than those in the decentralized processes. Moreover, in the decentralized processes, the optimal quantity of used product is lowest when the OEM chooses the authorization model. However, the quantity of remanufactured products is lower in Model O than Model C but higher than in Model A. Put another way, the OEM can strategically determine the license fee to control the quantity of used product by the 3PR, the 3PR would produce fewer products in Model A accordingly.
Remark 3(b) shows that a centralized OEM always collects more used products than either of the decentralized systems. When the 3PR engages in remanufacturing, it will invest more to collect more used products in Model O. In Model A, the OEM and the 3PR compete more fiercely in types of new and remanufactured products, and therefore the negative effect of intensifying competition leads to a lower collection rate of EOL products.
From Remark 3(c), we propose the following observations. First, for an OEM engaged in the remanufacturing process, the total profit is higher when the OEM chooses centralizing mode. For a centralized OEM, having full power over the new and remanufactured product distribution divisions is more profitable than controlling just the new product division. This leads to the OEM having a motivation to choose the centralized approach for conducting and selling new and remanufactured products. When remanufacturing operations are performed by the 3PR, the OEM tends to adopt the outsourcing model. The intuition behind this is that the OEM will enjoy the benefits of remanufacturing profits by setting a higher outsourcing fee. Second, Remark 3(c) states that, when the 3PR engages in remanufacturing operations, it is more beneficial for the 3PR to adopt the outsourcing model in order to maximize its profits when .
5. Discussion
This section characterizes how the government designs an appropriate subsidy for remanufactured products. Consistent with real-world practice, we focus on the situation where different objectives are achieved by the government with different financial policies [45,46]. The government may have different preferences affecting the subsidy provision, so conflict arises whether the focus is profit first or environmental protection first.
5.1. Social Welfare
In this subsection, we consider the total social welfare being composed of four divisions: consumer surplus, supply chain performance, government subsidy expenditure, and environmental impact.
(1) Consumer surplus . We identify the major factors that affect the consumer surplus, which comes from the surpluses from both the new product and the remanufactured product. Considering the government subsidy, each consumer surplus in the various reverse channel models can be expressed as follows:
We use to represent the consumer surplus in model i, where superscript . The consumer surplus in the three cases can be characterized as the following results when the players’ decisions reach a Nash equilibrium.
Proposition 1.
The optimal consumer surpluses in Models C, O, and A are, as follows, respectively:
Consumer surplus is a suitable metric to understand the basic economic rationale behind the remanufacturing process. Proposition 1 shows that remanufacturing achieves the highest consumer surplus when using Model C. This result has implications for remanufacturing programs in practice. From the perspectives of both the government and the firm, centralizing remanufacturing is in the consumers’ better interest. This observation makes sense because the OEM can extract a larger portion of the higher remanufactured consumer surplus when performing remanufacturing itself than when outsourcing or authorization to the 3PR.
(2) Total profit . The total profit is generated from the OEM’s sales revenue plus the 3PR’s sales revenue:
By solving , and simultaneously, we obtain the following proposition.
Proposition 2.
The total profit in Models C, O, and A are given by the following, respectively:
(3) Government subsidy for remanufactured products. We formulate the government subsidy as follows:
We calculate the government subsidies in the three models and obtain the following proposition.
Proposition 3.
The optimal government subsidy in Models C, O and A can be denoted as follows, respectively:
Government subsidies create an incentive for supply chain players to improve the restorative capabilities of the remanufacturing operation. Proposition 3 shows that the increase in remanufacturing capacity requires more financial support from the government in Model C. In general, the government subsidy associated with authorization model is relatively small.
(4) Environmental impact . Following Ovchinnikov et al. and Zou et al. [21,47], we analyze the environmental impacts of new products and remanufactured products. Let parameter denote the unit environmental effect of new products and parameter represent the unit environmental effect of remanufactured products. In this case, the environmental impact is given as follows:
We can calculate the environmental impacts of new products and remanufactured products in the three models to get the following proposition.
Proposition 4.
The optimal environmental impacts in Models C, O, and A can be denoted as follows, respectively:
Let , when we have ; otherwise, . Proposition 4 indicates that the ordinal relationship of the environmental impacts in the three reverse channel selection models is associated with consumers’ willingness to pay per unit of remanufactured product. When the acceptance of the remanufactured product is sufficiently higher (), it is more environmentally friendly to perform remanufacturing operations through the OEM’s channel. The preceding analysis also reveals a conflict between profitability and environmental performance, at least for sufficiently low . When the government prioritizes environmental protection, the OEM will utilize Model A when .
(5) Social welfare . The total social welfare of each model can be given as follows:
Equation (21) shows that social welfare includes consumer surplus plus total profit from the supply chain, minus both the environmental impact and subsidy expenditure. The social welfare in different reverse channel selection models is given by the following proposition.
Proposition 5.
The total social welfare in Models C, O and A can be denoted as follows, respectively:
5.2. Government Subsidy
After obtaining the social welfare, we first examine the impact of some parameters on the optimal consumer surplus, supply chain profit, government subsidy for remanufactured products, and the environmental impacts. To characterize the impact of government subsidy on consumer surplus and total profit in three models, we examine the first-order conditions of and with respect to s, yielding the following remark.
Remark 4.
The increase in government subsidy will benefit the supply chain performance and increase the consumer surplus. In addition, Model C can generate more consumer surplus and total performance from an increasing government subsidy (i.e., , ).
When the associated government subsidy for remanufactured products increases, the more intense competition between new and remanufactured products leads to lower retail prices and higher consumer surplus. Therefore, a higher government subsidy can benefit both the supply chain and the referred consumers. Similarly, remanufactured products become more profitable as the government subsidy increases. A centralized remanufacturing operation, having full control over the pricing decisions of all new and remanufactured products, is therefore more profitable than either decentralized system.
Next, we answer the following question: “How does the government subsidy affect the government’s expenditure and environment?” By examining the first-order conditions of government subsidy expenditure and environmental impact with respect to , we have the following remark.
Remark 5.
(a) Increase in government subsidy causes a greater expenditure of government, especially in Model C (i.e., ).
(b) If , an increase in government subsidy increases the environmental impacts, especially in Model C (i.e., if , ).
Intuitively, Remark 5 shows that raising the government subsidy to support remanufactured products will increase the government’s expenditure. The expenditure is highest if the firm adopts the centralization of remanufacturing operations rather than using outsourcing or authorization operations.
Remark 5 also reveals that increases in the subsidy will lead to an adverse environmental outcome when the consumer acceptance of remanufactured products is relatively high. This is because, as Proposition 4 indicates, the environmental influence is not only connected with the demand for remanufactured items but is also associated with the demand for new items. Although a higher subsidy will reduce the demand for new products, it also leads to higher demands for remanufactured products.
The regions corresponding to Models C, O, and A are illustrated in Figure 2. Figure 2 reveals an interesting implication with respect to the willingness to pay for unit remanufactured products. Specifically, when consumers’ willingness to pay for remanufactured products is relatively low, any increase in subsidy will result in a better environmental outcome in three reverse channel selection models. Notice that the feasible region of parameter θ that can reconcile the goal of environmental protection in Model C is larger than that in Model O and Model A. In this way, the government financial policy design not only depends on the optimal subsidy but is also associated with the reverse channel selection model the firm chooses. From a policy-making perspective, this indicates that governments can more effectively target subsidies based on the remanufacturing structure. For instance, centralized remanufacturing (Model C) provides greater flexibility in aligning environmental goals with policy tools.
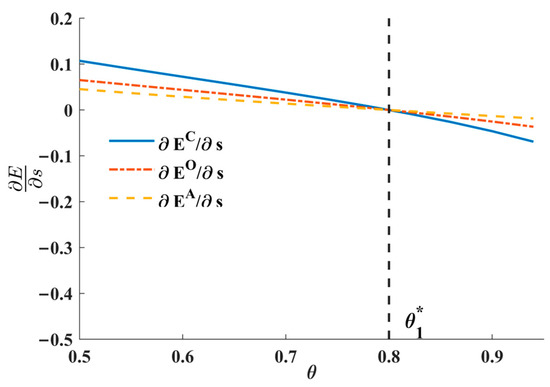
Figure 2.
Effects of and on environmental protection.
In the following, we concentrate on investigating optimum government subsidy in different cases. According to the aforementioned general solutions for the OEM and 3PR, we analyze the optimal subsidy for three reverse channel selection models. On the basis of objective functions of total social welfare for three models, we can easily derive the following proposition.
Proposition 6.
where .
When the OEM adopts Model C, the government’s optimal subsidy is as follows:
When the OEM adopts Model O, the government’s optimal subsidy is as follows:
When the OEM adopts Model A, the government’s optimal subsidy is as follows:
Proposition 6 indicates that the market acceptance of the remanufactured product plays a crucial role in the government subsidy policy. The direct observation is that any increase in consumer willingness-to-pay for the remanufactured item results in the increase of the relative advantage of the remanufacturing strategy among all models. Conversely, the government should not offer any subsidy when the consumer willingness-to-pay for the remanufactured product is sufficiently low () because remanufacturing programs cannot reap any profit or produce any social welfare.
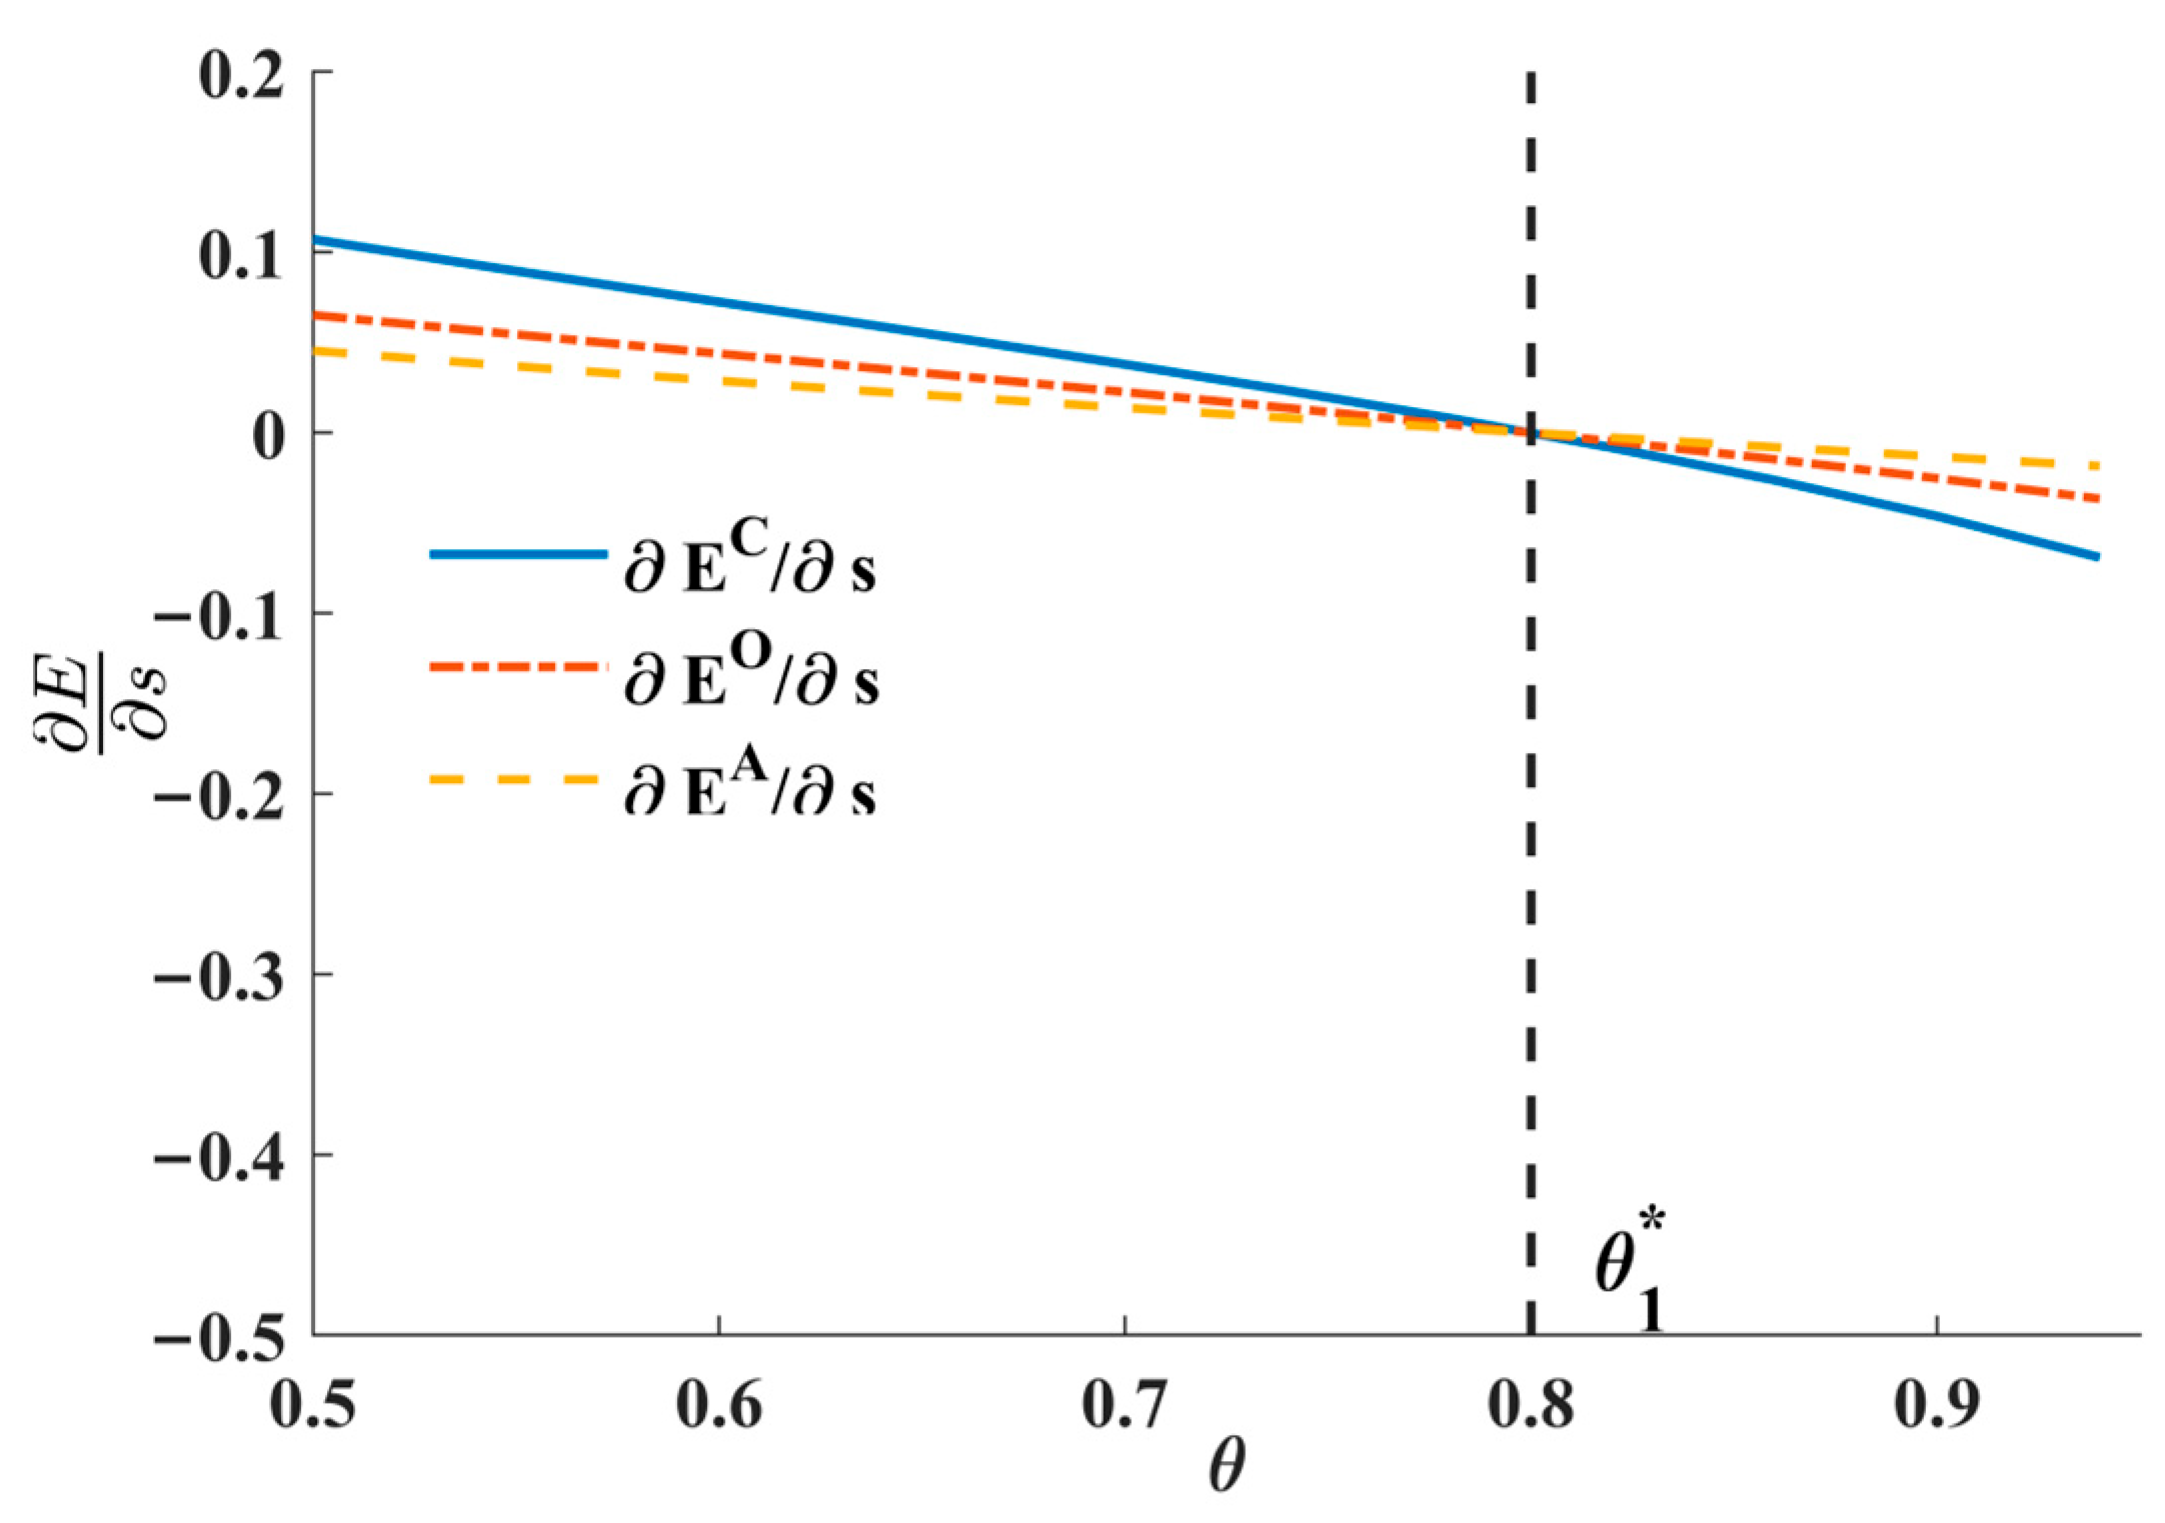
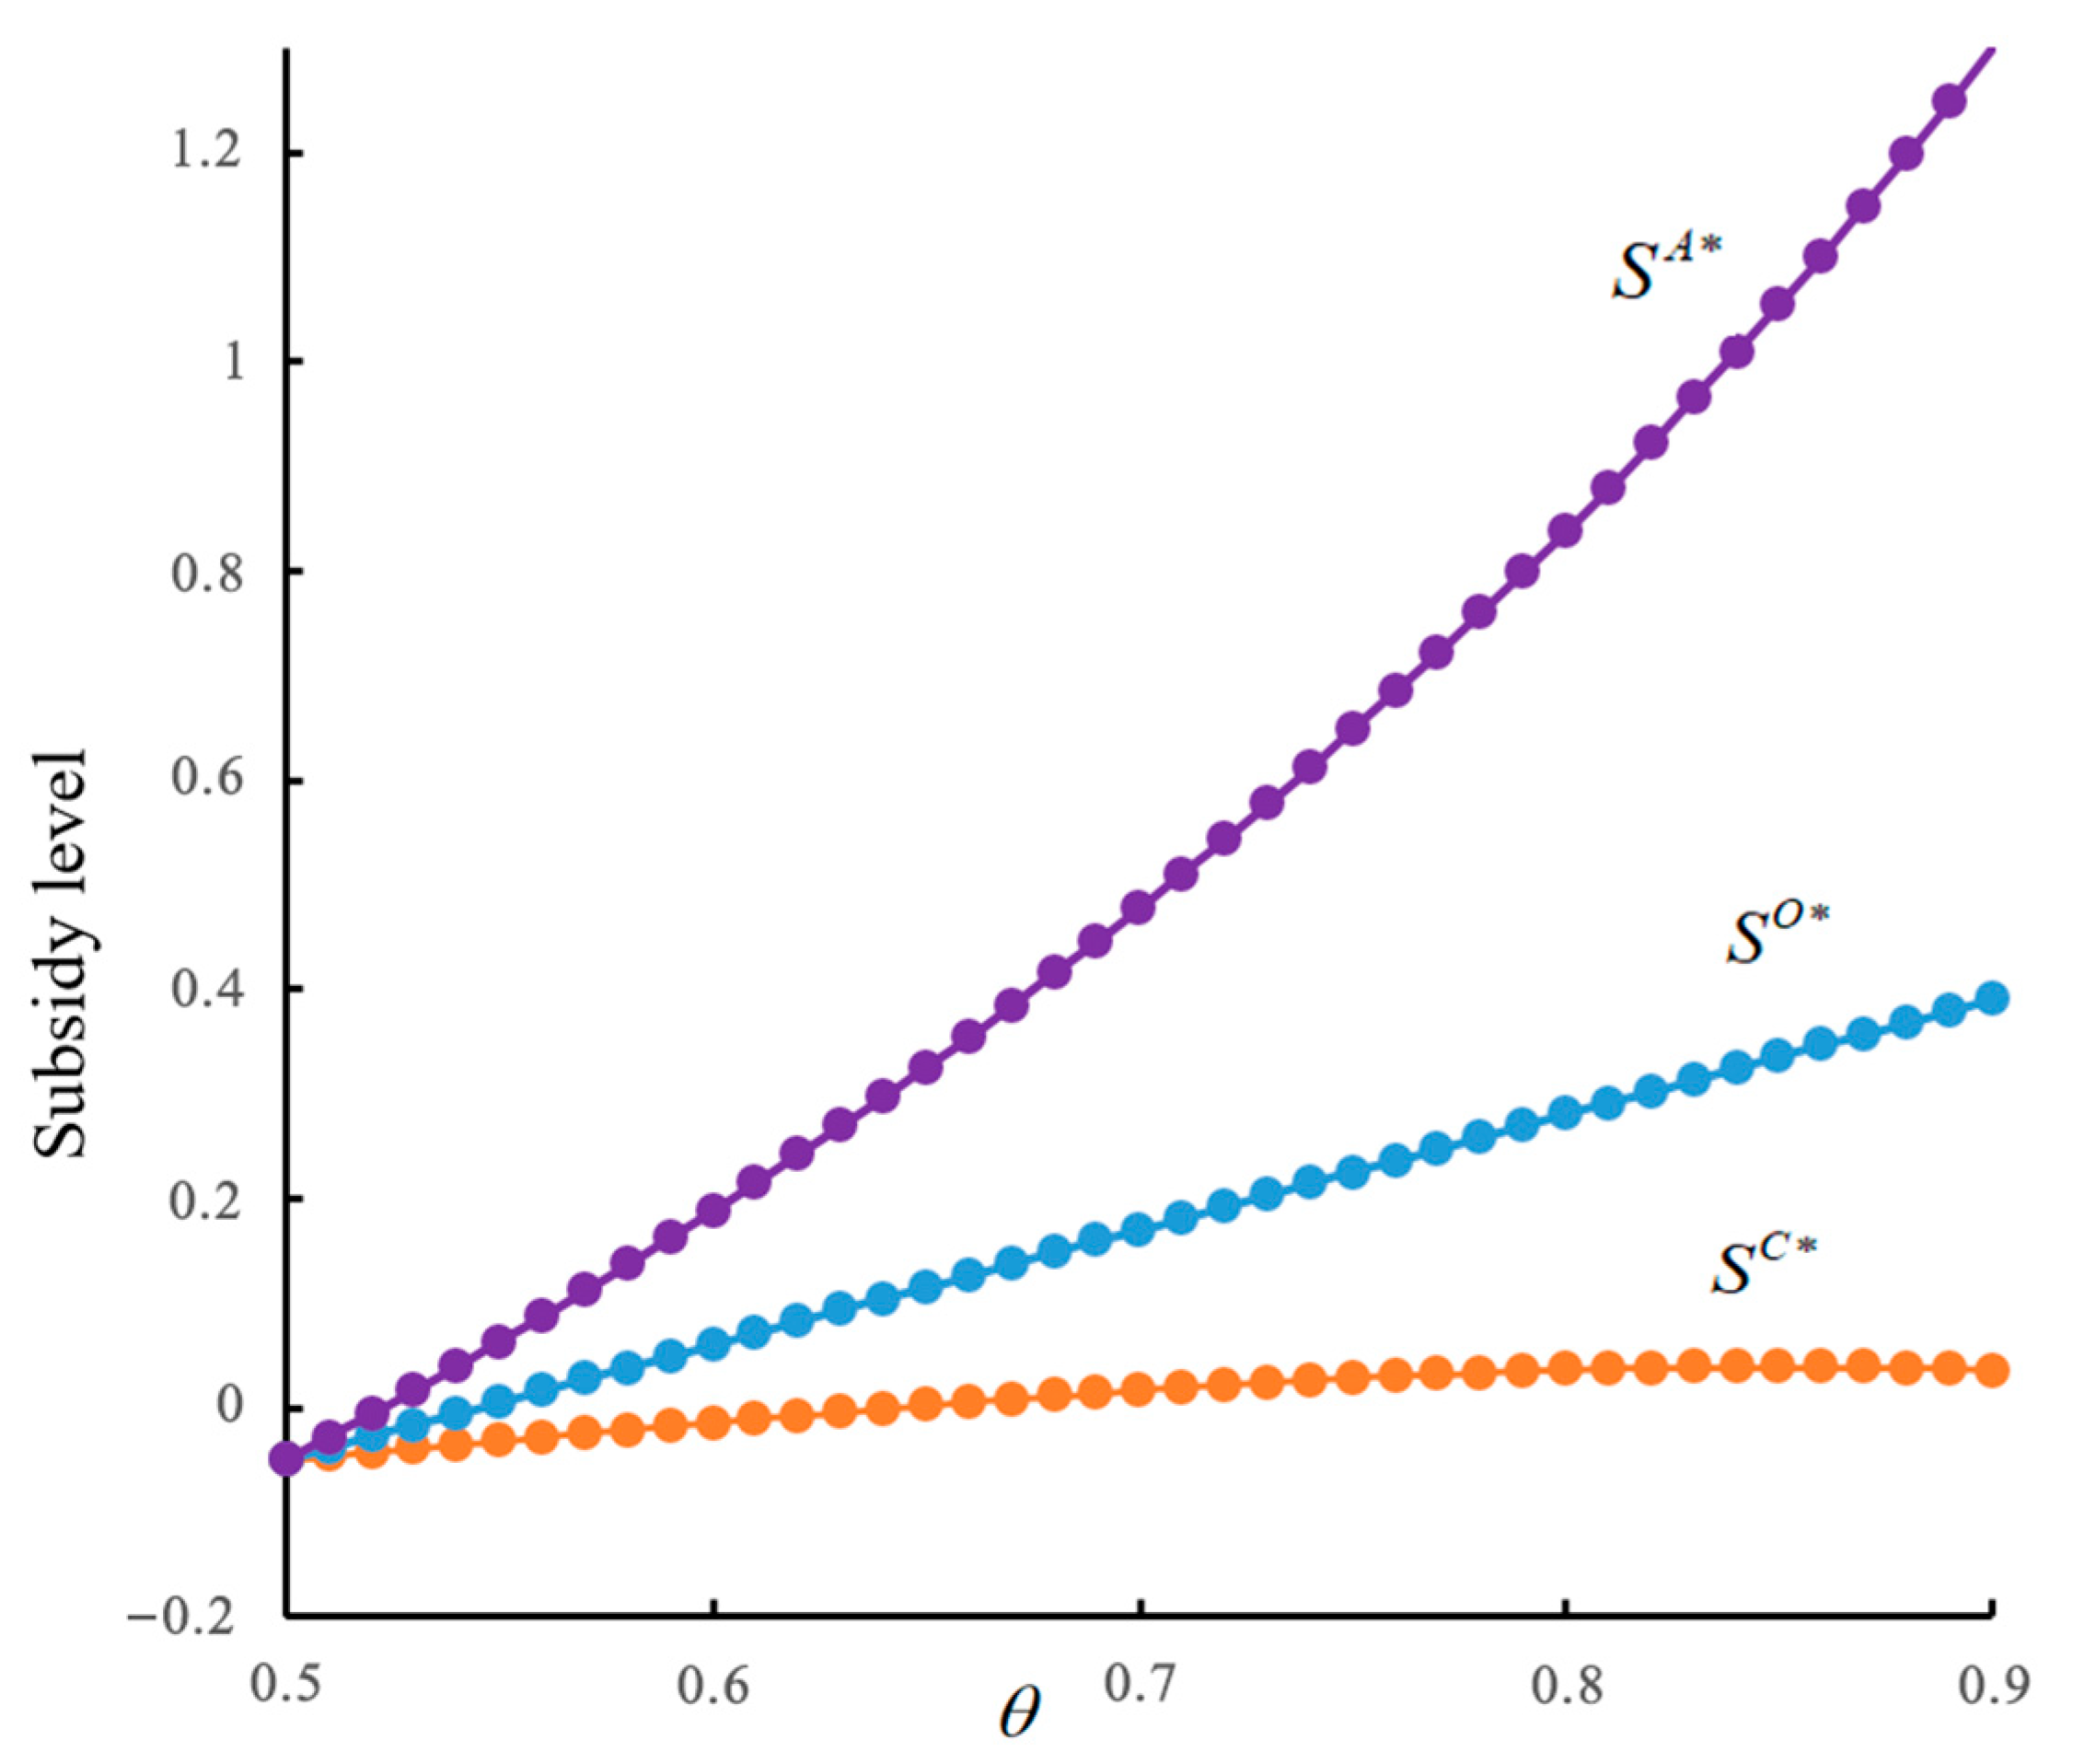
Overall, as depicted in Figure 3, with both the decrease of the unit environmental effect of the new product and the increase of the unit environmental effect of the remanufactured product, all of the optimal government subsidies decline, though at rates that are in accordance with the different reverse channel selection models. From an environmental standpoint, when the manufacturing stage of new products is environmentally harmful, the government optimally sets a higher subsidy to reach environmental protection goals.
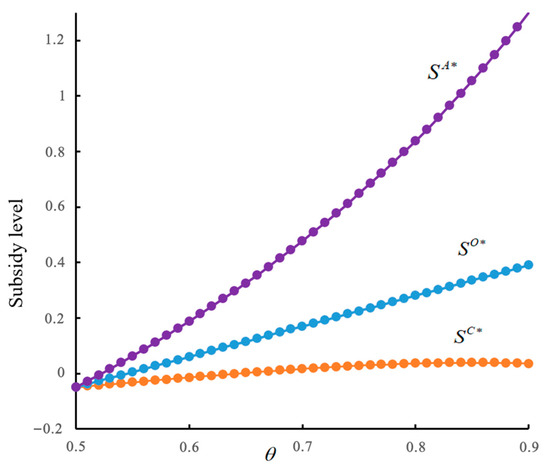
Figure 3.
Optimal government subsidy with respect to .
5.3. Results Analysis
In this subsection, we will illustrate the presented reverse channel models through a numerical example. We observe how the degree of consumer value discount per unit of remanufactured product influences the supply chain optimal decisions and equilibrium outcomes under the three settings. Given the scaling parameter of the collection cost, unit production cost of new/remanufactured product and unit environmental effect of new/remanufactured product are, respectively, , , , and . The consumer value discount per unit of remanufactured product θ is taken values of θ = 0.6 and θ = 0.8. The results are shown in Table 5 and Table 6. Performance comparison across models highlight key outcomes such as profits, environmental impact, and collection rates. These enhancements allow managers to quickly identify the most suitable model given varying degrees of consumer acceptance and policy intensity.
Table 5.
The impact of on equilibrium decisions.
Table 6.
The impact of on equilibrium outcomes.
From Table 5 and Table 6, we can observe the following. Under three reverse channels, (i) no matter whether the consumer value discount per unit remanufactured product is small or large, the collection rate of EOL products is greatest in Model C. Moreover, an increased consumer value discount leads to a larger difference between the collection rates of Model C and of the other models. That indicates that centralizing the remanufacturing process is more environmentally friendly if the EOL product is harmful to environmental protection. (ii) The OEM and 3PR’ profits always increase with the degree of the consumer value discount per unit of remanufactured product. Model C brings the OEM more profits than other models. However, the 3PR can earn more money in Model O. From the perspective of social welfare, Model A outperforms the other two models.
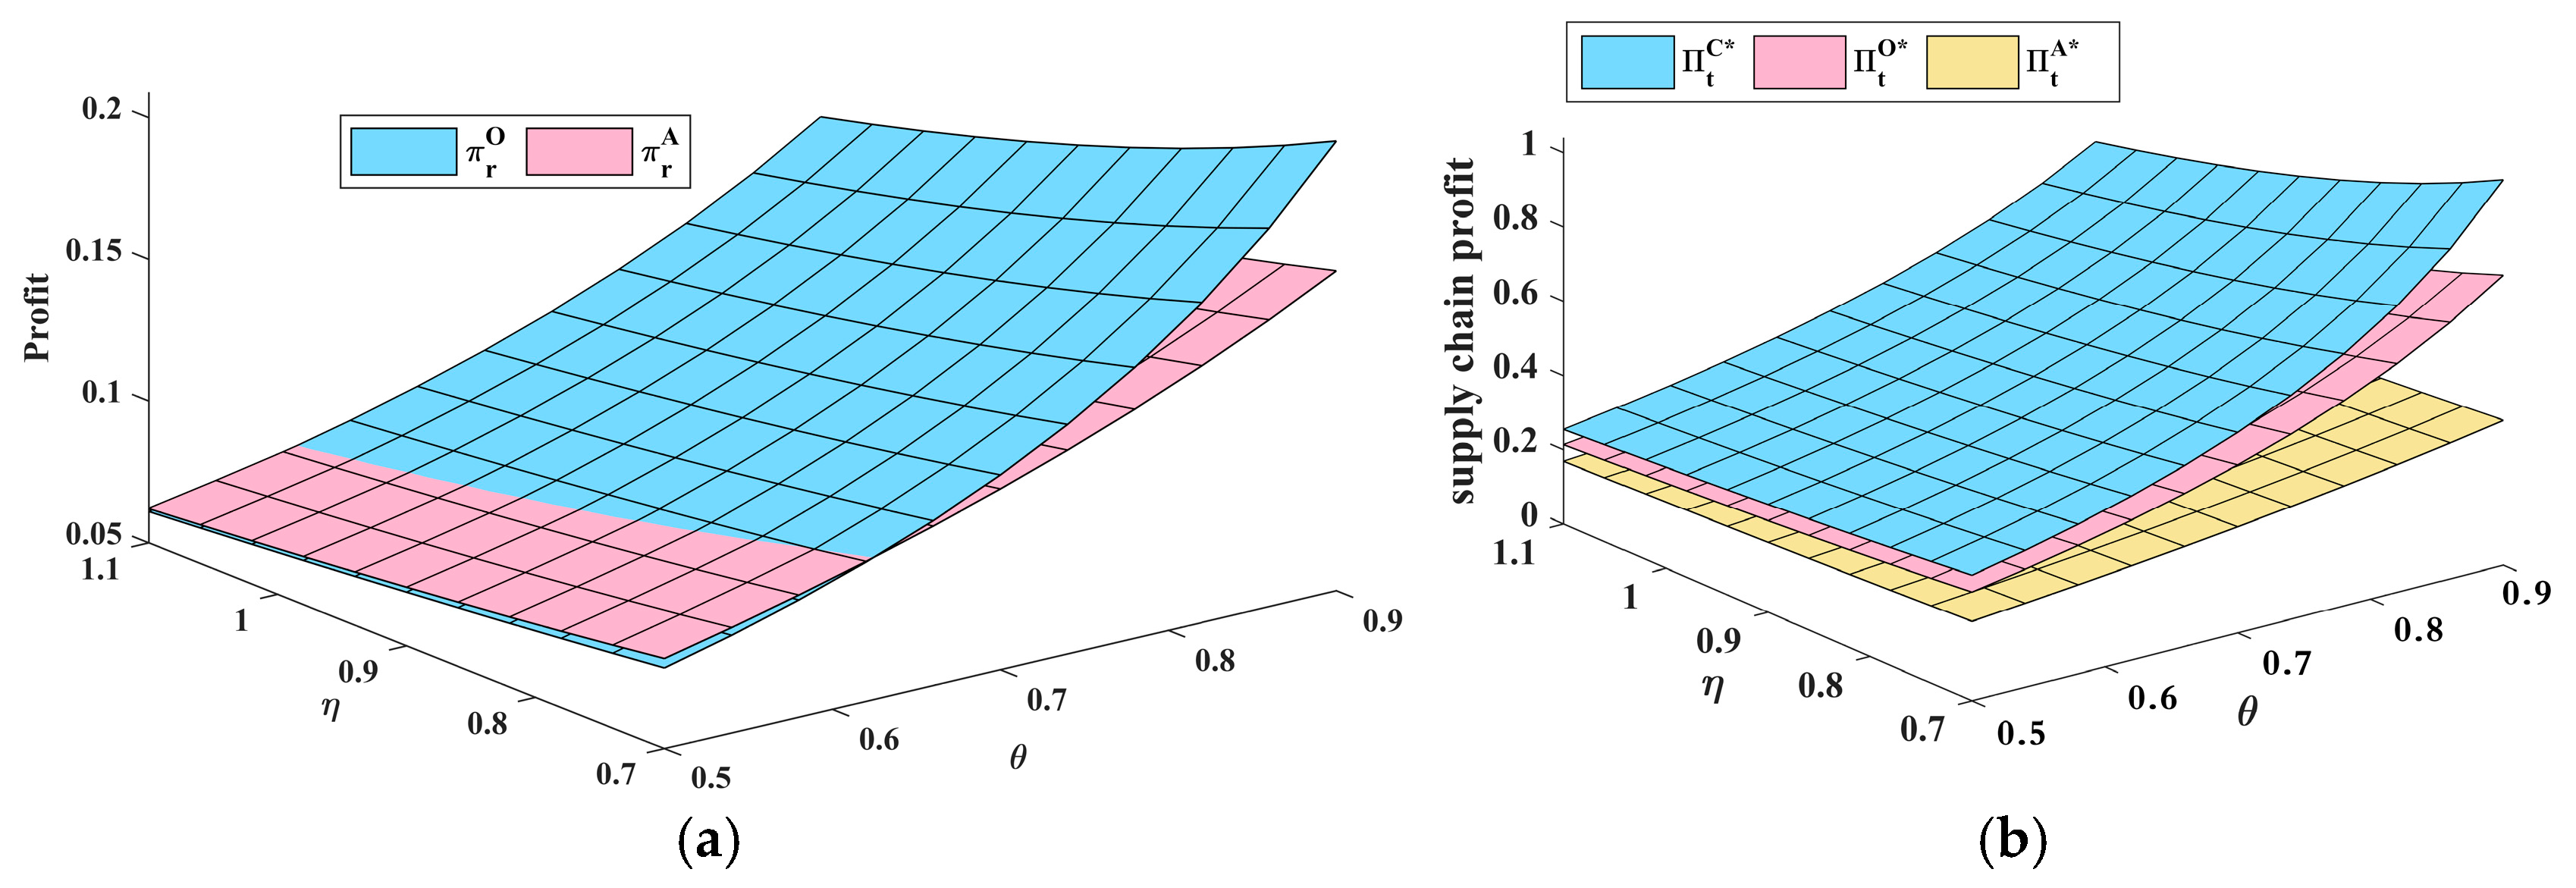
Figure 4a compares the 3PR’s optimal profit under Model O and Model A for different combinations of and . When the condition is satisfied, the 3PR’s sales profit with Model O (blue grid area) is larger than with Model A (red grid area). Otherwise, Model A generates a higher 3PR profit. This result is consistent with our main finding in Remark 3(c). Figure 4a yields the following insights. There is a distinct area which indicates one of the optimal reverse channel choices in terms of 3PR profitability. As consumer acceptance of remanufactured products increases, our model of consumer behavior incorporates the possibility that remanufactured product sales may cannibalize the sales of new products. In this case, the OEM will positively develop the marketing of remanufactured products to optimize the sales of remanufactured products.
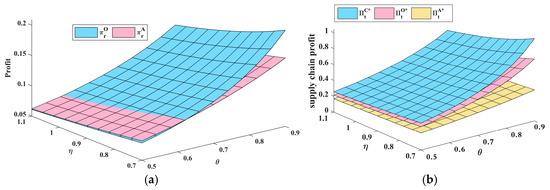
Figure 4.
(a) Effect of and on the 3PR’s profit. (b) Effect of and on supply chain’s profit.
Then, we investigate the impact of and on the supply chain’s profit, as shown in Figure 4b. According to Figure 4b, centralizing the reverse channel operations can be designed to optimize profit performance and align each entity’s objective with that of the OEM and the government. The combination of the remanufacturing and the marketing of used products elevates demand and potentially benefits supply chain profit margin. In fact, in Figure 4b, when is relatively large, the total supply chain profit rises by a much higher amount in Model C than in the other channel selection models. This result is intuitive: it is in the total supply chain’s better interest if the OEM chooses the centralizing remanufacturing processes. With the authorization reverse channel option, the supply chain suffers from more intense competition. The total profit is also strictly worse off in Model A, this implies that the more intense competition under the authorization model may hurt the supply chain.
6. Extension
This section extends the original model by considering the scenario where the government subsidizes manufacturers instead of consumers. In the revised framework, the government provides a per-unit subsidy to the manufacturer for each remanufactured product sold, rather than to the consumer. The utility functions of consumers change to and from purchasing a new or remanufactured product, respectively. Similar to Formula (1), the linear inverse demand functions change to the following:
The optimization problem for Model C changes to the following:
In the outsourcing model, the Stackelberg optimization problem changes to the following:
Similarly, the Stackelberg optimization problem of authorization model changes to the following:
By solving the above optimization model, we find that the results were exactly the same as those for subsidized consumers.
7. Implications and Conclusions
Is the pursuit of profit maximization by companies harmful to the environment? This is a fundamental question in the remanufacturing operation. Each of the supply chain player’s policies depends on the relative priority given to these ostensibly conflicting interests. Motivated by environmentally friendly business practices, we investigate the conditions in which profitability aligns with environmental goals. Specifically, we seek insights for OEMs that pay more attention to remanufacturing operations by optimizing their internal manufacturing program and the choice of reverse channel model. We have systematically compared three reverse channel options, with both social welfare and firms’ profit. Although our original motivation was an OEM selling both new and remanufactured products, our managerial insights will also be meaningful for other players in the supply chain and governments that face analogous decisions.
To deepen the understanding of our findings, we compare them with existing studies. Our result, that centralized remanufacturing (Model C) yields the highest profit and social welfare, aligns with that of Shi et al. [6], who emphasized the strategic value of integrating manufacturing and remanufacturing. In contrast, Liu et al. observed limited effectiveness of subsidies when waste quality is high [39]. Our work extends this view by showing that the structure of the reverse channel and consumer acceptance also significantly influence subsidy effectiveness. Unlike Chai et al. [12], who mainly examine environmental regulation in isolation, our model captures the joint effect of channel structure and government subsidies. This holistic view offers practical insights for designing sustainable remanufacturing policies [48].
In the context of remanufacturing, we have analytically characterized the optimal strategy in terms of sales revenue, consumer surplus, environmental impact, and pricing decisions under each reverse channel option. The results indicate that centralizing the remanufacturing process not only reduces the uncertainty of the reverse flows but can also mitigate the effect of double marginalization [49]. In addition, the comparison of consumer surplus and supply chain profit indicates that the centralizing model is better for both consumers and supply chain players. However, in some circumstances, the government finds the authorization model operation to be more appealing than the other channel selection models because it can decrease the government’s expenditure and be more environmentally friendly when the consumer acceptance of remanufactured products is sufficiently low.
Furthermore, we study the impact of the government subsidy on the overall profitability of the players, social welfare, and environmental protection. A numerical example is presented to explore the pricing behavior in various scenarios. The results imply that, with a profit-maximizing 3PR, the differentials in variable collection costs drive the strategy choice, and a higher fixed scaling parameter of the collection cost favors outsourcing. We make comparisons between different reverse channel selection models with respect to the optimal government subsidy. Interestingly, when the government aspires to reduce environmental effects and subsidy payments, the OEM and government have different reverse channel choice preferences. However, profitability and environmental goals align under a high consumer acceptance of remanufactured products. This insight could offer guidance to policymakers or industry organizations whose actions influence consumer perceptions of green product consumption.
Summarizing the above conclusions, we can provide specific recommendations for OEMs, 3PRs and government. Whether governments subsidize manufacturers or consumers, centralizing remanufacturing is advantageous for OEMs when consumer acceptance is high, as it leads to higher profitability and collection efficiency. For 3PRs, outsourcing is the preferred strategy when collection costs are high, enabling better profit capture from government subsidies. For governments, policymakers should consider market-specific factors such as consumer perception and reverse channel structure. Targeted subsidies can align economic incentives with environmental goals more effectively.
While this study provides several valuable insights, it is important to acknowledge its limitations. First, the model assumes market homogeneity and consumer rationality, which may not reflect the diversity of consumer behavior in real markets. Second, our analysis focuses on a single-country policy framework, whereas, in practice, cross-country comparisons may yield different implications due to varying regulatory environments. Future research could address these limitations by incorporating stochastic demand, consumer heterogeneity, and international contexts. For example, exploring how different consumer segments respond to remanufacturing incentives or how EU vs. US subsidy structures influence OEM strategies would further enhance the robustness and applicability of this work. Third, we recommend future empirical research based on real corporate data from sectors like automotive or electronics remanufacturing, to validate and calibrate key model parameters such as collection costs, subsidy effectiveness, and consumer acceptance. This would further enhance the practical relevance and robustness of the model outcomes.
Author Contributions
T.J.: Methodology; literature search; Validation; Formal analysis; Writing—Original Draft; S.W.: Formal analysis; Conceptualization; Writing—Original Draft; X.L.: Conceptualization; Project administration; Investigation; Visualization; Writing—review & editing. All authors have read and agreed to the published version of the manuscript.
Funding
This work was partially supported by funding from National Natural Science Foundation of China (No:72401251); the China Postdoctoral Science Foundation under Grant Number 2024M752840 and 2024M762783; the Postdoctoral Fellowship Program of CPSF under Grant Number GZC20241462 and GZC20232291; Hangzhou Key Research Institute of Philosophy and Social Sciences: Platform Economy Innovation and Development Research Center, Hangzhou Normal University under Grant Number 24JD028 and ESG and Sustainable Development Research Center, HZCU.
Data Availability Statement
No new data were created or analyzed in this study. Data sharing is not applicable to this article.
Conflicts of Interest
The authors declare no conflict of interest.
Appendix A
Proof of Remark 1.
From Table 2, we can obtain optimal decisions under three different channel-selection models. Taking first-order derivatives of optimal prices with respect to , we have and and Taking first-order derivatives of optimal quantities of new products with respect to , we have and Thus we can conclude that .
The first-order conditions of and with respect to are given as and 0. For the collection rate of end-of-life products, taking the derivative gives us and It is straightforward to show that . This completes the proof of Remark 1. □
Proof of Remark 2.
From Table 2, we can obtain the supply chain’s performance. Taking first-order derivatives of optimal profits with respect to , we can obtain and As and , this implies that 0.
Similarly, we have and Comparing and , we find that It can be derived that, when then . This completes the proof of Remark 2. □
Proof of Remark 3.
From Table 2, we can obtain the optimal quantities of new and remanufactured products. By comparing the optimal quantities of new and remanufactured products among Model C, Model O, and Model A, we find the following result: and 0. Therefore, we can conclude that and Then, we compare the collection rate and profit among Model C, Model O and Model A and obtain the following: and The above analysis implies that
Similarly, and 0. Summarizing the above results, we can conclude that By comparing the optimal profits of the 3PR between Model O and A, we find that When then This completes the proof of Remark 3. □
Proof of Remark 4.
From Propositions 1 and 2, we know the consumer surplus and total profits in three channel models. Taking first-order derivative of with respect to , we can obtain that and Then we find that 0. From this, we can easily see that
Similarly, taking first-order derivative of with respect to , we can derive that and Then we can derive that and 0. From this, we can conclude that 0. This ends the Proof of Remark 4. □
Proof of Remark 5.
Taking first-order derivative of with respect to , we can see that From this, we can conclude that 0. By similar analysis, we easily see that and Then, we have if 0. This ends the proof of Remark 5. □
Proof of Proposition 6.
We first check the condition for the existence of the optimal solution. By taking the second-order derivation of with respect to , leading to which means that the government problem in Model C has a unique optimal solution. Then, according to we can obtain that As we can conclude that when the government will not provide subsidy, when the optimal subsidy is The proofs of optimal and are similar to the proof of . This ends the proof of Proposition 6. □
References
- Zhang, C.T.; Ren, M.L. Closed-loop supply chain coordination strategy for the remanufacture of patented products under competitive demand. Appl. Math. Model. 2016, 40, 6243–6255. [Google Scholar] [CrossRef]
- Ndhaief, N.; Nidhal, R.; Hajji, A.; Bistorin, O. Environmental issue in an integrated production and maintenance control of unreliable manufacturing/remanufacturing systems. Int. J. Prod. Res. 2020, 58, 4182–4200. [Google Scholar] [CrossRef]
- Singhal, D.; Tripathy, S.; Jena, S.K. Remanufacturing for the circular economy: Study and evaluation of critical factors. Resour. Conserv. Recycl. 2020, 156, 104681. [Google Scholar] [CrossRef]
- Peng, J.; Zou, Y.; Zhang, H.; Zeng, L.; Wang, Y.; Li, X. Pricing Decision-Making Considering Ambiguity Tolerance in Consumers: Evidence from Recycled Building Material Enterprises. Systems 2025, 13, 98. [Google Scholar] [CrossRef]
- Kleber, R.; Reimann, M.; Souza, G.C.; Zhang, W. On the robustness of the consumer homogeneity assumption with respect to the discount factor for remanufactured products. Eur. J. Oper. Res. 2018, 269, 1027–1040. [Google Scholar] [CrossRef]
- Shi, T.; Chhajed, D.; Wan, Z.; Liu, Y. Distribution channel choice and divisional conflict in remanufacturing operations. Prod. Oper. Manag. 2020, 29, 1702–1719. [Google Scholar] [CrossRef]
- Lin, G.; Zhang, J.; Zhang, Q. Manufacturer Encroachment Strategic Analysis with Platform Service Inputs: An Agent-Based Scenario. Systems 2024, 12, 64. [Google Scholar] [CrossRef]
- Abbey, J.D.; Guide, V.D.R., Jr. A typology of remanufacturing in closed-loop supply chains. Int. J. Prod. Res. 2018, 56, 374–384. [Google Scholar] [CrossRef]
- Oraiopoulos, N.; Ferguson, M.E.; Toktay, L.B. Relicensing as a secondary market strategy. Manag. Sci. 2012, 58, 1022–1037. [Google Scholar] [CrossRef]
- Gu, Y.; Xue, M.; Zhao, M.; Long, Y. Optimal Government Subsidy Decision and Its Impact on Sustainable Development of a Closed-Loop Supply Chain. Systems 2023, 11, 378. [Google Scholar] [CrossRef]
- Chen, J.Y.; Dimitrov, S.; Pun, H. The impact of government subsidy on supply Chains’ sustainability innovation. Omega 2019, 86, 42–58. [Google Scholar] [CrossRef]
- Chai, Q.; Sun, M.; Lai, K.; Xiao, Z. The effects of government subsidies and environmental regulation on remanufacturing. Comput. Ind. Eng. 2023, 178, 109126. [Google Scholar] [CrossRef]
- Atasu, A.; Toktay, L.B.; Van Wassenhove, L.N. How collection cost structure drives a manufacturer’s reverse channel choice. Prod. Oper. Manag. 2013, 22, 1089–1102. [Google Scholar] [CrossRef]
- Örsdemir, A.; Kemahlıoğlu-Ziya, E.; Parlaktürk, A.K. Competitive quality choice and remanufacturing. Prod. Oper. Manag. 2014, 23, 48–64. [Google Scholar] [CrossRef]
- Peng, S.; Ping, J.; Li, T.; Wang, F.; Zhang, H.; Liu, C. Environmental benefits of remanufacturing mechanical products: A harmonized meta-analysis of comparative life cycle assessment studies. J. Environ. Manag. 2022, 306, 114479. [Google Scholar] [CrossRef] [PubMed]
- Savaskan, R.C.; Bhattacharya, S.; Van Wassenhove, L.N. Closed-loop supply chain models with product remanufacturing. Manag. Sci. 2004, 50, 239–252. [Google Scholar] [CrossRef]
- Wang, Z.J.; Zhou, R.F.; Ma, Y.F.; Wang, Y.J. Carbon tax and low-carbon credit: Which policy is more beneficial to the capital-constrained manufacturer’s remanufacturing activities? Environ. Res. 2024, 246, 118079. [Google Scholar] [CrossRef] [PubMed]
- Lee, C.C.; Hussain, J. A carbon neutral supply chain management by considering emission-risk minimization and green purchasing through optimal decision-making. Environ. Res. 2024, 251, 118662. [Google Scholar] [CrossRef] [PubMed]
- Shulman, J.D.; Coughlan, A.T.; Savaskan, R.C. Optimal reverse channel structure for consumer product returns. Mark. Sci. 2010, 29, 1071–1085. [Google Scholar] [CrossRef]
- Li, W.; Tian, R.; Chen, J. Original equipment manufacturer with remanufacturing: Outsourcing strategy and organizational structure. Transp. Res. Part E Logist. Transp. Rev. 2024, 187, 103575. [Google Scholar] [CrossRef]
- Zou, Z.B.; Wang, J.J.; Deng, G.S.; Chen, H. Third-party remanufacturing mode selection: Outsourcing or authorization? Transp. Res. Part E Logist. Transp. Rev. 2016, 87, 1–19. [Google Scholar] [CrossRef]
- Ding, J.; Pu, X.; Zhang, W. Outsourcing vs. authorization remanufacturing and differential vs. uniform pricing: A supply chain perspective. Transp. Res. Part E Logist. Transp. Rev. 2024, 192, 103777. [Google Scholar] [CrossRef]
- Huang, H.; Xu, F.; Wang, M.; Yang, H.; Li, T. Remanufacturing in global supply chains: Self-operating or licensing? Transp. Res. Part E Logist. Transp. Rev. 2024, 190, 103708. [Google Scholar] [CrossRef]
- Wang, M.; Yang, F.; Shan, F.; Guo, Y. Blockchain adoption for combating remanufacturing perceived risks in a reverse supply chain. Transp. Res. Part E Logist. Transp. Rev. 2024, 183, 103448. [Google Scholar] [CrossRef]
- Zhou, J.; Xu, H.; Deng, Q.; Ma, Y.; Luo, Q. Two-stage optimal acquisition and remanufacturing decisions with demand and quality information updating. Transp. Res. Part E Logist. Transp. Rev. 2024, 192, 103823. [Google Scholar] [CrossRef]
- Xiao, T.; Choi, T.M.; Cheng, T.C.E. Product variety and channel structure strategy for a retailer-Stackelberg supply chain. Eur. J. Oper. Res. 2014, 233, 114–124. [Google Scholar] [CrossRef]
- Taleizadeh, A.A.; Sadeghi, R. Pricing strategies in the competitive reverse supply chains with traditional and e-channels: A game theoretic approach. Int. J. Prod. Econ. 2019, 215, 48–60. [Google Scholar] [CrossRef]
- Hosseini-Motlagh, S.M.; Johari, M.; Nematollahi, M.; Pazari, P. Reverse supply chain management with dual channel and collection disruptions: Supply chain coordination and game theory approaches. Ann. Oper. Res. 2023, 324, 215–248. [Google Scholar] [CrossRef]
- Li, K.; Zhang, L.; Fu, H.; Liu, B. The effect of intelligent manufacturing on remanufacturing decisions. Comput. Ind. Eng. 2023, 178, 109114. [Google Scholar] [CrossRef]
- Akan, M.; Ata, B.; Savaşkan-Ebert, R.C. Dynamic pricing of remanufacturable products under demand substitution: A product life cycle model. Ann. Oper. Res. 2013, 211, 1–25. [Google Scholar] [CrossRef]
- Mitra, S. Optimal pricing and core acquisition strategy for a hybrid manufacturing/remanufacturing system. Int. J. Prod. Res. 2016, 54, 1285–1302. [Google Scholar] [CrossRef]
- Ma, Z.J.; Zhou, Q.; Dai, Y.; Sheu, J.B. Optimal pricing decisions under the coexistence of “trade old for new” and “trade old for remanufactured” programs. Transp. Res. Part E Logist. Transp. Rev. 2017, 106, 337–352. [Google Scholar] [CrossRef]
- Liao, G.H.W.; Luo, X. Collaborative reverse logistics network for electric vehicle batteries management from sustainable perspective. J. Environ. Manag. 2022, 324, 116352. [Google Scholar] [CrossRef] [PubMed]
- He, Q.; Wang, N.; Yang, Z.; He, Z.; Jiang, B. Competitive collection under channel inconvenience in closed-loop supply chain. Eur. J. Oper. Res. 2019, 275, 155–166. [Google Scholar] [CrossRef]
- Zhou, T.; Li, K. Designing manufacturer’s new product technology for a closed-loop supply chain with consumer context effect. Transp. Res. Part E Logist. Transp. Rev. 2024, 188, 103634. [Google Scholar] [CrossRef]
- Cao, Y.; Li, G.; Meng, K.; Peng, X. Managerial decisions of remanufacturing technology portfolio under a discrete choice model. Transp. Res. Part E Logist. Transp. Rev. 2025, 195, 103959. [Google Scholar] [CrossRef]
- Zhang, W.; Chiu, Y.B.; Hsiao, C.Y.L. Effects of country risks and government subsidies on renewable energy firms’ performance: Evidence from China. Renew. Sustain. Energy Rev. 2022, 158, 112164. [Google Scholar] [CrossRef]
- Zhao, Y.; Jian, Z.; Du, Y. How can China’s subsidy promote the transition to electric vehicles? Renew. Sustain. Energy Rev. 2024, 189, 114010. [Google Scholar] [CrossRef]
- Liu, H.; Lei, M.; Deng, H.; Leong, G.K.; Huang, T. A dual channel, quality-based price competition model for the WEEE recycling market with government subsidy. Omega 2016, 59, 290–302. [Google Scholar] [CrossRef]
- Huang, Z.; Liao, G.; Li, Z. Loaning scale and government subsidy for promoting green innovation. Technol. Forecast. Soc. Change 2019, 144, 148–156. [Google Scholar] [CrossRef]
- Wang, Z.; Wang, Z.; Tahir, N.; Wang, H.; Li, J.; Xu, G. Study of synergetic development in straw power supply chain: Straw price and government subsidy as incentive. Energy Policy 2020, 146, 111788. [Google Scholar] [CrossRef]
- Khorshidvand, B.; Guitouni, A.; Govindan, K.; Soleimani, H.; Talebi, L.; Sibdari, S. Optimizing pricing for sustainable government-subsidized omnichannel closed-loop supply chains. Transp. Res. Part E Logist. Transp. Rev. 2025, 194, 103932. [Google Scholar] [CrossRef]
- Jiang, Y.; Liu, L.; Lim, A. Optimal pricing decisions for an omni-channel supply chain with retail service. Int. Trans. Oper. Res. 2020, 27, 2927–2948. [Google Scholar] [CrossRef]
- Hong, X.; Govindan, K.; Xu, L.; Du, P. Quantity and collection decisions in a closed-loop supply chain with technology licensing. Eur. J. Oper. Res. 2017, 256, 820–829. [Google Scholar] [CrossRef]
- Hafezalkotob, A. Competition, cooperation, and coopetition of green supply chains under regulations on energy saving levels. Transp. Res. Part E Logist. Transp. Rev. 2017, 97, 228–250. [Google Scholar] [CrossRef]
- Meng, X.; Yao, Z.; Nie, J.; Zhao, Y. Make or buy? It is the question: A study in the presence of carbon tax. Int. J. Prod. Econ. 2018, 195, 328–337. [Google Scholar] [CrossRef]
- Ovchinnikov, A.; Blass, V.; Raz, G. Economic and environmental assessment of remanufacturing strategies for product+ service firms. Prod. Oper. Manag. 2014, 23, 744–761. [Google Scholar] [CrossRef]
- Wang, S.; Zhang, H. Artificial Intelligence Digital Employees and Sustainable Innovation in Online Retail: The Mediating Role of Ambidextrous Green Innovation and the Moderating Role of Ethical Anxiety. J. Retail. Consum. Serv. 2025, 84, 104235. [Google Scholar] [CrossRef]
- Wang, S.; Zhang, H. Digital Transformation and Innovation Performance in Small- and Medium-Sized Enterprises: A Systems Perspective on the Interplay of Digital Adoption, Digital Drive, and Digital Culture. Systems 2025, 13, 43. [Google Scholar] [CrossRef]
Disclaimer/Publisher’s Note: The statements, opinions and data contained in all publications are solely those of the individual author(s) and contributor(s) and not of MDPI and/or the editor(s). MDPI and/or the editor(s) disclaim responsibility for any injury to people or property resulting from any ideas, methods, instructions or products referred to in the content. |
© 2025 by the authors. Licensee MDPI, Basel, Switzerland. This article is an open access article distributed under the terms and conditions of the Creative Commons Attribution (CC BY) license (https://creativecommons.org/licenses/by/4.0/).