Article

Research on Pricing and Effort Investment Decisions for Dual-Channel Fresh Product Supply Chain Under the Participation of Third-Party Logistics Provider

School of Management, Shenyang University of Technology, Shenyang 110870, China
*
Author to whom correspondence should be addressed.
Systems 2025, 13(7), 538; https://doi.org/10.3390/systems13070538
Submission received: 28 May 2025 / Revised: 20 June 2025 / Accepted: 27 June 2025 / Published: 1 July 2025
(This article belongs to the Section Supply Chain Management)

Abstract

This study takes the dual-channel fresh product supply chain involving the participation of third-party logistics (3PL) as the background to explore how 3PL makes choices between homogeneous and differentiated logistics service strategies and how the supply chain formulates optimal decisions under different logistics service strategies to achieve maximum benefits. This paper constructs a sequential game model of the three-tier supply chain composed of 3PL, a supplier, and a retailer; uses the consumer utility function to describe market demand; and considers different logistics service strategies adopted by 3PL. It compares and analyzes the equilibrium strategies under the traditional retail channel (O Model), the homogeneous cold-chain service dual-channel model (D1 Model), and the differentiated cold-chain service dual-channel model (D2 Model). The results show the following: (1) The D1 Model reduces the transportation cost of the supply chain through economies of scale. Under the D2 Model, the transportation and sales prices of the offline channels are higher than those of the online channels, while the online marketing effort is higher than that of the offline channels. (2) The profits generated by the dual-channel models (D1 Model and D2 Model) are both higher than those of O Model. In most cases, the D1 Model generates the highest system profit. However, in scenarios where consumers are highly sensitive to freshness and marketing efforts, the system profit of the D2 Model is higher than that of the D1 Model. (3) The supply chain has lower pricing and effort input when consumers are more sensitive to prices and higher pricing and effort input when consumers are more sensitive to freshness. These findings contribute valuable insights to the field of supply chain management, particularly in the context of fresh product supply chains involving 3PL. They underscore the importance of considering consumer behavior and logistics service strategies in optimizing supply chain performance and highlight the potential trade-offs between standardization and differentiation in logistics services.

1. Introduction

In today’s rapidly evolving business environment, the operation model of the fresh products market is undergoing a profound transformation. As market competition intensifies and consumer demands continue to evolve, the traditional offline retail model has been unable to meet the diverse and personalized needs of the market. To adapt to this trend, fresh product suppliers have been actively exploring ways to sell their products directly to consumers by opening up online direct-sales channels, such as through live-streaming sales and entering third-party e-commerce platforms, thereby forming a dual-channel sales model that operates both online and offline [1]. High-quality agricultural product manufacturers like Anchor, Dole, and Jiawo have adopted the online direct-sales model, while some small agricultural product manufacturers opt for the online distribution model [2]. Hema Fresh, a representative of Alibaba’s new retail initiatives, not only operates numerous offline stores but also provides an online APP for consumers to place orders [3]. Through differentiated pricing strategies and a variety of marketing activities, this dual-channel model has effectively attracted a broad range of consumer groups and significantly increased the market share of fresh product. However, the highly perishable nature of fresh products imposes extremely high requirements on cold-chain logistics, becoming one of the key factors restricting the efficiency and effectiveness of the fresh product supply chain.
Although self-operated cold-chain logistics can effectively ensure the freshness and quality of products, most fresh product enterprises find it difficult to bear the high costs and the complexity of operation and management. Therefore, outsourcing logistics to professional third-party logistics service providers (hereinafter referred to as 3PL) is regarded as an effective means of cost savings [4,5]. 3PL not only offers professional cold-chain logistics services to reduce enterprises’ operating costs, but also, through advanced logistics technology and management experience, minimizes circulation losses and enhances overall operational efficiency. For instance, Whole Foods outsources its delivery services to the department store e-commerce platform Instacart, while Yonghui Superstores outsources its logistics services to airlines and purchases fresh products, such as cherries, from overseas suppliers.
The dual-channel model featuring parallel online direct sales and offline retail necessitates that 3PL manages the logistics and transportation operations of both online and offline channels simultaneously. This not only escalates the complexity and cost of 3PL operations but also poses significant challenges to it. On the one hand, although the homogenized logistics service strategy for both online and offline channels can reduce channel coordination costs through standardized services, the relatively fixed service content, quality, and standards make it difficult to attract specific customer segments through differentiation. On the other hand, while the differentiated logistics service strategy for online and offline channels can meet the personalized demands of high-preference consumers, enhance service quality, and increase consumers’ willingness to pay, it simultaneously results in an increase in transportation costs and service complexity.
Based on the aforementioned background, it is evident that in today’s complex and volatile market environment, the traditional supply chain management model is confronted with numerous challenges. In particular, with the emergence of online direct sales channels, not only have consumers’ shopping habits changed, but new requirements have also been imposed on the structure and operation of the supply chain. Under the dual-channel model where online direct sales and offline retail coexist, how to effectively balance the relationship between these two channels to maximize the overall benefits has become an urgent issue to be addressed in the field of supply chain management. Meanwhile, as the entity responsible for undertaking logistics and transportation tasks for fresh products, the logistics service strategies adopted by 3PL will impact the product quality, cost structure, logistics efficiency, and market demand of the supply chain, ultimately affecting its pricing strategy and profit level [5,6]. Under the dual-channel model, it is also worth exploring in depth what logistics service strategies 3PL should adopt and whether they can generate more benefits for supply chain members and even the entire system through differentiated services. Furthermore, as the terminal link of the supply chain, consumers’ behavioral characteristics significantly influence the optimal decision-making and profit level of the supply chain.
Therefore, based on the above analysis, this paper focuses on the following issues:
  • How will 3PL’s homogeneous and differentiated logistics strategies affect pricing and effort investment decisions in the dual-channel fresh product supply chain?
  • Which model (the traditional retail channel model, the homogeneous cold-chain service dual-channel model, or the differentiated cold-chain service dual-channel model) generates the highest system profit, and what is the underlying mechanism?
  • How do consumer behavior factors influence the optimal strategy and system profit?
In view of this, this paper takes the dual-channel supply chain of fresh product suppliers as the research object, considering that 3PL adopts different logistics service strategies. It uses the consumer utility function to depict market demand. Through constructing a sequential game model, it studies the optimal decisions and profit levels of members under the traditional retail channel model (O Model), homogeneous cold-chain service dual-channel model (D1 Model), and differentiated cold-chain service dual-channel model (D2 Model), respectively. Based on numerical experiments, it compares and analyzes the pricing and effort investment strategies and profit levels of the supply chain under the three different models and further analyzes the influence mechanism of consumer behavior on the equilibrium decision of the supply chain. This paper aims to uncover the internal mechanism of channel differences and logistics service differentiation in the context where suppliers and 3PL jointly participate in supply chain operation. Consequently, it provides a theoretical foundation for channel integration, pricing strategy formulation, and cold-chain resource allocation in the fresh product supply chain.
The remainder of this paper is structured as follows. Section 2 reviews the relevant literature. Section 3 describes the models, proposes relevant research hypotheses, outlines model assumptions, uses the consumer utility function to depict the market demands, and constructs and solves the sequential game models of the members under the three models. Section 4 conducts numerical experiments to compare and analyze the benefits under different models and further analyzes the impact of consumer behavior factors on supply chain decisions and profit levels. Section 5 discusses the research results. Section 6 presents the research conclusions and management implications.

2. Literature Review

The research content related to this article mainly involves the dual-channel fresh product supply chain and the participation of third-party logistics. The following will sort out the relevant literature on these two aspects.

2.1. Dual-Channel Fresh Product Supply Chain

With the rapid advancement of information technology and the ongoing optimization of the logistics network, online shopping has emerged as one of the mainstream shopping methods for consumers [7]. In the realm of the fresh product supply chain, numerous suppliers and retailers have successively established online direct sales channels, gradually forming three typical models: the supplier dual-channel model [1,2,3,8,9,10], the retailer dual-channel model [6,11,12,13,14], and the mixed dual-channel model [3,15,16,17]. Currently, research on the dual-channel supply chain of fresh product predominantly focuses on aspects such as pricing decisions, consumer preferences, and supply chain coordination.
In terms of pricing decision research, Guo et al. considered the impact of fresh product quality deterioration and refrigeration costs. They explored the issues of pricing and refrigeration temperature setting under two different supply chain structures: single-channel and dual-channel [18]. Zhao [19], Wu [20], Hu [13], among others, all studied how supply chain members set prices in the context of pre-sales. Wang et al. introduced the factors of preservation efforts and marketing efforts and explored the joint decision-making of pricing and effort input in the supply chain from a dynamic perspective [21]. Zhou et al. believe that greenness is one of the key factors influencing the operational efficiency of the supply chain. Through a comparative analysis of same-price and different-price decisions in the supply chain, they found that when the market share of online and offline channels is unbalanced, the different-price strategy is more conducive to the rational allocation of channel sales resources [11]. Wang [2], Modak [22], Jiang [14], Gan [16], among others, focused on the application of blockchain technology and studied the joint decision-making problems in areas such as pricing, quality input, and model selection of the supply chain under this technological background.
In terms of consumer preference research, Chen et al. discovered through their research that an increase in consumers’ demand for preservation would prompt retailers to adopt more advanced preservation technologies in order to achieve higher profits [12]. Under two different channel collaborative delivery strategies, Luo et al. found that the level of consumers’ sensitivity to preservation services determined the proportion of revenue sharing and the magnitude of the unit distribution service fee during the implementation of the strategy [1]. Li [8] and Zhao [23] et al. both explored the pricing and quality strategies of the supply chain in the context of changes in consumers’ freshness preferences. Xie [3] and Xu [17] et al. analyzed the impact of consumers’ low-carbon preferences and channel preferences on supply chain decisions. Xie [3] et al. pointed out that an enhancement in consumers’ low-carbon preferences and channel preferences is beneficial to the development of the supply chain. However, Xu [17] et al. found that an enhancement in consumers’ preferences for online channels is detrimental to the sale of homogeneous products through offline channels.

2.2. The Participation of Third-Party Logistics Providers

Unlike industrial products, fresh products are perishable, and their quality largely depends on the level of logistics preservation. The High-quality cold-chain services provided by 3PL can not only reduce the quantity loss of fresh products but also enhance their quality [24]. However, constructing a cold-chain logistics system demands a high level of investment. Affected by this, many fresh product enterprises opt to cooperate with 3PL and outsource their logistics operations to alleviate their own operational pressure [5]. Some scholars have started to focus on the operational optimization and coordination of the agricultural product supply chain system following the intervention of 3PL, as well as the pricing and effort investment decisions of 3PL in different scenarios. The research content of this article is mainly concerned with the latter.
The logistics cooperation undertaken by 3PL with other members can effectively share the logistics preservation costs and market forecast risks, enhance logistics preservation efforts [25], and thus bring more profits to all parties in the supply chain [26,27]. Yu et al. separately studied the vertical and horizontal cooperation of 3PL [24] and the priority decision-making problem [28]. They found that both the participation of 3PL in vertical integration and priority decision-making can effectively increase the revenue of the supply chain. However, Dan et al. pointed out that the overall performance of the supply chain reaches its optimum only when retailers share demand information exclusively with 3PL [29]. Zhang et al. simultaneously considered both carbon emission reduction and blockchain technology and found that the profit of 3PL is negatively correlated with the research and develop (R&D) cost coefficient of carbon emission reduction and the spoilage rate of fresh products, but positively correlated with consumers’ low-carbon preferences [5]. Some studies [30,31,32] have analyzed the conditions for self-operated preservation and preservation outsourcing. Chen pointed out that retailers always tend to preserve products by themselves, while suppliers’ choice of preservation outsourcing depends on the preservation level or the preservation price level [30]. Yu et al. further compared and analyzed the impact of different cold-chain service models of 3PL on the supply chain [33].

2.3. Research Gap

The application summary in relevant literature is shown in Table 1. √ indicates that this effort is included in the article.
Overall, existing research on decision-making in the dual-channel fresh product supply chain primarily focuses on the two-tier fresh product supply chain comprising suppliers and retailers, and emphasizes the decisions made by these two parties with respect to pricing, preservation investment, and channel coordination. However, due to the active involvement of 3PL in the logistics and transportation process of fresh products, their pricing and logistics service decisions may alter the cost structure, logistics efficiency, and market demand of the supply chain, thereby influencing the optimal pricing strategy and profit level of the supply chain. In current studies, it is relatively uncommon to include 3PL as important participants in the analysis of the fresh product dual-channel supply chain.
Furthermore, most of the literature, when describing the differences between online direct sales channels and offline retail channels, is confined to aspects such as product price and freshness. However, it is the efforts of channel marketing that can truly reflect the characteristics of each channel and have a differentiated impact on demand. Suppliers can attract potential customers through methods such as social media marketing, search engine optimization, precise traffic diversion, and other approaches. Such marketing efforts will directly affect the exposure rate and click-through rate of online channels, thereby influencing demand. Retailers can enhance the shopping experience of customers by optimizing store layouts, holding promotional activities, improving customer service, and arranging shelves reasonably. These marketing efforts will affect the frequency of customers’ store visits and their purchasing intentions, thereby influencing demand. Therefore, in the context where suppliers participate in market competition and 3PL offer cold-chain services, how the dual channels of fresh product set prices and allocate marketing efforts to maximize the interests of all parties, as well as which channel model is more beneficial to the overall development of the supply chain, have become important issues that urgently require in-depth research.
In light of this, this paper takes the three-tier fresh product supply chain, which is composed of 3PL, a supplier, and a retailer, as the research object. In the context of the supplier opening up online direct sales channels to engage in competition, it is assumed that 3PL offer cold- chain services for both online and offline channels to satisfy the distinct requirements of different channels in terms of timeliness and quality. Through numerical analysis, the traditional retail channel model, the dual-channel model with homogeneous cold- chain services, and the dual-channel model with differentiated cold- chain services are compared. Furthermore, the intrinsic relationship between the optimal decision-making and profit level of the supply chain and consumer behavior is further uncovered.
The innovation of this paper lies in the following two aspects: On the one hand, this research regards 3PL as an independent decision-making entity and examines the impact of its adoption of diverse cold-chain service strategies on the three-tier dual-channel fresh product supply chain. Previous studies on the dual-channel fresh product supply chain have primarily centered on the two-tier supply chain comprising suppliers and retailers, in which the transportation and preservation of fresh product are carried out by both parties. However, given the growing prevalence of fresh product logistics outsourcing, the freshness of fresh product in both online and offline channels is affected by the services rendered by 3PL. This design is able to reflect a more realistic operational environment of the supply chain. On the other hand, this paper further refines the application scenarios of marketing efforts. It considers that the supplier implements his own online marketing effort for the online direct-sales channel, whereas the retailer implements his own offline marketing efforts for the offline retail channel. The study explores how they devise their respective marketing effort investment strategies under different scenarios. Most prior studies have only taken into account the marketing efforts invested by a single party, overlooking the fact that different members will expend certain marketing efforts for their own sales channels. This consideration facilitates the enrichment of research in the field of marketing.

3. Model Framework

In this section, Section 3.1 describes the model, lists the necessary research hypotheses and model assumptions, and explains the symbols used in the model. In Section 3.2, consumer demand is obtained by constructing the consumer utility function. In Section 3.3, the sequential game models under O Model, D1 Model, and D2 Model are constructed and solved.

3.1. Model Description and Symbolic Explanations

In this section, we described the models, proposed research hypotheses, and explained the model hypotheses and related symbols.

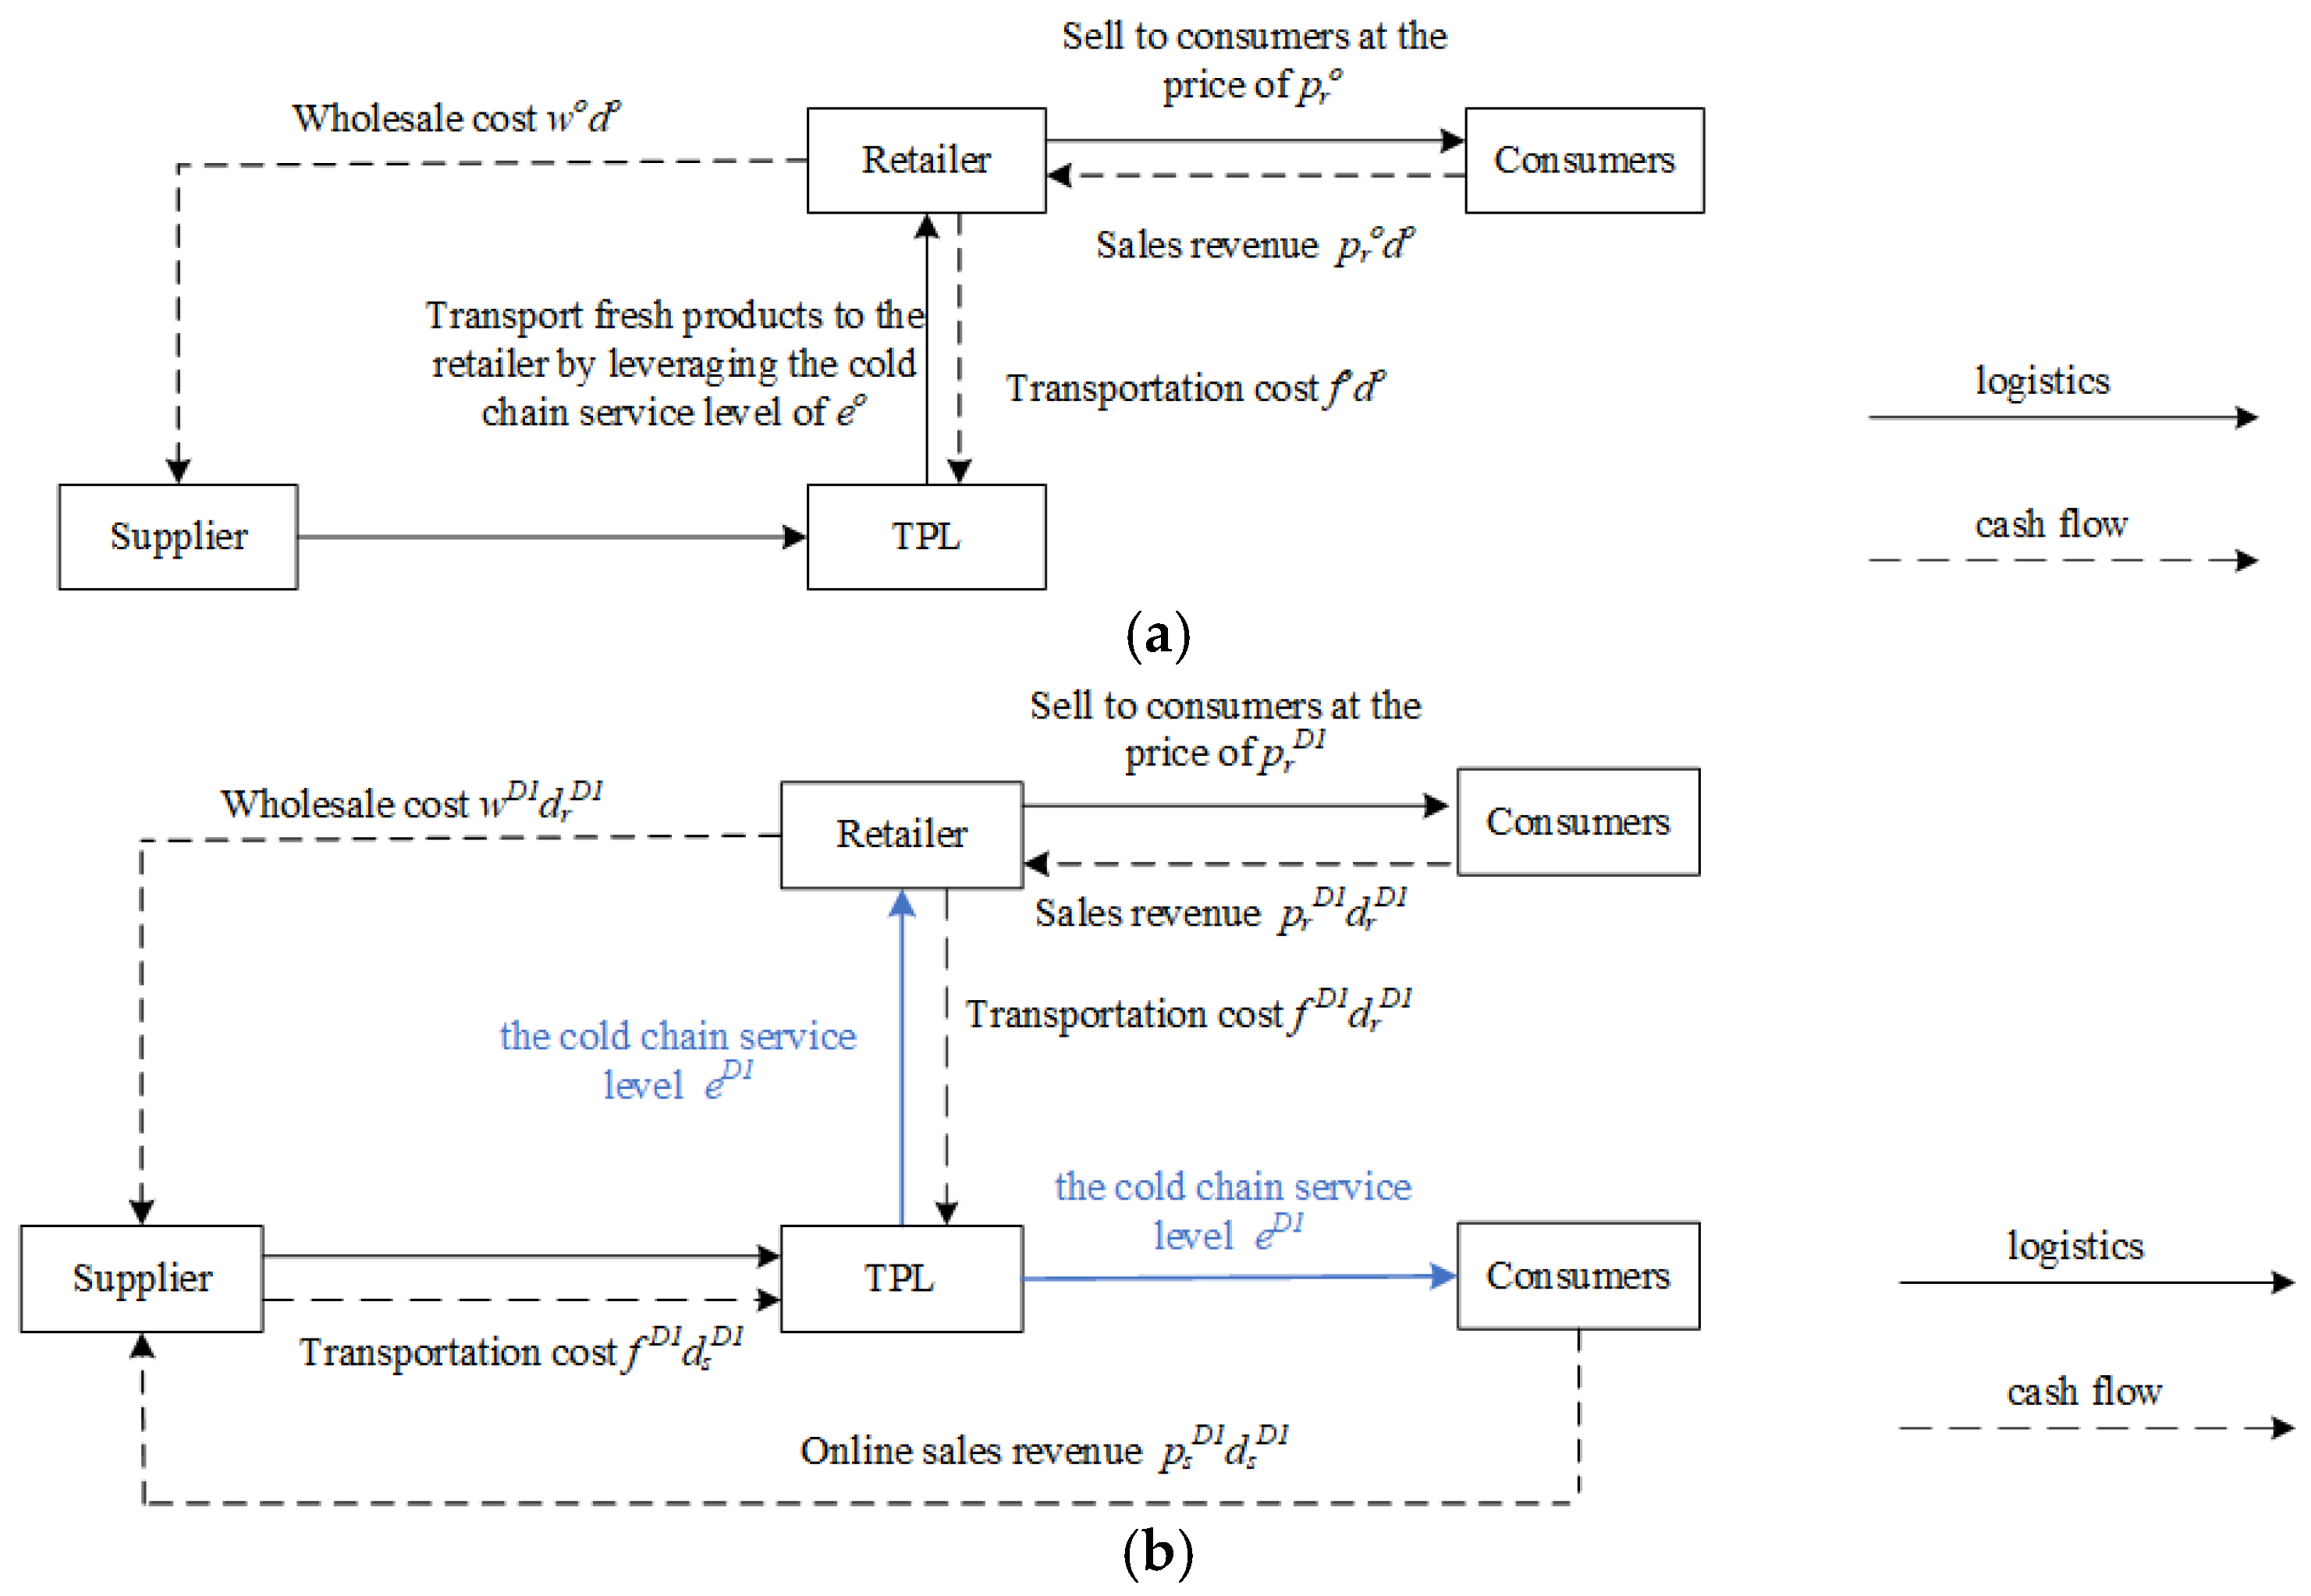
3.1.1. Model Description and Research Hypotheses

Consider a three-tier fresh product supply chain composed of a third-party logistics enterprise (hereinafter referred to as “3PL”), a fresh product supplier (hereinafter referred to as “supplier”), and a fresh product physical retailer (hereinafter referred to as “retailer”). Under the traditional retail channel model, the retailer is responsible for operating the offline channel, the supplier provides fresh products to the retailer, and 3PL undertakes the transportation task from the origin to the sales destination. Ultimately, the retailer sells the fresh products to consumers. In the dual-channel model, on the basis of the retail channel model, the supplier opens an online direct sales channel, that is, the supplier directly sells fresh products to consumers through live streaming, online stores, etc. Since 3PL is responsible for the transportation of dual-channel products from the origin to the sales destination, it can provide the same level of logistics services or differentiated logistics services. Therefore, it is assumed that 3PL can adopt two logistics service strategies in the dual-channel model. The two strategies are as follows: One is to provide the same cold chain logistics services (homogeneous cold-chain service dual-channel model, D1 Model) for the online direct sales channel and the offline retail channel, and the other is to provide differentiated cold chain logistics services (differentiated cold-chain service dual-channel model, D2 Model) for the online direct sales channel and the offline retail channel. As shown in Figure 1. Among them, Figure 1b uses two blue solid lines to represent the same cold chain-service level for both the online and offline channels, and Figure 1c uses one blue solid line to represent the chain-service service level of the offline channel and one red solid line to represent the chain-service service level of the online channel.
Based on the research questions and model descriptions, we propose the following research hypotheses:
H1. 
D2 Model drives higher online cold-chain service levels and marketing efforts.
H2. 
D1 Model and D2 Model outperform the O Model in profitability, with D1 Model achieving higher profits due to homogeneous service-induced scale economies.
H3. 
Consumers’ high sensitivity to prices will prompt supply chain members to lower prices and reduce effort input. Conversely, consumers’ high sensitivity to freshness will increase prices and effort input.

3.1.2. Model Assumptions and Symbolic Explanations

To make the model more practical, we propose the following assumptions:
Assumption 1.
Considering that the freshness of fresh products is affected by the 3PL cold chain service level [39,40], we set the product freshness attenuation function as  θ ( τ ) = θ 0 + η e . Where  θ 0  represents the freshness of fresh products when they reach consumers without preservation.  e  represents the 3PL cold-chain service level1.  η ( 0 < η 1 θ 0 < 1 )  is the influence factor of the 3PL’s cold chain service level on product freshness.
Assumption 2.
Consumers’ purchasing behavior is conducted in accordance with the principle of utility maximization. That is, consumers will have purchasing behavior only when  U > 0 . Suppose that consumers comprehensively consider the impact of the price, the product freshness, and marketing activities on their own utility when making purchasing decisions. In this regard, referring to the research hypotheses in References [39,41], the utility function of consumers for fresh product is described in additive form, that is, in the O Model, the consumer traditional retail channel utility function is  U o f f O = U 0 α p + l θ + γ x r , where  U 0  represents the initial utility brought by fresh product to consumers, which follows a uniform distribution in [0, 1]. α , l , γ  denote consumers’ sensitivity coefficients to price, freshness, and marketing efforts, respectively, and their values are all within the range of (0, 1).  x r  represents the level of marketing efforts2 [42].
In the D1 Model, the consumer online channel utility function is U o n D 1 = h U 0 α p s + l ( θ 0 + η e ) + γ x s , where h represents the degree of consumers’ recognition of online fresh products. Given that consumers cannot touch, inspect and select products when purchasing through online channels, their initial preference for online fresh products is lower than that for offline fresh products. Therefore, it is set that 0 < h < 1 . x s represents the marketing efforts of the supplier on online channels. The consumer offline channel utility function is U o f f D 1 = U 0 α p r + l ( θ 0 + η e ) + γ x r . In the D2 Model, the consumer online channel utility function is U o n D 2 = h U 0 α p s + l ( θ 0 + η e 1 ) + γ x s , the consumer offline channel utility function is U o f f D 2 = U 0 α p r + l ( θ 0 + η e 2 ) + γ x r , where e 1 represents the online channel cold-chain service level, e 2 represents the offline channel cold-chain service level.
Assumption 3.
Within a sales cycle, the potential market demand scale for purchasing fresh products at any point in time in the traditional retail single-channel is constant  a . In the dual-channel system, the potential market demand scale for offline purchases at any point in time is  ρ a , and the potential market demand scale for online purchases is  ( 1 ρ ) a .
Assumption 4.
For simplicity, the unit variable costs (i.e., unit transportation cost, unit production cost, and unit sales cost) of the supplier, 3PL, and retailer are not considered in the text for the time being. Even if these costs were considered, they would not change the main conclusion of this chapter but would only increase the complexity of the mathematical processing. Similar assumptions have been made in the literature [43,44]. Considering that the effort cost increases with the improvement of the effort level, and the rate of increase is getting faster and faster [29]. That is,  c ( e )  has the properties of  c ( e ) / e > 0  and  2 c ( e ) / e 2 > 0 ,  c ( x )  has the properties of  c ( x ) / x > 0  and  2 c ( e ) / e 2 > 0 . In this study, the effort cost function is set as a quadratic form to reflect the economic law of increasing marginal cost, thus, we set the effort cost function for the online channel marketing of the supplier as  c ( x s ) = ( k s x s 2 ) / 2 , the effort cost function for the 3PL cold service as  c ( e ) = ( k t e 2 ) / 2 , and the effort cost function for the offline channel marketing of the retailer as  c ( x r ) = ( k r x r 2 ) / 2 . The effort input is a one-time investment borne by the input entity, where  k s , k t , k r  represent the effort cost coefficients of the 3PL, supplier and retailer, respectively.
The main symbol explanations involved in this article are shown in Table 2.

3.2. Consumer Demand Function

In this section, we use the consumer utility function to describe the consumer demand function under O Model, D2 Model and D2 Model, respectively.

3.2.1. Demand Function of Traditional Retail Channel

In O Model, the probability of consumer purchasing fresh products is P ( U o f f O > 0 ) , the market purchase volume faced by the supply chain system is D o f f O = a P ( U o f f O > 0 ) , then, we can obtain,
D o f f O = a P ( U 0 α p r + l ( θ 0 + η e ) + γ x r > 0 ) = a P ( U 0 > α p r l ( θ 0 + η e ) γ x r ) = a ( 1 α p r + l ( θ 0 + η e ) + γ x r )

3.2.2. Homogeneous Cold-Chain Service Dual-Channel Demand Function

In the D1 Model, 3PL offers the same cold chain service level for both online direct sales channels and offline retail channels. This ensures that there is no difference in the freshness of fresh products between online and offline channels. However, the supplier and the retailer will market their products in their respective channels, and consumers will choose between the two channels based on their own needs. Therefore, we can obtain:
(1)
When U o n D 1 = U o f f D 1 , that is U 0 = α ( p r p s ) γ ( x r x s ) 1 h , consumers do not perceive any difference in the utility of purchasing fresh products through online channels and offline channels.
(2)
When U o n D 1 U o f f D 1 , consumers will make a choice between online direct sales channels and offline retail channels.
D o n D 1 = a P { U o n D 1 > U o f f D 1 , U o n D 1 > 0 } = a P { e l η α p s + γ x s + l θ 0 h < U 0 < α ( p r p s ) γ ( x r x s ) 1 h }
D o f f D 1 = a P { U o f f D 1 > U o n D 1 , U o f f D 1 > 0 } = a P { U 0 > max [ ( e l η + α p r γ x r l θ 0 ) , α ( p r p s ) γ ( x r x s ) 1 h }
Situation 1. If α ( p r p s ) γ ( x r x s ) 1 h < e l η + α p s γ x s l θ 0 , then from Equation (2), we can see that D o n D 1 = 0 , indicating that consumers will not purchase fresh products through online direct sales channels but will only choose to purchase them through offline retail channels. At this time, the consumer demand function faced by the retailer is:
D o f f D 1 = a P { U 0 > e l η + α p s γ x s l θ 0 } = a ( 1 + e l η α p s + γ x s + l θ 0 )
Situation 2. If α ( p r p s ) γ ( x r x s ) 1 h > e l η + α p s γ x s l θ 0 , consumers will purchase fresh products from both channels. At this time, the demand functions faced by the supplier and the retailer, respectively, are:
D o n D 1 = a P { e l η α p s + γ x s + l θ 0 h < U 0 < α ( p r p s ) γ ( x r x s ) 1 h } = a ( α ( p r p s ) γ ( x r x s ) 1 h + e l η α p s + γ x s + l θ 0 h )
D o f f D 1 = a P { U 0 > α ( p r p s ) γ ( x r x s ) 1 h } = a ( 1 α ( p r p s ) γ ( x r x s ) 1 h )
Taking into account that the main focus of this article is to analyze the dual-channel situation; therefore, only Situation 2 is considered, that is, the situation where both the online direct sales channel and the offline retail channel have demand.

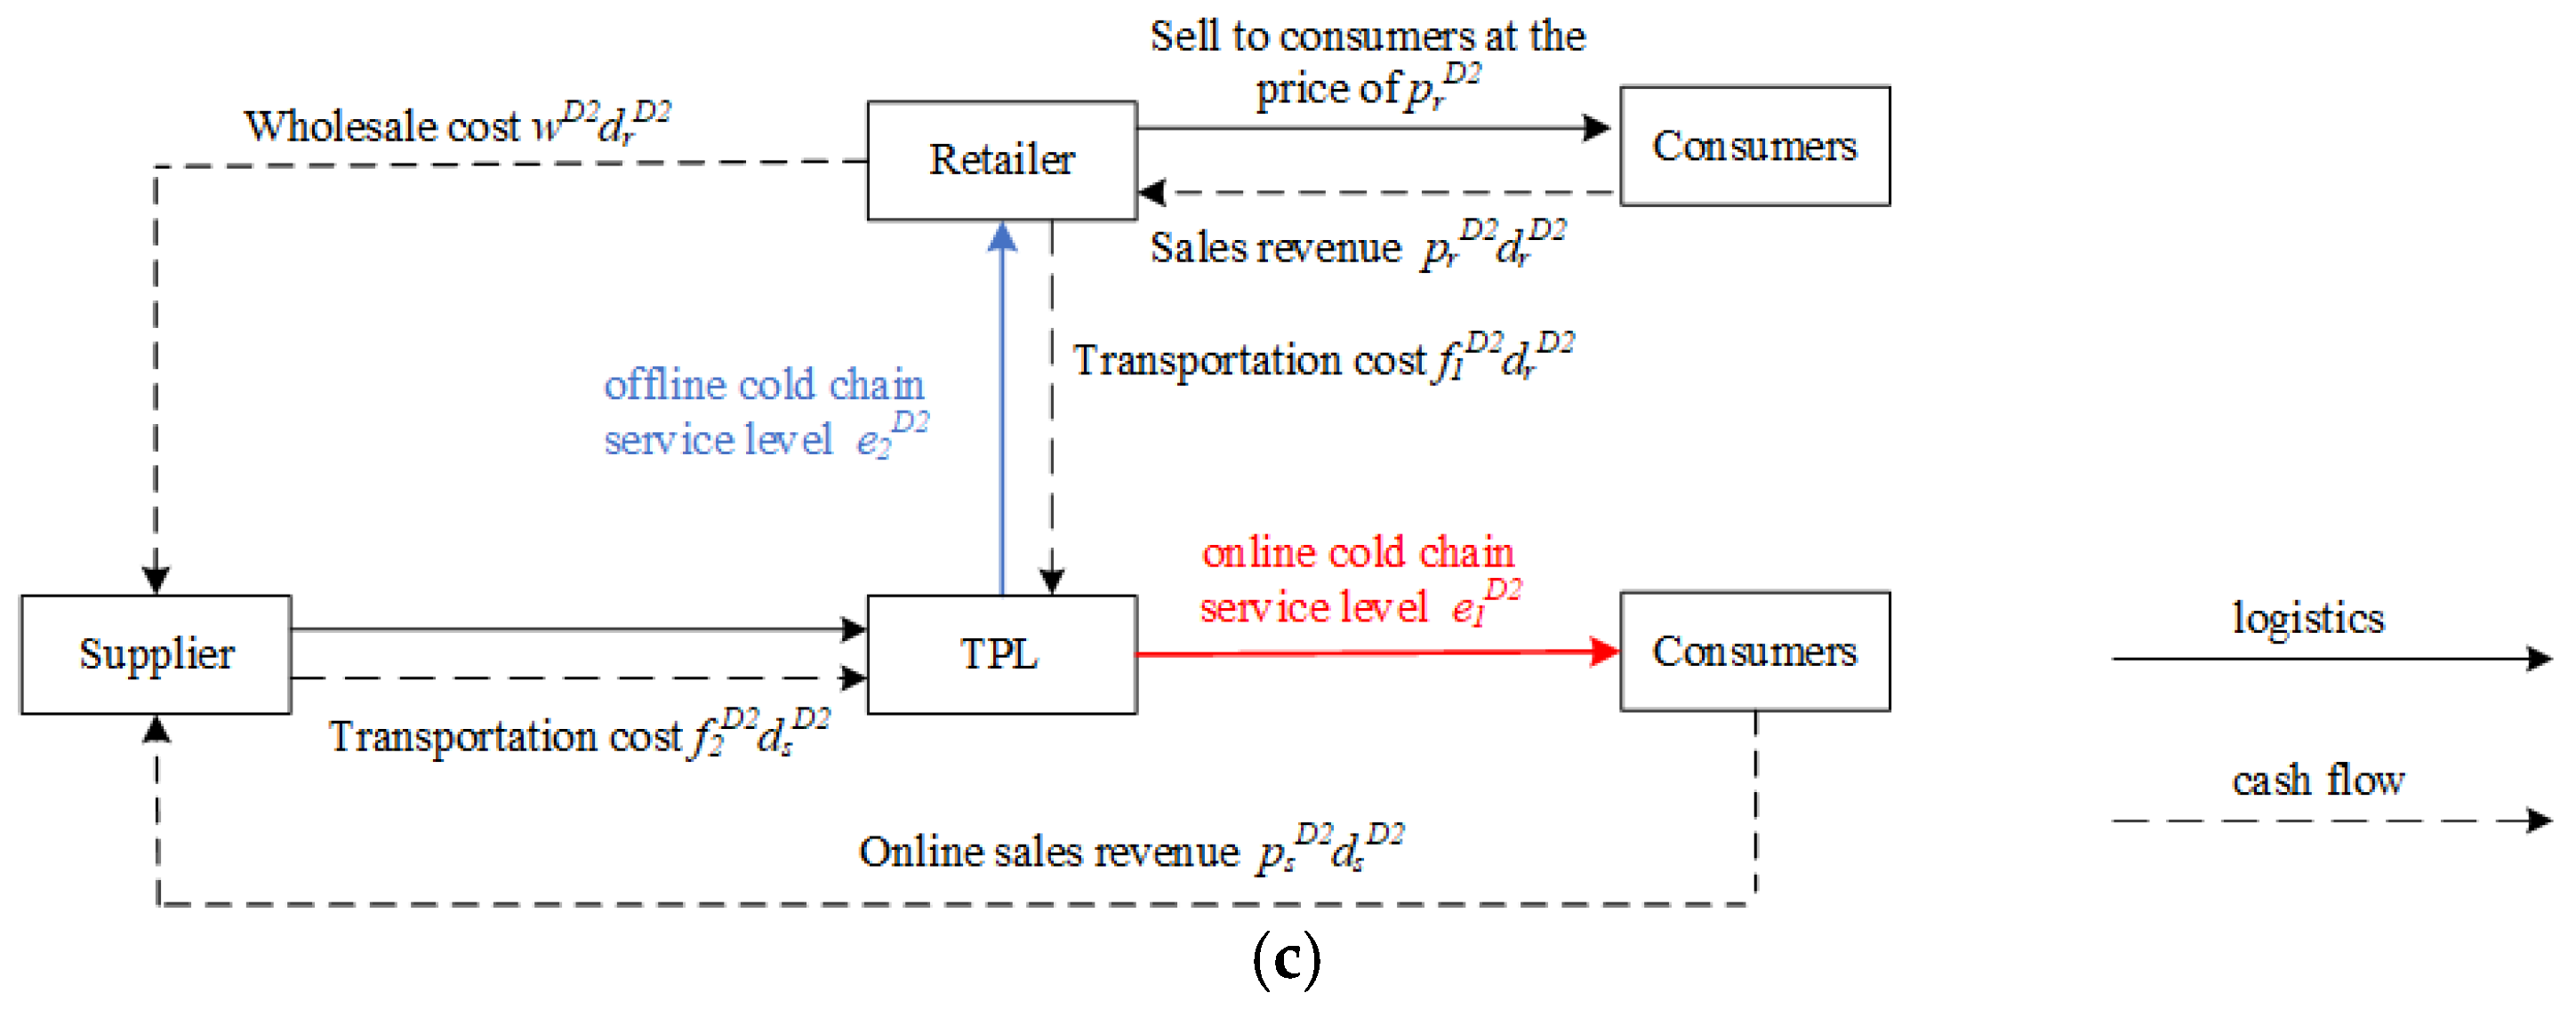
3.2.3. Differentiated Cold-Chain Service Dual-Channel Demand Function

Due to in the D2 Model, 3PL provides e 1 -level cold chain service for online direct sales channels, and e 2 -level cold chain service for offline retail channels, there is a difference in the freshness of fresh products between online and offline channels. Meanwhile, the supplier and the retailer conduct marketing in their respective channels, and consumers make choices between the two channels based on their own needs. Therefore, we can obtain:
(1)
When U o n D 2 = U o f f D 2 , that is U 0 = α ( p r p s ) + l η ( e 1 e 2 ) γ ( x r x s ) 1 h , consumers do not perceive any difference in the utility of purchasing fresh products through online channels and offline channels.
(2)
When U o n D 2 U o f f D 2 , consumers will make a choice between online direct sales channels and offline retail channels.
D o n D 2 = a P { U o n D 2 > U o f f D 2 , U o n D 2 > 0 } = a P { α p s l ( θ 0 + η e 1 ) γ x s h < U 0 < α ( p r p s ) + l η ( e 1 e 2 ) γ ( x r x s ) 1 h }
D o f f D 2 = a P { U o f f D 2 > U o n D 2 , U o f f D 2 > 0 } = a P { U 0 > max [ ( α p r l ( θ 0 + e 2 ) γ x r ) , α ( p r p s ) + l η ( e 1 e 2 ) γ ( x r x s ) 1 h }
Situation 1. If α ( p r p s ) + l η ( e 1 e 2 ) γ ( x r x s ) 1 h < α p r l ( θ 0 + e 2 ) γ x r , then from Equation (7), we can see that D o n D 2 = 0 , indicating that consumers will not purchase fresh products through online direct sales channels but will only choose to purchase them through offline retail channels. At this time, the consumer demand function faced by the retailer is:
D o f f D 1 = a P { U 0 > α p r l ( θ 0 + e 2 ) γ x r } = a ( 1 α p r + l ( θ 0 + e 2 ) + γ x r )
Situation 2. If α ( p r p s ) + l η ( e 1 e 2 ) γ ( x r x s ) 1 h > α p r l ( θ 0 + e 2 ) γ x r , consumers will purchase fresh products from both channels. At this time, the demand functions faced by the supplier and the retailer, respectively, are:
D o n D 2 = a P { α p s l ( θ 0 + η e 1 ) γ x s h < U 0 < α ( p r p s ) + l η ( e 1 e 2 ) γ ( x r x s ) 1 h } = a ( α ( p r p s ) + l η ( e 1 e 2 ) γ ( x r x s ) 1 h α p s l ( θ 0 + η e 1 ) γ x s h )
D o f f D 2 = a P { U 0 > α ( p r p s ) + l η ( e 1 e 2 ) γ ( x r x s ) 1 h } = a ( 1 α ( p r p s ) + l η ( e 1 e 2 ) γ ( x r x s ) 1 h )
Taking into account that the main focus of this article is to analyze the dual-channel situation; therefore, only Situation 2 is considered, that is, the situation where both the online direct sales channel and the offline retail channel have demand.

3.3. Mathematical Model

In this section, we constructed and solved the member sequential game models under O Model, D2 Model and D2 Model, and obtained the optimal pricing and effort input decisions of the supply chain under the three models.

3.3.1. Traditional Retail Channel Decision-Making Model

In O Model, only the retailer sells fresh products to consumers. The 3PL is responsible for transporting the products from the supplier to the retailer and the retailer is responsible for paying the corresponding transportation costs. A sequential game is conducted among the three parties, with the 3PL as the first decision-maker, the supplier as the second decision-maker, and the retailer as the third decision-maker. Each of them makes decisions based on the maximization of their own profits. The decision sequence is as follows: First, the 3PL decides on the cold chain service level and the transportation price; second, the supplier determines the wholesale price based on the information provided by the 3PL; finally, the retailer determines the final selling price and marketing efforts based on the wholesale price from the supplier and the information on the cold chain service and transportation provided by the 3PL. In O Model, the profit functions of the three members are as follows:
π t O = f ( a ( 1 α p r + l ( θ 0 + η e ) + γ x r ) ) 1 2 k t e 2
π s O = w ( a ( 1 α p r + l ( θ 0 + η e ) + γ x r ) )
π r O = ( p r w f ) ( a ( 1 α p r + l ( θ 0 + η e ) + γ x r ) ) 1 2 k r x r 2
Among these, the profit of the 3PL, as represented by Equation (12), consists of two parts: transportation revenue and service cost. The profit of the supplier, as shown in Equation (13), is the wholesale income. The profit of the retailer, as presented in Equation (14), consists of two parts: sales revenue and offline marketing cost.
By applying backward induction, Theorem 1 can be derived.
Theorem 1.
In the O Model,
The optimal transportation price is,  f O * = 2 ( a γ 2 2 α k r ) k t ( 1 + l θ 0 ) α ( 4 a γ 2 k t + k r ( a l 2 η 2 8 α k t ) )
The optimal cold-chain service level is,  e O * = a l η k r ( 1 + l θ 0 ) 4 a γ 2 k t + k r ( a l 2 η 2 8 α k t )
The optimal wholesale price is,  w O * = ( a γ 2 + 2 α k r ) k t ( 1 + l θ 0 ) α ( 4 a γ 2 k t + k r ( a l 2 η 2 + 8 α k t ) )
The optimal offline sales price is,  p r O * = ( 3 a γ 2 + 7 α k r ) k t ( 1 + l θ 0 ) α ( 4 a γ 2 k t + k r ( a l 2 η 2 + 8 α k t ) )
The optimal offline marketing effort is,  x r O * = a γ k t ( 1 + l θ 0 ) ) 4 a γ 2 k t + k r ( a l 2 η 2 8 α k t )
Proof. 
Taking the second-order condition of Equation (14) with respect to p r , x r , we obtain 2 π r O p r 2 = 2 α , 2 π r O p r x r = γ , 2 π r O x r p r = γ , 2 π r O x r 2 = k r , then we can obtain the Hessian matrix of π r O with respect to p r , x r is H = 2 α γ γ k r , due to 2 α < 0 , only when γ 2 + 2 b k r > 0 , the Hesse matrix is a negative definite matrix, that is, π r O is a concave function with respect to p r , x r , and there exists a unique solution for p r , x r . Let π r O p r = 0 , π r O x r = 0 , we can obtain p r = γ 2 ( f + w ) k r ( a + α ( f + w ) + e l η + l θ 0 ) γ 2 2 α k r , x r = γ ( a α ( f + w ) + l ( e η + θ 0 ) ) γ 2 2 α k r .
Substituting p r , x r into Equation (13), and taking the second-order condition of Equation (13) with respect to w , we obtain, 2 π s O w 2 = 2 α 2 k r γ 2 + 2 α k r < 0 . π s O is concave in w . Solving the first-order condition π s O w = 0 for w , we obtain w = a α f + e l η + l θ 0 2 α . Substituting p r , x r , w into Equation (12), we obtain π t O . Taking the second-order condition of π t O with respect to f , e , we obtain 2 π t O f 2 = 2 α 2 k r 2 γ 2 + 4 α k r , 2 π t O f e = l α η k r 2 γ 2 + 4 α k , 2 E ( π t ) e f = l η k r 2 γ 2 + 4 α k , 2 π t O e 2 = k t , then we can obtain the Hessian matrix of π t O with respect to f , e is H = 2 α 2 k r 2 γ 2 + 4 α k r l α η k r 2 γ 2 + 4 α k l α η k r 2 γ 2 + 4 α k k t , due to 2 α 2 k r 2 γ 2 + 4 α k r < 0 , only when α 2 k r ( 4 γ 2 k t + k r ( l 2 η 2 + 8 α k t ) ) 4 ( γ 2 2 α k r ) 2 > 0 , the Hesse matrix is a negative definite matrix, that is, π t O is a concave function with respect to f , e , and there exists a unique solution for f , e . Let π t O f = 0 , π t O e = 0 , we can obtain f O * = 2 ( a γ 2 2 α k r ) k t ( 1 + l θ 0 ) α ( 4 a γ 2 k t + k r ( a l 2 η 2 8 α k t ) ) , e O * = a l η k r ( 1 + l θ 0 ) 4 a γ 2 k t + k r ( a l 2 η 2 8 α k t ) . Substituting f O * , e O * into w , p r , x r , we can obtain w O * = ( a γ 2 + 2 α k r ) k t ( 1 + l θ 0 ) α ( 4 a γ 2 k t + k r ( a l 2 η 2 + 8 α k t ) ) , p r O * = ( 3 a γ 2 + 7 α k r ) k t ( 1 + l θ 0 ) α ( 4 a γ 2 k t + k r ( a l 2 η 2 + 8 α k t ) ) , x r O * = a γ k t ( 1 + l θ 0 ) ) 4 a γ 2 k t + k r ( a l 2 η 2 8 α k t ) . □

3.3.2. Homogeneous Logistics Service Dual-Channel Decision-Making Model

Under the D1 Model, the supplier and the retailer operate their own online and offline channels, respectively. 3PL is responsible for transporting fresh products from the supplier to the retailer and maintaining the same cold chain service level throughout the process. Both the supplier and the retailer pay the corresponding transportation fees. The three members also engage in sequential games, each aiming to maximize profits by making decisions. The decision-making sequence is as follows: Firstly, 3PL determines the cold chain service level and transportation prices; Secondly, the supplier determines the wholesale prices, online selling prices and marketing efforts based on the information provided by 3PL; Finally, the retailer determines the offline selling price and marketing efforts based on the pricing and marketing efforts of the previous two. The profit functions of the three members in the D1 Model are as follows:
π t D 1 = f ( D o n D 1 + D o f f D 1 ) 1 2 k t e 2 = a f ( e l η α p s + γ x s + l θ 0 h + 1 ) 1 2 k t e 2
π s D 1 = w a ( 1 α ( p r p s ) γ ( x r x s ) 1 h ) + = ( p s f ) a ( α ( p r p s ) γ ( x r x s ) 1 h + e l η α p s + γ x s + l θ 0 h ) 1 2 k s x s 2
π r D 1 = ( p r w f ) a ( 1 α ( p r p s ) γ ( x r x s ) 1 h ) 1 2 k r x r 2
Among these, the profit of the 3PL, as represented by Equation (15), consists of two parts: transportation revenue and service effort cost. The profit of the supplier, as depicted by Equation (16), comprises three parts: wholesale revenue, online sales revenue, and online marketing effort cost. The profit of the retailer, as indicated by Equation (17), consists of two parts: offline sales revenue and offline marketing effort cost.
By applying backward induction, Theorem 2 can be derived.
Theorem 2.
In the D1 Model,
The optimal transportation price is,  f D 1 * = 2 A 1 k t A 2 α A 3 ( a l 2 η 2 A 3 + 4 A 1 k t )
The optimal cold chain service level is,   e D 1 * = a l η A 2 a l 2 η 2 A 3 + a A 1 k t
The optimal wholesale price is,  w D 1 * = 1 2 α ( 1 + l θ 0 + a l 2 η 2 A 2 l 2 η 2 A 3 + 4 A 1 k t 2 A 1 k t A 2 A 3 ( a l 2 η 2 A 3 + 4 A 1 k t ) )
The optimal online selling price is,  p s D 1 * = D 1 k t A 2 α A 3 ( 2 a γ 2 D 2 + k r D 3 )
The optimal online marketing effort is,  x s D 1 * = α γ ( 4 a 2 γ 4 k s k t ( h + l θ 0 ) + ( 1 + h ) k r 2 E 1 + 2 a γ 2 k r E 2 ) A 3 ( 2 a γ 2 D 2 + k r D 3 )
The optimal offline sales price is, 
p r D 1 * = ( ( 2 a 2 γ 4 k s F 1 + α k r 2 ( a 2 ( 7 + 4 h ) γ 4 k t ( 1 + + l θ 0 ) + 12 ( 1 + h ) 2 α k s 2 F 2 + a ( 1 + h ) γ 2 k s F 3 ) + = a γ 2 k r ( 3 a 2 γ 4 k t ( 1 + l θ 0 ) + 2 ( 1 + h ) α k s 2 F 4 + a γ 2 k s ) ) / ( α D 2 ( 2 a γ 2 + k r D 3 ) ) )
The optimal offline marketing effort is, 
x r D 1 * = ( ( a γ ( 2 a γ 2 k s G 1 + k r ( 4 ( 1 + h ) 2 α k s 2 ( a l 2 η 2 + 4 h α k t ) + a 2 γ 4 k t ( 1 + l θ 0 ) a ( 1 + h ) γ 2 k s = ( a l 2 η 2 4 α k t ( 2 + l θ 0 ) ) ) ) ) / ( D 2 ( 2 a γ 2 + k r D 3 ) ) )
The proof process for Theorem 2 is similar to that for Theorem 1, so it will not be elaborated on further. However, it is worth noting that, given the complexity of the aforementioned expressions and the limited space, we will substitute some of the expressions with capital English letters, as demonstrated below:
A 1 = a γ 2 ( a γ 2 + ( 2 + h ) α k r ) 2 h α ( a γ 2 + 2 ( 1 + h ) α k r ) k s A 2 = 2 a γ 2 k s ( h + l θ 0 ) + k r ( a γ 2 ( 1 + l θ 0 ) + 4 ( 1 + h ) α k s ( h + l θ 0 ) ) A 3 = 2 a γ 2 k s + k r ( a γ 2 + 4 ( 1 + h ) α k s )
D 1 = 2 a γ 2 ( a γ 2 3 h α k s ) + α k r ( a ( 4 + h ) γ 2 12 ( 1 + h ) h α k s ) D 2 = 2 a γ 2 k t + k s ( a l 2 η 2 4 h α k t ) D 3 = a γ 2 ( a l 2 η 2 + 4 ( 2 + h ) α k t ) + 4 ( 1 + h ) α k s ( a l 2 η 2 4 h α k t )
E 1 = 4 ( 1 + h ) l α k s ( a l η 2 + 4 α k t θ 0 ) + a γ 2 ( a l 2 η 2 + 4 α k t ( 1 + h + l θ 0 ) ) E 2 = a γ 2 k t ( 1 + 2 h + l θ 0 ) + ( 1 + h ) k s ( a l 2 η 2 + 4 α k t ( h + 2 l θ 0 ) )
F 1 = a γ 2 k t ( 2 + h + 3 l θ 0 ) k s ( a ( 1 + h ) l 2 η 2 + 2 h α k t ( 2 + h + 3 l θ 0 ) ) F 2 = a ( 1 + h ) l 2 η 2 + 4 h α k t ( 1 + l θ 0 ) F 3 = 3 a ( 1 + h ) l 2 η 2 a α k t ( 6 h + h 2 + ( 7 + h ) l θ 0 ) F 4 = 5 a ( 1 + h ) l 2 η 2 + 4 h α k t ( 5 + h + 6 l θ 0 ) F 5 = a ( 1 + h ) l 2 η 2 2 α k t ( 2 ( 5 + h + h 2 ) + ( 13 + 7 h ) l θ 0 )
G 1 = ( 1 + h ) k s ( a l 2 η 2 + 4 a k t ) + a γ 2 k t ( 2 h + l θ 0 )

3.3.3. Differentiated Logistics Service Dual-Channel Decision-Making Model

Under the D2 Model, the supplier and the retailer operate their own online and offline channels, respectively. 3PL is responsible for transporting fresh products from the supplier to the retailer and providing differentiated cold chain services for both online and offline channels. It is similar to having two specialized departments within 3PL to handle the transportation tasks for the two channels, respectively. Both the supplier and the retailer pay the corresponding transportation fees. The three members also engage in sequential games, each aiming to maximize its own utility in decision-making. The decision-making sequence is as follows: Firstly, 3PL determines the cold chain service level and transportation prices; Secondly, the supplier determines the wholesale prices, online selling prices and marketing efforts based on the information provided by 3PL; Finally, the retailer determines the offline selling prices and marketing efforts based on the pricing and effort information from the previous two. The profit functions of the three members in the D2 Model are as follows:
π t D 2 = f 1 D o n D 2 + f 2 D o f f D 2 1 2 k t 1 e 1 2 1 2 k t 2 e 2 2 = f 1 a ( α ( p r p s ) + l η ( e 1 e 2 ) γ ( x r x s ) 1 h α p s l ( θ 0 + η e 1 ) γ x s h ) + f 2 a ( 1 α ( p r p s ) + l η ( e 1 e 2 ) γ ( x r x s ) 1 h ) 1 2 k t 1 e 1 2 1 2 k t 2 e 2 2
π s D 2 = w D o f f D 2 + ( p s f 1 ) D o n D 2 1 2 k s x s 2 = w a ( 1 α ( p r p s ) + l η ( e 1 e 2 ) γ ( x r x s ) 1 h ) + ( p s f 1 ) a ( α ( p r p s ) + l η ( e 1 e 2 ) γ ( x r x s ) 1 h α p s l ( θ 0 + η e 1 ) γ x s h ) 1 2 k s x s 2
π r D 2 = ( p r w f 2 ) D o f f D 2 1 2 k r x r 2 = ( p r w f 2 ) a ( 1 α ( p r p s ) + l η ( e 1 e 2 ) γ ( x r x s ) 1 h ) 1 2 k r x r 2
Among these, the profit of the 3PL, as represented by Equation (12), comprises four parts: online transportation revenue, offline transportation revenue, online service effort cost, and offline service effort cost. The profit of the supplier, as depicted by Equation (18), consists of three parts: wholesale revenue, online sales revenue, and online marketing effort cost. The profit of the retailer, as indicated by Equation (20), consists of two parts: offline sales revenue and offline marketing effort cost.
By applying backward induction, Theorem 3 can be derived.
Theorem 3.
In the D2 Model,
The optimal online transportation price is, 
f 1 D 2 * = 4 a γ 2 ( a γ 2 2 h α k s ) k t 1 k t 2 ( h + l θ 0 ) + k r ( 2 a h l 2 α η 2 k s k t 2 ( 1 + l θ 0 ) k t 1 H 1 ( h + l θ 0 ) ) α ( a l 2 η 2 k r H 2 + 4 ( 2 a γ 2 ( a γ 2 + ( 2 + h ) α k r ) k t 1 + k s H 3 ) k t 2 )
The optimal offline transportation price is, 
f 2 D 2 * = 2 a γ 2 H 2 k t 2 ( 1 + l θ 0 ) + 2 α k r ( 2 a ( 2 + h ) γ 2 k t 1 k t 2 ( 1 + l θ 0 ) + k s I 1 ) α ( a l 2 η 2 k r H 2 + 4 ( 2 a γ 2 ( a γ 2 + ( 2 + h ) α k r ) k t 1 + k s H 3 ) k t 2 )
The optimal online cold chain service level is, 
e 1 D 2 * = a l η k s J 1 a l 2 η 2 k r H 2 + 4 ( 2 a γ 2 ( a γ 2 + ( 2 + h ) α k r ) k t 1 + k s H 3 ) k t 2
The optimal offline cold chain service level is, 
e 2 D 2 * = a l η k r K 1 a l 2 η 2 k r H 2 + 4 ( 2 a γ 2 ( a γ 2 + ( 2 + h ) α k r ) k t 1 + k s H 3 ) k t 2
The optimal online selling price is, 
P s D 2 * = L 1 + k r ( 3 a h l 2 α η 2 k s k t 2 ( 1 + l θ 0 ) k t 1 ( L 2 + a γ 2 L 3 ) ) α ( 4 a γ 2 H 2 k t 2 + k r ( 2 a γ 2 k t 1 ( a l 2 η 2 + 4 ( 2 + h ) α k t 2 ) + k s L 4 ) )
The optimal wholesale price is, 
w D 2 * = a γ 2 H 2 k t 2 ( 1 + l θ 0 ) + α k r ( 2 a ( 2 + h ) γ 2 k t 1 k t 2 ( 1 + l θ 0 ) + k s M 1 ) α ( 4 a γ 2 H 2 k t 2 + k r ( 2 a γ 2 k t 1 ( a l 2 η 2 + 4 ( 2 + h ) α k t 2 ) + k s L 4 ) )
The optimal online marketing effort is, 
x s D 2 * = a γ k t 1 J 1 4 a γ 2 H 2 k t 2 + k r ( 2 a γ 2 k t 1 ( a l 2 η 2 + 4 ( 2 + h ) α k t 2 ) + k s L 4 )
The optimal offline sales price is, 
P r D 2 * = 3 a γ 2 H 2 k t 2 ( 1 + l θ 0 ) + α k r ( 2 a ( 7 + a h ) γ 2 k t 1 k t 2 ( 1 + l θ 0 ) + k s N 1 ) α ( 4 a γ 2 H 2 k t 2 + k r ( 2 a γ 2 k t 1 ( a l 2 η 2 + 4 ( 2 + h ) α k t 2 ) + k s L 4 ) )
The optimal offline marketing effort is, 
x r D 2 * = a γ k t 2 K 1 4 a γ 2 H 2 k t 2 + k r ( 2 a γ 2 k t 1 ( a l 2 η 2 + 4 ( 2 + h ) α k t 2 ) + k s L 4 )
The proof process for Theorem 3 is similar to that for Theorem 1, so it will not be elaborated on further. However, it is worth noting that, given the complexity of the aforementioned expressions and the limited space, we will substitute some of the expressions with capital English letters, as demonstrated below:
H 1 = a l 2 η 2 ( a γ 2 2 h α k s ) + 4 α ( a ( 2 + h ) γ 2 4 ( 1 + h ) h α k s ) k t 2 H 2 = 2 a γ 2 k t 1 + k s ( a l 2 η 2 4 h α k t 1 ) H 3 = a l 2 η 2 ( a γ 2 + ( 2 + h ) α k r ) 4 h α ( a γ 2 + 2 ( 1 + h ) α k r ) k t 1
I 1 = 4 ( 2 + h ) l 2 η 2 k t 2 ( 1 + l θ 0 ) + h k t 1 ( 8 ( 1 + h ) α k t 2 ( 1 + l θ 0 ) + a l 2 η 2 ( h + l θ 0 )
J 1 = 4 a γ 2 k t 2 ( h + l θ 0 ) + k r ( a l 2 η 2 ( h + l θ 0 ) 4 ( 1 + h ) α k t 2 ( h + 2 l θ 0 ) )
K 1 = 2 a γ 2 k t 1 ( 1 + l θ 0 ) + k s ( 4 ( 1 + h ) h α k t 1 + a l 2 η 2 ( 1 + l θ 0 ) )
L 1 = 4 a γ 2 ( a γ 2 3 h α k s ) k t 1 k t 2 ( h + l θ 0 ) L 2 = 3 h α k s ( a l 2 η 2 + 8 ( 1 + h ) α k t 2 ) ( h + l θ 0 ) L 3 = a l 2 η 2 ( h + l θ 0 ) + 2 α k t 2 ( h ( 5 + 2 h ) + ( 4 + h ) l θ 0 ) L 4 = a l 2 η 2 ( a l 2 η 2 + 4 ( 2 + h ) α k t 2 ) 4 h α k t 1 ( a l 2 η 2 + 8 ( 1 + h ) α k t 2 )
M 1 = 4 ( 2 + h ) l 2 η 2 k t 2 ( 1 + l θ 0 ) + h k t 1 ( 8 ( 1 + h ) α k t 2 ( 1 + l θ 0 ) + a l 2 η 2 ( h + l θ 0 ) )
N 1 = a ( 7 + 4 h ) l 2 η 2 k t 2 ( 1 + l θ 0 ) + h k t 1 ( 4 ( 1 + h ) α k t 2 ( 7 + h 6 l θ 0 ) + 3 a 2 η 2 ( h + l θ 0 )

4. Numerical Experiments

Due to the complexity of the balance result expression, it is not easy to directly analyze and draw important conclusions. Therefore, in this section, numerical simulation methods will be adopted through MATLAB R2020b to study the supply chain decisions and profit levels under different models, as well as the impact of changes in consumer behavior on equilibrium decisions. In this section, referring to the settings of relevant parameters in the reference of Li and Zhao [45] and the data obtained from the survey of China’s fresh product e-commerce industry, we take a leading enterprise in Yantai City, Shandong Province, China as an example. This enterprise produces high-quality cherries, supplies them to a traditional fruit supermarket in Beijing, and conducts electronic direct sales on the Tmall Supermarket platform. After on-site investigation and data collation, the market demand capacity in the Beijing area is 10 tons, the initial freshness is 0.8, the consumers’ recognition of the freshness of cherries sold on online platforms is 0.6, and the influence factor of the 3PL cold-chain service level on the freshness of cherries is 0.12. The parameters and their settings are shown in Table 3.

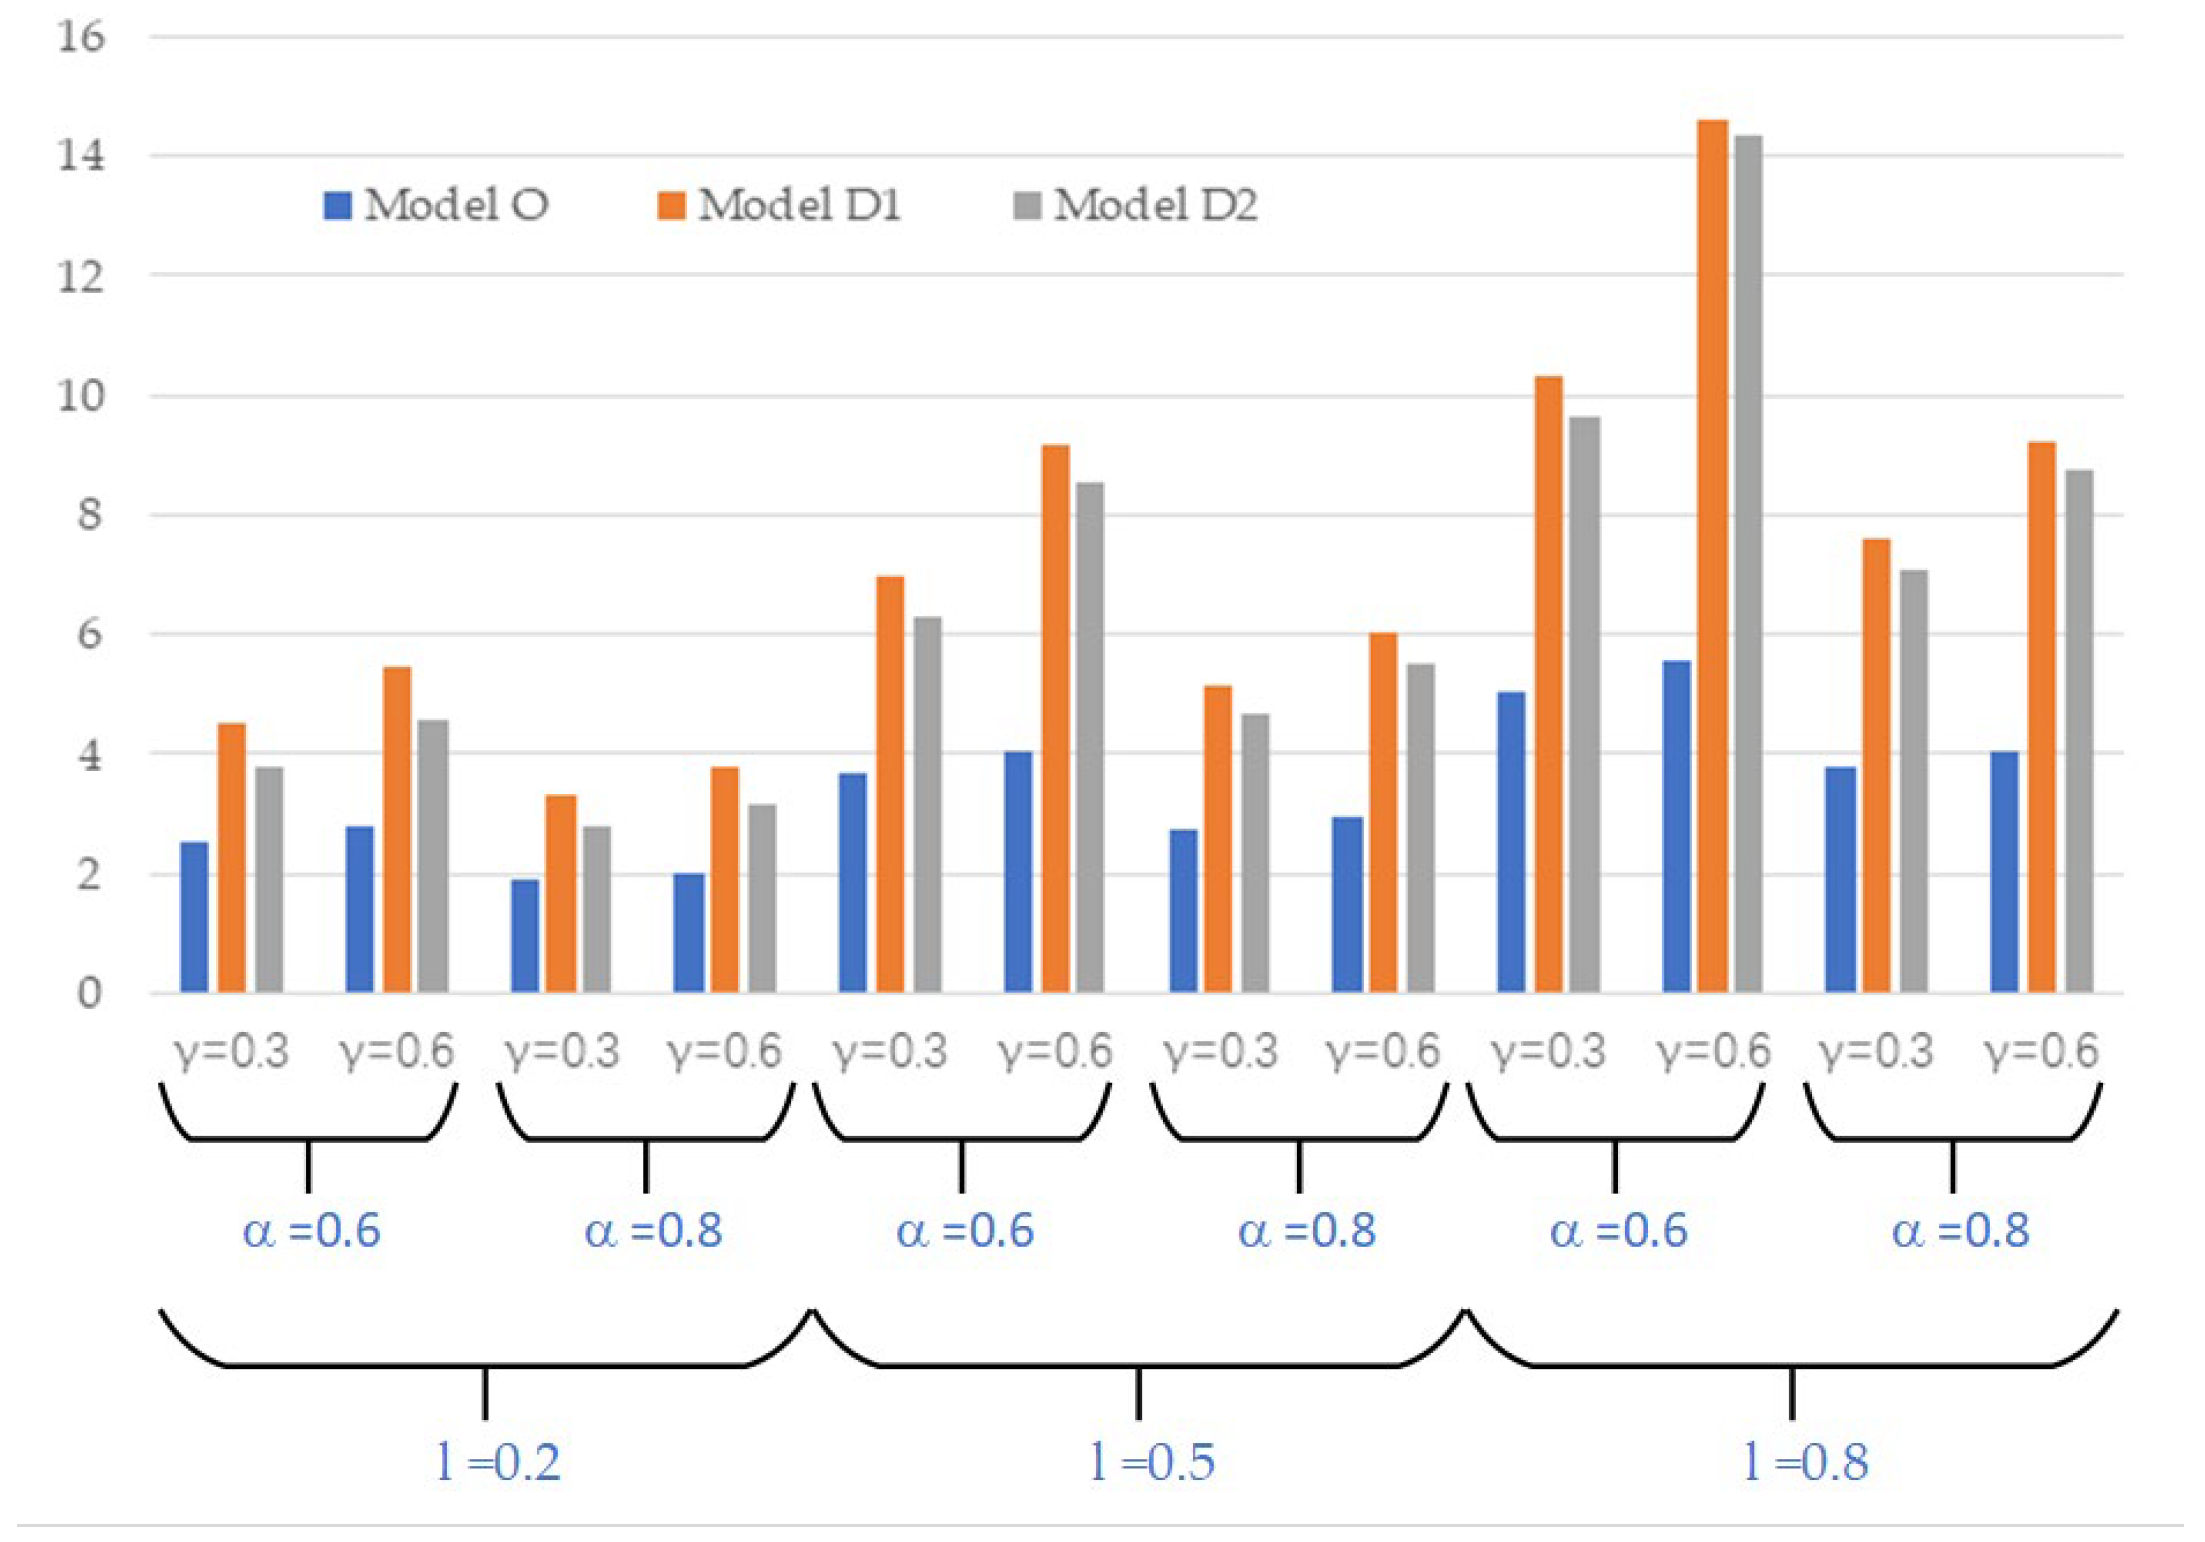
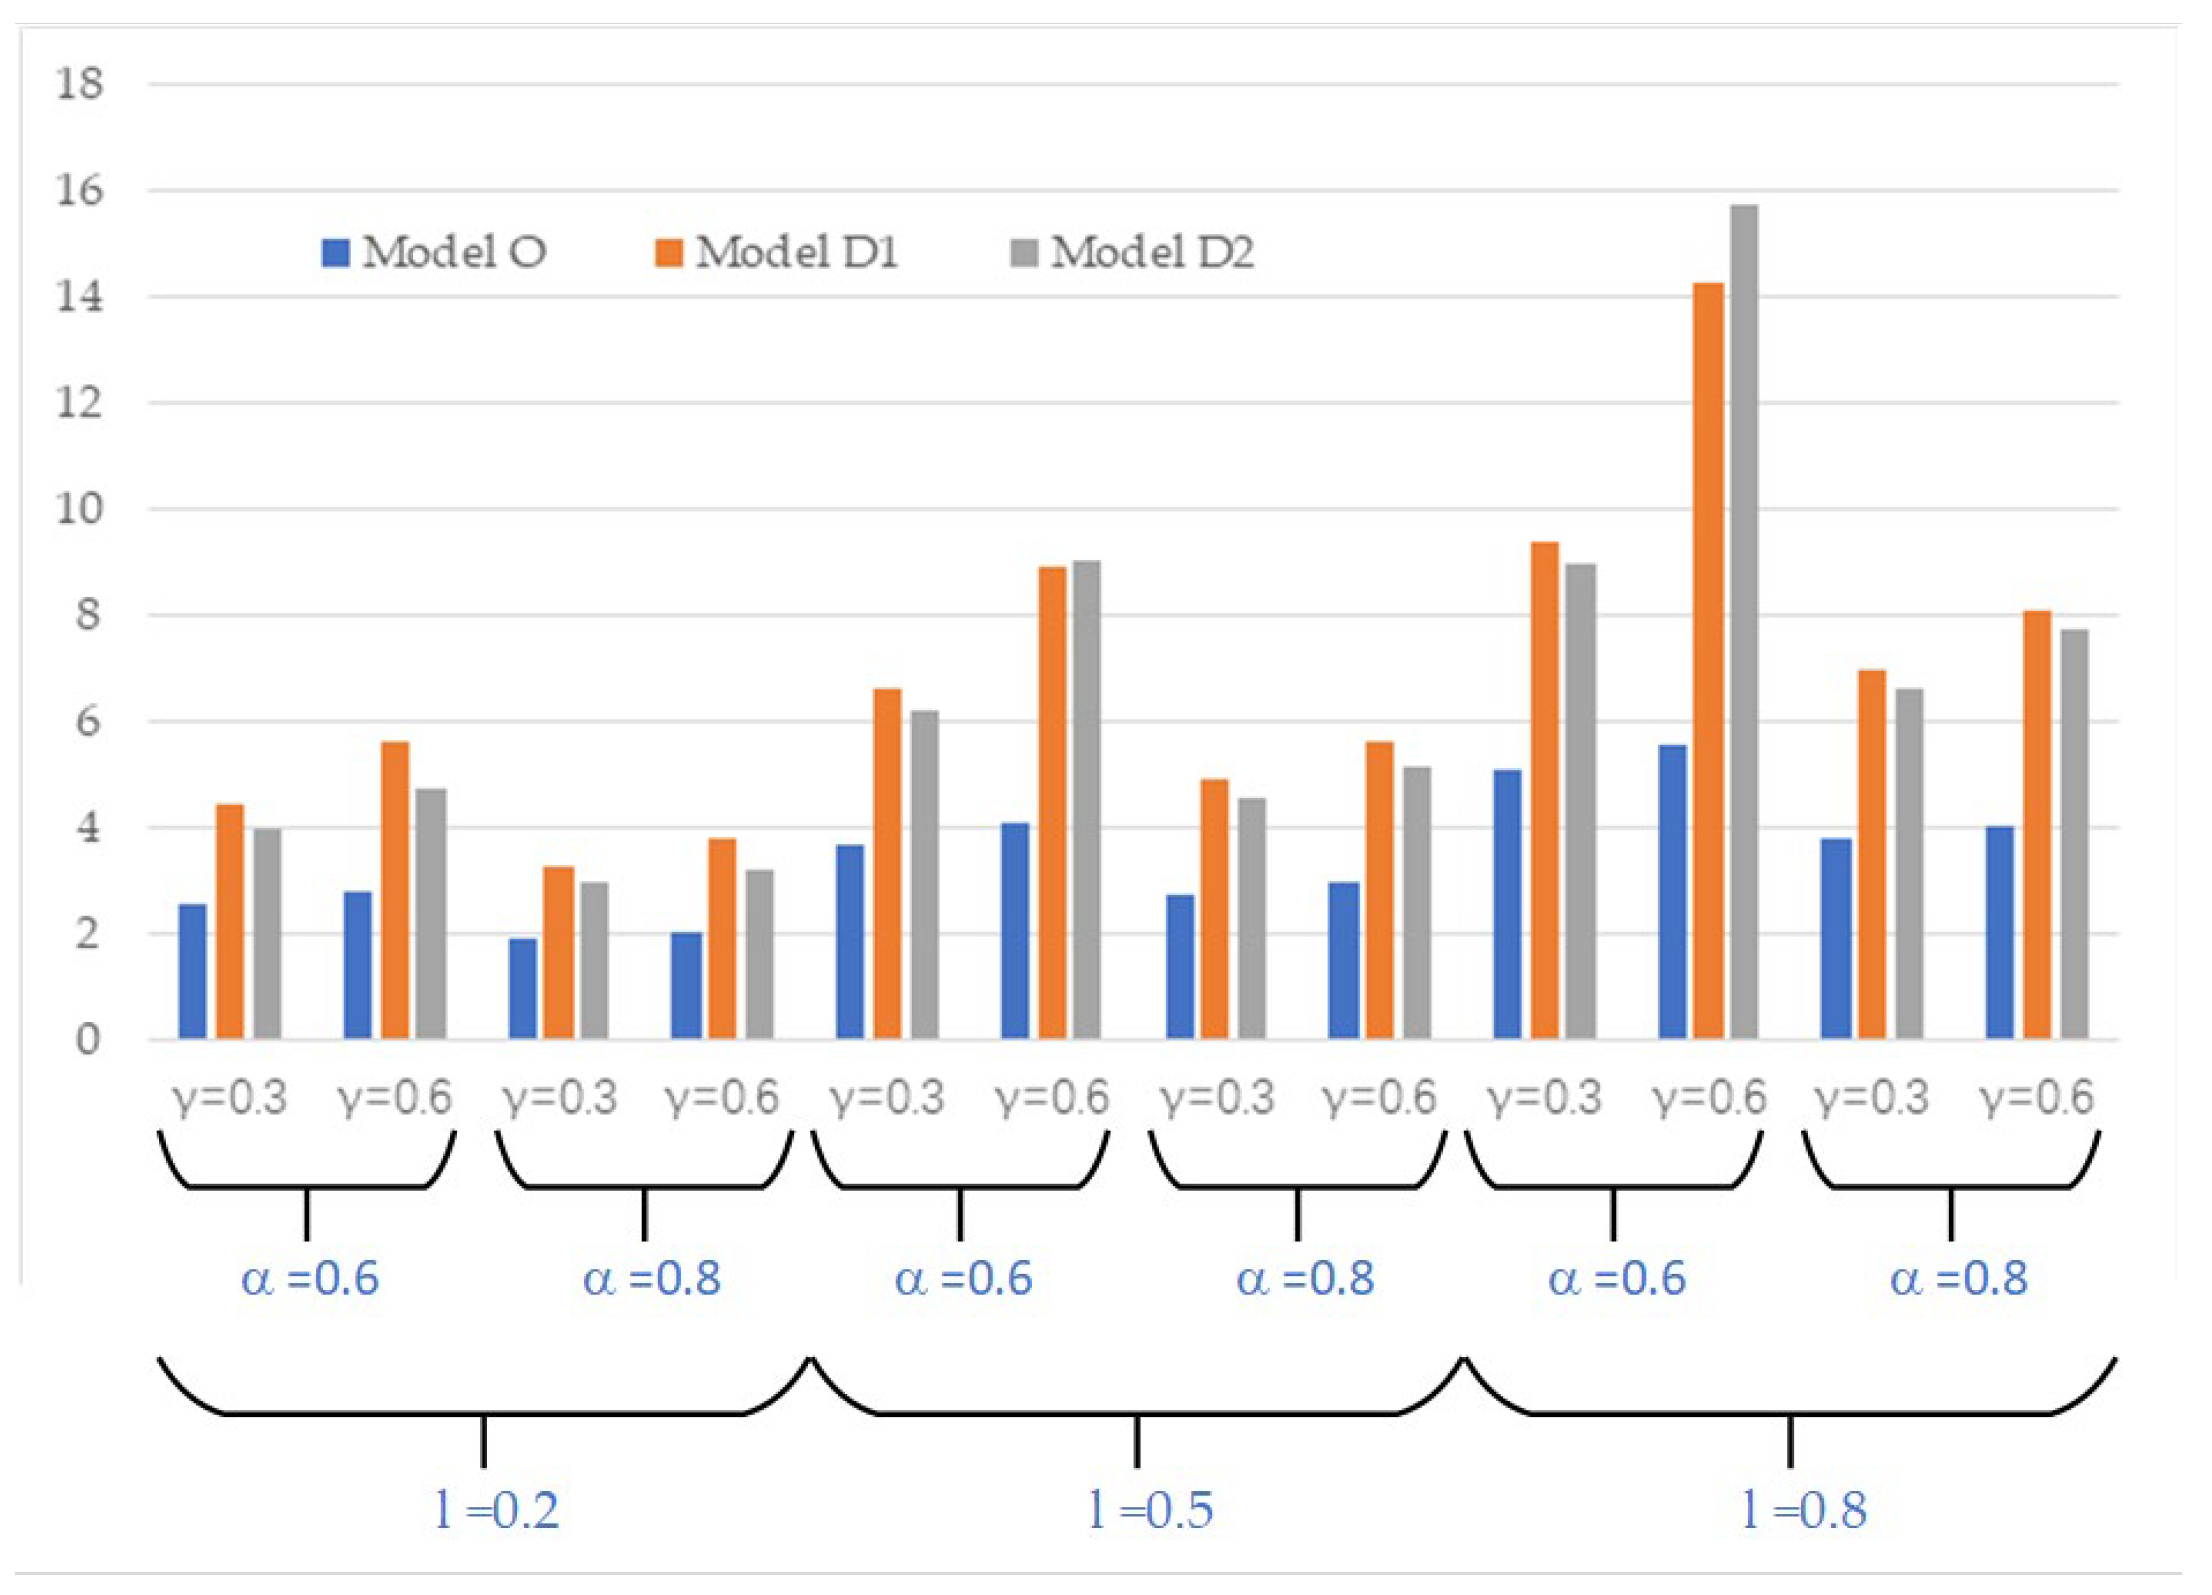
4.1. Comparative Analysis of Profits Under Different Models

According to Table 4, Table 5 and Table 6 and Figure 2, Figure 3 and Figure 4, we can know that regardless of how consumers’ behavioral preferences change, the overall profit of the supply chain under D1 Model is generally significantly higher than that under O Model and D2 Model, reflecting the economies of scale advantage of standardized services. For example, when the freshness sensitivity coefficient is 0.2, the price sensitivity coefficient is 0.6, and the marketing effort sensitivity coefficient is 0.6, the overall profit under D1 Model is 2.7 times that of O Model and 1.1 times that of D2 Model. However, it is worth noting that when consumers are highly sensitive to freshness and marketing, the overall profit of the supply chain under D2 Model exceeds that of D1 Model. For instance, when h = 0.3 , l = 0.8 , α = 0.6 , γ = 0.6 , the overall profit under D2 Model exceeds that under D1 Model. When h = 0.7 , l = 0.8 , α = 0.6 , the overall profit under D2 Model also exceeds that under D1 Model. This conclusion partially validates Hypothesis 2, which posits that both the D1 Model and the D2 Model outperform the O Model in terms of profitability. However, the assumption that the system profit under the D1 Model is consistently higher than that under the D2 model is not universally applicable. Based on the analysis, it becomes evident that, in certain specific scenarios, the system profit under the D2 Model surpasses that under the D1 Model.

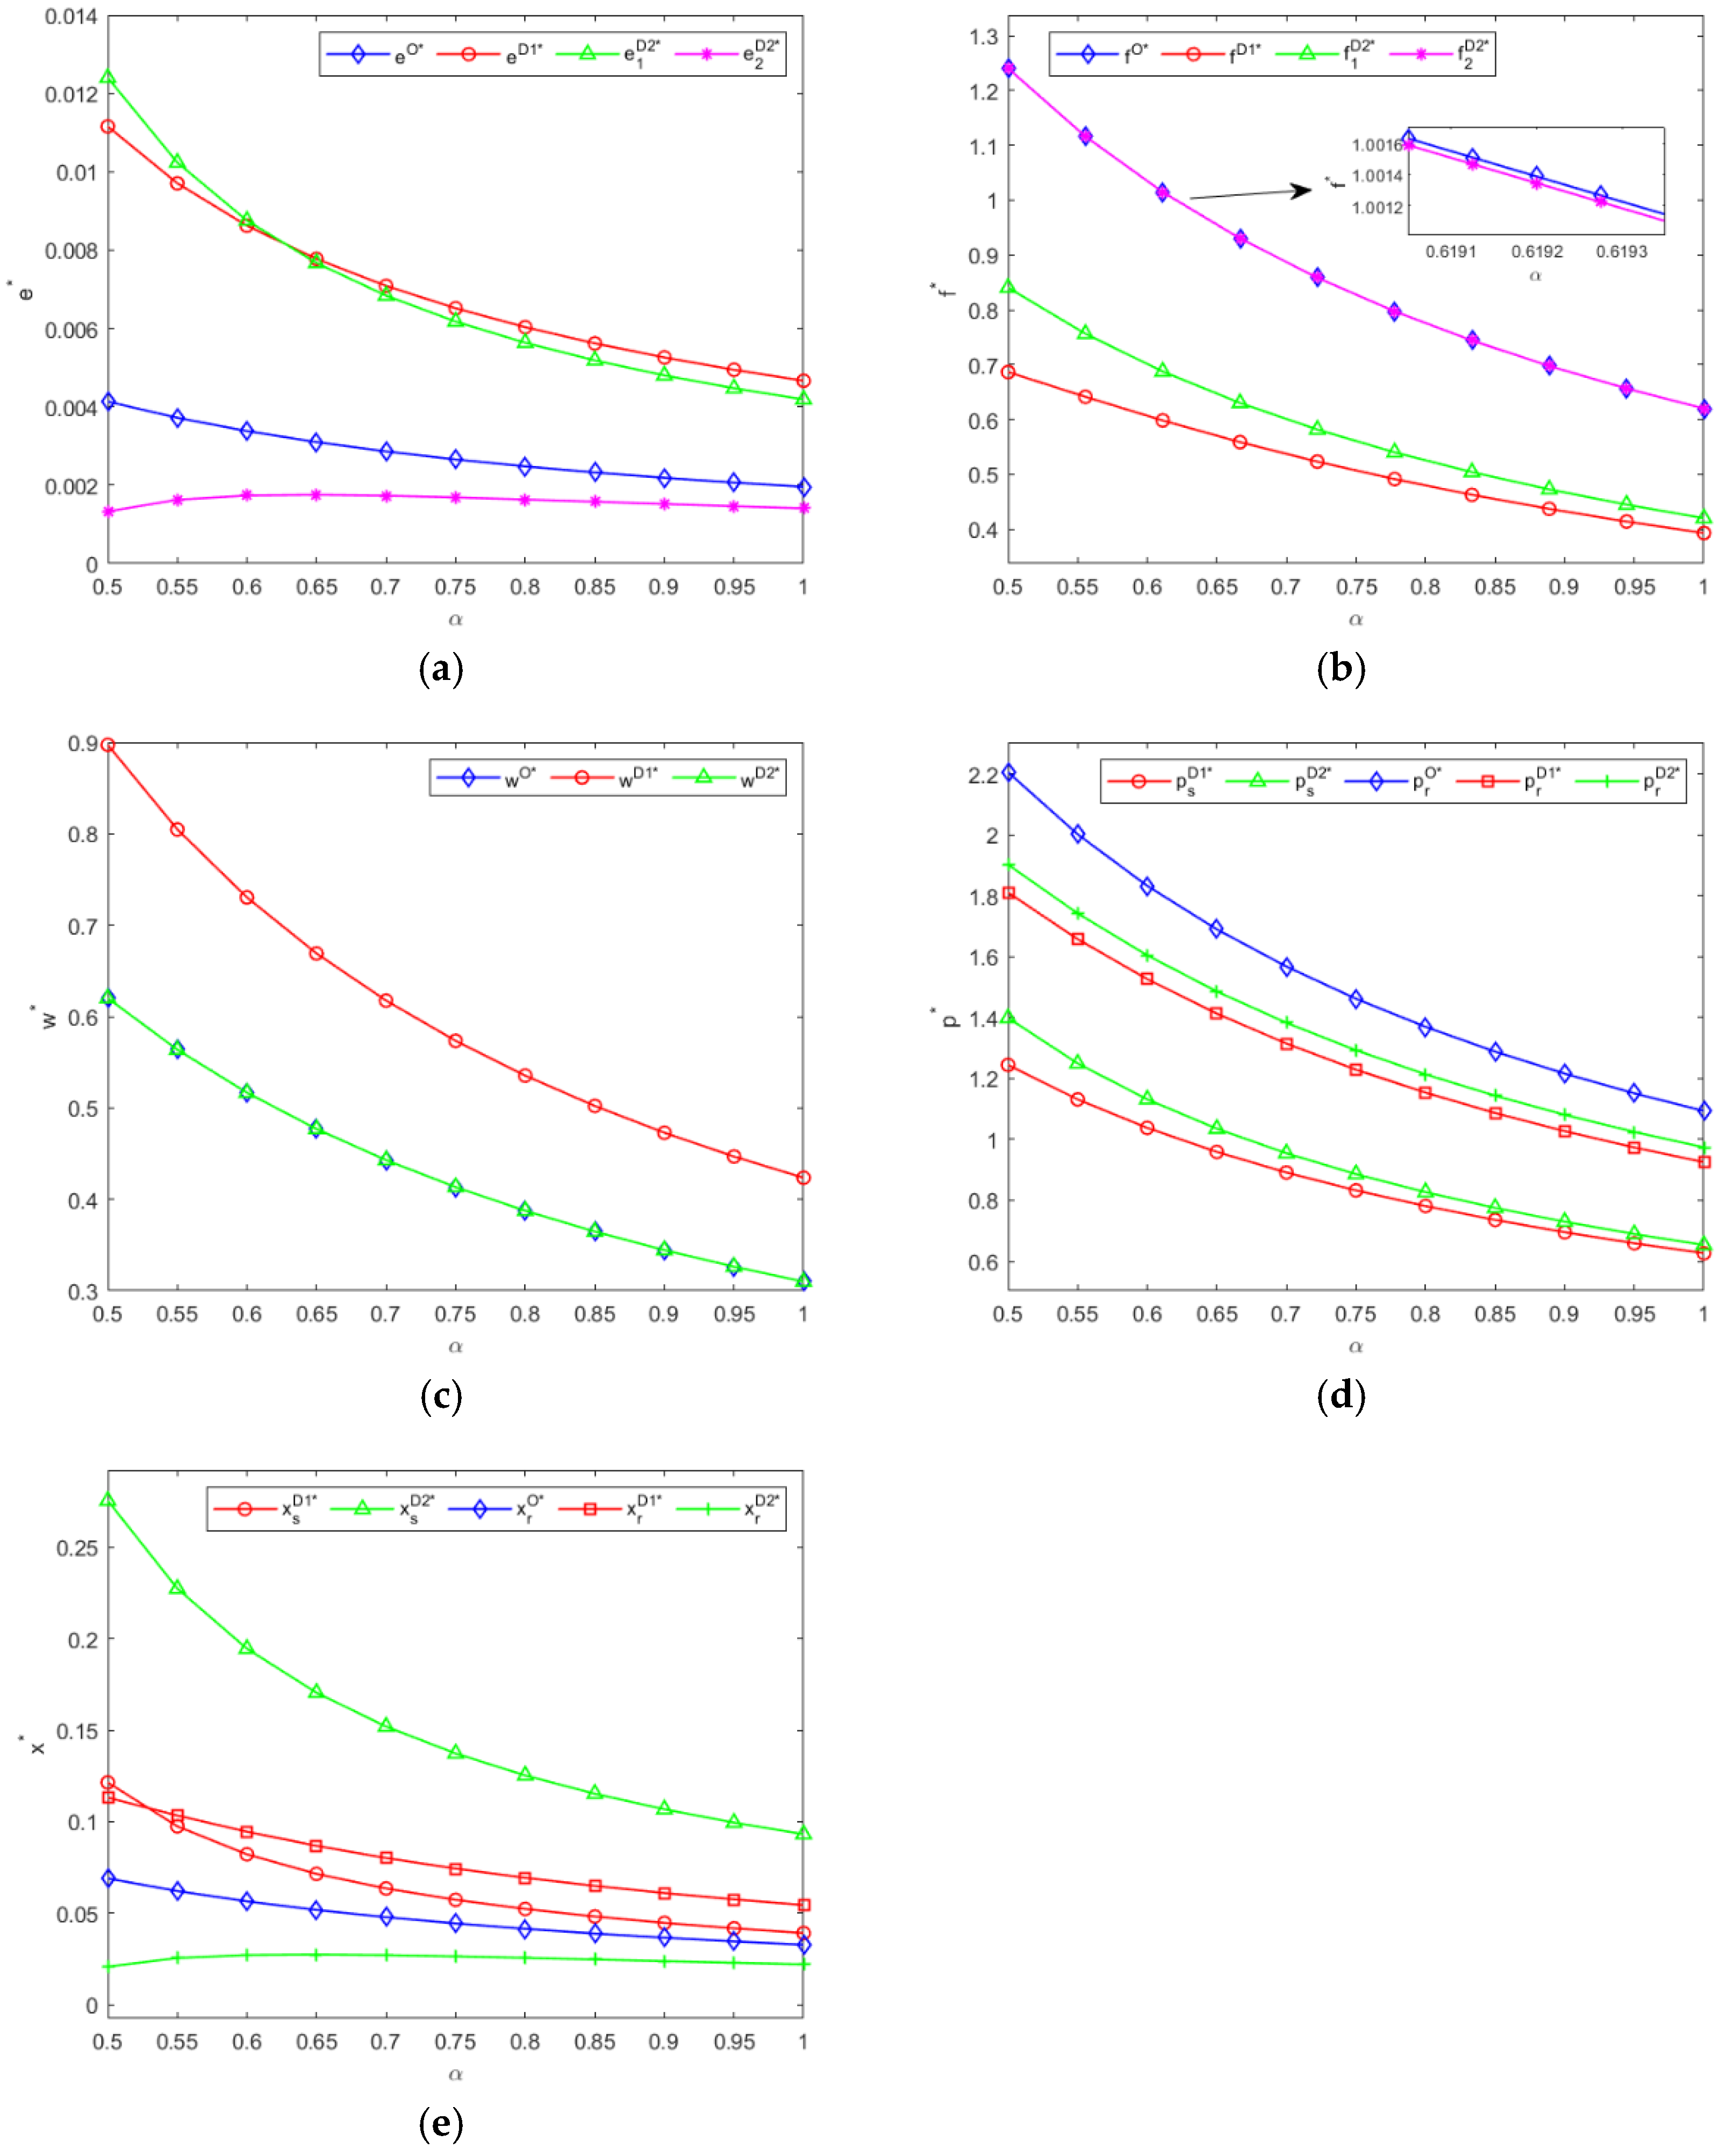
4.2. The Influence of the Consumers’ Price Sensitivity Coefficient α

Let the consumer freshness sensitivity coefficient l = 0.3 , the consumer marketing effort sensitivity coefficient γ = 0.5 , and the consumer price sensitivity coefficient α vary within the range [0.5, 1]. This parameter setting can ensure that the profit is positive. Based on O Model, D1 Model, and D2 Model, we calculate the following aspects, respectively: the optimal transportation prices and the cold-chain service levels; the optimal wholesale prices; the online sales prices and marketing efforts; the optimal offline sales prices and marketing efforts; the profits of each member of the supply chain; and the overall system profit. The results are shown in Figure 5 and Figure 6.
From Figure 5a,b, it can be seen that (1) except for the offline channel of D2 Model where the cold chain service level remains basically unchanged, in the other models, the cold chain service level decreases as α increases. Under the same α value, the cold chain service level in the offline channel of D2 Model is the lowest. There exists a certain critical value such that when α is lower than this value, the cold chain service level in the online channel of D2 Model is the highest. When α exceeds this critical value, the cold chain service level in the D1 Model is the highest. This indicates that as consumers’ sensitivity to price increases, 3PL will reduce the investment in cold chain logistics to control costs. (2) The transportation price set by 3PL decreases as α increases. Under the same α , the transportation price in the D1 Model is lower than that in other models. This is because the larger the price sensitivity coefficient is, the stronger the consumers’ response to price changes is. At this time, adopting a price reduction strategy is more likely to attract consumers. And the D1 Model can reduce costs due to the scale effect, thus making the transportation price lower than that of other models.
Figure 5c–e indicate that (1) the wholesale prices, the online sales prices, and the online marketing efforts all decrease as α increases. This means that as consumers’ sensitivity to prices increases, the supplier will be prompted to lower the wholesale prices and online sales prices, and to reduce marketing efforts. (2) Under the same value of α , the wholesale prices of the D1 Model are higher than those of other models, and the online sales prices and online marketing efforts of the D2 Model are higher than those of the D1 Model. In practice, because the D2 Model provides differentiated logistics services, it has more advantages in product quality assurance and delivery experience, which results in consumers having a higher perception of product value and thus being able to bear a relatively higher price, making the online sales prices of the D2 Model higher than those of the D1 Model. At the same time, as shown in Figure 5a, in the D2 Model, the logistics resources of the 3PL are more inclined towards the online sector. Therefore, the supplier needs to highlight his differentiated advantages through marketing. Compared with the D1 Model, under the same value of the consumer price sensitivity, the supplier will invest more efforts in marketing.
Figure 5d,e show that (1) the offline sales prices in both O Model and D1 Model decrease as α increases. At the same α , the offline sales price in O Model is the highest and that in D1 Model is the lowest. This indicates that as consumers become more sensitive to prices, this will prompt the retailer to adopt price reduction strategies to attract consumers. Moreover, since homogeneous logistics services in D1 Model are difficult to form a unique premium advantage, at the same α , lower selling prices can ensure the competitiveness of the retailer. (2) In both O Model and D1 Model, the level of offline marketing efforts by the retailer decreases as α increases. In D2 Model, the level of offline marketing efforts first increases slightly and then remains basically stable at a lower level. At the same consumer price sensitivity value, the level of offline marketing efforts in D1 Model is the highest and that in D2 Model is the lowest. This means that when consumers pay more attention to price changes, the promotional effect of marketing activities on sales weakens. Therefore, this prompts the retailer in O Model and D1 Model to reduce marketing investment to control costs. At the same time, as shown in Figure 5a, in D2 Model, the logistics resources of 3PL are more inclined to the online side, while in D1 Model, 3PL provides homogeneous logistics services. Therefore, the retailer needs to enhance marketing investment to reflect differences. Thus, compared with D2 Model, the retailer will invest more in marketing efforts at the same α .
The above conclusion verifies Hypothesis 3, that is, consumers’ high sensitivity to the prices of fresh products will lead to a reduction in supply chain pricing and effort input.
According to Figure 6a–d, it can be seen that (1) in all models, the profits of 3PL, the supplier and the supply chain system all decrease as α increases, and the profits of all three in the O Model are the lowest. The profit of 3PL is the highest in the D2 Model, and the profits of the supplier and the total system profit are the highest in the D1 Model. (2) The profits of the retailer in the O Model and D1 Model decrease as α increases, while the profits of the retailer in the D2 Model remain at a relatively low level and do not change much. When α is below a certain critical value, the profit of the retailer in the O Model is the highest. When α exceeds this critical value, the profit of the retailer in the D1 Model is slightly higher than that in the O Model. This indicates that in the O Model, the retailer’s channel is single but has advantages, and the profit is high in the early stage. In the dual-channel model, due to the competition of the supplier, the profit of the retailer is affected. However, in the D1 Model, the products are homogeneous and the retailer adopts a low-price strategy, so the profit is not affected much. But in the D2 Model, due to the high cost of differentiated logistics services, the profit is low.

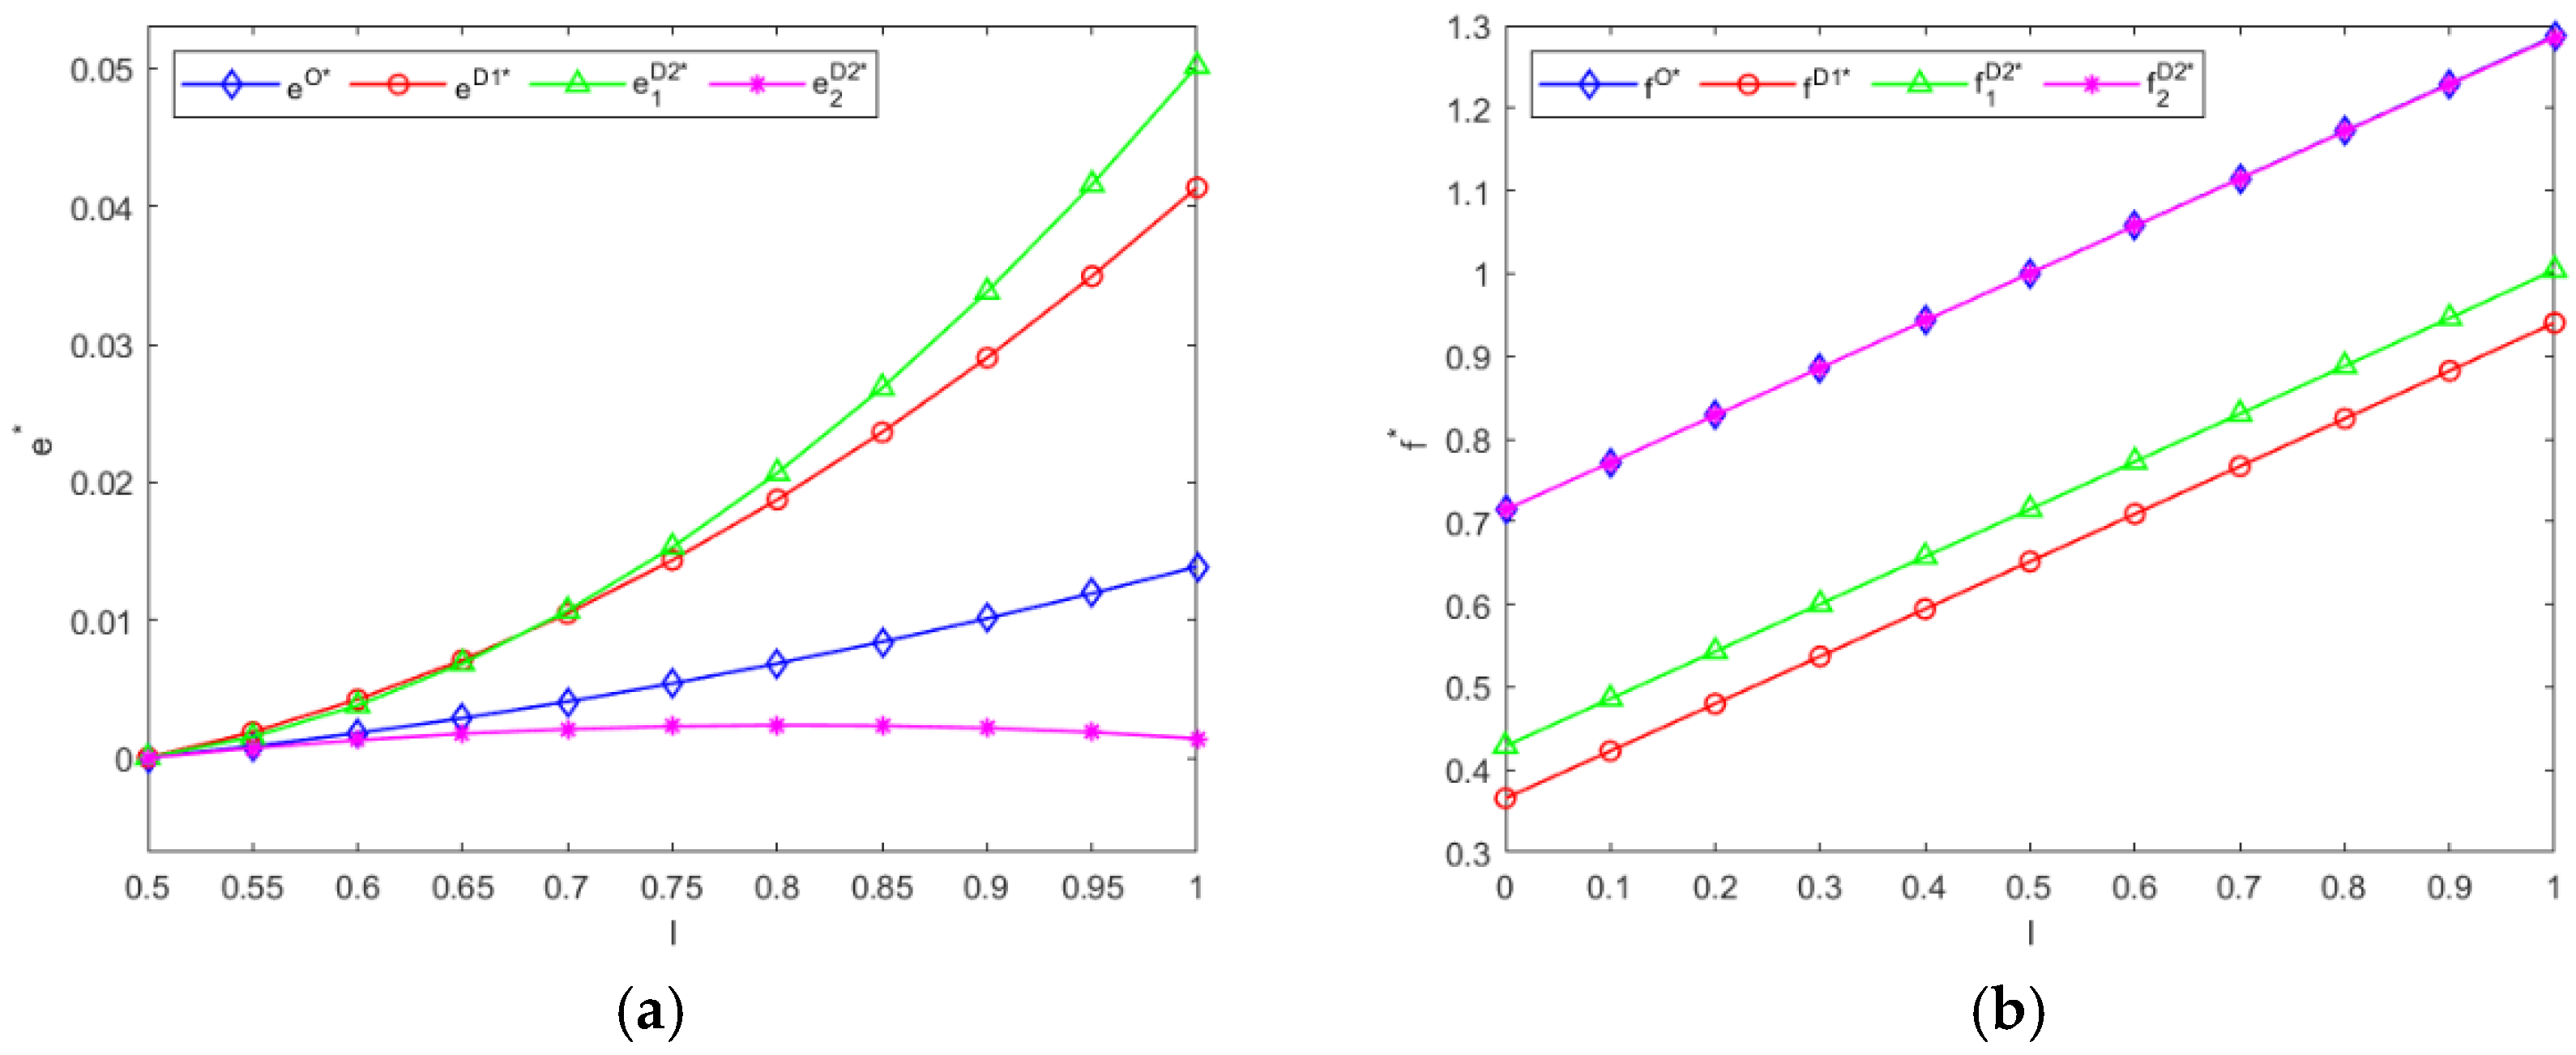
4.3. The Influence of the Consumers’ Freshness Sensitivity Coefficient l

Let the consumer price sensitivity coefficient α = 0.7 , the consumer marketing effort sensitivity coefficient γ = 0.5 , and the consumer freshness sensitivity coefficient l vary within the range [0, 1]. This parameter setting can ensure that the profit is positive. Based on O Model, D1 Model, and D2 Model, we calculate the following aspects, respectively: the optimal transportation prices and the cold-chain service levels, the optimal wholesale prices, the optimal online sales prices and marketing efforts, the optimal offline sales prices and marketing efforts; the profits of each member of the supply chain; and the overall system profit. The results are shown in Figure 7 and Figure 8.
Figure 7a,b indicate that (1) in D1 Model and the online channel of D2 Model, the cold chain service level improves as l increases, and the improvement is relatively large. The offline cold-chain service level in D2 Model remains basically unchanged. The cold chain service level in O Model also increases with the increase of l , but the increase is relatively small. (2) Among all models, the transportation price increases as l increases. At the same value of l , the transportation price is the lowest in D1 Model. This indicates that as the freshness sensitivity coefficient increases, consumers’ requirements for the freshness of fresh products become higher, which will prompt 3PL to improve the cold chain service level, and the transportation price will also increase accordingly.
Figure 7c–e show that (1) in all models, the wholesale price, the online sales price and the online marketing effort all increase as l increases. (2) At the same value of l , the wholesale price of the D1 Model is the highest, and the online sales price and marketing effort of the D2 Model are the highest. This indicates that as the freshness sensitivity coefficient increases, consumers rely more on the product freshness to make purchase decisions and are willing to pay higher prices for high-quality products. Thus, this situation prompts the supplier to adopt a higher-price strategy and increase the online marketing efforts. At the same time, due to the differentiation of cold-chain services in the D2 Model, it is more necessary to highlight the characteristics through marketing. Therefore, compared with the D1 Model, at the same value of l , the supplier will invest a higher level of online marketing efforts.
Figure 7d,e show that (1) the offline sales prices in all models increase as l increases, and the offline sales price in the O Model is higher than that in other models. This indicates that consumers’ emphasis on the freshness of fresh products also prompts the retailer to raise the sales prices. However, at the same value of l , competition from the online channel will prompt the retailer to adopt a price reduction strategy lower than that in the O Model. (2) The marketing effort of the O Model increases as l increases. In contrast, the offline marketing effort of the D1 Model and D2 Model both decrease as l increases, and the decrease in the D2 Model is greater. This is because, in the O Model, when consumers’ sensitivity to freshness increases, the retailer increases his marketing efforts by emphasizing product freshness guarantee measures, etc. However, in the dual-channel model, as consumers’ sensitivity to product freshness increases, consumers pay more attention to product quality rather than marketing, and the cold-chain resources of 3PL in the D2 Model are tilted towards the online channel. The quality of offline products is lower than that of online products. Since the D2 Model emphasizes differences in quality more than the D1 Model, the offline marketing effort level of the retailer decreases accordingly.
The above conclusion verifies Hypothesis 3, that is, consumers’ high sensitivity to the freshness of fresh products will promote the improvement of supply chain pricing and effort input.
Figure 8a,b,d indicate that in all models, the profits of 3PL, the supplier and the supply chain system increase as l increases. Among them, in the O Model, the profits of all three are the lowest. In the D2 Model, the profit of 3PL is higher than that in other models, and in the D1 Model, the profits of the supplier and the system are higher than those in other models. This is because in the D2 Model, 3PL charges higher logistics fees by virtue of its differentiated logistics services, thus achieving the highest profit. While in the D1 Model, due to the scale effect formed by the homogeneity of logistics services, the profits of the supplier and the supply chain system are the highest. Figure 8c shows that in the O Model, the profit of the retailer increases as l increases, and in the dual-channel model, the profit of the retailer decreases as l increases. Based on the description in the previous text, it can be concluded that the O Model has a single sales channel, so as consumers’ sensitivity to freshness increases, the retailer can increase the selling price and marketing efforts to increase profits. However, in the dual-channel models, the supplier increases marketing efforts for promotion, while the retailer chooses to reduce marketing efforts, resulting in a decrease in profits.

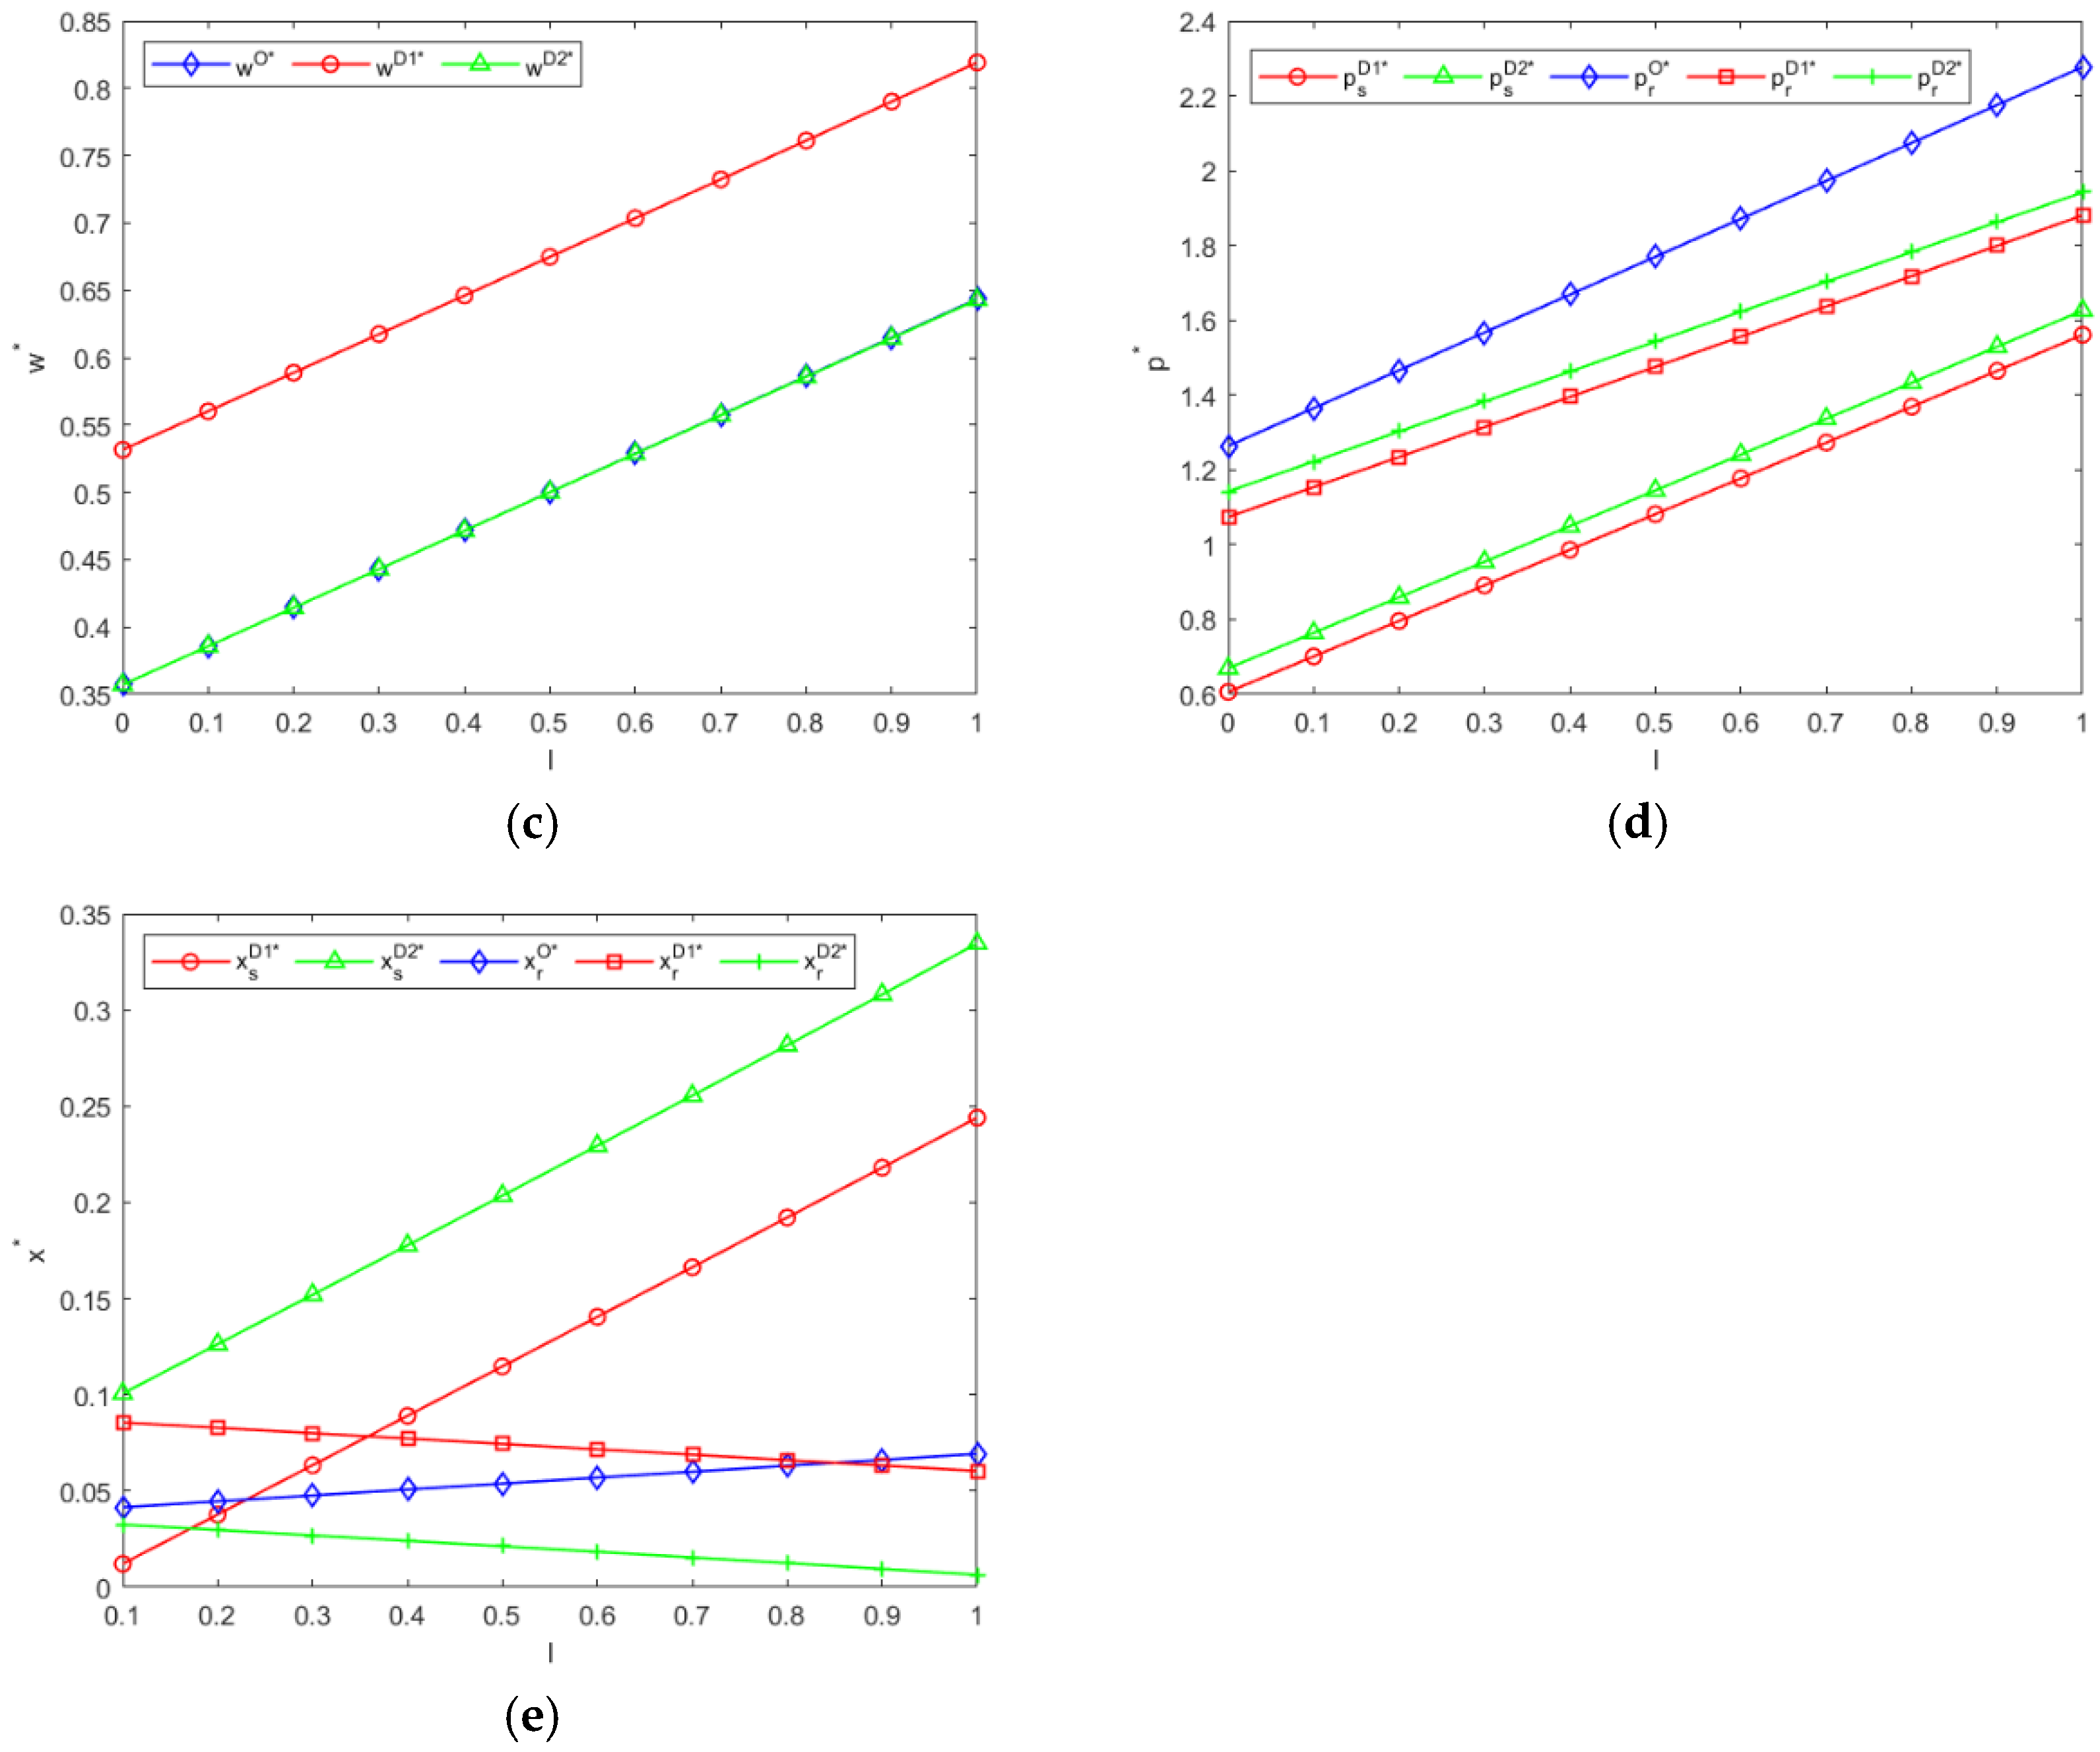
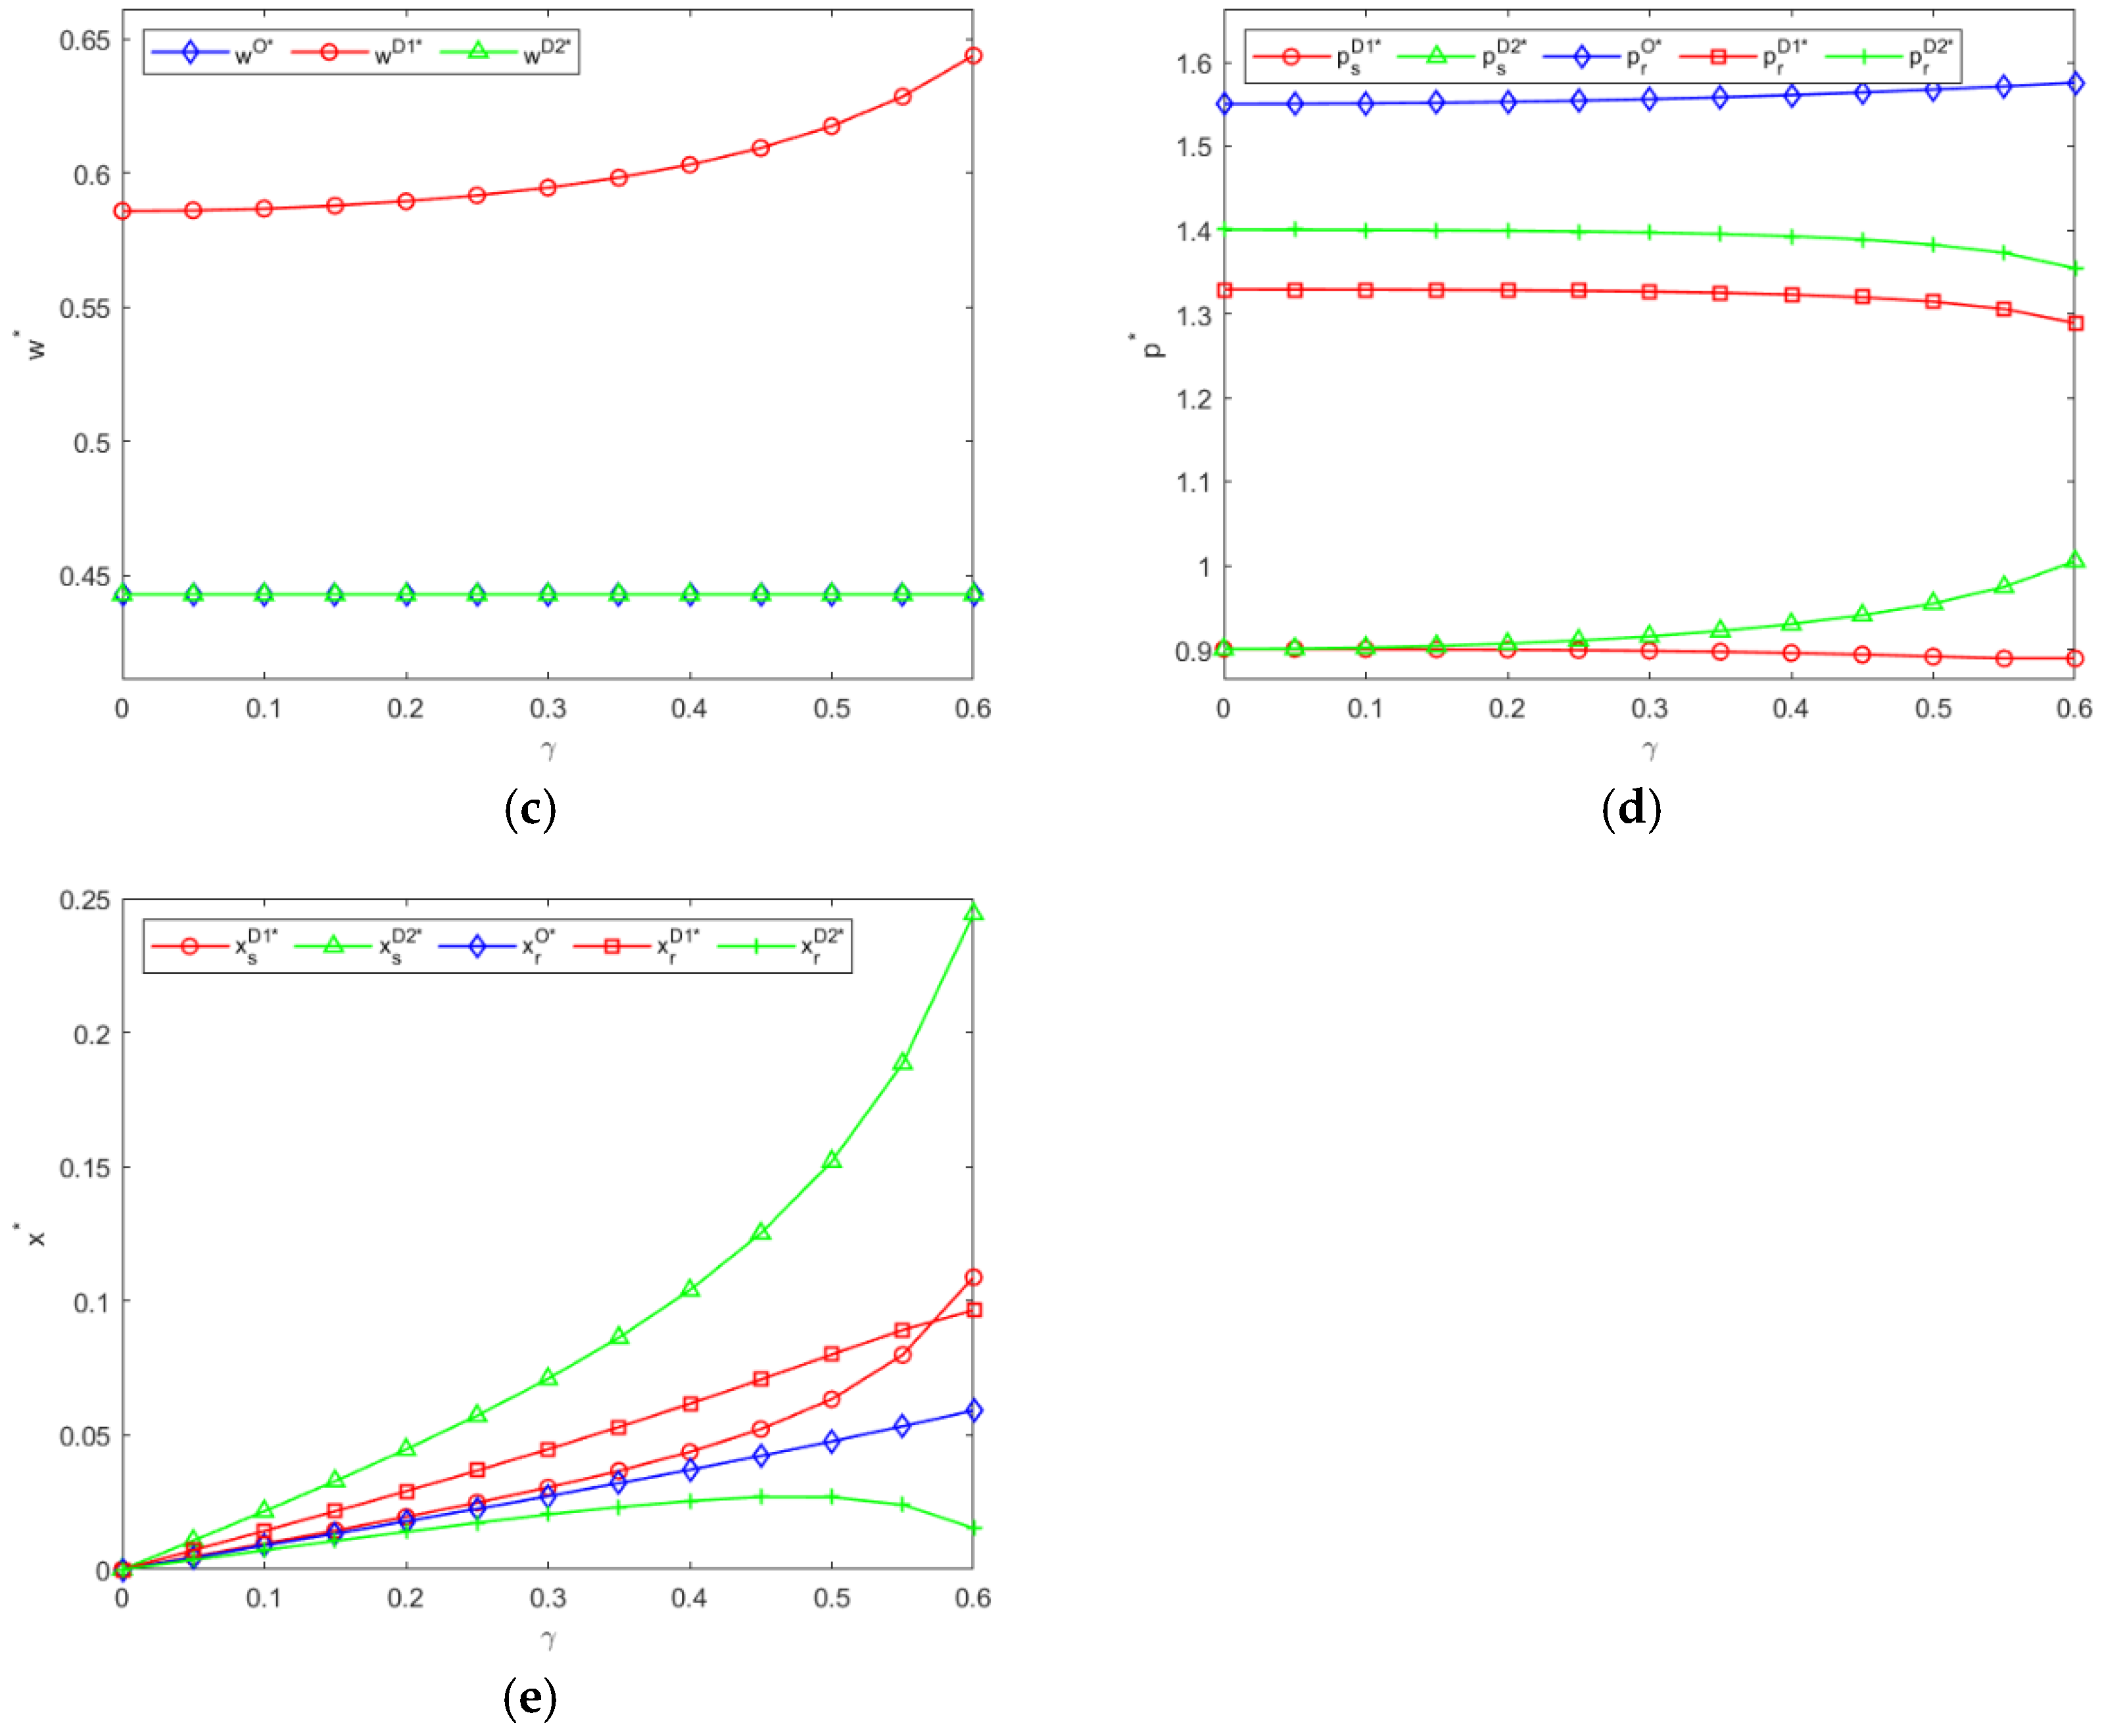
4.4. The Influence of the Consumers’ Marketing Effort Sensitivity Coefficient γ

Let the consumer price sensitivity coefficient α = 0.7 , the consumer freshness sensitivity coefficient l = 0.3 , and the consumer marketing effort sensitivity coefficient γ vary within the range [0, 0.6]. This parameter setting can ensure that the profit is positive. Based on O Model, D1 Model, and D2 Model, we calculate the following aspects, respectively: the optimal transportation prices and the cold-chain service levels, the optimal wholesale prices, the optimal online sales prices and marketing efforts, the optimal offline sales prices and marketing efforts; the profits of each member of the supply chain; and the overall system profit. The results are shown in Figure 9 and Figure 10.
Figure 9a,b indicate that: (1) Except for the transportation price of D1 Model which decreases as γ increases, the transportation prices of the other models are not much affected by γ , and the transportation price of D1 Model is lower the transportation prices of the other models at the same value of γ . (2) The cold-chain service level of O Model remains basically unchanged, while the offline cold-chain service level of D2 Model decreases as γ increases. The online cold-chain service levels of D1 Model and D2 Model increase as γ increases, and the increase in D2 Model is greater. This is because O Model is relatively stable in marketing and logistics operation compared with traditional ones, and its cold-chain service level is stable and the improvement is small. However, in the dual-channel model, there is competition in marketing between online and offline channels to ensure the quality of fresh products during the marketing process. 3PL increases investment in cold chain logistics, but the service levels of D1 Model are homogeneous and the improvement is small, while the online marketing activities of D2 Model are flexible and relatively more diverse, so the improvement in the cold chain service level in D2 Model is greater.
From Figure 9c–e, it can be seen that (1) The wholesale prices of the O Model and D2 Model are basically stable, while the wholesale price of the D1 Model is stable when the γ is small and increases later as γ increases. (2) The online sales prices of the D1 Model decrease slowly as γ increases, while the online sales prices of the D2 Model increase significantly as γ increases. (3) The online marketing efforts of the dual-channel model increase as γ increases, and the increase of the D2 Model is greater. This indicates that as the marketing effort sensitivity coefficient increases, the purchasing decisions of consumers are more influenced by marketing activities. Therefore, in the D1 Model, the supplier attracts consumers by reducing prices and promoting sales to enhance their competitiveness, while in the D2 Model, due to the differentiation of logistics services, suppliers in D2 Model need to increase marketing efforts to highlight the differentiation, and thus the online marketing efforts and sales prices increase accordingly.
From Figure 9d,e, it can be seen that (1) The offline sales price of the O Model is stable when the γ is small, and then increases as γ increases. The offline sales prices of the dual-channel models all show a downward trend as γ increases. Among them, the price of the O Model is the highest, and the price of the D1 Model is the lowest. (2) The marketing effort level of the retailer under the O Model and the D1 Model increases as γ increases. The increase in the D1 Model is greater. Under the D2 Model, the marketing effort level increases first and then starts to decrease after γ reaches a certain value. This indicates that the increase in consumers’ sensitivity to marketing efforts prompts the retailer to increase his marketing investment. However, in the D2 Model, due to the advantage of differentiated cold-chain services, when the marketing intensity is high, this advantage is easily masked. Therefore, when the value of the consumer freshness sensitivity coefficient is high, the marketing effort level decreases.
Figure 10a,b,d indicate that in all models, the profits of 3PL, the supplier and the supply chain system increase as γ increases. In the O Model, the profits of all three are lower than those in other models. However, in the D2 Model, the profit of 3PL is higher than in other models, and in the D1 Model, the profits of the supplier and the system are higher than in other models. Figure 8c shows that in the O Model, the profit of the retailer increases slowly as γ increases. In the D1 Model, the profit of the retailer first increases and then decreases. In the D2 Model, the profit of the retailer continuously decreases. From the previous description, it can be known that the O Model has a single sales channel. Therefore, as consumers’ sensitivity to marketing increases, the retailer can increase the selling price and intensify marketing efforts to increase profits. However, in the dual-channel model, due to the homogeneity of logistics services in the D1 Model, competition in marketing is intense. In the early stage, the retailer increases marketing efforts to attract consumers, resulting in an increase in profits. But in the later stage, excessive marketing leads to an increase in costs, and market competition makes it difficult for prices to rise, resulting in a decrease in profits. In the D2 Model, the combined cost of logistics differentiation and marketing investment compresses the profit space of the retailer, and the profit of the retailer continuously decreases.

5. Research Discussions

This section discusses the contribution of this research to previously published studies, analyzes the practical significance of the research, and further presents the limitations of the research as well as the future research directions.

5.1. Comparison with Prior Research

This study enriches the fresh product supply chain literature by addressing two key research gaps:
(1)
Innovation of the three-tier dual-channel supply chain model with 3PL participation: Most previous studies (e.g., Reference [2]) focused on the two-tier supplier-retailer system and regarded 3PL as a cost provider rather than an independent decision-maker. By introducing 3PL as a decision-maker into the dual-channel supply chain system and considering the two scenarios of whether it provides the same level of cold chain service for both online and offline channels, this study explains how the cold-chain service strategy of 3PL spreads through the supply chain to influence pricing and effort investment decisions, which provides an insight that traditional models lack. The numerical experiment part of this study found that compared with differentiated cold chain services, homogeneous cold chain services reduced transportation costs, which could not be achieved in the two-tier framework (Figure 5b, Figure 7b and Figure 9b). Furthermore, when consumers are highly sensitive to product freshness and marketing efforts, the total profit of the dual-channel system under D2 Model is higher than that under D1 Model (Figure 2 and Figure 4). This challenges the assumption that standardization can always optimize profits and also highlights the role of consumers in strategy selection.
(2)
Multi-dimensional utility function: Different from the two-factor (freshness, price) demand model in [2,5,45], this study integrates price, freshness, and marketing efforts into the utility function, and considers the corresponding marketing efforts invested by the supplier and retailer for their respective sales channels. Research has found that when consumer marketing sensitivity increases, the growth rate of online marketing efforts in the D2 model is faster than that of online marketing efforts in the D1 model (Figure 7e). This indicates that the marketing efforts of the D1 and D2 models are also influenced by the differences in consumer preferences. This mechanism has been ignored in previous studies. This addresses the limitation of Zhang et al. [34], which is that marketing efforts are not differentiated by channels, providing a more realistic description of dual-channel dynamics.

5.2. Practical Implications for Industry

This section presents strategic recommendations for 3PL and the overall supply chain and emphasizes the importance of consumer behavioral preferences.
(1)
The strategic choice of 3PL and the overall supply chain: As shown in Figure 6a,d, Figure 8a,d and Figure 10a,d, although the D2 Model can enhance the profits of 3PL, the overall profit of the supply chain is generally higher under the D1 Model. The D2 model is only applicable to specific scenarios where consumers are highly sensitive to product freshness and marketing efforts. For example, when γ = 0.6 , α = 0.6 , and l = 0.8 , the total profit of the system under the D2 Model is nearly 10% higher than that under the D1 Model. This reflects the fact that individual rationality may lead to collective irrationality. From the perspective of 3PL individuals, the D2 Model can enable them to obtain more profits. However, from the perspective of the entire supply chain, in most cases, the D1 Model can bring more profits. Therefore, from the perspective of the overall sustainable development of the supply chain, 3PL should try to choose homogeneous cold-chain services to create more profits for the supply chain through economies of scale, and the supply chain should also provide corresponding compensation to encourage it to abandon the implementation of differentiated cold chain service strategies.
(2)
Consumer Behavior-Driven Adaptation: In price-sensitive markets, supply chains ought to adopt the D1 strategy. By leveraging economies of scale, this strategy can effectively reduce costs and stimulate consumer demand. This strategic approach is well-exemplified by Meituan’s implementation of a dual-track model that integrates both online and offline channels. Meituan’s business model demonstrates how enterprises can cater to price-sensitive consumers by optimizing operational efficiency and expanding market reach through a multi-channel presence, which aligns with the underlying principles of the D1 strategy. In contrast, for markets that are highly sensitive to product freshness and marketing effort, the D2 strategy should be employed, with a particular emphasis on the online channel. The three major shipping models pioneered by JD Logistics enable Lingnan lychees to reach customers across the country within 48 h while maintaining freshness, resonates with the core focus of the D2 strategy on online service excellence. JD Logistics’ achievement showcases the potential of prioritizing online channels in freshness-sensitive markets to ensure rapid and High-quality product delivery.

5.3. Research Limitations

This article has the following research limitations. First, the study assumes a fixed market demand in the model, ignoring the uncertainty of supply and demand for fresh products. In reality, fresh products are highly susceptible to random factors such as weather changes, natural disasters, transportation conditions, consumer preferences, holiday effects, and promotional activities during the production, transportation, and sales processes. The second limitation is the simplification of the effort cost function. In this paper, to facilitate calculation and solution, the effort cost function of each member is set as a quadratic function. However, in reality, there are various expressions of the cost function, such as linear cost function, logarithmic cost function, etc. For small-scale 3PL, perhaps a linear cost function can better describe the effort investment. The third issue is the omission of policy factors. The article did not take into account the government’s subsidies for green technologies in cold chain, which may affect the optimal strategy under the carbon reduction policy. The fourth is the channel power structure. This model assumes that the power among members is symmetrical, but in reality, it may involve retailer dominance, supplier dominance, or third-party logistics dominance.

5.4. Future Research Directions

Future research can focus on the following directions: (1) Dynamic demand modeling: Considering the characteristic that the freshness of fresh products decreases over time, based on the time-varying utility function of Wang et al. [39], analyze the purchase decisions made by consumers at different times. (2) Empirical verification: Collaborate with enterprises (such as Hema Fresh and SF Express) to calibrate model parameters using actual cold chain operation data. (3) The impact of government subsidies: Future research explores the influence of subsidies and regulations on the strategic choices of 3PL by integrating policy backgrounds such as low-carbon economy, green technology research and development, and blockchain applications. (4) Omni-channel expansion: Expand the model to include omni-channel scenarios (for example, online purchase, in-store pickup), reflecting the current development trend of new retail. By addressing these limitations, future research can enhance the practical applicability of the model and the comprehensiveness of the theory, contributing to the sustainable development of the fresh food supply chain.

6. Conclusions and Implications

This paper addresses the pricing and effort investment decision-making issues of 3PL’s participation in the dual-channel supply chain of fresh products. A three-tier fresh product supply chain composed of 3PL, the supplier and the retailer is constructed. Considering that 3PL adopts different logistics service strategies, the consumer utility function is used to depict market demand. Three game models are, respectively, constructed under the traditional retail channel (O Model), homogeneous logistics service dual-channel model (D1 Model), and differentiated logistics service dual-channel model (D2 Model). The optimal pricing and effort investment levels of chain members under different models are obtained. The total profit of the supply chain system is compared through numerical analysis. Furthermore, the influence of consumer behavior on the equilibrium decision and profit level of the supply chain is analyzed.
Research shows that the following: (1) The D1 Model reduces the transportation cost of the supply chain through economies of scale. In contrast, the D2 Model leads to higher transportation and sales prices in offline channels compared to online channels by adopting service differentiation. The impact of different cold-chain service strategies on the cold-chain service levels is also moderated by consumers’ sensitivity to product freshness, price, and marketing efforts. The online marketing efforts of the supplier under the D2 Model are significantly higher than those in other models. (2) The profits generated by the dual-channel model (D1 Model and D2 Model) are both higher than those of the traditional retail channel model. In most cases, the D1 model yields the highest system profit, whereas the D2 model is only applicable in certain special scenarios characterized by high sensitivity to freshness and marketing efforts. (3) The pricing and effort input of the supply chain when the consumer price sensitivity is high are both lower than the corresponding values when the consumer price sensitivity is low. Conversely, the pricing and effort input of the supply chain when the consumer freshness sensitivity is high are both higher than the corresponding values when the consumer freshness sensitivity is low.
Based on the above research conclusions, we can obtain the following management implications:
(1)
In most cases, the D1 Model can significantly reduce the transportation cost of the supply chain through economies of scale and result in higher system profits. Therefore, for supply chain managers who hope to optimize the cost structure and increase overall profits, adopting the D1 Model is a choice worth considering. Although the D1 model performs better in most cases, in markets where consumers are highly sensitive to freshness and marketing efforts, the D2 Model can result in higher profits. Therefore, supply chain managers should flexibly select logistics service strategies based on the characteristics of the target market.
(2)
When it comes to pricing and marketing strategies, research indicates that consumers’ high price sensitivity can lead to supply chain members lowering prices and reducing marketing investment. Therefore, supply chain managers need to closely monitor changes in market dynamics and consumer behavior and adjust pricing strategies in a timely manner to maintain market competitiveness. On the contrary, when consumers are highly sensitive to freshness and marketing efforts, the supply chain should increase prices and marketing investment. This requires supply chain managers to increase investment in product preservation, packaging, advertising and promotion, etc., in order to meet consumers’ expectations.
(3)
Regarding supply chain collaboration and cooperation, to achieve more efficient supply chain operations, suppliers and retailers should establish long-term and stable cooperative relationships with 3PL, which helps to reduce transaction costs and improve service quality. Supply chain managers should attach importance to communication and collaboration with 3PL, understand the characteristics of its cold chain services, jointly formulate logistics service standards and performance evaluation systems, and ensure the efficient operation of the supply chain.
(4)
Regarding service models and technological applications, 3PL should innovate its service model. For instance, JD Logistics has adopted “direct delivery from point to point” (for small-batch products, it ensures that the products reach the air sorting center directly through alternating loading on individual vehicles), “direct airport delivery” (for large-batch orders, prioritizing designated flights for support), and “cold dry direct delivery” (customized for medium-distance transportation, it provides high-quality full-process temperature control services for areas accessible within 72 h). These service models can meet the transportation demands of different distances and timeliness requirements, which helps to enhance customer satisfaction and loyalty and strengthen the competitiveness of the supply chain.

Author Contributions

Conceptualization, methodology, software, writing—original draft, and visualization, Y.W.; Conceptualization, visualization, and supervision, A.Z.; Visualization, and supervision, L.Y.; Conceptualization, methodology, and validation. W.W. All authors have read and agreed to the published version of the manuscript.

Funding

This research received no external funding.

Data Availability Statement

The original contributions presented in this study are included in the article. Further inquiries can be directed to the corresponding author.

Conflicts of Interest

The authors declare no conflicts of interest.

Notes

1
Cold chain sevice level measurement is shown in Note 1. To measure 3PL’s cold-chain service level, we recognize that the service level can be assessed through multiple stakeholders’ evaluations, including consumers, suppliers, and retailers (as relevant studies in the field, such as References [32,33], have suggested). 3PL’s cold-chain service level is influenced by several key service attributes, and a practitioner should identify these attributes based on the characteristics of the cold-chain logistics industry. Then, the practitioner collects the scores of relevant service attributes. These attributes may encompass aspects such as temperature control accuracy during transportation, the efficiency of refrigeration equipment maintenance, the timeliness of delivery in the cold-chain context, and the accuracy of freshness tracking information. After obtaining the scores of these service attributes, the practitioner calculates a cold-chain service level score by taking the weighted average of these scores.
2
(1) Marketing effort measurement is shown in Note 2. To measure marketing effort, we understand that it can be evaluated through a comprehensive set of factors, including consumer responses, market performance indicators, and stakeholder feedback (as relevant studies in the field, such as Reference [42], have suggested). Marketing effort is influenced by multiple marketing attributes, and a practitioner should identify these attributes based on the specific marketing context, industry, and target audience. Then, the practitioner collects the scores of relevant marketing attributes. These attributes may encompass the following: advertising reach and frequency, content engagement, promotion effectiveness, brand perception, customer relationship management efforts, etc., After obtaining the scores of these marketing attributes, the practitioner calculates a marketing effort score by taking the weighted average of these scores. The weights can be assigned based on the relative importance of each attribute to the overall marketing objectives. For example, if the primary goal is to increase brand awareness, advertising reach and frequency may be given a higher weight. (2) In practice, different industry environments and marketing strategies may have different priorities for these marketing attributes. For instance, online sellers may pay more attention to the quality of online marketing content, social media engagement, search engine optimization effectiveness, online advertising reach and conversion rate, etc., while offline sellers focus more on in-store promotion effectiveness, customer service quality, local advertising reach, community involvement, etc.

References

  1. Luo, J.Q.; Gao, C.H.; Liao, R.H. Research on Channel Cooperation Strategy of Fresh Produce Considering Two Service Offerings. Ind. Eng. Manag. 2024, 29, 20–30. [Google Scholar] [CrossRef]
  2. Wang, D.; Tian, X.Y.; Guo, M.C. Pricing decision and channel selection of fresh agricultural products dual-channel supply chain based on blockchain. PLoS ONE 2024, 19, e0297484. [Google Scholar] [CrossRef] [PubMed]
  3. Xie, J.C.; Liu, J.J.; Huo, X.; Meng, Q.C.; Chu, M.Y. Fresh food dual-channel supply chain considering consumers’ low-carbon and freshness preferences. Sustainability 2021, 13, 6445. [Google Scholar] [CrossRef]
  4. Feng, Y.; Li, Z.H.; Zhang, Y.Z. Evaluation of Contractual Efficiency of Fresh Produce Supply Chain with TPL Intervention under Retailer Dominance. Manag. Comment. 2018, 30, 215–225. [Google Scholar] [CrossRef]
  5. Zhang, W.S.; Wu, L.; Ji, L.L. Blockchain technology adoption strategies for the shipping costs bearer in the fresh product supply chain. Front. Sustain. Food Syst. 2025, 9, 1550985. [Google Scholar] [CrossRef]
  6. Leylaparast, P.; Gholamian, M.R.; Noroozi, M. Integration of pricing, sustainability and 3PL delivery time according to freshness date in a dual-channel fruit supply chain: A game theoretic approach. J. Ind. Manag. Optim. 2025, 21, 504–523. [Google Scholar] [CrossRef]
  7. Ratchford, B.; Soysal, G.; Zentner, A.; Gauri, D.K. Online and offline retailing: What we know and directions for future research. J. Retail. 2022, 98, 152–177. [Google Scholar] [CrossRef]
  8. Li, Z.; Liu, Q.; Ye, C.; Dong, M.; Zheng, Y. Achieving resilience: Resilient price and quality strategies of fresh food dual-channel supply chain considering the disruption. Sustainability 2022, 14, 6645. [Google Scholar] [CrossRef]
  9. Wang, W.B.; Zhu, A.M.; Yu, L.J.; Wer, H.J. Research on cooperative advertising strategies for dual channel supply chain of fresh agricultural products considering carbon reduction efficiency under retailer leadership. PLoS ONE 2024, 19, e0303525. [Google Scholar]
  10. Yan, B.; Fan, J.; Wu, J.-W. Channel choice and coordination of fresh agricultural product supply chain. RAIRO-Oper. Res. 2021, 55, 679–699. [Google Scholar] [CrossRef]
  11. Zhou, T.; Meng, X.Q.; Tao, M. Research on Dual-channel Equal-price and Differential-price Decisions and Coordination in Supply Chain Considering the Efforts of Green and Freshness Preservation. Mod. Manag. 2023, 43, 164–170. [Google Scholar] [CrossRef]
  12. Chen, X.; Li, J.; Wang, Z.B. Equilibrium decisions for fresh product supply chain considering consumers’ freshness preference. Netw. Spat. Econ. 2023, 23, 771–797. [Google Scholar] [CrossRef]
  13. Hu, H.L.; Cao, Y.; Wu, K. Selection and Pricing of Fresh Supply Chain Sales Model Based on Pre-sale. Oper. Res. Manag. Sci. 2022, 31, 128–134. [Google Scholar]
  14. Jiang, Y.C.; Liu, C.; Bai, S.Z.; Li, H. Optimal Decision-making in Dual-channel Supply Chain of Fresh Agri-product by Applying Blockchain. Syst. Eng. 2023, 41, 63–72. [Google Scholar]
  15. Xiao, Q.; Zhang, Q.Y.; Gao, Z.Y. A quantum gaming study on thepricing of fresh mixed dual-channel supply chains considering the level of preservation effort. J. Ind. Manag. Optim. 2025, 21, 79–102. [Google Scholar] [CrossRef]
  16. Gan, W.; Huang, B. Exploring Data Integrity of Dual-Channel Supply Chain Using Blockchain Technology. Comput. Intell. Neurosci. 2022, 2022, 3838282. [Google Scholar] [CrossRef]
  17. Xu, J.; Xiong, S.H.; Cui, T.Y.; Zhang, D.M.; Li, Z.B. Incorporating Consumers’ Low-Carbon and Freshness Preferences in Dual-Channel Agri-Foods Supply Chains: An Analysis of Decision-Making Behavior. Agriculture 2023, 13, 1647. [Google Scholar] [CrossRef]
  18. Guo, X.Y.; Hu, H.T.; Li, J.T. Dual channel supply chain pricing and refrigeration decisions for fresh products considering refrigeration temperature. Ind. Eng. Manag. 2024, 29, 62–71. [Google Scholar] [CrossRef]
  19. Zhao, S.; Li, W.l.; Cao, X.N.; Liu, X.B. The fresh agricultural products double channel supply chain coordination mechanism under the pre-sale model. J. Manag. Eng. 2021, 35, 162–177. [Google Scholar] [CrossRef]
  20. Wu, S.; Li, B.; Li, Y.r. Advance selling decisions of retailer in dual channel of the fresh product supply chain. J. Syst. Eng. 2023, 38, 372–394. [Google Scholar] [CrossRef]
  21. Wang, W.L.; He, Z.Y.; Zhang, S.X. Joint Decision of Freshness-Keeping Effort and Promotion Effort in a Dualchannel Fresh Produce Supply Chain from a Dynamic Perspective. Available online: https://kns.cnki.net/kcms/detail/11.2835.g3.20230627.1119.005.html (accessed on 19 June 2025).
  22. Modak, N.M.; Senapati, T.; Simic, V.; Pamucar, D.; Saha, A.; Cárdenas-Barrón, L.E. Managing a sustainable dual-channel supply chain for fresh agricultural products using blockchain technology. Expert Syst. Appl. 2024, 244, 122929. [Google Scholar] [CrossRef]
  23. Zhao, Y.; Li, Y.H.; Yao, Q.; Guan, X. Dual-channel retailing strategy vs. omni-channel buy-online-and-pick-up-in-store behaviors with reference freshness effect. Int. J. Prod. Econ. 2023, 263, 108967. [Google Scholar] [CrossRef]
  24. Yu, Y.L.; Xiao, T.J.; Feng, Z.W. Price and cold-chain service decisions versus integration in a fresh agri-product supply chain with competing retailers. Ann. Oper. Res. 2020, 287, 465–493. [Google Scholar] [CrossRef]
  25. Cui, X.; Li, C.F.; Zhou, C.; Mi, X.X.; Shen, Y. Logistics Cooperation and Operational Decision Making in Fresh E-commerce Supply Chain under Stochastic Demand. Chin. J. Manag. Sci. 2022, 32, 87–98. [Google Scholar] [CrossRef]
  26. Ye, J.; Gu, B.J.; Fu, Y.F. Cold Chain Logistics Services and Pricing Decisions in the Supply Chain of Fresh Agricultural Products under Different Trade Patterns. Chin. J. Manag. Sci. 2023, 31, 95–107. [Google Scholar] [CrossRef]
  27. Chen, X.L.; Huang, L.; Ma, L.J. Research on agricultural product supply chain coordination contract with cost-sharing TPL service providers. J. Ind. Eng./Eng. Manag. 2021, 035, 218–225. [Google Scholar]
  28. Yu, Y.L.; Xiao, T.J. Pricing and cold-chain service level decisions in a fresh agri-products supply chain with logistics outsourcing. Comput. Ind. Eng. 2017, 111, 56–66. [Google Scholar] [CrossRef]
  29. Dan, B.; Ma, S.X.; Liu, M.L.; Tian, Y.; Lei, T. Research on supply chain information sharing of fresh agricultural products considering 3PL preservation efforts. Chin. J. Manag. Sci. 2024, 32, 122–132. [Google Scholar] [CrossRef]
  30. Chen, J.; Cai, Z.H. Preservation Mode Selection in Fresh Agri-food Dual-Channel Supply Chain Considering Freshness Competition. Fresh Preserv. Process. 2024, 24, 61–70. [Google Scholar]
  31. Wang, G.L.; Ma, C.X.; Zhou, X.J. Fresh Supply Chain Preservation and Outsourcing Decisions Considering Cost Advantages. J. Syst. Eng. 2023, 38, 101–120. [Google Scholar] [CrossRef]
  32. Yu, Y.L.; Xiao, T.J. Analysis of cold-chain service outsourcing modes in a fresh agri-product supply chain. Transp. Res. Part E Logist. Transp. Rev. 2021, 148, 102264. [Google Scholar] [CrossRef]
  33. Yu, Y.L.; Feng, Y. Fresh produce supply chain decision-making under different cold chain service models. Chin. J. Manag. Sci. 2021, 29, 135–143. [Google Scholar] [CrossRef]
  34. Zhang, K.J.; Ma, M.Q. Differential Game Model of a Fresh Dual-Channel Supply Chain Under Different Return Modes. IEEE Access 2021, 9, 8888–8901. [Google Scholar] [CrossRef]
  35. Yang, L.; Tang, R. Comparisons of sales modes for a fresh product supply chain with freshness-keeping effort. Transp. Res. Part E Logist. Transp. Rev. 2019, 125, 425–448. [Google Scholar] [CrossRef]
  36. Tang, R.H.; Yang, L. Financing strategy in fresh product supply chains under e-commerce environment. Electron. Commer. Res. Appl. 2020, 39, 100911. [Google Scholar] [CrossRef]
  37. Bai, S.Z.; Jia, X.L. Research on Operational Strategy of Capital-Constrained Dual-channel Supply Chain of Fresh Agricultural Products. Chin. J. Manag. Sci. 2024, 32, 275–285. [Google Scholar] [CrossRef]
  38. Tang, R.; Peng, Y.Y. Coordination mechanism of dual channels of fresh food supply chain based on differential game. Comput. Integr. Manuf. Syst. 2018, 24, 1034–1045. [Google Scholar] [CrossRef]
  39. Wang, L.; Dan, B. Research on freshness incentive mechanism of fresh produce supply chain considering consumer utility. J. Manag. Eng. 2015, 29, 200–206. [Google Scholar] [CrossRef]
  40. Xiong, F.; Fang, J.Y.; Yuan, J.; Jin, P. A study on incentives and coordination of fresh efforts in fresh produce supply chain under allied behavioral preferences. Chin. J. Manag. Sci. 2019, 27, 115–126. [Google Scholar] [CrossRef]
  41. Han, X.H.; Zhou, W.L.; Shen, Y.; Hou, R. Trade-Old-for-Remanufactured Program: Strategy Selection, Pricing and Coordination. Manag. Rev. 2018, 30, 177–194. [Google Scholar] [CrossRef]
  42. Pu, X.J.; Fan, W.D.; Wu, Y. A Study of Channel Patterns, Effort Inputs and Operational Efficiency of Fresh Produce Supply Chains. Chin. J. Manag. Sci. 2015, 23, 105–112. [Google Scholar] [CrossRef]
  43. Cai, K.Y.; He, Z.; Lou, Y.Q.; He, S.G. Risk-aversion information in a supply chain with price and warranty competition. Ann. Oper. Res. 2020, 287, 21–107. [Google Scholar] [CrossRef]
  44. Yan, B.; Jin, Z.J.; Liu, Y.P.; Yang, J.B. Decision on Risk-averse Dual-channel Supply Chain under Demand Disruption. Commun. Nonlinear Sci. Numer. Simul. 2018, 55, 206–224. [Google Scholar] [CrossRef]
  45. Li, W.L.; Zhao, S. Research on dual channel supply chain decision-making of high quality agricultural products considering the application of traceability system. Oper. Res. Manag. 2019, 28, 98–108. [Google Scholar]
Figure 1. 3PL-supplier-retailer three-tier fresh product supply chain: (a) traditional retail channel model (O Model); (b) homogeneous cold-chain service dual-channel model (D1 Model); (c) differentiated cold-chain service dual-channel model (D2 Model).
Systems 13 00538 g001aSystems 13 00538 g001b
Figure 2. The overall profit of the supply chain when h = 0.3 .
Systems 13 00538 g002
Figure 3. The overall profit of the supply chain when h = 0.5 .
Systems 13 00538 g003
Figure 4. The overall profit of the supply chain when h = 0.7 .
Systems 13 00538 g004
Figure 5. The influence of α on the equilibrium decision-making process: (a) the influence of α on cold-chain service levels; (b) the influence of α on transportation prices; (c) the influence of α on wholesale prices; (d) the influence of α on sales prices; (e) the influence of α on marketing efforts.
Systems 13 00538 g005
Figure 6. The influence of α on the profits of each member and the system of the supply chain: (a) the influence of α on the profits of 3PL; (b) the influence of α on the profits of the supplier; (c) the influence of α on the profits of the retailer; (d) the influence of α on the profits of the supply chain system.
Systems 13 00538 g006
Figure 7. The influence of l on the equilibrium decision-making process: (a) the influence of l on cold-chain service levels; (b) the influence of l on transportation prices; (c) the influence of l on wholesale prices; (d) the influence of l on sales prices; (e) the influence of l on marketing efforts.
Systems 13 00538 g007aSystems 13 00538 g007b
Figure 8. The influence of l on the profits of each member and the system of the supply chain (a) the influence of l on the profits of 3PL; (b) the influence of l on the profits of the supplier; (c) the influence of l on the profits of the retailer; (d) the influence of l on the profits of the supply chain system.
Systems 13 00538 g008
Figure 9. The influence of γ on the equilibrium decision-making process: (a) the influence of γ on cold-chain service levels; (b) the influence of γ on transportation prices; (c) the influence of γ on wholesale prices; (d) the influence of γ on sales prices; (e) the influence of γ on marketing efforts.
Systems 13 00538 g009aSystems 13 00538 g009b
Figure 10. The influence of γ on the profits of each member and the system of the supply chain (a) the influence of γ on the profits of 3PL; (b) the influence of γ on the profits of the supplier; (c) the influence of γ on the profits of the retailer; (d) the influence of γ on the profits of the supply chain system.
Systems 13 00538 g010
Table 1. Summary of the scenarios in the related literature.
Article3PL ParticipationOnline Channel OperatorsFreshness ConsistencyFreshness PreserverFreshness Preservation EffortMarketing Effort
[34]-RetailerNoBoth
[35]-BothYesRetailer-
[2]-SupplierYesRetailer--
[9]-SupplierYesSupplier-
[10]-SupplierNoSupplier--
[36]-RetailerYesRetailer-
[8]-SupplierNoBoth-
[16]-BothYesSupplier-
[12]-RetailerNoRetailer-
[17]-BothYesSupplier-
[35]-SupplierNoRetailer-
[18]-SupplierNoBoth--
[30]YesSupplierNoAll-
[37]-SupplierYesSupplier-
[21]-SupplierYesSupplier
[38]-SupplierNoBoth-
[5]Yes--3PL-
[29]Yes--3PL-
This paperYesSupplierYes3PL
Table 2. Symbolic Explanations.
SymbolsExplanations
f 3PL’s decision variable, unit transportation price of fresh products
e 3PL’s decision variable, the cold-chain service level
e 1 3PL’s decision variable, the online channel cold-chain service level under D2 Model
e 2 3PL’s decision variable, the offline channel cold-chain service level under D2 Model
w Supplier’s decision variable, unit wholesale price of fresh products
p s Supplier’s decision variable, online unit sales price of fresh products under the dual-channel model
x s Supplier’s decision variables, offline marketing efforts in the dual-channel model
p r Retailer’s decision variable, the offline unit sales price of fresh products
x r Retailer’s decision variable, the offline marketing efforts of fresh products
k j Effort   cos t   coefficient ,   j = t , s , r
θ 0 The   initial   freshness   of   fresh   product ,   0 < θ 0 < 1
η The   influencing   factors   of   cold chain   service   level   on   the   freshness   of   fresh   products ,   0 < η < 1 θ 0 < 1
α The   sensitivity   coefficient   of   consumers   to   the   prices   of   fresh   products ,   0 < α < 1
ρ The   proportion   of   potential   market   demand   in   offline   channels ,   0 < ρ < 1
l The   sensitivity   coefficient   of   consumers   to   the   freshness   of   fresh   products ,   0 < l < 1
γ The   sensitivity   coefficient   of   consumers   to   marketing   efforts ,   0 < γ < 1
h The   degree   of   consumers   recognition   of   online   fresh   products ,   0 < h < 1
π j Profit   function ,   j = t , s , r
The overall profit of the supply chain
t Subscript, 3PL
s Subscript, the supplier
r Subscript, the retailer
D o n Online market purchase volume
D o f f Offline market purchase volume
U o n The utility that consumers obtain from purchasing fresh products through online direct sales channels
U o f f The utility that consumers obtain from purchasing fresh products through offline retail channels
OSuperscript, decision-making situation of the traditional retail channel
D1Superscript, decision-making situation of the homogeneous cold-chain service dual-channel
D2Superscript, decision-making situation of the differentiated cold-chain service dual-channel
Table 3. Table of values for relevant parameters.
a h θ 0 η k t k s k r k t 1 k t 2
100.60.80.123015252428
Table 4. The overall profit of the supply chain when h = 0.3 .
O * D 1 * D 2 *
l α γ
0.20.60.32.528934.666913.70566
0.62.787597.491676.99136
0.80.31.882123.443972.73195
0.62.021734.211133.48686
0.50.60.33.684787.971847.03746
0.64.0617818.943519.3598
0.80.32.742125.83375.13536
0.62.945588.242417.68837
0.80.60.35.0593212.772511.8675
0.65.5772938.186240.2186
0.80.33.764479.278738.5946
0.64.0439114.51114.1661
Table 5. The overall profit of the supply chain when h = 0.5 .
O * D 1 * D 2 *
l α γ
0.20.60.32.528934.49533.78256
0.62.787595.452944.57323
0.80.31.882123.329832.80752
0.62.021733.782373.141
0.50.60.33.684786.994196.29638
0.64.061789.166938.56442
0.80.32.742125.17124.65656
0.62.945586.053045.49359
0.80.60.35.0593210.31679.63286
0.65.5772914.622614.3559
0.80.33.764477.608127.10034
0.64.043919.212928.74271
Table 6. The overall profit of the supply chain when h = 0.7 .
O * D 1 * D 2 *
l α γ
0.20.60.32.528934.43533.97268
0.62.787595.614114.75857
0.80.31.882123.28692.95548
0.62.021733.776423.20924
0.50.60.33.684786.62576.1747
0.64.061788.934239.01006
0.80.32.742124.911594.58595
0.62.945585.623585.16214
0.80.60.35.059329.386168.94571
0.65.5772914.290815.7121
0.80.33.764476.951816.6311
0.64.043918.085967.741
Disclaimer/Publisher’s Note: The statements, opinions and data contained in all publications are solely those of the individual author(s) and contributor(s) and not of MDPI and/or the editor(s). MDPI and/or the editor(s) disclaim responsibility for any injury to people or property resulting from any ideas, methods, instructions or products referred to in the content.

