Article

An Examination of the Evolution of Green Industry Structure and Sustainable Cooperation Strategies Between China and the Visegrád Group: A Product Space Approach

1
CEEC Economic and Trade Cooperation Institute, Ningbo University, Ningbo 315211, China
2
School of Business, Ningbo University, Ningbo 315211, China
3
Zhejiang Institute of Tianjin University, Ningbo 315211, China
*
Authors to whom correspondence should be addressed.
These authors contributed equally to this work.
Systems 2025, 13(7), 508; https://doi.org/10.3390/systems13070508
Submission received: 6 May 2025 / Revised: 13 June 2025 / Accepted: 19 June 2025 / Published: 24 June 2025

Abstract

The Visegrád Group (V4), as China’s key economic and trade partner in Central and Eastern Europe, plays a pivotal role in enhancing the effectiveness of sustainable development within the China-Central and Eastern Europe cooperation (China-CEEC) framework through its comprehensive green initiatives. This study analyzes export data and environmental product classifications from major countries in the CEPII-BACI database, covering the period from 2003 to 2022, to construct a green product space network. The analysis reveals the evolutionary patterns of the green industry and the collaborative transformation mechanisms between China and the V4 countries. The findings indicate the following: (1) The green product space network displays a “core-periphery” structural framework, wherein China has expanded its core product offerings by leveraging technological advancements in the photovoltaic sector, while the V4 countries enhance their resource allocation by systematically phasing out peripheral products. (2) The Green Complexity Index (GCI) suggests that China’s green production capacity has significantly improved, thereby narrowing the technological gap with Poland and Slovakia. (3) According to the Green Competition Index, a strategic complementary space exists between the two parties in the domain of medium- to high-complexity products. This study recommends extending green cooperation to higher value chain segments by establishing a collaborative innovation network for green technologies, developing a dynamic capacity optimization mechanism, and deepening the joint research and development of core products. This article offers a decision-making framework based on production capacity endowments to facilitate multinational collaborative transformations in the green industry.

1. Introduction

In light of the accelerated implementation of the European Union’s Carbon Border Adjustment Mechanism (CBAM) and significant shifts in the global climate governance framework, breaking through the “carbon lock-in” dilemma and achieving a green and low-carbon transformation has become a common challenge and urgent demand for the international community [1]. Regional cooperation, especially in the context of collaborative transformation around the green industry, is becoming a crucial pathway for reshaping the global green value chain.
Since its inception in 2012, the China-Central and Eastern European Countries (CEEC) cooperation mechanism has gradually transitioned from a regional economic and trade cooperation platform into a strategic vehicle for the reconstruction of global green value chains. This strategic upgrade is reinforced by high-level commitments; President Xi Jinping has consistently emphasized the importance of enhancing cooperation in the green economy and clean energy sectors during the China-CEEC Leaders’ Summit. In 2023, the Ministry of Commerce articulated the need to broaden collaboration in emerging sectors, particularly in green and low-carbon development, thereby establishing institutional frameworks to support the cooperative transformation of both parties in the green industry.
The Visegrád Group (V4), consisting of Poland, the Czech Republic, Slovakia, and Hungary, serves as a model of economic integration in Central and Eastern Europe and ranks among China’s top four trading partners in the region. Notably, China is the largest trading partner in Asia for these four countries [2]. The V4 countries have shown resilience and possess substantial experience in disseminating clean energy technologies and innovating circular economy systems, making them an ideal testing ground for advancing cross-regional green cooperation within the framework of China-CEEC collaboration.
However, existing research has limitations in guiding the formulation of such transnational green cooperation strategies. Yet, while trade relations among nations within an open economy are a significant focus in international trade research, current studies predominantly emphasize the analysis of trade flows, thus neglecting the micro-mechanisms that underlie the co-evolution of green production capabilities. This oversight directly limits the effectiveness of formulating multinational green cooperation strategies.
In recent years, product space theory, developed from the comparative advantage theory and evolutionary geography, has provided a paradigm and analytical framework for countries to identify directions for industrial upgrading [3]. By assessing the national production capacity endowment through the evolution of the comparative advantage of export products at the micro level [4], the theory addresses the relationship among the accumulation of production capacity, the transformation of the industrial structure, and the acquisition of international competitiveness, thus providing an analytical framework for understanding the endogenous driving mechanism of international trade development and the development potential of trade. Recent studies have established a significant coupling between transitions in economic complexity and the decoupling of carbon emissions [5], thereby validating the extension of the product space approach to research on green industry transformation. However, existing literature presents two primary limitations: first, it frequently employs comprehensive product space analyses that dilute the specific patterns of environmental technology diffusion; second, it tends to overlook the synergistic effects of cross-national production capacity networks, which complicates the design of sustainable cooperation mechanisms.
Based on the aforementioned background, practical needs, and theoretical gaps, this study addresses two core issues regarding the collaborative transformation of the green industry between China and the V4 countries. The first objective is to investigate the distinct characteristics of the evolutionary paths of green production capacities in China and the V4 countries. The second objective is to explore the potential for strategic collaboration between these two parties in the advancement of green industries. To answer these questions, the research constructs a spatial network comprising 157 types of green products derived from the WTO/OECD environmental product list. It assesses production capacity endowments using the Green Complexity Index (GCI), analyzes shifts in competitive advantage through product space evolution diagrams, and evaluates cooperative potential via the Green Competitive Index. By examining the case of green industry cooperation between China and the V4 countries, this research aims to deepen the scientific basis and practical pathways for global cross-regional green cooperation under the China-CEEC cooperation mechanism. It also aspires to contribute to multinational green industry collaborative research at both methodological and theoretical levels.
The rest of this article is organized as follows. The relevant theories and literature are reviewed in Section 2. Section 3 presents the data sources and methods. The empirical results are reported in Section 4. Section 5 outlines the potential for cooperation. Finally, conclusions, implications, and prospects are provided.

2. Theoretical Basis and Literature Review

2.1. Product Space Theory

Product space theory, also known as the Hausmann–Klinger framework, was first proposed by Hausmann and Klinger [6]. The core idea of this theory is that the economic complexity of a country is related to the diversity and complexity of its export products. These products are the comprehensive reflection of factor endowment information, such as capital, labor, technology, organization, and institutions, accumulated at the local level in a country’s production capacity [7]. Unlike endogenous technological progress theory, in product space theory, the production capacity of products is not limited to technological innovation and scientific research capabilities but generally includes a broader range of capabilities, such as technology, labor, productive knowledge, infrastructure, and institutions required for the production of products [3,8]. Consequently, countries that export more complex and diverse products are considered more economically advanced.
According to the theory, the degree of relatedness between different products is visualized through network research methods. The product spatial network reflects the relatedness between the capabilities required for product production and the development of new products. The closer two products are in the product space, the more easily the comparative advantage is transferred to the new product [9,10]. That is, in the product space, new products that are highly related to existing export products are more likely to achieve innovation [11,12]. This conclusion has been supported by the study of specific industries, such as high-tech industries [13,14] and blue ocean industries [11]. Products that are closer in space are more closely related and more easily diversified. Therefore, policymakers can use this theory to identify opportunities for economic growth and development by focusing on expanding the export capacity of related products in their countries.

2.2. Research on the Green Product Space

Currently, product space theory and its methodology are associated with sustainable development research. Studies of the product space of sustainable development can be divided into two groups: the construction of green product space based on product relatedness, and the exploration of the connection between economic and environmental performance based on product complexity.
The research on green product space based on product relatedness focuses on constructing green product space networks using product proximity. Research contents include identifying “green”-related products (from initial solar cells, wind turbines, nuclear power plants, and their parts and components [15] to 293 green products included in a comprehensive dataset created by Mealy and Teytelboym [8] based on the environmental product list), assessing economies’ positions in the green product space (such as green relatedness, green specialization and green diversification), and evaluating potential green product development opportunities [3,16]. The core objective of such research is to provide theoretical foundations and quantitative support for formulating industrial policies that guide green sustainable development at the regional and national levels.
Another related research direction is the discussion of economy-environment performance relationships from the complexity perspective, primarily examining the impact of production structure changes induced by production capacity accumulation on environmental performance. A positive correlation between the degree of economic complexity and environmental performance has been observed [5,17]. This is because countries or regions with higher economic complexity have more complex knowledge bases and production capabilities. The regions with more complex green production capabilities have sufficient resources available to implement the Sustainable Development Goals (SDGs). However, this positive relationship is not unconditional; Mai, et al. [18] pointed out that the promoting effect of economic complexity on the digitalization’s reduction of resource consumption is constrained by existing production capacities and technological levels; meanwhile, government environmental governance practices are also key factors shaping the level of green economic complexity [19].

2.3. Research on International Cooperation and Green Development Between China and V4 Countries

Research on China-V4 cooperation primarily focuses on bilateral and multilateral cooperation frameworks, such as the “China-CEEC Cooperation” and the “Belt and Road” Initiative, in the domains of economic-trade investment, platform development, and regional connectivity [20,21,22,23]. Studies indicate that V4 countries have become crucial partners for China in Central and Eastern Europe by leveraging their investment advantages, comprehensive indicators, and geographical positioning, while playing a bridging role in connecting China-Europe value chains [24,25].
Research regarding green development in V4 countries, which is closely related to the present study, addresses areas such as green energy, green transformation, and green employment. Overall, the V4 group is oriented toward fossil fuel-intensive industries, and its member states started the energy transition later than other European Union (EU) member states [26], thereby transforming the energy structure, which is an enormous challenge [27]. However, the V4 Group has the most dynamic and innovative renewable energy sector in CEE, such as the development status of renewable energy [28,29] and the utilization and development potentials of solar energy [30], wind energy [31], biomass energy [32,33], and geothermal energy [34], offering many possibilities for economic development, job creation, energy security, and ecological protection [35].
At the country level, in response to the demand for green transformation, the V4 countries have formulated different energy policies based on their existing energy structure and development potential. Coal ranks first in the energy mix of Poland and the Czech Republic, while nuclear power is the primary energy source in Slovakia and Hungary [36]. Riepl and Zavarská [27] note that the Czech Republic and Hungary have experienced stagnation or even decline in green transformation. The Czech Republic still relies on coal for energy [37], and the speed of green transformation is slow. Although renewable energy already accounts for nearly one-third of Hungary’s total energy production, Hungary is not inclined to develop renewable energy either [38] and instead focuses on nuclear energy, which is usually considered a non-renewable energy source [37]. In addition, the Czech Republic and Hungary achieve their renewable energy goals through appropriate legal frameworks and project financing using green energy, but the main source is external EU funding. Therefore, in the absence of external funding, it may be difficult to find state support sources for developing green technologies [36]. Slovakia and Poland have increased their use of renewable energy [27]. Although Slovakia is usually in the lower half of the EU rankings for most SDGs [39], its geographic location, economic structure, education, and available resources provide it with the prerequisites for eco-innovation and development in both the public and private sectors [40]. Poland ranked first in green jobs in the V4 renewable energy sector in 2017, and its use of green energy has not only driven the green transformation of the industry but also created green jobs [41].
Through a systematic review of existing literature, this study identifies the following critical research gaps: First, while product space theory has achieved significant results in guiding green industry development and promoting environmental improvements, current research primarily focuses on individual countries or single economies. There is a lack of studies applying product space theory to assess transnational/regional industrial cooperation potential. Second, research on green development in V4 countries overly concentrates on describing energy structures and country comparisons, lacking systematic quantitative assessments based on green production capacity. Finally, studies on China-V4 cooperation predominantly address geopolitical, investment-trade, or project-specific dimensions. Few studies leverage micro-foundations of industrial capacity complementarity and shared green transition needs, nor employ quantitative tools to identify and evaluate specific cooperation synergies and potential areas in green industries.

3. Data Sources and Research Methods

3.1. Data Sources

Considering data availability and product characteristics, scholars studying product space extensively use trade data to measure the production capacity of a country or region. The use of trade data allows the evaluation of outcome indicators under the joint influence of various market-related factors, and the introduction of comparative advantage to represent export probability can prevent the impact of accidental exports. Moreover, this approach can provide a rich source of detailed geographic information on tradable goods, enabling comparisons across time and space [8,42].
The global product export trade data are sourced from the CEPII-BACI database, with the version identified as HS6 REV.1996. Based on the suggestion from the Growth Lab at Harvard University for data selection in constructing economic complexity maps (The Growth Lab at Harvard University suggests retaining countries or regions with continuous export information over the past 20 years and excluding those with populations of less than 1 million and those with an average trade volume of less than USD 1 billion over the past 20 years.), the selected data cover export data from 142 countries and regions during the 20-year period from 2003 to 2022 (Data for the former Sudan are calculated separately for Sudan and South Sudan after 2012; data for Serbia after 2006 are calculated separately, and data for Serbia before 2006 are calculated together with those for Montenegro.). Regarding the identification of green products, we integrate data from the OECD (1996), WTO (core list of the World Trade Organization), and APEC list and standardize them to the 6-digit classification of the HS1996 version. We include a total of 157 green products in the three groups: pollution management, clean technology and products, and resource management (Appendix A).

3.2. Methods

Our analytical framework implements a three-phase procedure: First, green products are identified through an explicitly defined product set, as detailed in Section 3.1. Second, national production capabilities are quantified by calculating specialization levels using a binary comparative advantage matrix M c p , and assessing productive capacity sophistication through the Green Complexity Index. The evolution of industrial structures is analyzed based on product space networks, represented by a product-relatedness matrix Φ p p . Finally, we evaluate future green transition potential by assessing the feasibility of developing new green products (Green Complexity Potential). Additionally, we measure bilateral synergies between China and the V4 countries by evaluating structural similarity in existing green industries (Similarity Green Product) and directional convergence in transition pathways (Similarity Green Product Development).

3.2.1. Comparative Advantage Matrix

In the product space, the economic activities of an economy with a revealed comparative advantage are organized in matrix form [3]. This organization facilitates the assessment of the specialization levels of these economic activities. A binary comparative advantage matrix M c p , as mentioned in Equation (1).
M c p = 1       R C A c p = X c p / c X c p p X c p / c p X c p 1 0                                                     o t h e r w i s e                                      
where X c p represents the total value of product p exported by country c .

3.2.2. Product Space Network

Next, based on M c p , a “country–product” spatial network is constructed in Equation (2).
Φ p p = c M c p M c p max k p , 0 , k p , 0
where Φ p p is measured by the possibility of joint exports, describing the probability that a country c exports both product p and products p . The higher the probability is, the closer the two products are and the higher their relatedness.

3.2.3. Green Complexity Index

Mealy and Teytelboym [8] provide a new measure for assessing the production capacity endowment of specific industries in the product space; that is, a subset of green products is extracted from the entire product space sample and added with the product complexity index (PCI) of competitive green products g in country or region c to assess the green production capacity endowment of the country or region and help identify the position of the country or region in green economic development.
Therefore, the green economic complexity at the national level can be calculated as formulated in Equation (3).
G C I c = g M c g P C I ~ g
where G C I c is the green complexity index of the country c , and the calculation result is standardized; M c g represents the binary advantage matrix of green products produced by country c; and P C I ~ g is the green product complexity obtained by normalizing P C I g = P C I g | p = g 1 , g 2 g 157 .

3.2.4. Green Development Potential

(1)
Green product density (GDE)
Green product density G D E c g is a green subset of the product density, as expressed in Equation (4).
G D E c g = p M c p Φ g p p Φ g p
where p represents any product among all products exported by the country, g represents all green products exported by the country, and Φ g p represents the relatedness of green products to all other products.
(2)
Green Complexity Potential (GCP)
GCP is calculated based on main products for which the country currently does not have a comparative advantage to estimate the country’s potential for the diversified development of green and technologically advanced products in the future, as calculated in Equation (5).
G C P c = g 1 M c g G D E c g P C I ~ g g 1 M c g

3.2.5. Green Competitiveness Index

Based on the approach to calculating the product-relatedness matrix, a national green-relatedness matrix is constructed to measure the green trade competitiveness index between countries and to inversely evaluate the current and future cooperation opportunities between them.
Referring to the study by Fraccascia, Giannoccaro and Albino [9], the competitiveness index is divided into the Similarity Green Product (SGP) index and the Similarity Green Product Development (SGPD) index. SGP is used to measure the common green products exported by two countries, as measured in Equation (6); the larger the index value is, the higher the similarity of competitive green products between the two countries.
S D G c 1 , c 2 = c M c 1 , g M c 2 , g max k c 1,0 , k c 2,0
SGPD is used to measure the green products that two countries may jointly export in the future, as specified in Equation (7). The larger the index value is, the higher the similarity of green products that the two countries can produce in the future.
S D G P c 1 , c 2 = c M c 1 , g M c 2 , g max k c 1,0 , k c 2,0
where M is redefined as M c p = 1   0.5 R C A c p < 1             0   o t h e r w i s e   .

4. Results

4.1. Green Products Trade Between China and the V4 Countries

An analysis is conducted on the total bilateral trade volume and green bilateral trade volume between China and the V4 countries from 2003 to 2022, as well as their changes over time (Figure 1). In terms of total trade volume, the total bilateral trade volume between China and the V4 countries showed a steady annual increase over the 20-year period. In 2022, Poland was the country with the highest total exports from China among the V4 countries, followed by the Czech Republic, Hungary, and finally Slovakia; Poland was also the V4 country with the highest total exports to China, followed by Slovakia, the Czech Republic, and Hungary. From a spatiotemporal perspective, China’s export volume to Poland and the Czech Republic showed steady growth, while its export volume to Slovakia and Hungary showed steady growth between 2003 and 2008, followed by a period of stable fluctuation in the subsequent years; V4 countries’ exports to China showed an alternating upward trend.
In terms of green trade, in 2022, China’s total trade of green products with V4 countries was approximately USD 8.6 billion, and the total green product trade of V4 countries to China was approximately USD 1.258 billion, reflecting increases of 2240.79% and 666.04%, respectively, compared with the values in 2003. The asymmetric growth suggests that China will continue to enjoy a green trade surplus with the V4 countries and that this surplus will gradually increase. Statistics show that the green trade surplus between the two parties expanded from USD 203 million in 2003 to USD 7.341 billion in 2022. In addition, over the 20-year period, the proportion of China’s green product exports to V4 countries in its total trade volume increased from 4.29% to 9.56%, while the proportion of green products exported by V4 countries to China in their total trade volume decreased from 15.96% to 10.42%, indicating a significant improvement in China’s green market position in V4 countries.

4.2. Green Product Complexity (PCI) and National Green Complexity GCI

According to the complexity calculation results of product space theory, subsets of green products are extracted using the average PCI results calculated from the export product trade data for the 20-year period from 2003 to 2022. Specifically, the top 10 and bottom 10 green products ranked by average PCI value are selected, as shown in Table 1. The green products with the highest PCI values all belong to pollution management products in Group A, mostly environmental monitoring, analysis, and evaluation equipment involving optical instruments, as well as solid waste management equipment and parts/components products under catalog 84.79. The green products with the lowest PCI values are mostly environmentally friendly products made from raw materials with green attributes (e.g., plants and chemicals).
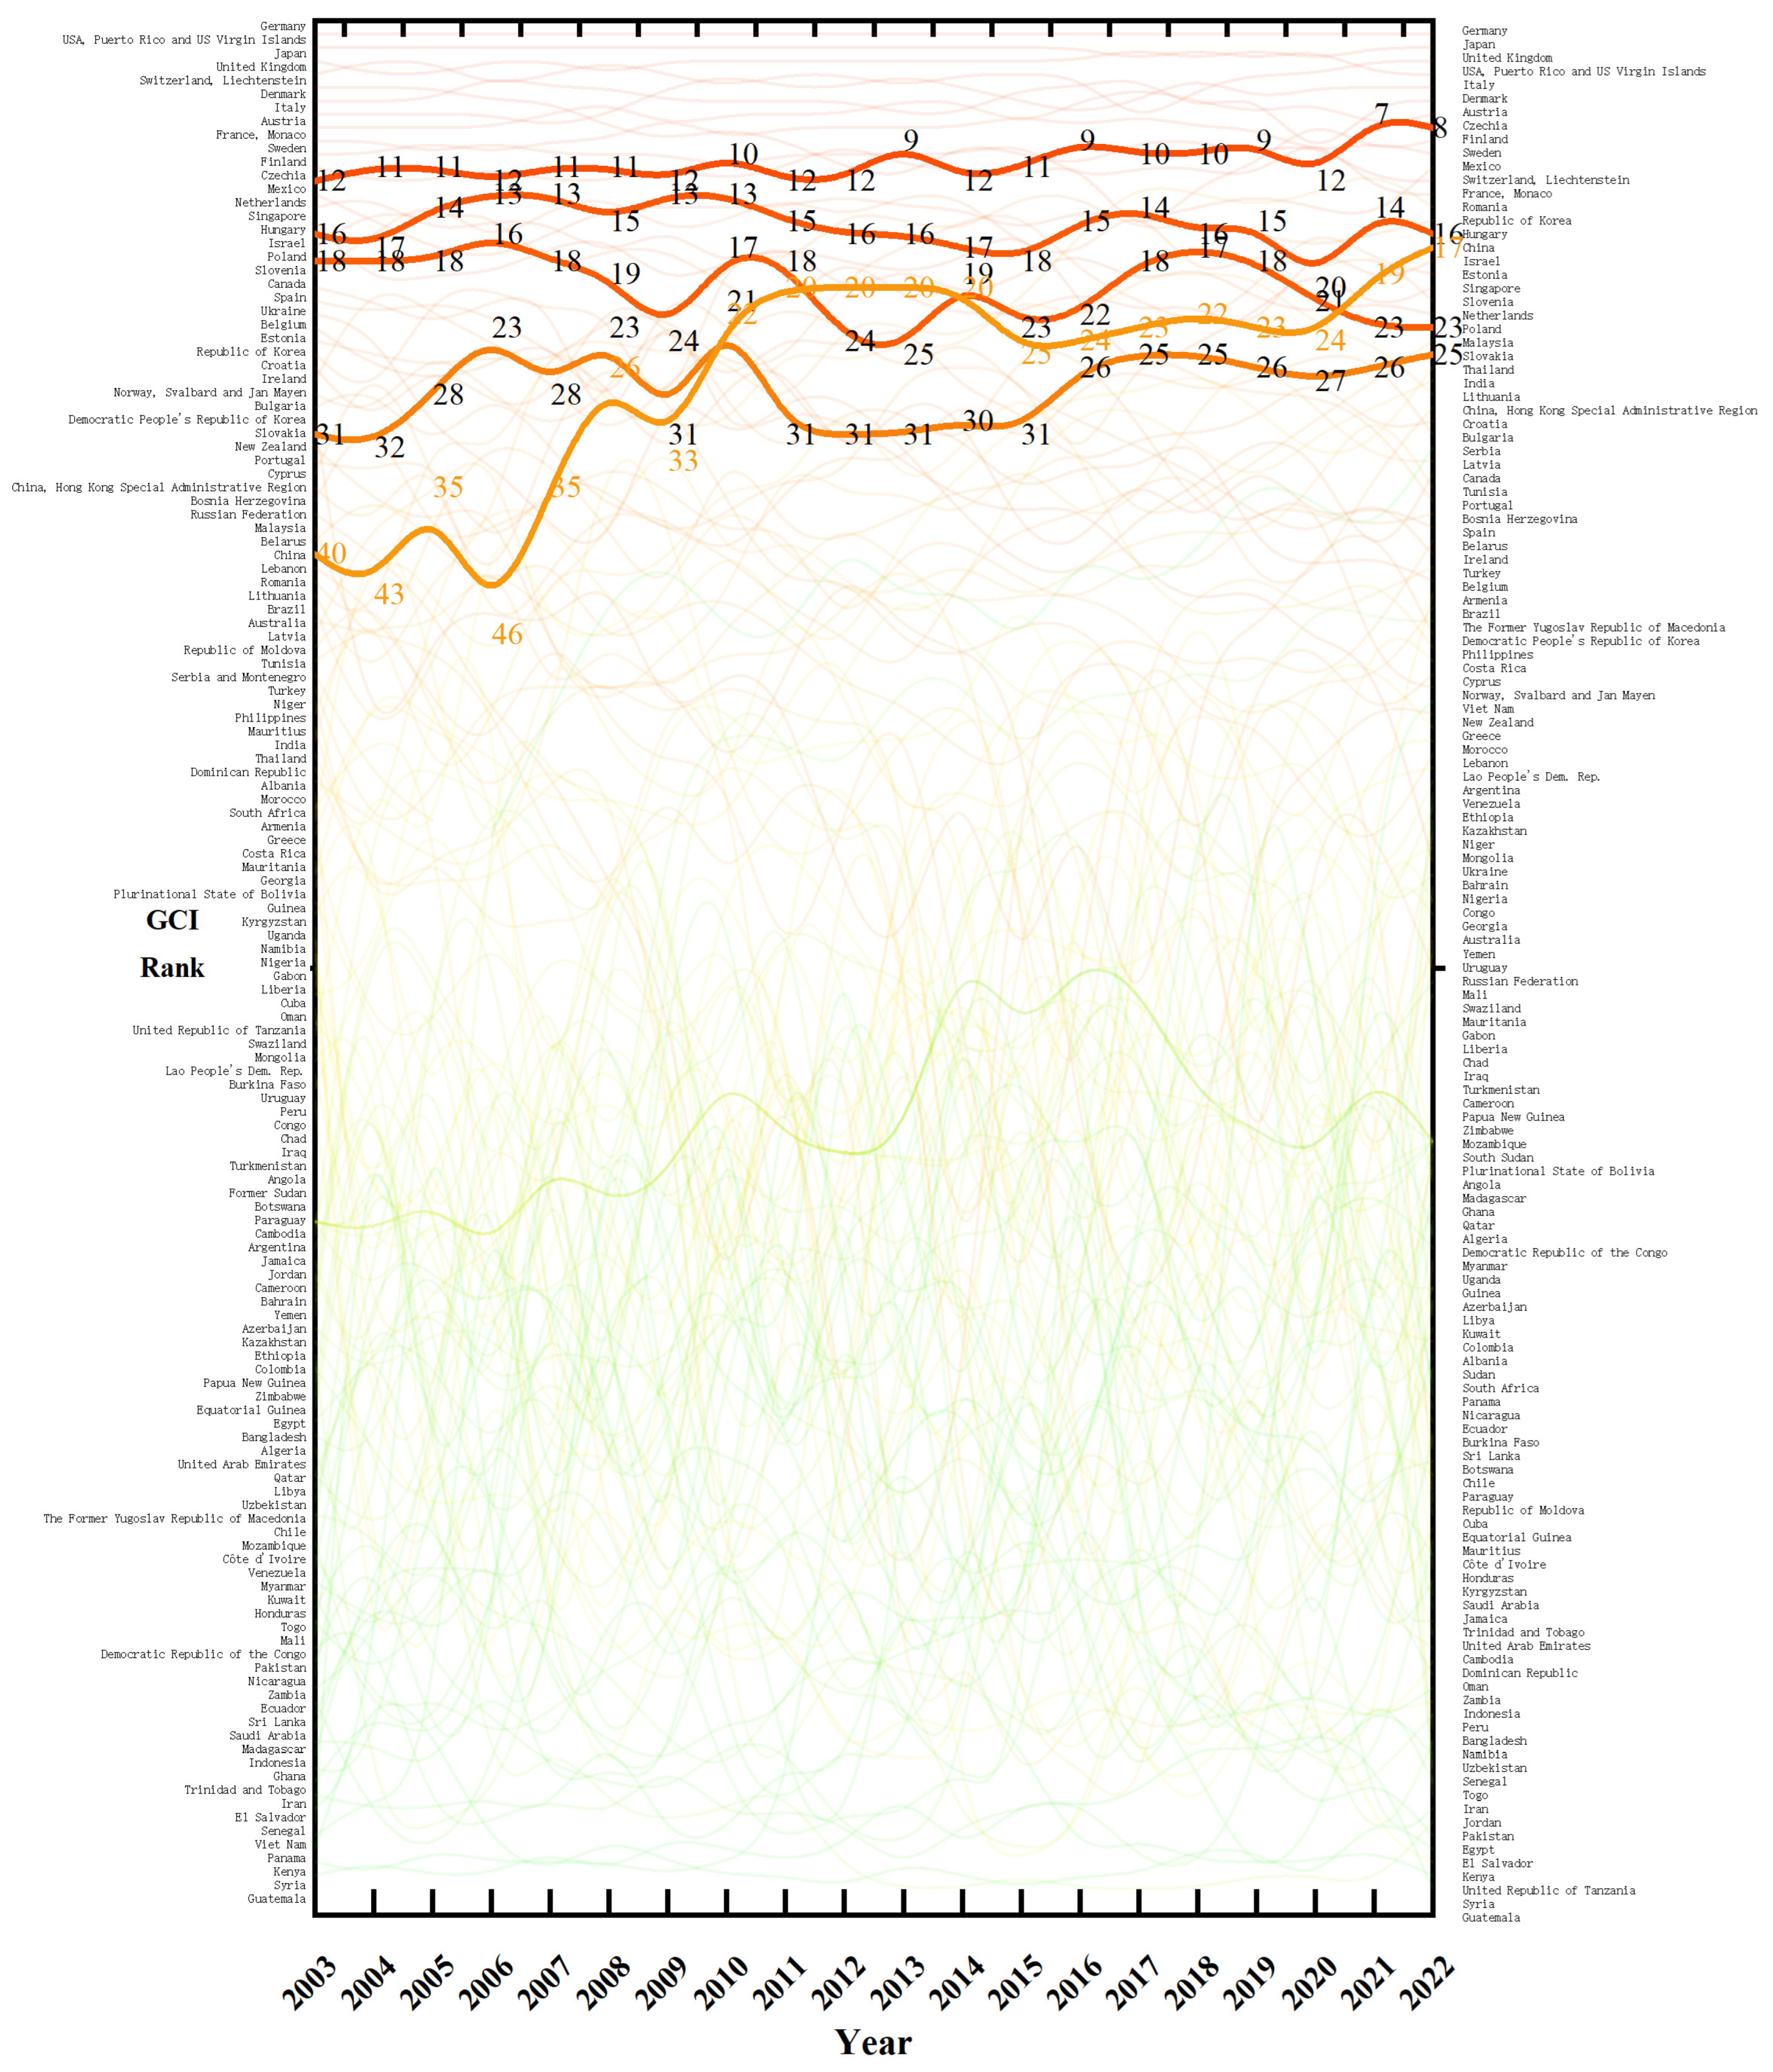
Second, on the basis of the PCI calculation results, GCI is used to measure the extent to which an economy can competitively produce technologically advanced green products. GCI is usually used as a proxy variable to measure a country’s green production capacity. Figure 2 shows the GCI rankings of 142 countries and regions around the world during the 20-year period from 2003 (left axis) to 2022 (right axis). It maintains methodological rigor by adopting the full-sample computation approach outlined by Mealy and Teytelboym [8], which effectively mitigates the selection bias that can arise from using partial samples. Furthermore, Figure 2 highlights the dynamics between China and the V4 countries through deliberate visual encoding; bold streams represent China and the V4 nations, while low-opacity streams illustrate the other countries. This design effectively conveys their relative positions on the global stage and their evolutionary trajectories.
As shown in Figure 2, at the global level, in 2003, Germany, the United States, Japan, the United Kingdom, Switzerland, and Liechtenstein ranked in the top five in GCI, while countries with the lowest ranking in terms of green production capacity included Vietnam, Panama, Kenya, Syria, and Guatemala. In 2022, Germany, Japan, the United Kingdom, the United States, and Italy ranked in the top five, and the countries ranking at the bottom included El Salvador, Kenya, Tanzania, Syria, and Guatemala. Germany has consistently maintained its leading position globally for over 20 years. Focusing on the evolution of the green complexity presented by China and V4 countries, in 2003, the Czech Republic had the strongest green production capacity among the five countries, ranking 12th in the world, followed by Hungary, Poland, and Slovakia, while China ranked 40th in the world, the weakest among the five countries. Over the past 20 years, the national green complexity of the Czech Republic has steadily increased, such that the country reached 8th place globally, maintaining a high level of green product production capacity. Hungary’s global ranking remained essentially stable. Poland’s green complexity showed a downward trend. Slovakia and China’s 357 green production capacity improved significantly and continuously. In particular, China rose to 17th place in the GCI global ranking in 2022, just behind the Czech Republic (8th) and Hungary (16th), continually narrowing the gap with high-level green production countries.

4.3. Spatial Distribution and Structural Differences of the Green Product Spatial Network in China and V4 Countries

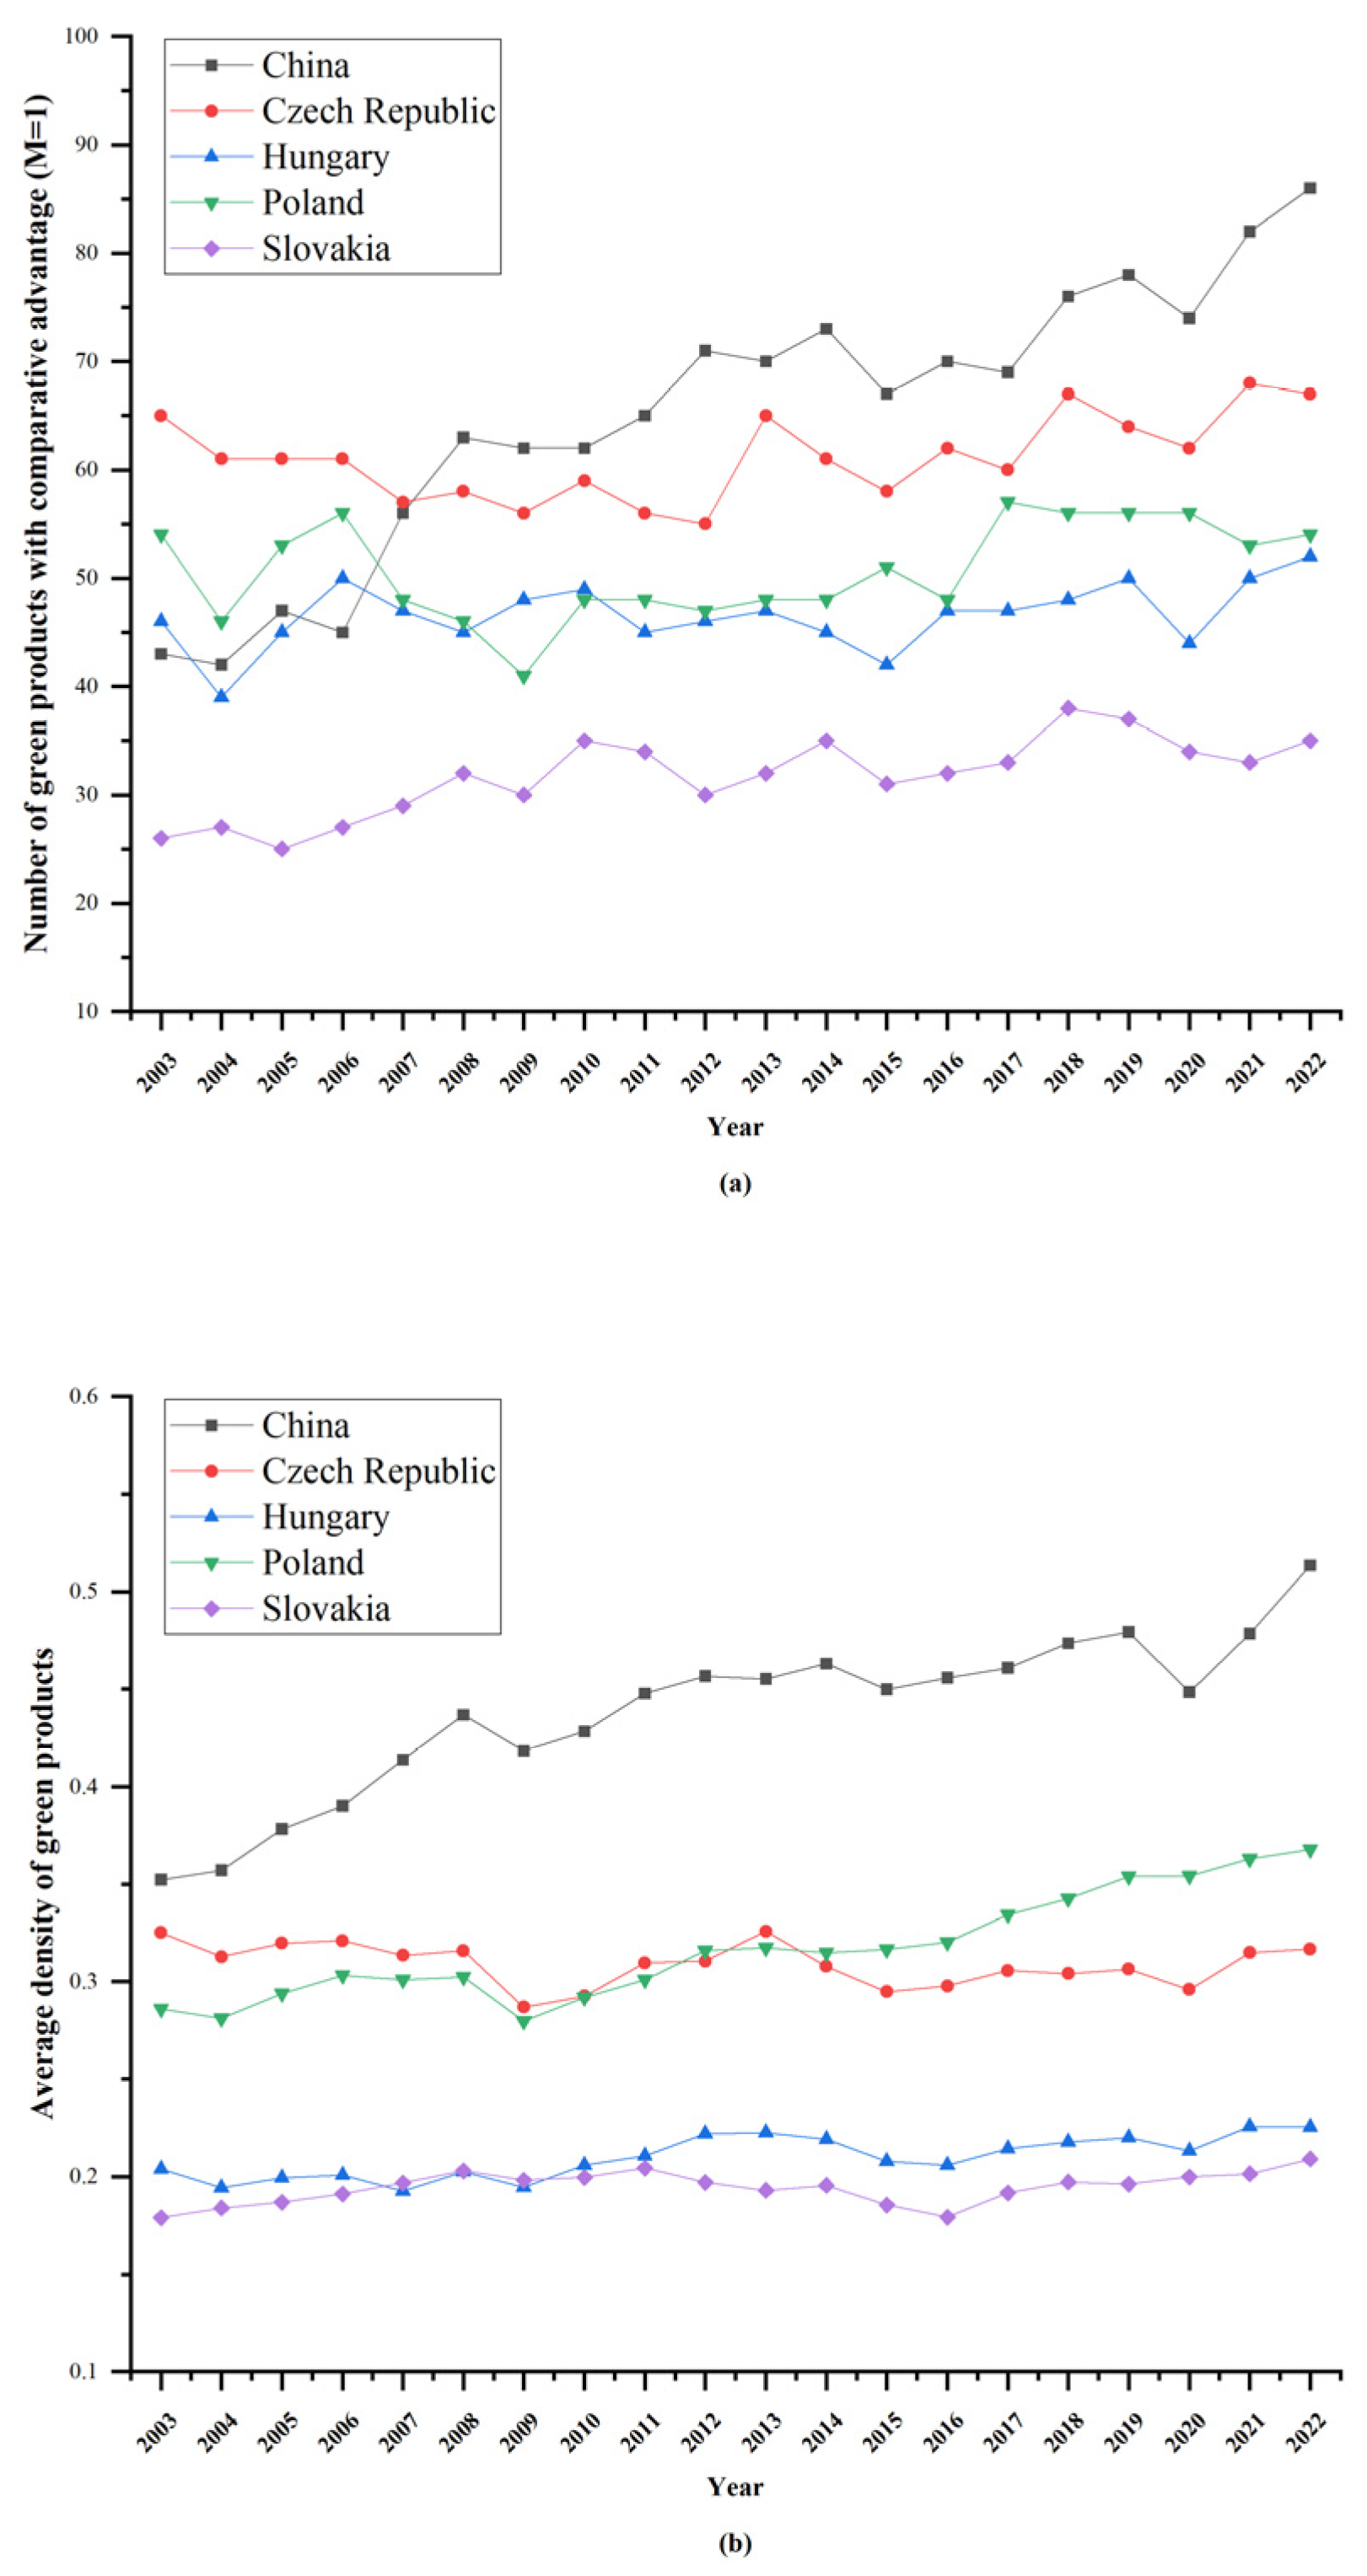
Figure 3 illustrates the time series evolution of the number of green products with comparative advantages and the average relatedness density of green products of China and the V4 countries over the 20-year period. As shown in Figure 3a, while the green comparative advantage of V4 countries showed slight, stable fluctuations with a slight increase, the number of China’s green products with comparative advantages increased rapidly. Notably, there was a 1.4-fold increase from 2006 to 2008, during which China rose from 46th to 26th in the green economy complexity ranking globally (Figure 2), indicating that the diversification of the green export basket is closely related to the increase in green production capacity.
The evolution of the average density of green products (Figure 3b) reveals that the average density of green products is closely related to the acquisition of products with comparative advantages. China’s average density of green products was consistently high and increased constantly. By definition, product density represents the closeness of products to local production capacity. The higher the product density is, the more similar the local production capacity required for the transfer of comparative advantage. This also explains the internal reasons for the rapid diversification of green industries in China in recent years. In contrast, among the V4 countries, the average density of green products was high in the Czech Republic and Poland and low in Hungary and Slovakia, and the degree of accumulation of products with comparative advantages exhibited similar trends. Since the average density of V4 countries did not increase significantly, the characteristics of green diversification were not obvious.
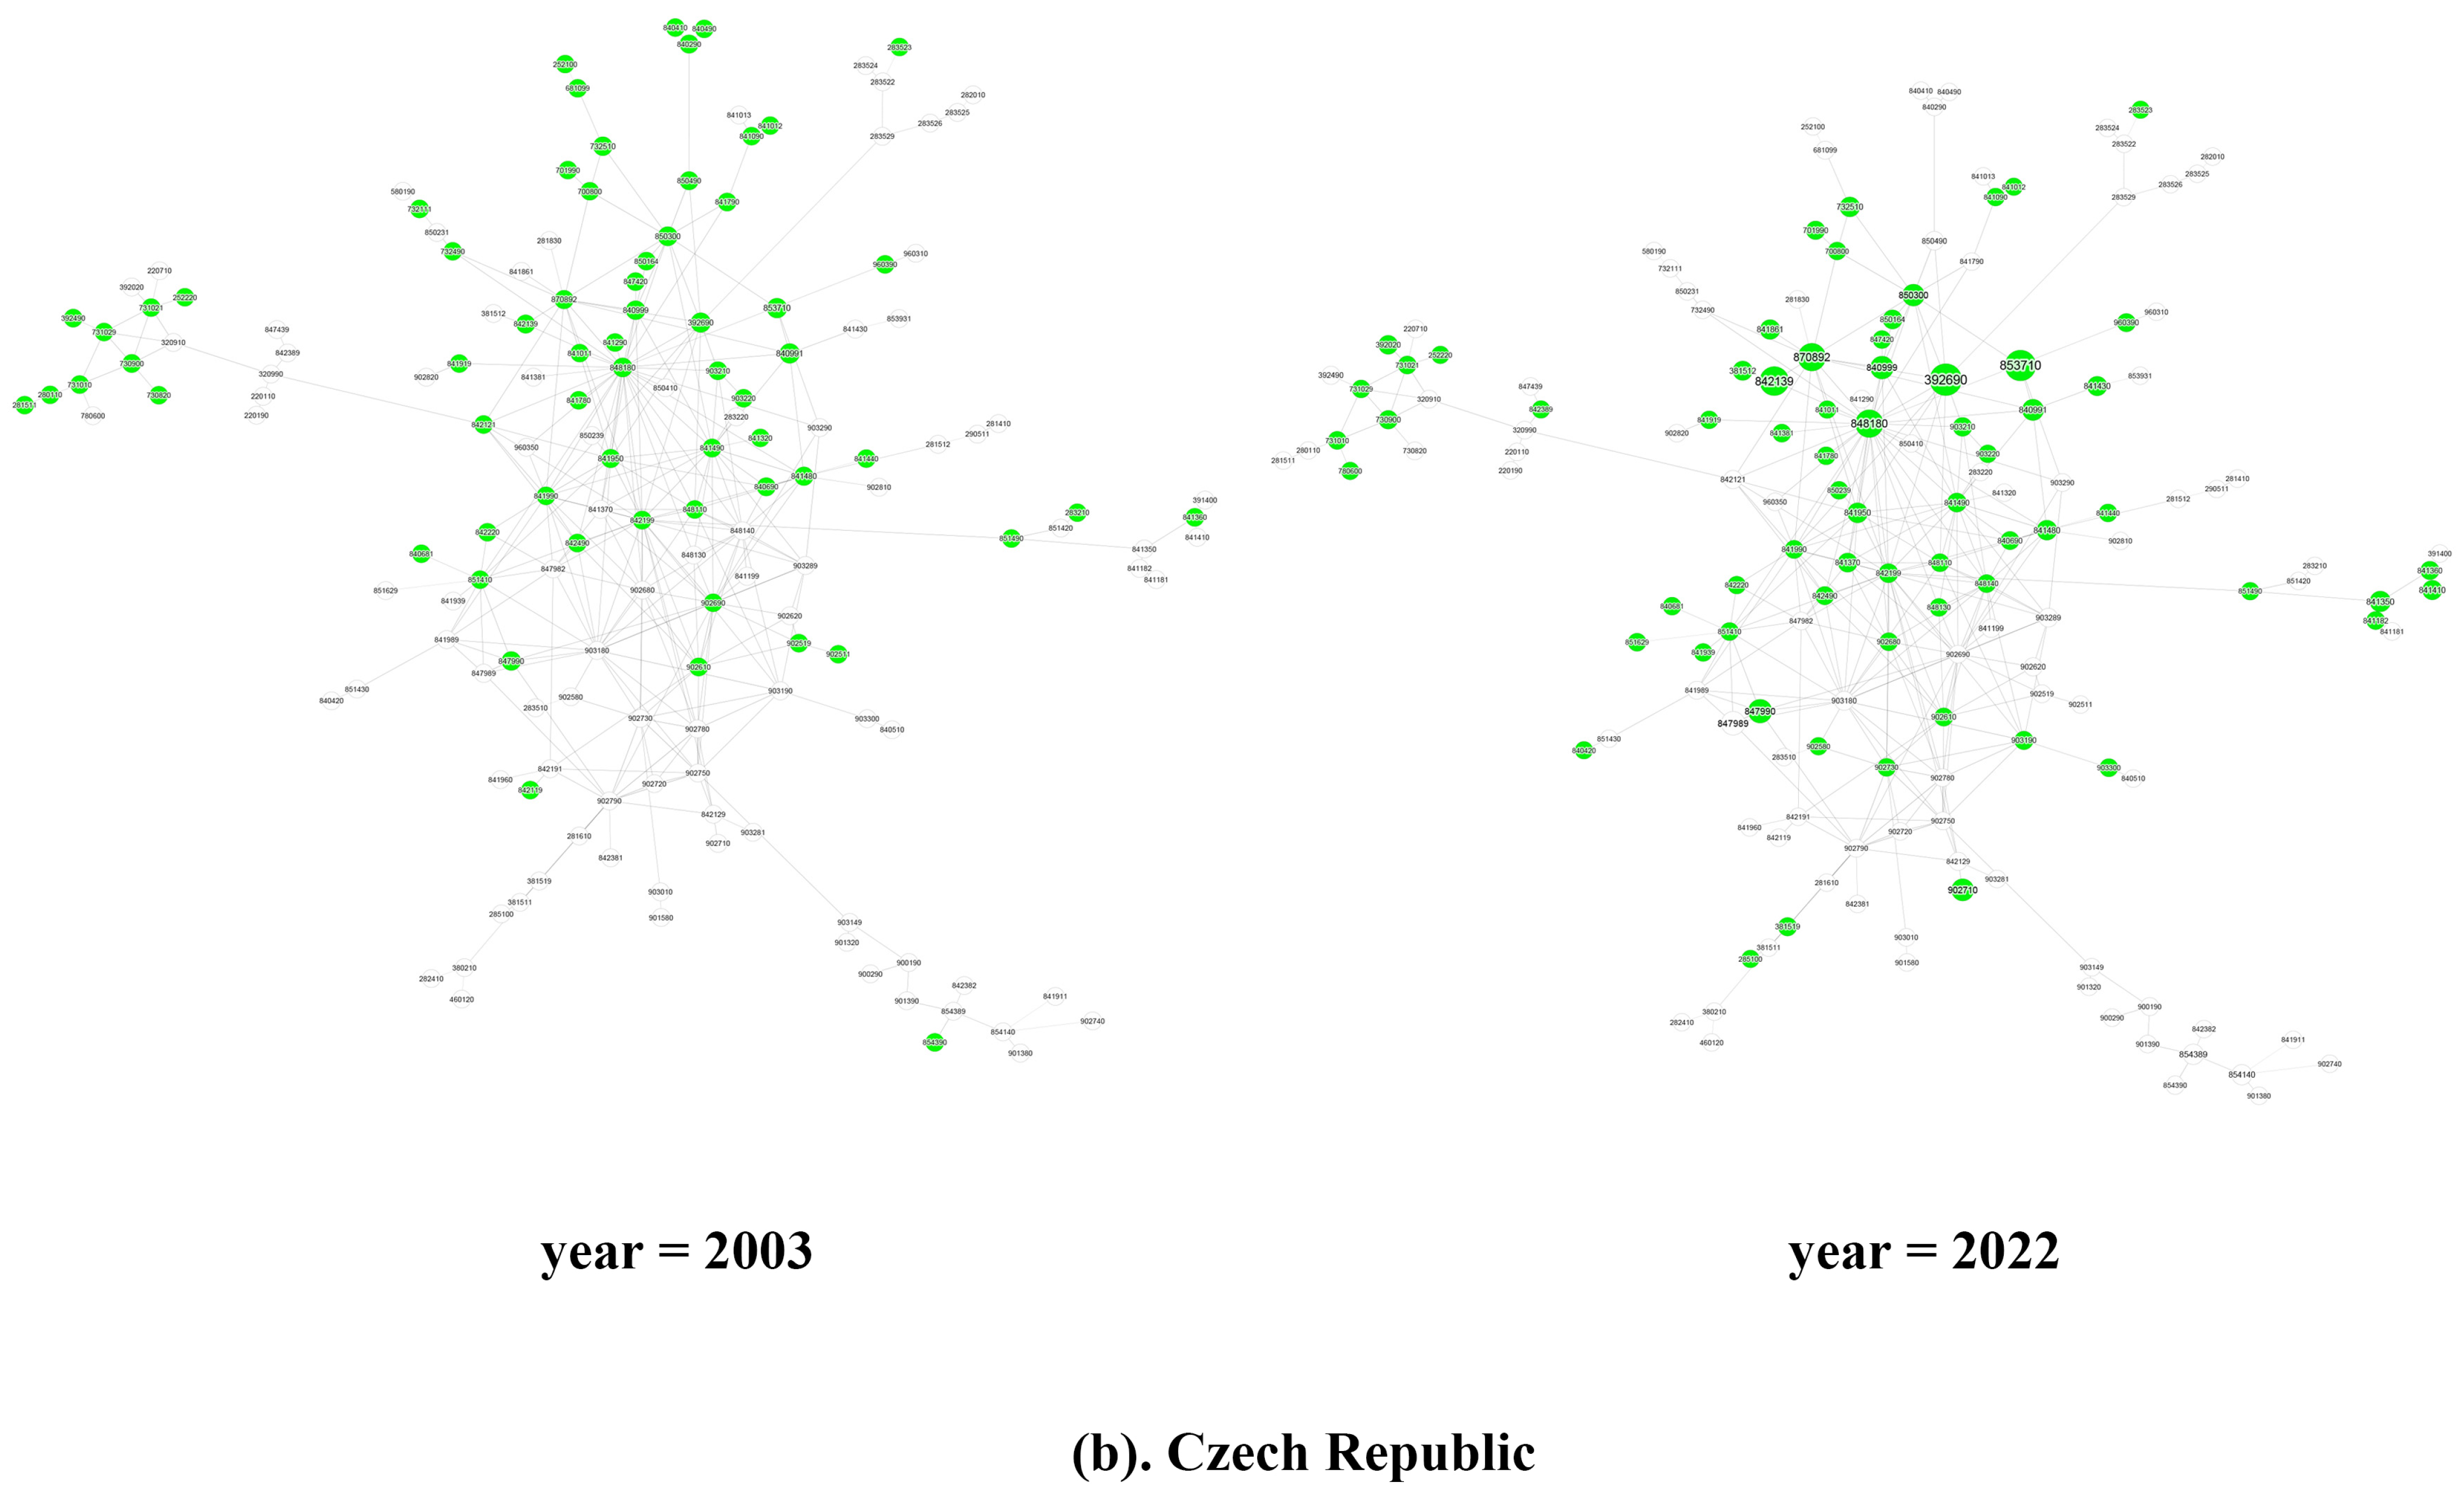
Furthermore, the reasons for the differentiated development of green industry between China and the V4 countries are explored based on the network spatial distribution and evolution characteristics of green products. According to the results of matrix operations, a network evolution diagram of the green product space in China and the V4 countries is constructed to visually display the structure and dynamic evolution of the product space.
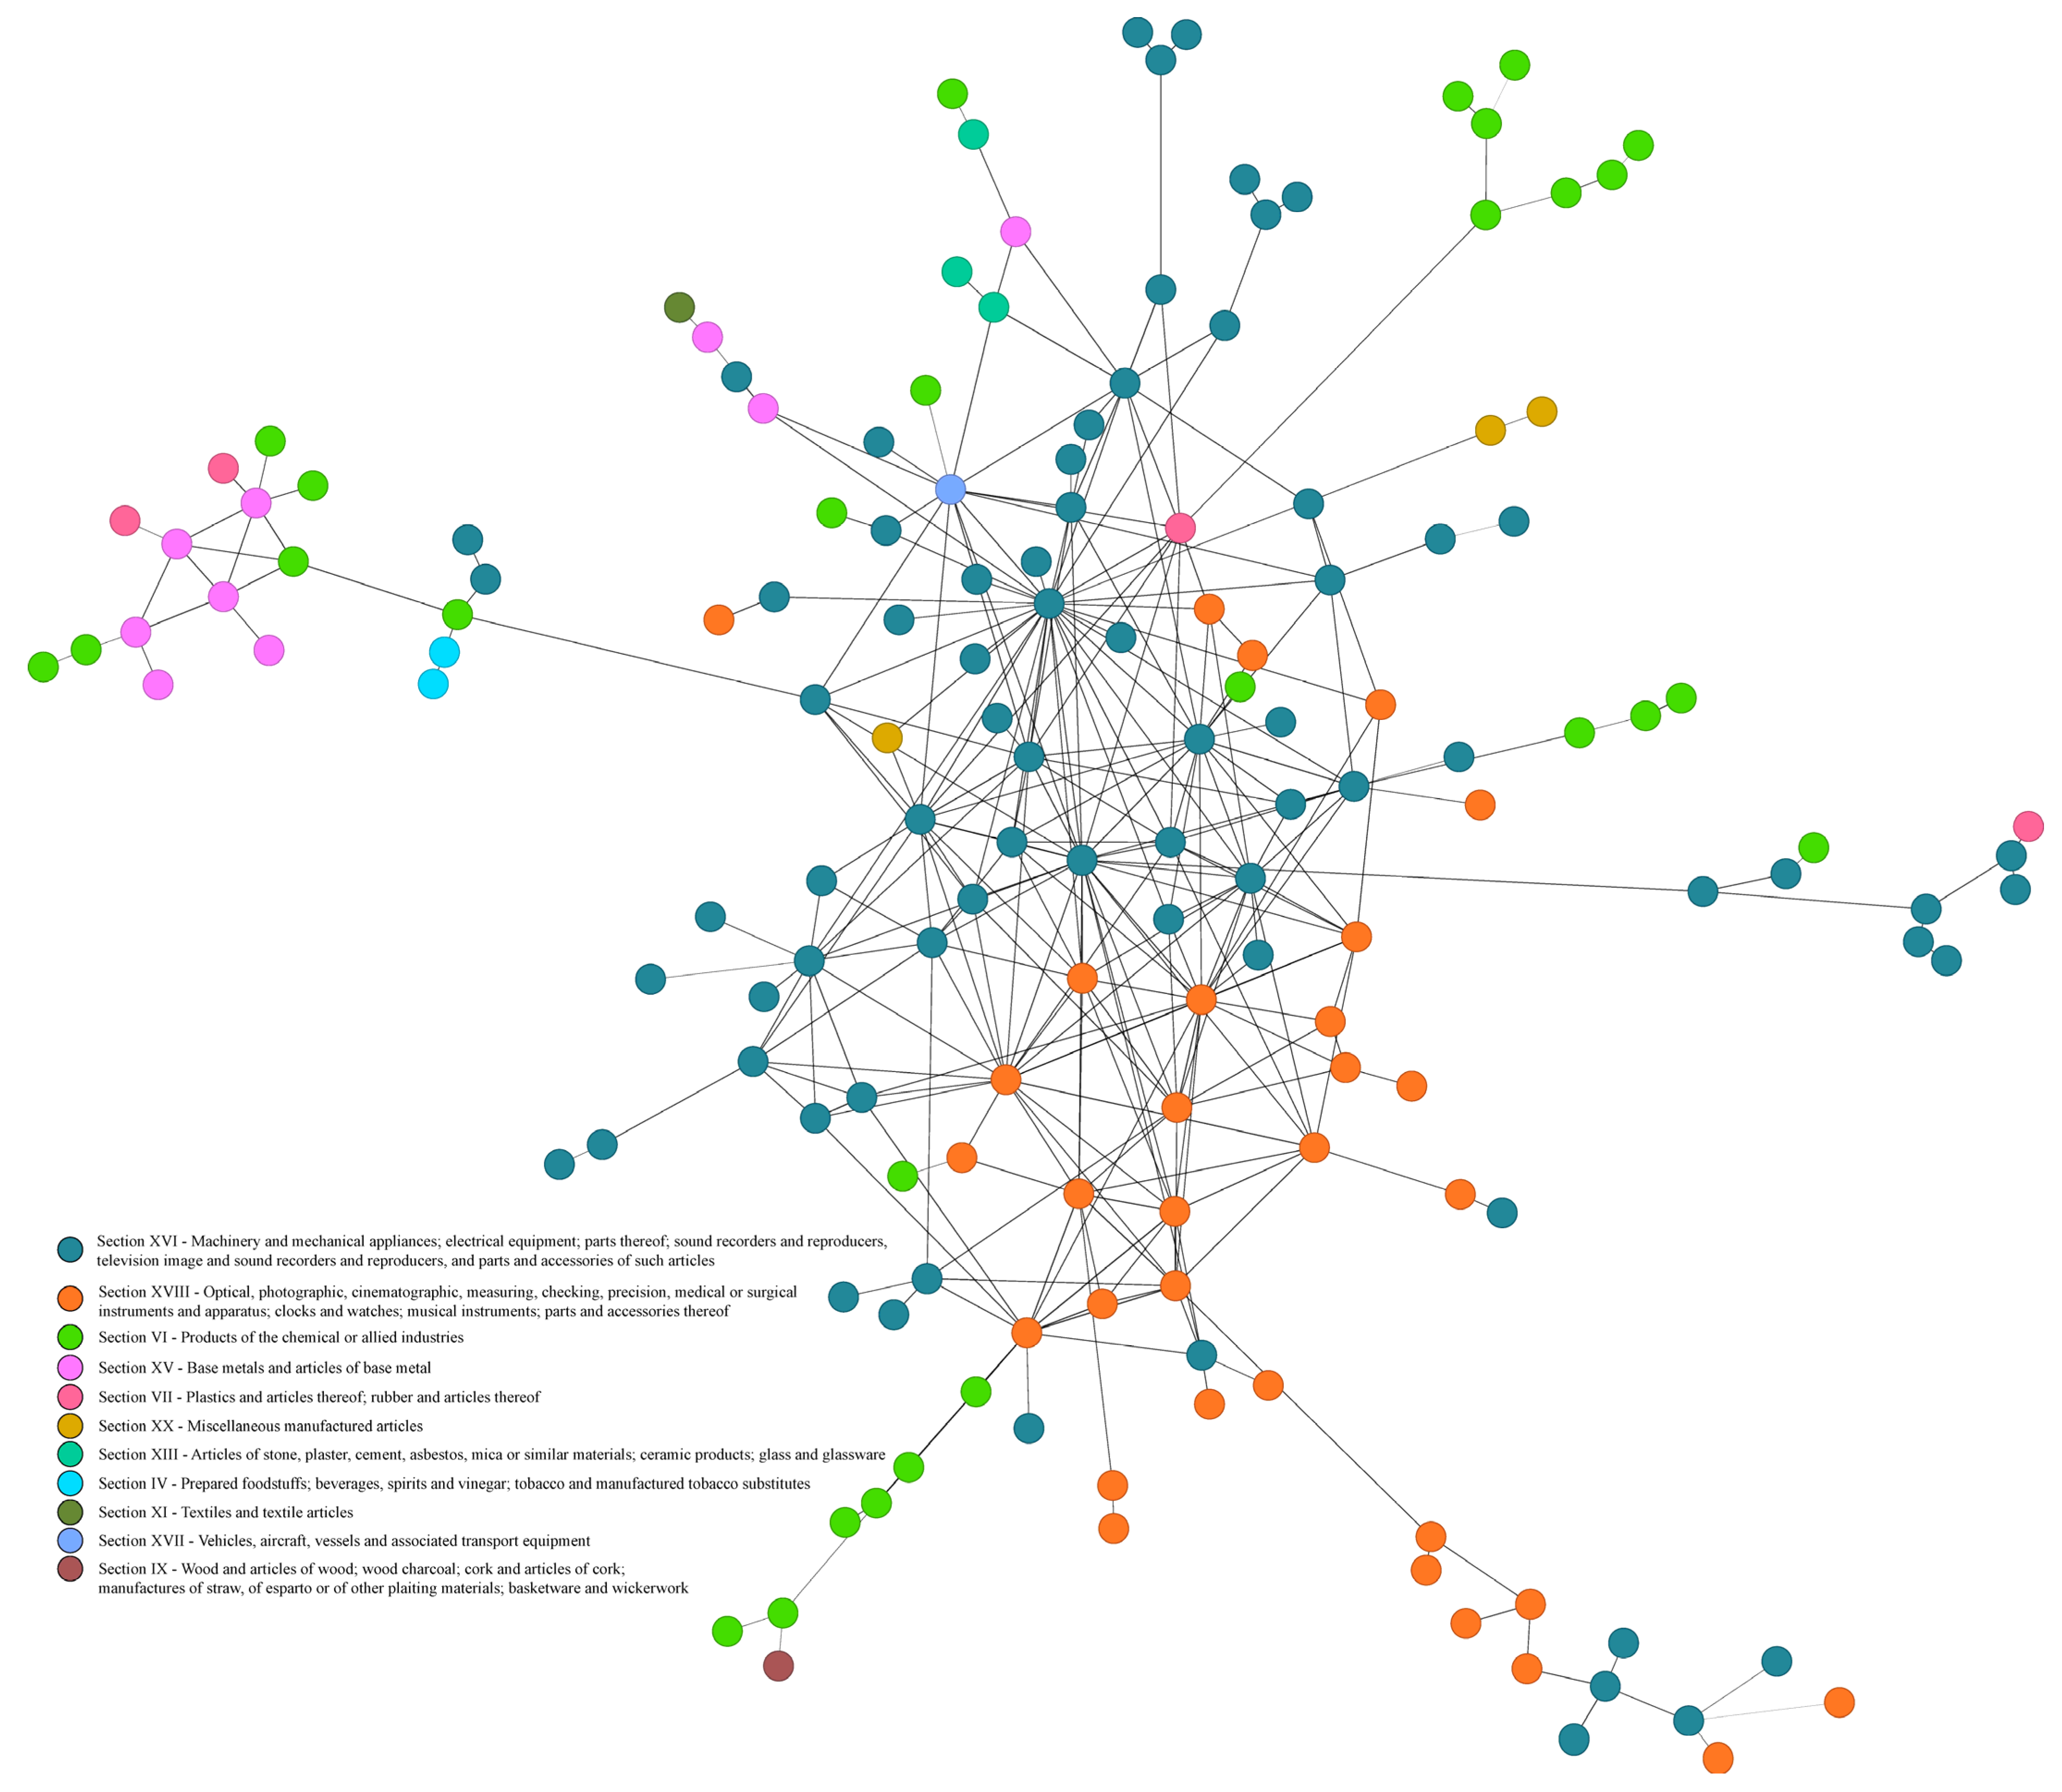
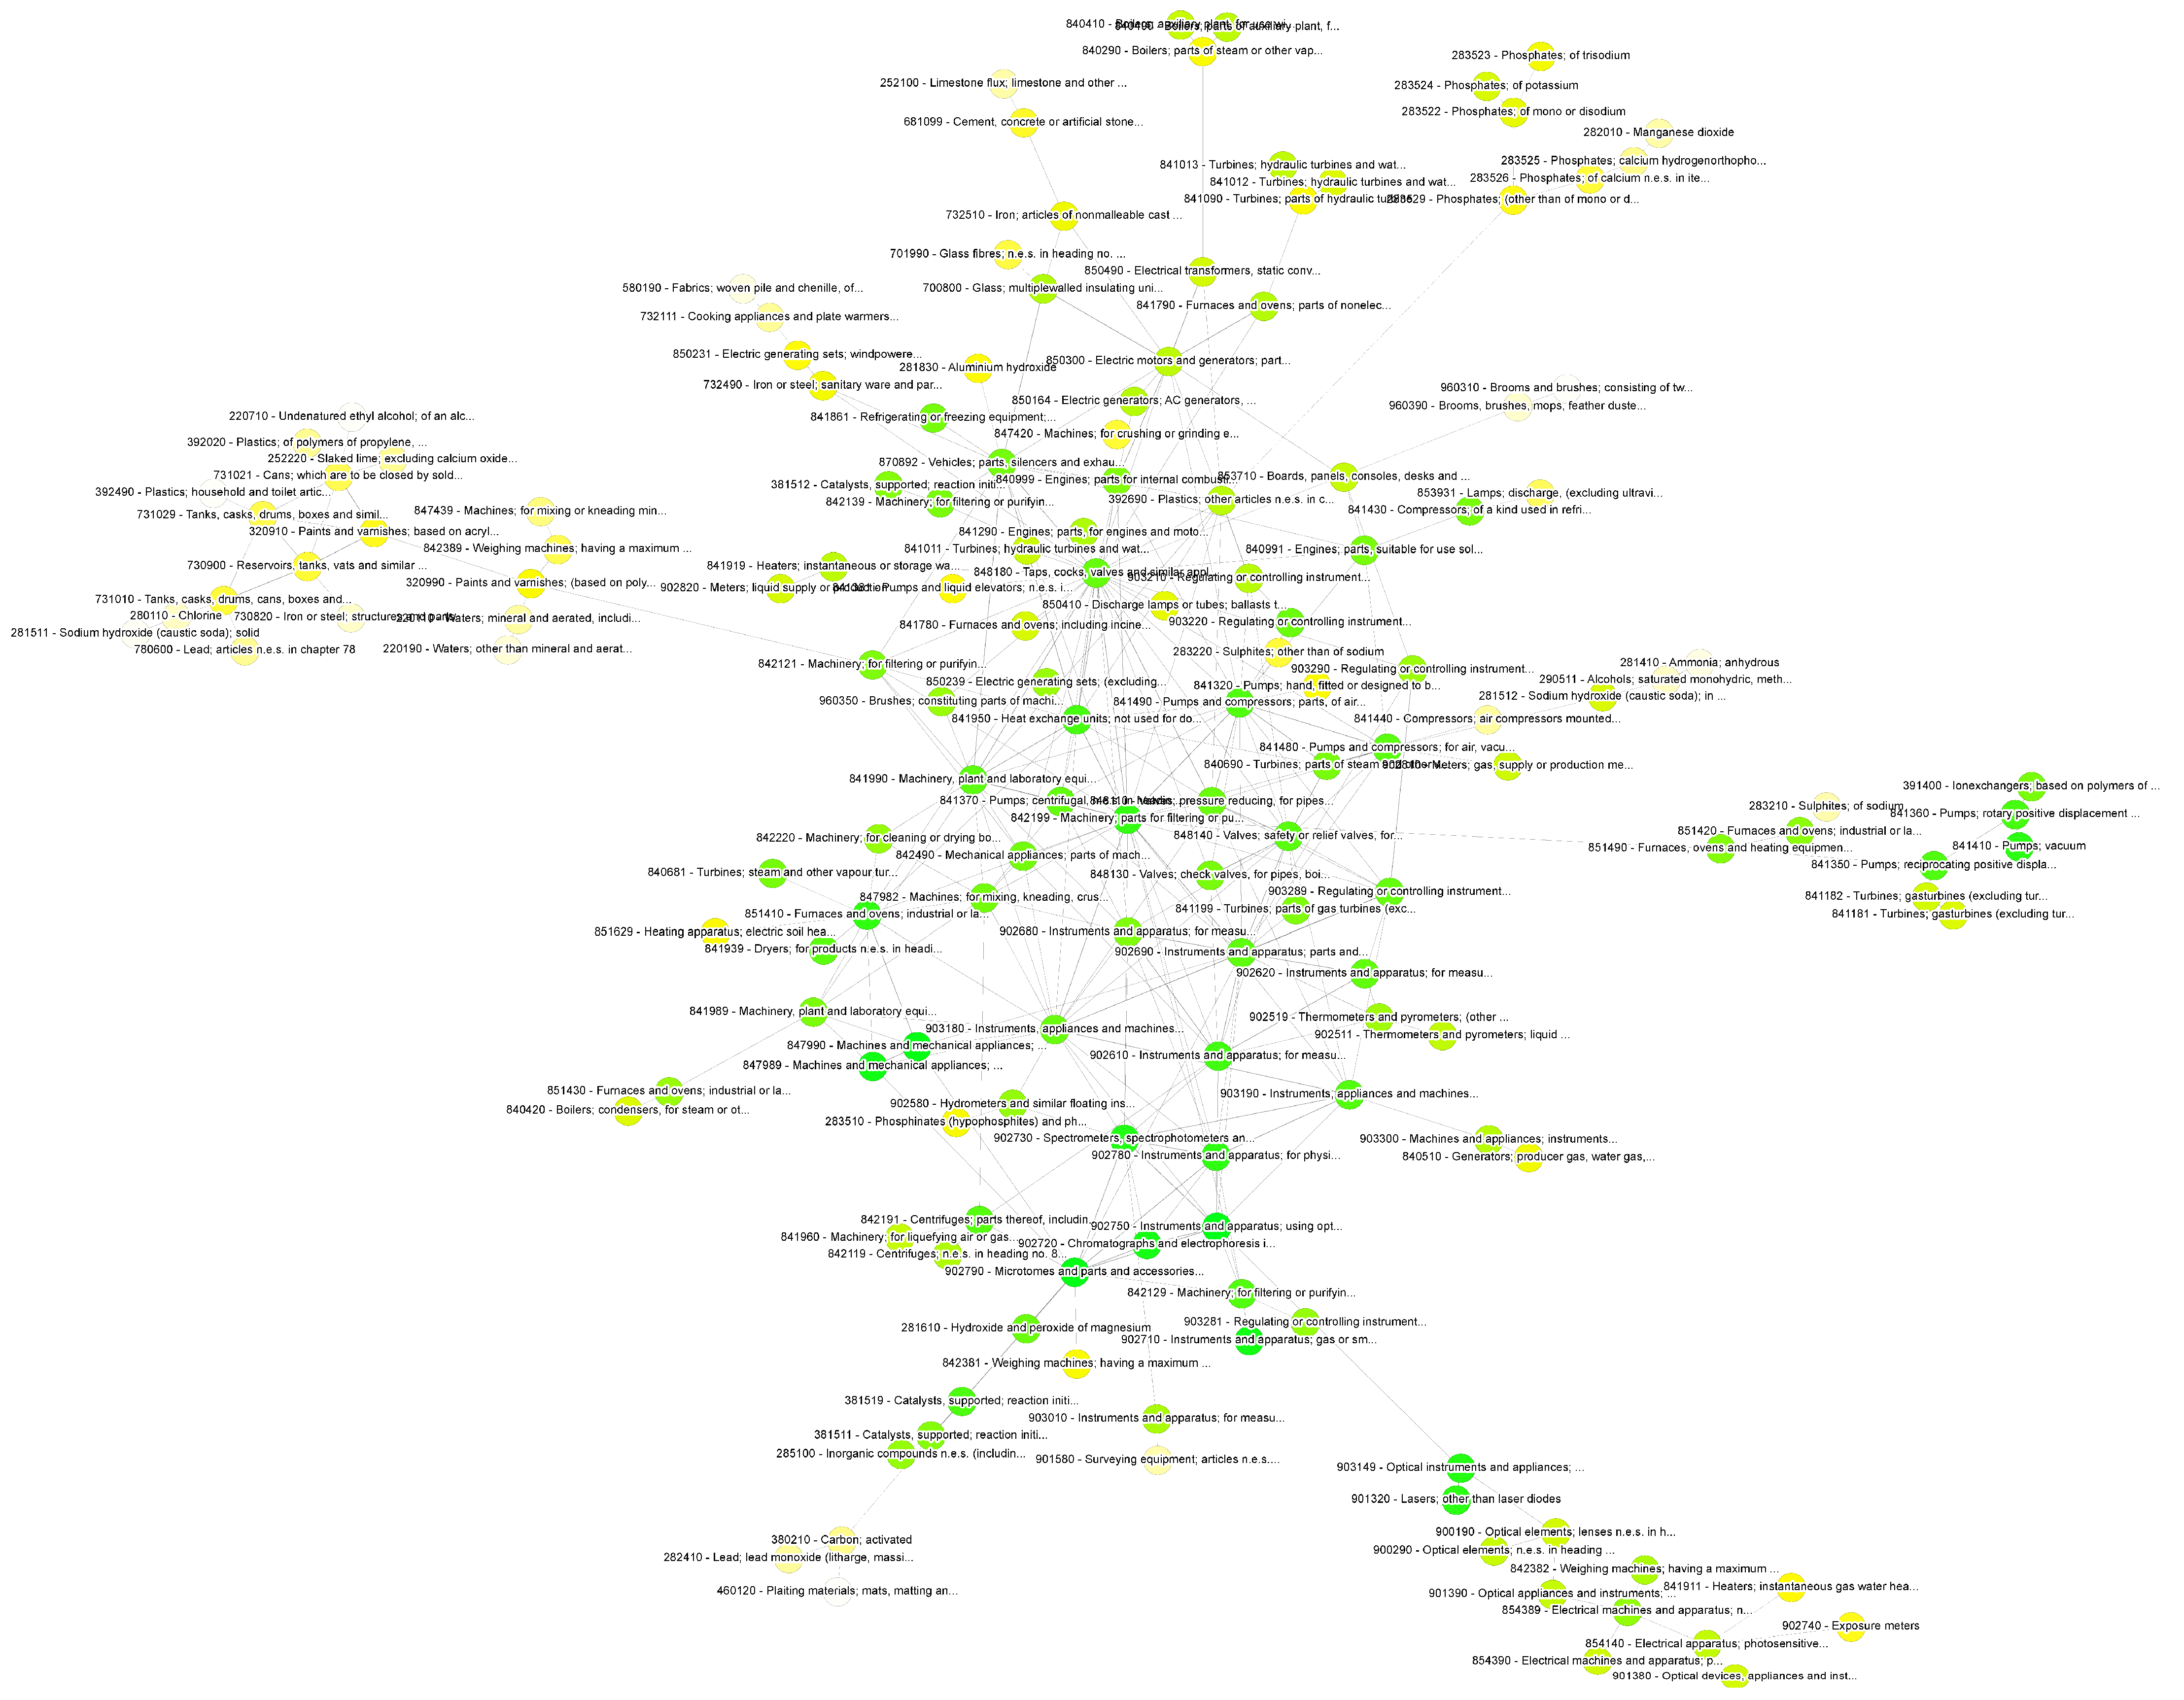
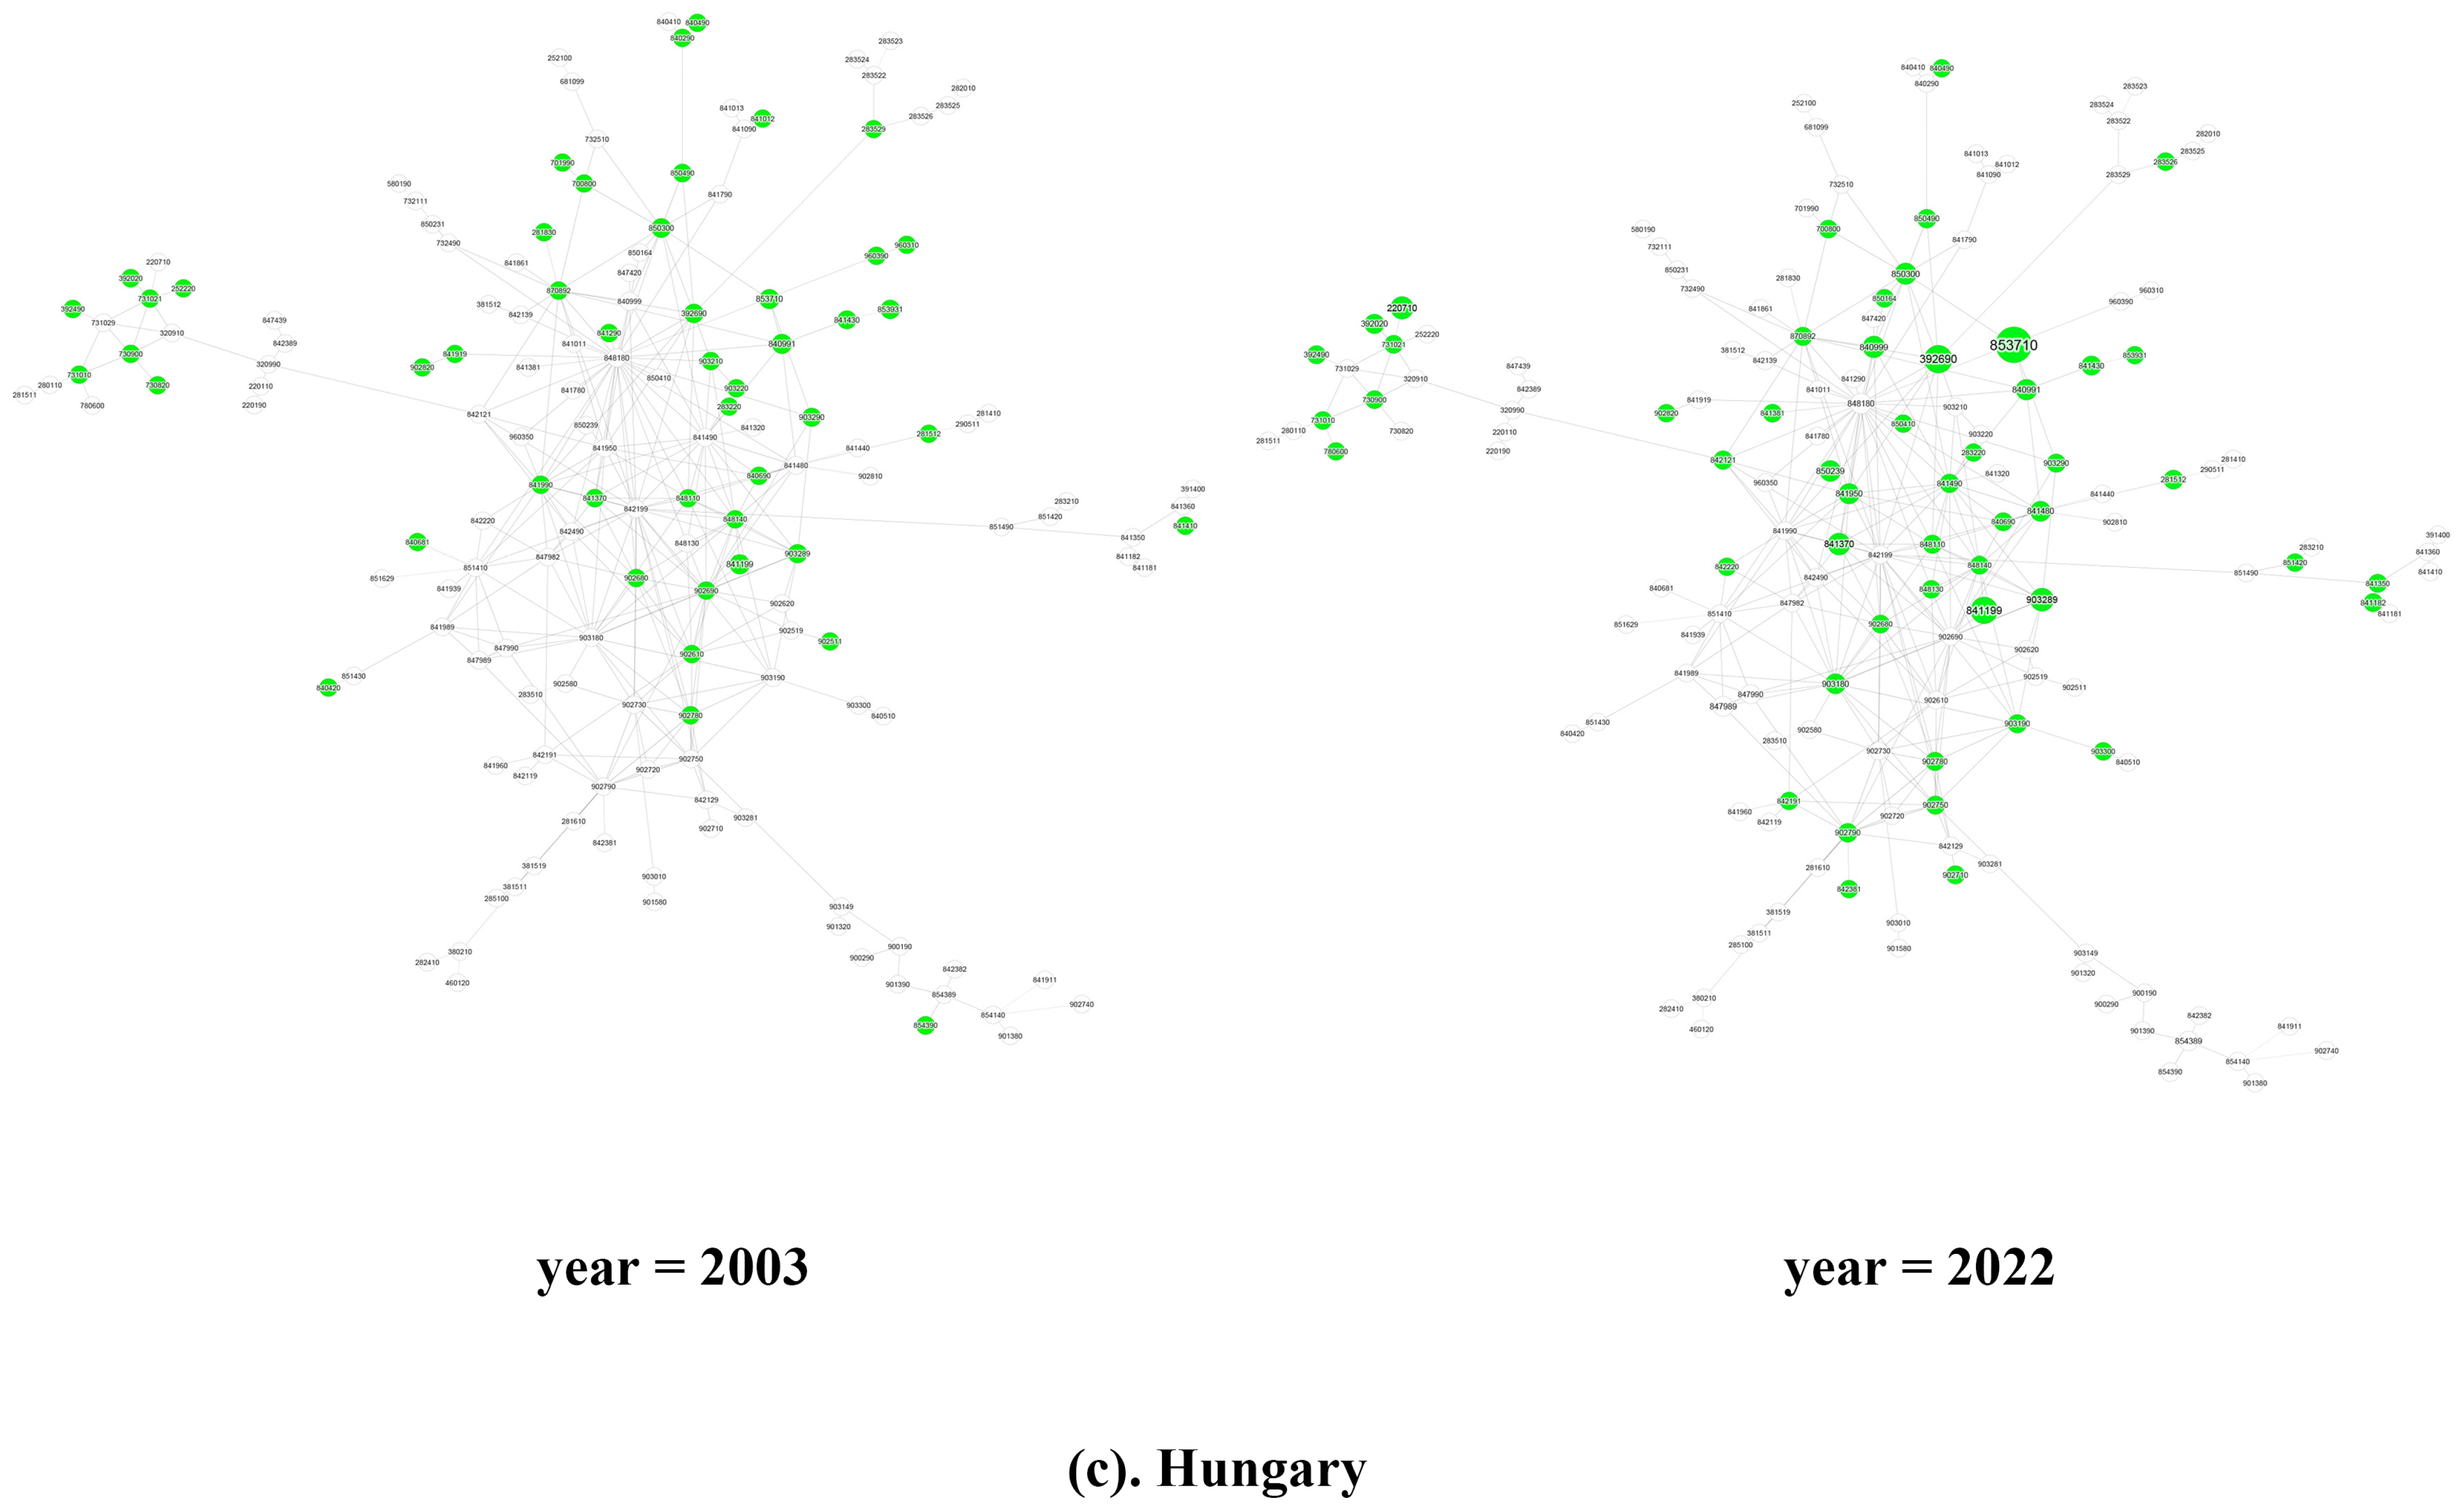
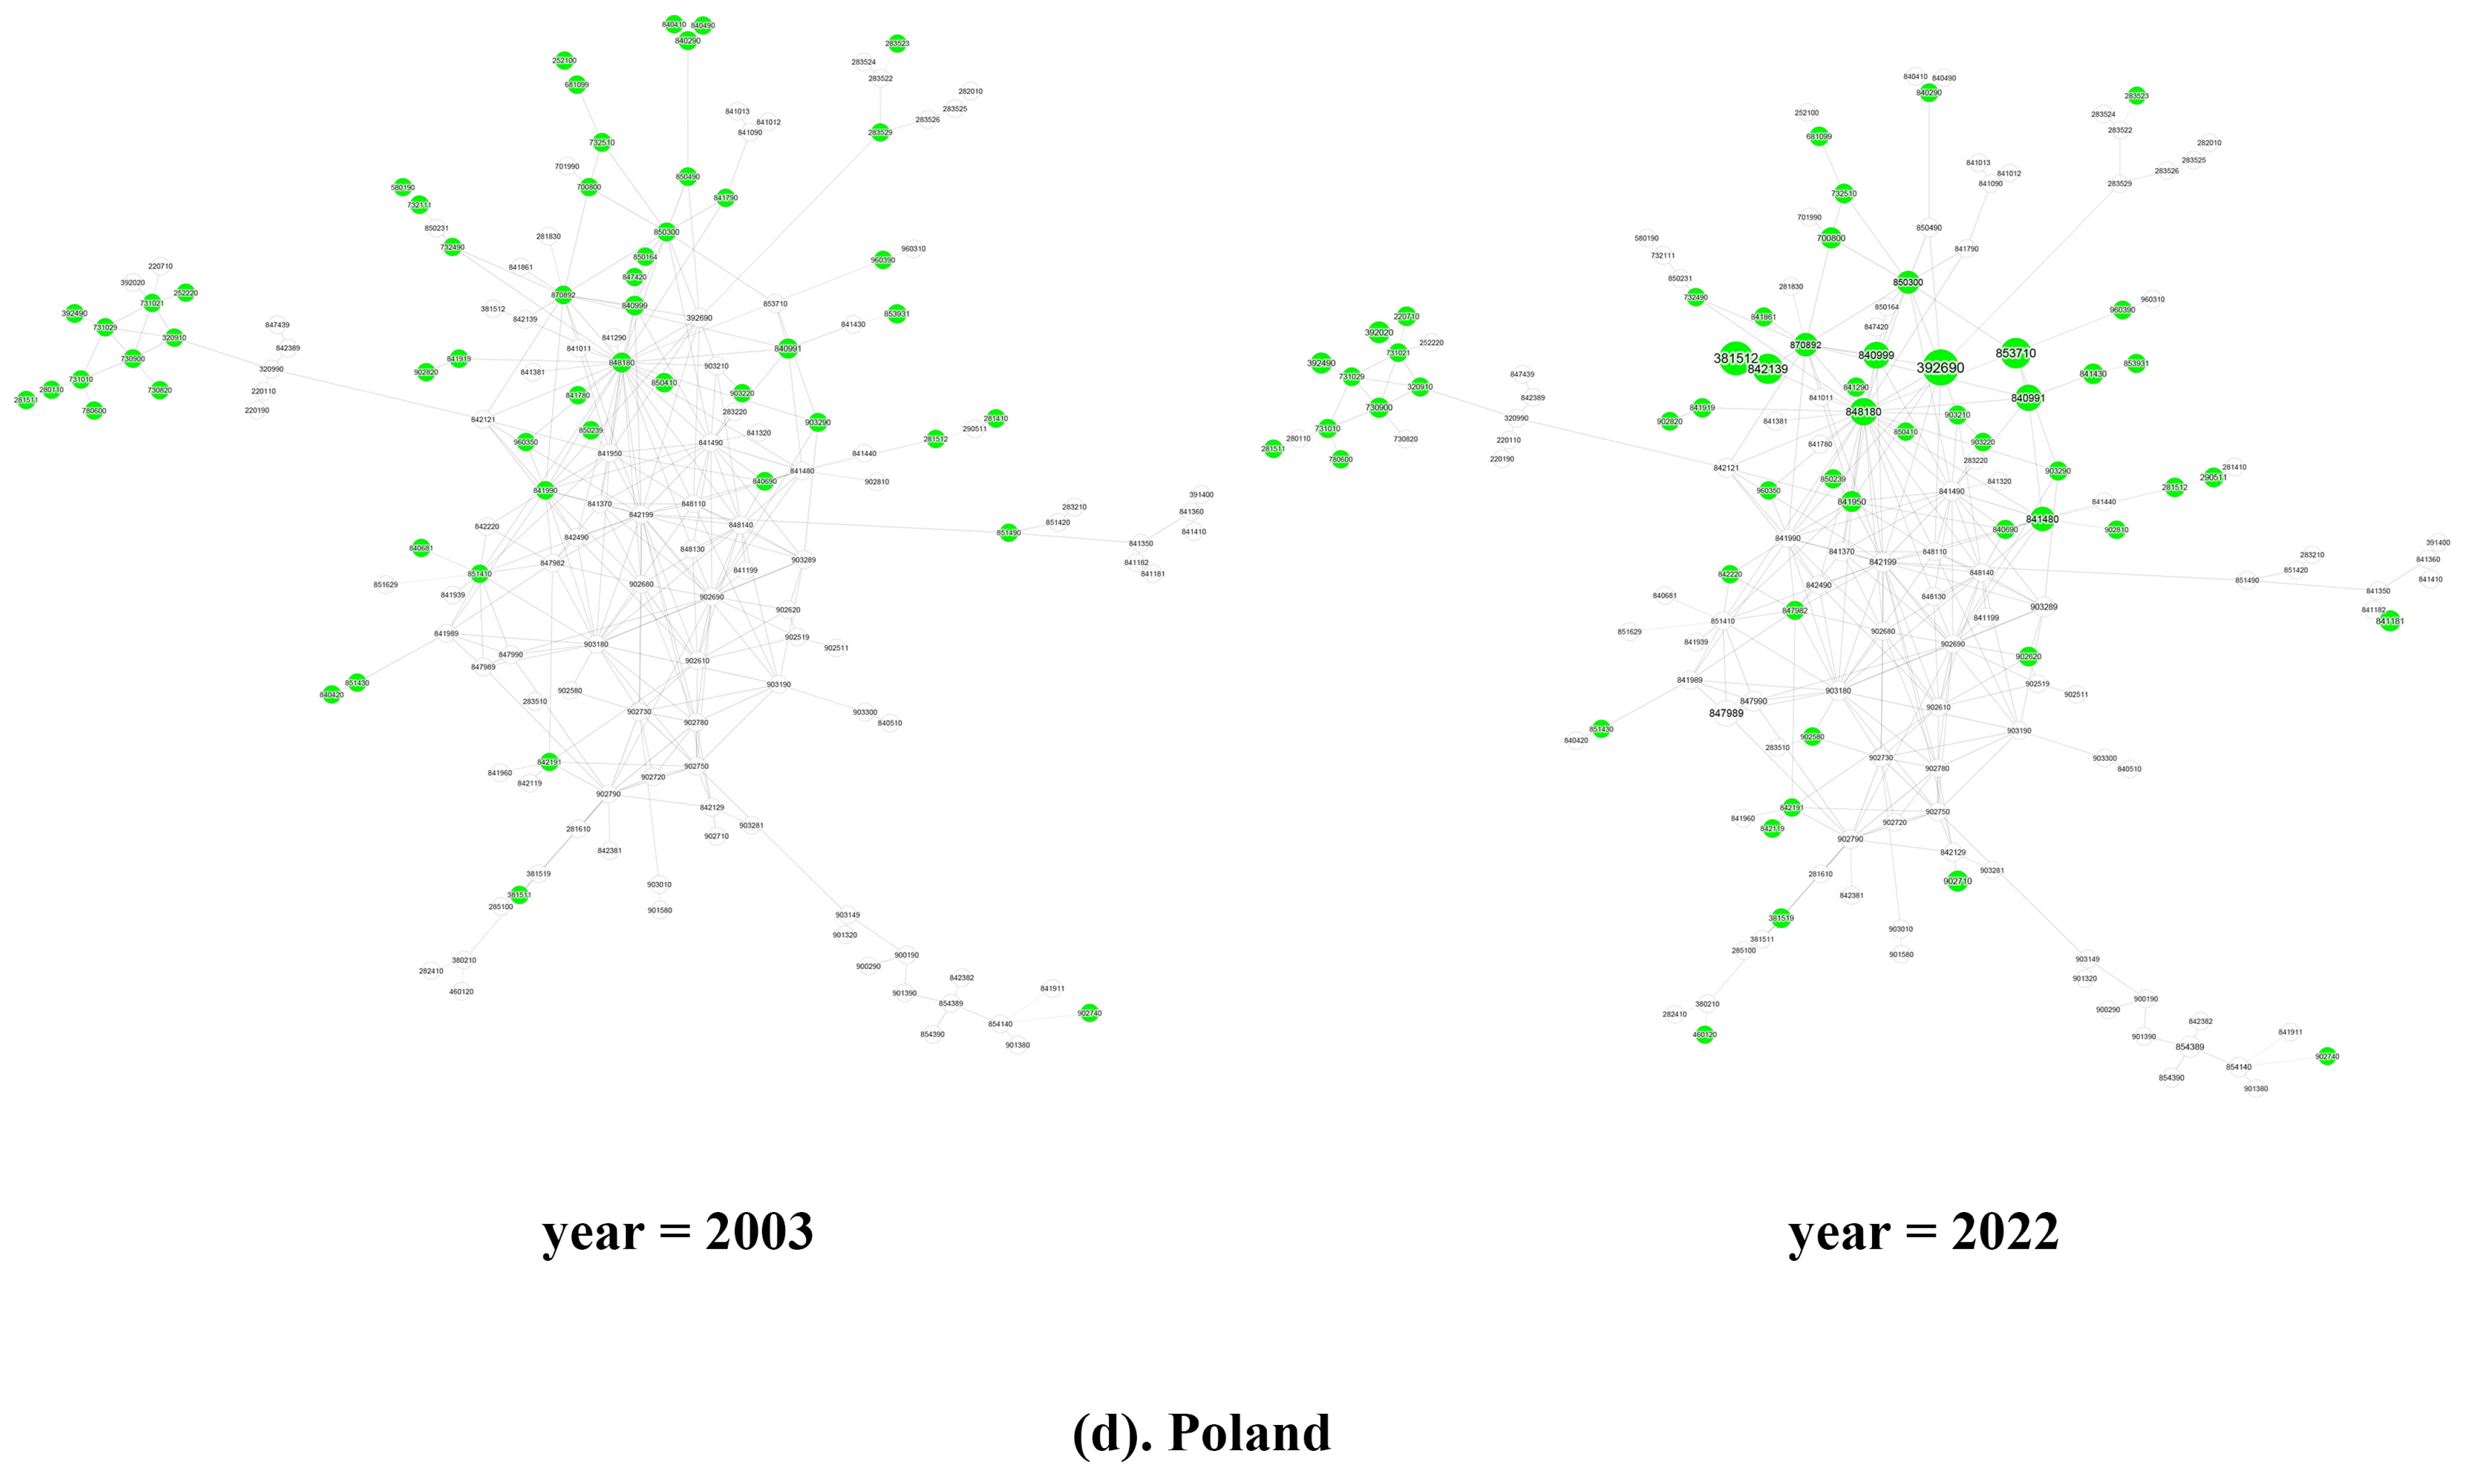
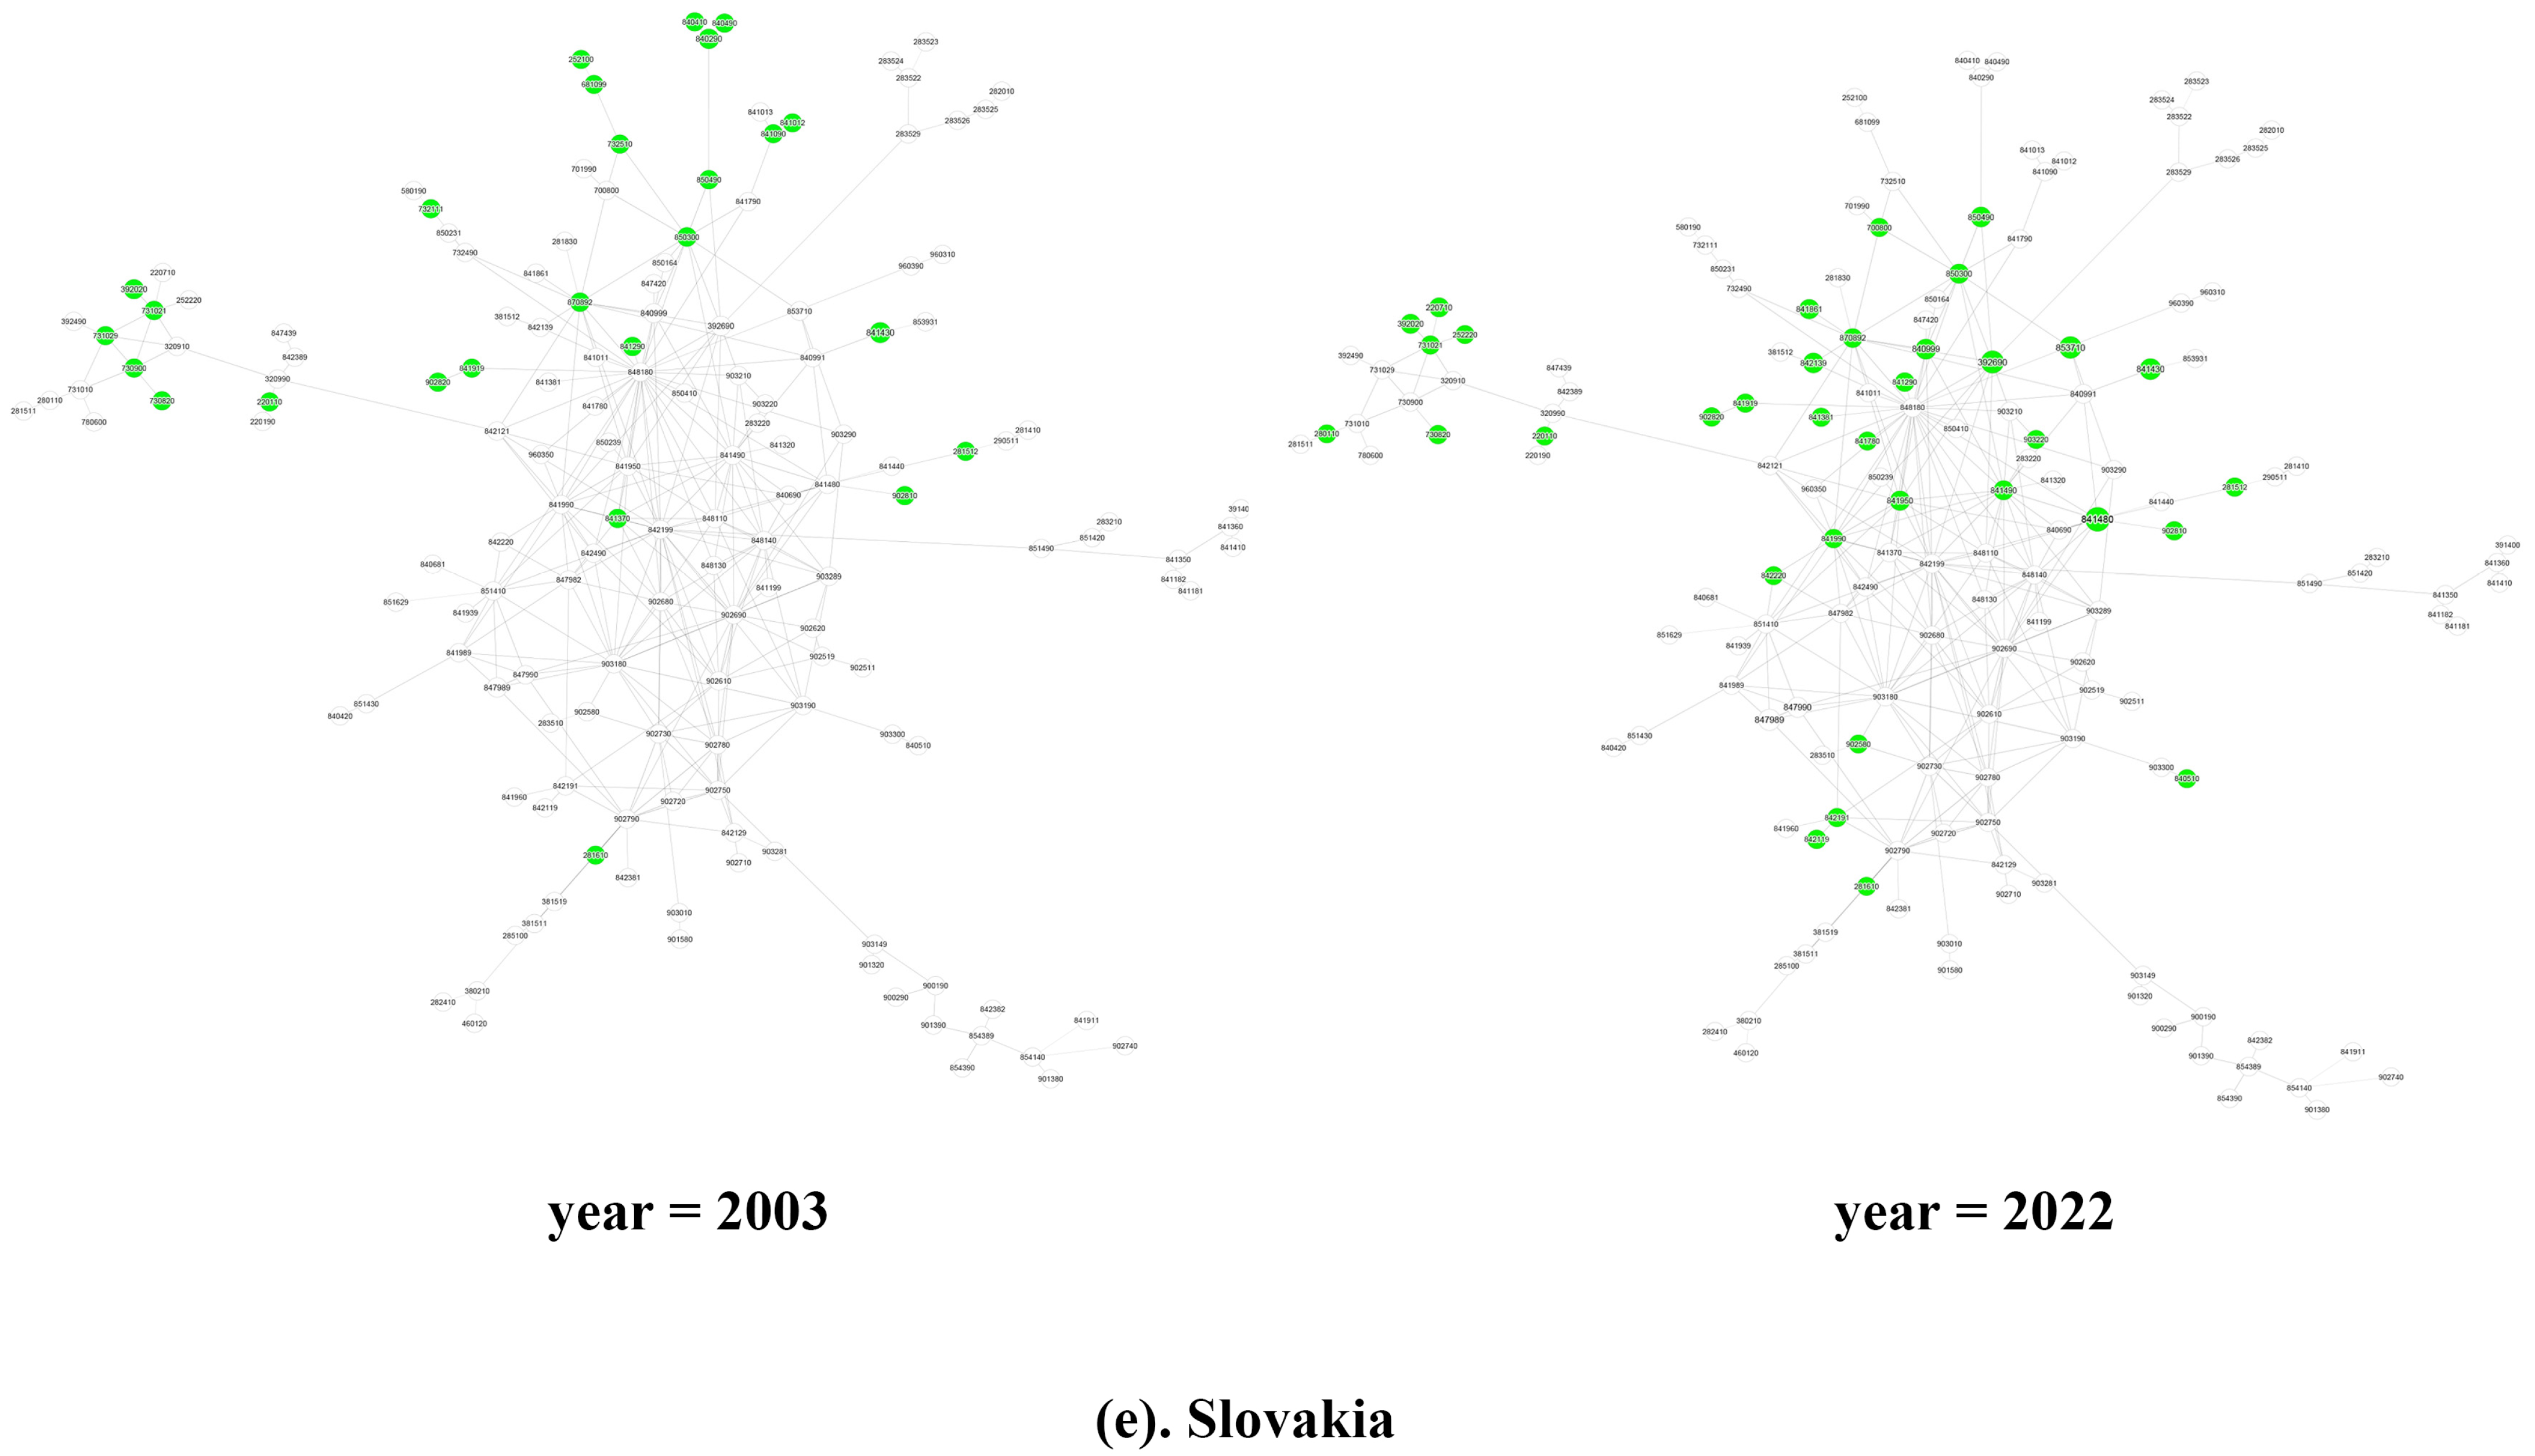
The distribution of products in the green product spatial network diagram presents a clear “core–periphery” structure (due to space limitations, see Appendix B for details). Distributed in the core area are mainly green products under the categories of “Section XVIL: Machinery and mechanical appliances; electrical equipment; parts thereof; sound recorders and reproducers, television image and sound recorders and reproducers, and parts and accessories of such articles” and “Section XVIII: Optical, photographic, cinematographic, measuring, checking, precision, medical or surgical instruments and apparatus; clocks and watches; musical instruments; parts and accessories thereof,” which are of high complexity. The peripheral areas contain green products of low complexity, such as primary chemical products, base metal products, and wood products. As shown in Figure 4, overall, the evolution of the green industry in China and V4 countries showed path dependence, characterized by the evolution of comparative advantages along the shortest path to the core area of the product space, on the basis of the initial product space.
Looking at individual countries, as illustrated in Figure 4, in 2003, most of China’s green products with comparative advantages were distributed in the periphery of the product space (see Figure 4a). Among them, HS901380 other liquid crystal display panels (Section XVIII, PCI = 0.586) located in the lower right corner and HS392690 other plastic products (Section VII, PCI = 0.718) in the core area were the two products with the largest export volume in 2003. These were close to or directly related to the two products with the highest complexity among the export products in that year, HS 854389 other single-function motors and equipment (Section XVI, PCI = 0.983) and HS848180 other valves in (Section XVI, PCI = 1.184). In 2022, the evolution of the structure of China’s green product space also included a significant trend of rapid growth in the export volume of advantaged products. In the lower right corner of the product space, the export volume of HS854140 other photosensitive semiconductor devices including solar cells (Section XVI, PCI = 0.681), located between HS901380 and HS854389, increased rapidly, which was closely related to the continuous accumulation of international competitive advantages through technological innovation in China’s solar photovoltaic industry, improving photoelectric conversion efficiency and reducing costs in recent years. The core area continued to revolve around HS392690 and HS848180, with the emergence of new growth points of competitive advantage, such as HS853710 electronic injection ignition program controllers (Section XVI, PCI = 0.666).
V4 countries are geographically closer to each other than they are to China, and their industrial structures and evolution patterns are similar, as shown in Figure 4b–e. For example, China is located in the lower right region of the green product space, where a large number of optical products are concentrated, occupying an absolute competitive advantage, while V4 countries generally do not have comparative advantages in this area. In addition, during the evolution of the V4 countries towards the core area, the competitive advantages of their peripheral industries are constantly disappearing. The underlying reason may be the transfer of low-complexity industries or the elimination of backward production capacity.
According to Figure 2, the Czech Republic and Hungary are the V4 countries with high green economic complexity, as their comparative advantage products highlighted in the green product space are mostly concentrated in the dense core region. The Czech Republic has the best green production capacity endowment among the V4 countries. Over the 20-year period, the Czech Republic continuously eliminated various green products made of plastics, chemicals, and base metals located at the periphery of the product space and made breakthroughs in environmental monitoring, analysis, and assessment equipment, such as HS902710 gas or smoke analyzers (Section XVIII, PCI = 1.649) and HS902730 spectrometers (Section XVIII, PCI = 1.572). Compared with the Czech Republic, Hungary was limited by its initial industrial endowment and thus consistently failed to gain a comparative advantage in high-density green products at the core of the product space, such as HS848180 other valves and HS842199 other parts for filtering and purification devices, limiting its further improvement in green economic complexity.
Poland’s green product spatial structure was more concentrated, with products with comparative advantages located in the upper region of the product space. The higher relatedness of its green products suggests that Poland had a relatively high average density of green products, indicating higher potential as the industry continues evolving. Over the past 20 years, Poland has gradually phased out low-complexity green products, including HS730820 steel towers and lattice masts; HS732111 base metals and their products, such as household stoves that use gas fuel; and chemical industrial products, such as HS280110 chlorine, HS252100 limestone flux, and HS252220 slaked lime. Poland also made breakthroughs in gaining comparative advantages in complex products, such as HS841950 heat exchangers, HS841480 other air and gas compressors, and HS842139 other exhaust filtration and purification devices for internal combustion engines.
The most complex product in which Slovakia was advantaged in the early stage of evolution was HS841370, other centrifugal pumps (Section XVI, PCI = 1.212). Although this product lost its comparative advantage in 2022, Slovakia developed more complex green products nearby, such as HS841950 heat exchangers (Section XVI, PCI = 1.352) and HS841990 parts for water heaters (Section XVI, PCI = 1.241). Compared with other V4 countries, Slovakia, owing to the distribution of its comparative advantages at the periphery of the product space, had a relatively weak green industry base and underwent a relatively slow industrial upgrading process.

5. Discussion

5.1. GCPs of China and V4 Countries

GCP was used to calculate the average relatedness density of a country’s green products that currently lack international competitiveness to assess the growth potential of the country’s green production capacity in the future. A comparison of Table 2 and Figure 2 shows that China consistently ranked first in the world in terms of GCP, indicating that China currently has the highest green growth potential worldwide. Correspondingly, China’s GCI has increased significantly over the past 20 years.
Among the V4 countries, the Czech Republic and Poland have the highest GCP. In the green energy transformation process of V4 countries, only the Czech Republic achieved a medium to high level of sustainable development (Kochanek [36]). A comparison of Table 2 with Figure 2 shows that the Czech Republic’s GCI steadily climbed from 12th to 8th place over the past 20 years, making it the leader in green transformation among the V4 countries. Kulhanek, et al. [43] similarly pointed out that the Czech Republic prioritizes investment in renewable energy, a green labor market, and electric transportation infrastructure, such that among the V4 countries, it is best positioned for transitioning to a green economy. In contrast, Poland fell from 18th to 23rd place in the GCI rankings over the past 20 years. According to the analysis in Section 4.3, Poland’s green product space is concentrated in the upper region. With the elimination of resource-based products at the upper periphery, it is difficult for core technologies to diffuse, potentially leading to “technology lock-in” instead.
The GCPs of Hungary and Slovakia were lower than those of China and other V4 countries. As shown in Section 4.3, Hungary was constrained by its initial industrial endowments and consistently failed to gain a comparative advantage in high-density green products HS848180 and HS842199 at the core of the product space, showing a decrease in its growth potential. Misztal and Kowalska [44] found that the number of green enterprises in Hungary in 2020 was slightly lower than that in 2008 and that the determinants of green entrepreneurship in Hungary were depleting relatively quickly and were insufficient to maintain continuity in the future, leading to a long-term decline in potential. Although the industrial upgrading process in Slovakia is slow, Slovakia is rich in renewable resources and natural resources, such as wood, mineral water, water resources, hot springs, and agricultural products [40]. These products are often located at the periphery of the product space. As these resources can be actively used for eco-innovation in the business environment and promote green transformation, the advantaged products are gradually moving towards the dense core region, resulting in a corresponding improvement in GCP.

5.2. Similarities in Green Exports and Potential Between China and V4 Countries

As shown in Table 3, China’s export of competitive green products was most similar to that of the Czech Republic, followed by Poland, Hungary, and Slovakia. Considering that the highest SGP values between China and the V4 countries are still less than the mean value of 0.5, there remains significant room for cooperation in green exports between the two sides. Within the V4 countries, the similarity of competitive green products between Hungary and Poland reached 0.5, indicating a high export competition. In addition, there was a certain degree of export competition between the Czech Republic and Hungary, as well as between the Czech Republic and Poland. Therefore, geographic proximity determines, to a certain extent, the similarity of industrial structures and the intensity of export competition among the V4 countries. Considering the SGPD, the similarity of products with potential competitive advantages between China and the V4 countries was less than 0.21, indicating broad prospects for future cooperation in green trade between the two parties. There was significant potential for green competition between the Czech Republic and Poland, as well as between the Czech Republic and Slovakia, among the V4 countries.
Furthermore, a distance heatmap (Figure 5) was used to visualize the complementarity of the green industrial structures and potential future competitive advantages between China and the V4 countries. It reveals the potential for cooperation in the green industry between China and the V4 countries, providing a strong basis for future technology and trade cooperation in the green industry between the two parties.
The distribution of product distances reveals the complementarity of green industrial structures between China and V4 countries, which is described as follows: (1) The complexity distribution of China’s green products is already quite comprehensive, and the level of green diversification is in the leading position, but there are not many high-complexity green products with comparative advantages; green products with comparative advantages in V4 countries are concentrated in medium- and high-complexity regions. (2) China has complementary advantages with the V4 countries in low- and medium-complexity regions. For example, the distance heatmap of green products such as HS841440 air compressors mounted on the trailer chassis (PCI = −0.423) shows that, owing to their limited production capacity endowment, Poland, Hungary, and Slovakia are unlikely to include this product in their production systems in the future. (3) In high-complexity regions, we can similarly explore opportunities for industrial complementarity with V4 countries for products with comparative advantages. For example, Poland is far from having a comparative advantage in products such as HS841490; hence, technology and trade cooperation in related products can be launched. Our efforts can be concentrated on the products shown in light green in Figure 5, which present less competitive advantage in V4 countries; these include HS902750 other instruments and devices using optical radiation (PCI = 1.736) and HS902790 microtomes and parts of physical/chemical analysis instruments (PCI = 1.719). Such technological innovation can be undertaken with the aim of achieving breakthroughs in independent core technologies. In particular, none of the five countries currently has a comparative advantage in HS901320 other lasers (PCI = 1.515), but China has the shortest distance to gain a comparative advantage. Therefore, China may gain a potential competitive advantage in this product in the future. For products shown in red in the figure, we can seek technical cooperation with the V4 countries that have relevant production capacities. For example, we could jointly develop HS902730 spectrometers and other related products with the Czech Republic; explore the development of products related to HS902780 other physical and chemical analysis instruments and devices with Hungary; and engage in technology and trade exchanges with Poland in products such as in HS841950 heat exchangers, HS381519 other supported catalysts, and HS841350 other reciprocating positive displacement pumps.

6. Conclusions and Implications

6.1. Conclusions

While the theoretical foundations of product space analysis encompass global dynamics [6], our empirical implementation intentionally narrows the geographical focus to Central and Eastern European countries within the China-CEEC Cooperation Framework, specifically concentrating on green industries. This targeted approach facilitates a detailed examination of regional mechanisms for green technology transfer and allows for meaningful comparisons within a coherent policy ecosystem, particularly in the context of the Belt and Road Initiative. Specifically, based on the export data of 142 major countries and regions around the world for the 20-year period from 2003 to 2022, in this study, we calculated the green complexity levels of these countries, constructed a map of the global green product space, compared the differentiated evolutionary paths of green industrial structures between China and the four Visegrád Group countries, and evaluated strategic complementarity space in green industrial upgrading between both two sides. The main conclusions are as follows:
First, the evolution of green industries in China and the V4 countries shows dual differentiation in technological paths and spatial layouts. In the technological dimension, China has experienced a significant increase in its GCI due to technological advancements in the photovoltaic industry, promoting the expansion of green products into the core and forming a technological catch-up with Poland and Slovakia. Within the V4 group, differentiation is evident; the Czech Republic and Hungary maintain their competitiveness by leveraging highly complex products in core industries, whereas Poland faces technological stagnation due to a specialization lock-in, and Slovakia experiences slow development as a result of constraints linked to its initial endowments. In the product space dimension, the spatial distribution of green products in China exhibits a bidirectional evolution characterized by “core expansion” and “marginal strengthening”. Conversely, the V4 countries tend to optimize resource allocation through a model of “marginal elimination” and “core focus”.
Secondly, there exists a strategic co-opetition space in the green industry between China and the V4 countries. In terms of green trade, China has enjoyed a long-term green trade surplus with the V4 countries, with the proportion of its green exports to V4 countries constantly increasing, while the proportion of V4 countries’ green exports to China has declined. In the competitive dimension, the average SGP index among V4 countries significantly surpasses that of China and the overall index of the V4 countries. This indicates that shared geographical proximity results in similar industrial development trajectories within the V4 region. Although this similarity heightens internal competition, the competitive pressure from China remains limited. In the complementary dimension, the two sides exhibit a competitive substitution relationship in low-complexity products while demonstrating structural complementarity in high-complexity sectors. This potential for synergy is corroborated through the SGPD index.

6.2. Insights on Sustainable Cooperation Strategies

Based on the conclusions mentioned above, the following sustainable collaboration strategies, emphasizing differentiated pathways and complementary spaces, are proposed:
(1) Developing a Gradient-Based Path for Industrial Upgrading. Industrial upgrading is often accompanied by the evolution of products with comparative advantages toward the core region in the product space, that is, a transition toward high-end industries with greater complexity [2]. In the short term, countries are recommended to selectively develop “high-density and low-complexity” products to enrich product diversity under the guidance of product space theory. In the medium to long term, countries can focus on the position of “low-density and high-complexity” products in the green product space to reasonably plan the optimal path for products to gain a comparative advantage and thereby achieve a sustainable development of the green industry.
(2) Establishing a Capacity Coordination Optimization Mechanism. China should adopt lessons from the elimination mechanisms applied to peripheral products by the V4 countries under EU industrial restructuring pressures and optimize the allocation of production factors with an emphasis on transitioning towards high-quality development. Different from the case in China, the structural evolution map of the green product space in the V4 countries shows that the competitive advantages of peripheral industries are constantly disappearing in the process of competitive advantage products evolving towards the core region. For example, regarding HS392490 other plastic household ware and sanitary or toilet articles (Section VII, PCI = −1.225), China’s exports increased by 396.29% over the 20 years, while the Czech Republic phased out the backward production capacity of this low-complexity product early on. Consequently, both parties should establish a dynamic assessment system for green productive capacity that transforms the scale effects of their respective advantageous industries into quality effects by reallocating production factors.
(3) Enhancing Joint Research and Development of Core Area Products. It is crucial to monitor the green complementary industries between China and the V4 countries closely and identify new growth points for green trade. The product spatial network diagram visually demonstrates the structural complementarity points in green industries of China and the V4 countries. In addition to complementary products with low complexity in peripheral branches, the growth points located in the dense core region of the product spatial network should receive more attention. For example, other parts of machines listed under HS847990 catalog 84.79 (PCI = 1.714, GDE = 0.466); other high-complexity, high-density products related to Section XVI machines, mechanical apparatus, and electrical equipment, such as HS841950 heat exchangers (PCI = 1.352, GDE = 0.460), and their parts; and HS903149 other optical measuring or testing instruments and devices (PCI = 1.546, GDE = 0.480), found in the complementary areas of photovoltaic-related industries in the lower right region, are potential areas for cooperation between China and the V4 countries. Therefore, both parties can construct an integrated cooperation model encompassing “research, development, manufacturing, and market” collaboration in core intensive areas such as machinery, equipment, and electrical devices with complementary products. Emphasis should be placed on strengthening a mutual recognition of technical standards in the photovoltaic industry and jointly establishing a green technology transfer center in Central and Eastern Europe with emphasis on aligning with EU technical standards (e.g., CBAM) to mitigate barriers to cooperation.
This study employs product space analysis and complexity index tools to examine China’s green and sustainable cooperation strategy with the Visegrád Group. The findings offer valuable insights for providing actionable insights for EU policymakers designing cohesion strategies for V4 green transitions, China-V4 enterprises seeking complementarity in high-complexity sectors, and Belt and Road Initiative (BRI) stakeholders navigating green cooperation under decarbonization trends. Additionally, it offers a decision-making framework based on production capacity endowments that may apply to regional organizations such as ASEAN and the African Union, as well as to China’s cross-regional initiatives under the BRI concerning green capacity cooperation.

6.3. Limitations and Future Directions

This study has two primary limitations. First, while the product space theory’s ex-post analysis of export data captures the combined effects of technological and policy factors, it fails to adequately incorporate structural disruptions from the 2022 Russia-Ukraine conflict on CEE green energy policies, resulting in insufficient geopolitical contextualization. Second, the focus on macro-level trade flows overlooks micro-mechanisms of firm-level innovation. Future research will address these gaps by (1) developing an econometric impact model to quantify dynamic effects of the EU CBAM on V4 green cooperation post-conflict; (2) integrating firm-level case studies to analyze micro-diffusion pathways of green technologies through coupling R&D patents with export data, thereby enhancing policy applicability at the micro-level.

Author Contributions

Conceptualization and methodology, L.Q. and W.G.; formal analysis, Q.C. and X.Z.; writing—original draft preparation, L.Q. and W.G.; writing—reviewing and editing, Q.C. and X.Z.; visualization, L.Q.; supervision and project administration, L.Y. All authors have read and agreed to the published version of the manuscript.

Funding

This work was supported by the Fundamental Research Funds for the Provincial Universities of Zhejiang (Grant number SJWZ2025011), the Zhejiang Province Philosophy and Social Science Planning Project (Grant number 24NDJC067YB) and the Ningbo Philosophy and Social Sciences Planning Project (Grant number JD6-274).

Data Availability Statement

Data are available on request from the authors.

Conflicts of Interest

The authors declare no conflicts of interest.

Abbreviations

The following abbreviations are used in this manuscript:
CEECCentral and Eastern Europe
CBAMCarbon Border Adjustment Mechanism
V4Visegrád Group
GCIGreen Complexity Index
ECIEconomic Complexity Index
GDEGreen product density
SGPSimilarity Green Product
SGPDSimilarity Green Product Development
SDGssustainable development goals
BRIThe Belt and Road Initiative

Appendix A

Table A1. List of environmentally friendly green products.
OECD Environmental ClassificationGreen (Environmental) Product List
A. Pollution managementA1. Air pollution control252100, 252220, 281610, 701990, 840510, 841410, 841430, 841440, 841480, 841490, 841780, 841960, 841989, 842139, 842199, 842490, 851410, 851420, 851430, 851490
A2. Wastewater management280110, 281410, 281511, 281512, 281830, 282010, 282410, 283210, 283220, 283510, 283522, 283523, 283524, 283525, 283526, 283529, 380210, 392690, 460120, 580190, 730900, 731010, 731021, 731029, 732490, 732510, 840420, 841011, 841012, 841013, 841090, 841320, 841350, 841360, 841370, 841381, 841939, 842119, 842121, 842129, 842191, 842381, 842382, 842389, 848110, 848130, 848140, 848180, 902610, 902620
A3. Solid waste management392020, 392490, 681099, 780600, 841790, 842220, 847420, 847439, 847982, 847989, 847990, 851629, 901320, 960310, 960350, 960390
A4. Remediation and cleanup854389, 854390
A5. Noise and vibration reduction840991, 840999, 870892
A6. Environmental monitoring, analysis, and assessment901580, 902511, 902519, 902580, 902680, 902690, 902710, 902720, 902730, 902740, 902750, 902780, 902790, 903010, 903149, 903180, 903190, 903210, 903220, 903281, 903289, 903290, 903300
B. Clean technologies and productsB1. Clean/resource-saving technologies and processes732111, 840290, 840410, 840490, 850410
B2. Cleaner/resource-saving products320910, 320990
C. Resource managementC2. Water supply220190, 285100, 391400
C4. Renewable energy equipment220710, 290511, 730820, 840681, 840690, 841181, 841182, 841199, 841290, 841861, 841911, 841919, 850164, 850231, 850239, 850300, 850490, 853710, 854140, 900190, 900290, 901380, 901390
C5. Thermal energy/energy conservation and management381511, 381512, 381519, 700800, 841950, 841990, 853931, 902810, 902820

Appendix B

Figure A1. Green product spatial network diagram (colored by HS categories).
Systems 13 00508 g0a1
Figure A2. Green product spatial network diagram (colored by product complexity). Note: Light colors represent lower product complexity, while darker colors indicate higher complexity.
Systems 13 00508 g0a2

References

  1. Evro, S.; Oni, B.A.; Tomomewo, O.S. Global strategies for a low-carbon future: Lessons from the US, China, and EU’s pursuit of carbon neutrality. J. Clean. Prod. 2024, 461, 142635. [Google Scholar] [CrossRef]
  2. Zheng, X.; Sun, A. Digital Services Trade between China and V4 Countries—A Study of Trade Complementarity and Regulatory Restrictiveness. Ekon. Cas. 2023, 71, 139–154. [Google Scholar] [CrossRef]
  3. Hidalgo, C.A. Economic complexity theory and applications. Nat. Rev. Phys. 2021, 3, 92–113. [Google Scholar] [CrossRef]
  4. Coniglio, N.D.; Lagravinese, R.; Vurchio, D.; Armenise, M. The pattern of structural change: Testing the product space framework. Ind. Corp. Change 2018, 27, 763–785. [Google Scholar] [CrossRef]
  5. Romero, J.P.; Gramkow, C. Economic complexity and greenhouse gas emissions. World Devel. 2021, 139, 105317. [Google Scholar] [CrossRef]
  6. Hausmann, R.; Klinger, B. The Evolution of Comparative Advantage: The Impact of the Structure of the Product Space; Center for International Development and Kennedy School of Government, Harvard University: Cambridge, MA, USA, 2006. [Google Scholar]
  7. Coniglio, N.D.; Vurchio, D.; Cantore, N.; Clara, M. On the evolution of comparative advantage: Path-dependent versus path-defying changes. J. Int. Econ. 2021, 133, 103522. [Google Scholar] [CrossRef]
  8. Mealy, P.; Teytelboym, A. Economic complexity and the green economy. Res. Pol. 2022, 51, 103948. [Google Scholar] [CrossRef]
  9. Fraccascia, L.; Giannoccaro, I.; Albino, V. Green product development: What does the country product space imply? J. Clean. Prod. 2018, 170, 1076–1088. [Google Scholar] [CrossRef]
  10. Luo, J.; Dong, J.; Tan, Z.; Zhang, H.; Zhang, W. Relatedness, digital economy and renewable energy product evolution—Based on product space perspective. Energy Policy 2024, 186, 113991. [Google Scholar] [CrossRef]
  11. Qi, X.; Xiao, W.; Xiang, X. The spatial pattern of the blue product development of nations: An empirical analysis based on product space theory. Ocean. Coast. Manag. 2021, 207, 105596. [Google Scholar] [CrossRef]
  12. Gazheli, A.; Van Den Bergh, J.; Antal, M. How realistic is green growth? Sectoral-level carbon intensity versus productivity. J. Clean. Prod. 2016, 129, 449–467. [Google Scholar] [CrossRef]
  13. Boschma, R.; Heimeriks, G.; Balland, P.-A. Scientific knowledge dynamics and relatedness in biotech cities. Res. Pol. 2014, 43, 107–114. [Google Scholar] [CrossRef]
  14. Hu, F.; Qiu, L.; Zhou, H. Medical Device Product Innovation Choices in Asia: An Empirical Analysis Based on Product Space. Front. Public Health 2022, 10, 871575. [Google Scholar] [CrossRef] [PubMed]
  15. Huberty, M.; Zachmann, G. Green Exports and the Global Product Space: Prospects for EU Industrial Policy; 2011/07; Bruegel: Brussels, Belgium, 2011. [Google Scholar]
  16. Balland, P.-A.; Broekel, T.; Diodato, D.; Giuliani, E.; Hausmann, R.; O’Clery, N.; Rigby, D. The new paradigm of economic complexity. Res. Pol. 2022, 51, 104450. [Google Scholar] [CrossRef]
  17. Doğan, B.; Saboori, B.; Can, M. Does economic complexity matter for environmental degradation? An empirical analysis for different stages of development. Environ. Sci. Pollut. Res. 2019, 26, 31900–31912. [Google Scholar] [CrossRef]
  18. Mai, N.T.; Hoa, T.T.M.; Huyen, N.T.T. Effects of digitalization on natural resource use in European countries: Does economic complexity matter? Int. J. Energy Econ. Policy 2022, 12, 77–92. [Google Scholar] [CrossRef]
  19. Qiu, L.; Xia, W.; Wei, S.; Hu, H.; Yang, L.; Chen, Y.; Zhou, H.; Hu, F. Collaborative management of environmental pollution and carbon emissions drives local green growth: An analysis based on spatial effects. Environ. Res. 2024, 259, 119546. [Google Scholar] [CrossRef]
  20. Song, W. China’s Relations with Central and Eastern Europe; Routledge: Abingdon, UK, 2017. [Google Scholar]
  21. Kavalski, E. China in Central and Eastern Europe: The unintended effects of identity narratives. Asia Eur. J. 2019, 17, 403–419. [Google Scholar] [CrossRef]
  22. Stanojevic, S.; Qiu, B.; Chen, J. A Study on Trade between China and Central and Eastern European Countries: Does the 16+1 Cooperation Lead to Significant Trade Creation? East. Europ. Econ. 2021, 59, 1–22. [Google Scholar] [CrossRef]
  23. Nikolić, G. Changes in the structure of trade between China and the countries of central and eastern Europe in the period after the initiation of format 17+1. Argum. Oeconomica 2021, 2021, 39–61. [Google Scholar] [CrossRef]
  24. Matura, T. Chinese investment in the EU and Central and Eastern Europe. In China’s Attraction: The Case of Central Europe; Budapest Business School, University of Applied Sciences: Budapest, Hungary, 2017; pp. 49–71. [Google Scholar]
  25. Zheng, Z.; Song, Z.; Ji, Q.; Xiong, W. Spatiotemporal evolution of production cooperation between China and Central and Eastern European countries: An analysis based on the input–output technique. Growth Change 2021, 52, 1117–1136. [Google Scholar] [CrossRef]
  26. Sulich, A.; Sołoducho-Pelc, L. Renewable Energy Producers’ Strategies in the Visegrád Group Countries. Energies 2021, 14, 3048. [Google Scholar] [CrossRef]
  27. Riepl, T.; Zavarská, Z. Towards a Greener Visegrád Group: Progress and Challenges in the Context of the European Green Deal; The Vienna Institute for International Economic Studies: Vienna, Austria, 2023. [Google Scholar]
  28. Jaworski, S.; Chrzanowska, M.; Zielińska-Sitkiewicz, M.; Pietrzykowski, R.; Jezierska-Thöle, A.; Zielonka, P. Evaluating the Progress of Renewable Energy Sources in Poland: A Multidimensional Analysis. Energies 2023, 16, 6431. [Google Scholar] [CrossRef]
  29. Durcansky, P.; Zvada, B.; Nosek, R.; Najser, J.; Najser, T. Evolution of Green Energy Production in Czech Republic. Appl. Sci. 2023, 13, 2185. [Google Scholar] [CrossRef]
  30. Kumar, B.; Szepesi, G.; Čonka, Z.; Kolcun, M.; Péter, Z.; Berényi, L.; Szamosi, Z. Trendline assessment of solar energy potential in hungary and current scenario of renewable energy in the visegrád countries for future sustainability. Sustainability 2021, 13, 5462. [Google Scholar] [CrossRef]
  31. Piwowar, A.; Dzikuć, M.; Dzikuć, M. The potential of wind energy development in Poland in the context of legal and economic changes. Acta Polytech. Hung. 2023, 20, 145–156. [Google Scholar] [CrossRef]
  32. Šafařík, D.; Hlaváčková, P.; Michal, J. Potential of forest biomass resources for renewable energy production in the Czech Republic. Energies 2021, 15, 47. [Google Scholar] [CrossRef]
  33. Knápek, J.; Vávrová, K.; Králík, T.; Outrata, D. Biomass potential—Theory and practice: Case example of the Czech Republic region. Energy Rep. 2020, 6, 292–297. [Google Scholar] [CrossRef]
  34. Szűcs, P.; Turai, E.; Mádai, V.; Vass, P.; Miklós, R.; Zákányi, B.; Ilyés, C.; Fekete, Z.; Kilik, R.; Móricz, F. Innovation in assessment of the geothermal energy potential of abandoned hydrocarbon wells in the southern and southeastern foreground of the Bükk Mountains, northeast Hungary. Hydrogeol. J. 2022, 30, 2267–2284. [Google Scholar] [CrossRef]
  35. Atikur Rahaman, M.; Bin Amin, M.; Taru, R.D.; Ahammed, M.R.; Rabbi, M.F. An analysis of renewable energy consumption in Visegrád countries. Environ. Res. Commun. 2023, 5, 105013. [Google Scholar] [CrossRef]
  36. Kochanek, E. The energy transition in the Visegrad group countries. Energies 2021, 14, 2212. [Google Scholar] [CrossRef]
  37. Brożyna, J.; Strielkowski, W.; Zpěvák, A. Evaluating the chances of implementing the “Fit for 55” Green Transition Package in the V4 countries. Energies 2023, 16, 2764. [Google Scholar] [CrossRef]
  38. Antal, M. How the regime hampered a transition to renewable electricity in Hungary. Environ. Innov. Soc. Transit. 2019, 33, 162–182. [Google Scholar] [CrossRef]
  39. Kiselakova, D.; Stec, M.; Grzebyk, M.; Sofrankova, B. A multidimensional evaluation of the sustainable development of European Union countries—An empirical study. J. Compet. 2020, 12, 56–73. [Google Scholar] [CrossRef]
  40. Domaracká, L.; Seňová, A.; Kowal, D. Evaluation of Eco-Innovation and Green Economy in EU Countries. Energies 2023, 16, 962. [Google Scholar] [CrossRef]
  41. Kułyk, P.; Kaźmierczak-Piwko, L.; Gąsiorek-Kowalewicz, A.; Świstak, P. Development of green jobs in the res sector in the Visegrad Group countries. Multidiscip. Asp. Prod. Eng. 2019, 2, 570–588. [Google Scholar] [CrossRef]
  42. Lall, S. The Technological Structure and Performance of Developing Country Manufactured Exports, 1985-98. Oxf. Devel. Stud. 2000, 28, 337–369. [Google Scholar] [CrossRef]
  43. Kulhanek, L.; Sulich, A.; Zema, T. European integration and real convergence in V4 Group: Transformation towards green economy. In Proceedings of the 6th International Conference on European Integration, Ostrava, Czech Republic, 19–20 May 2022; pp. 363–371. [Google Scholar]
  44. Misztal, A.; Kowalska, M. Factors of green entrepreneurship in selected emerging markets in the European Union. Environ. Dev. Sustain. 2023, 26, 28269–28292. [Google Scholar] [CrossRef]
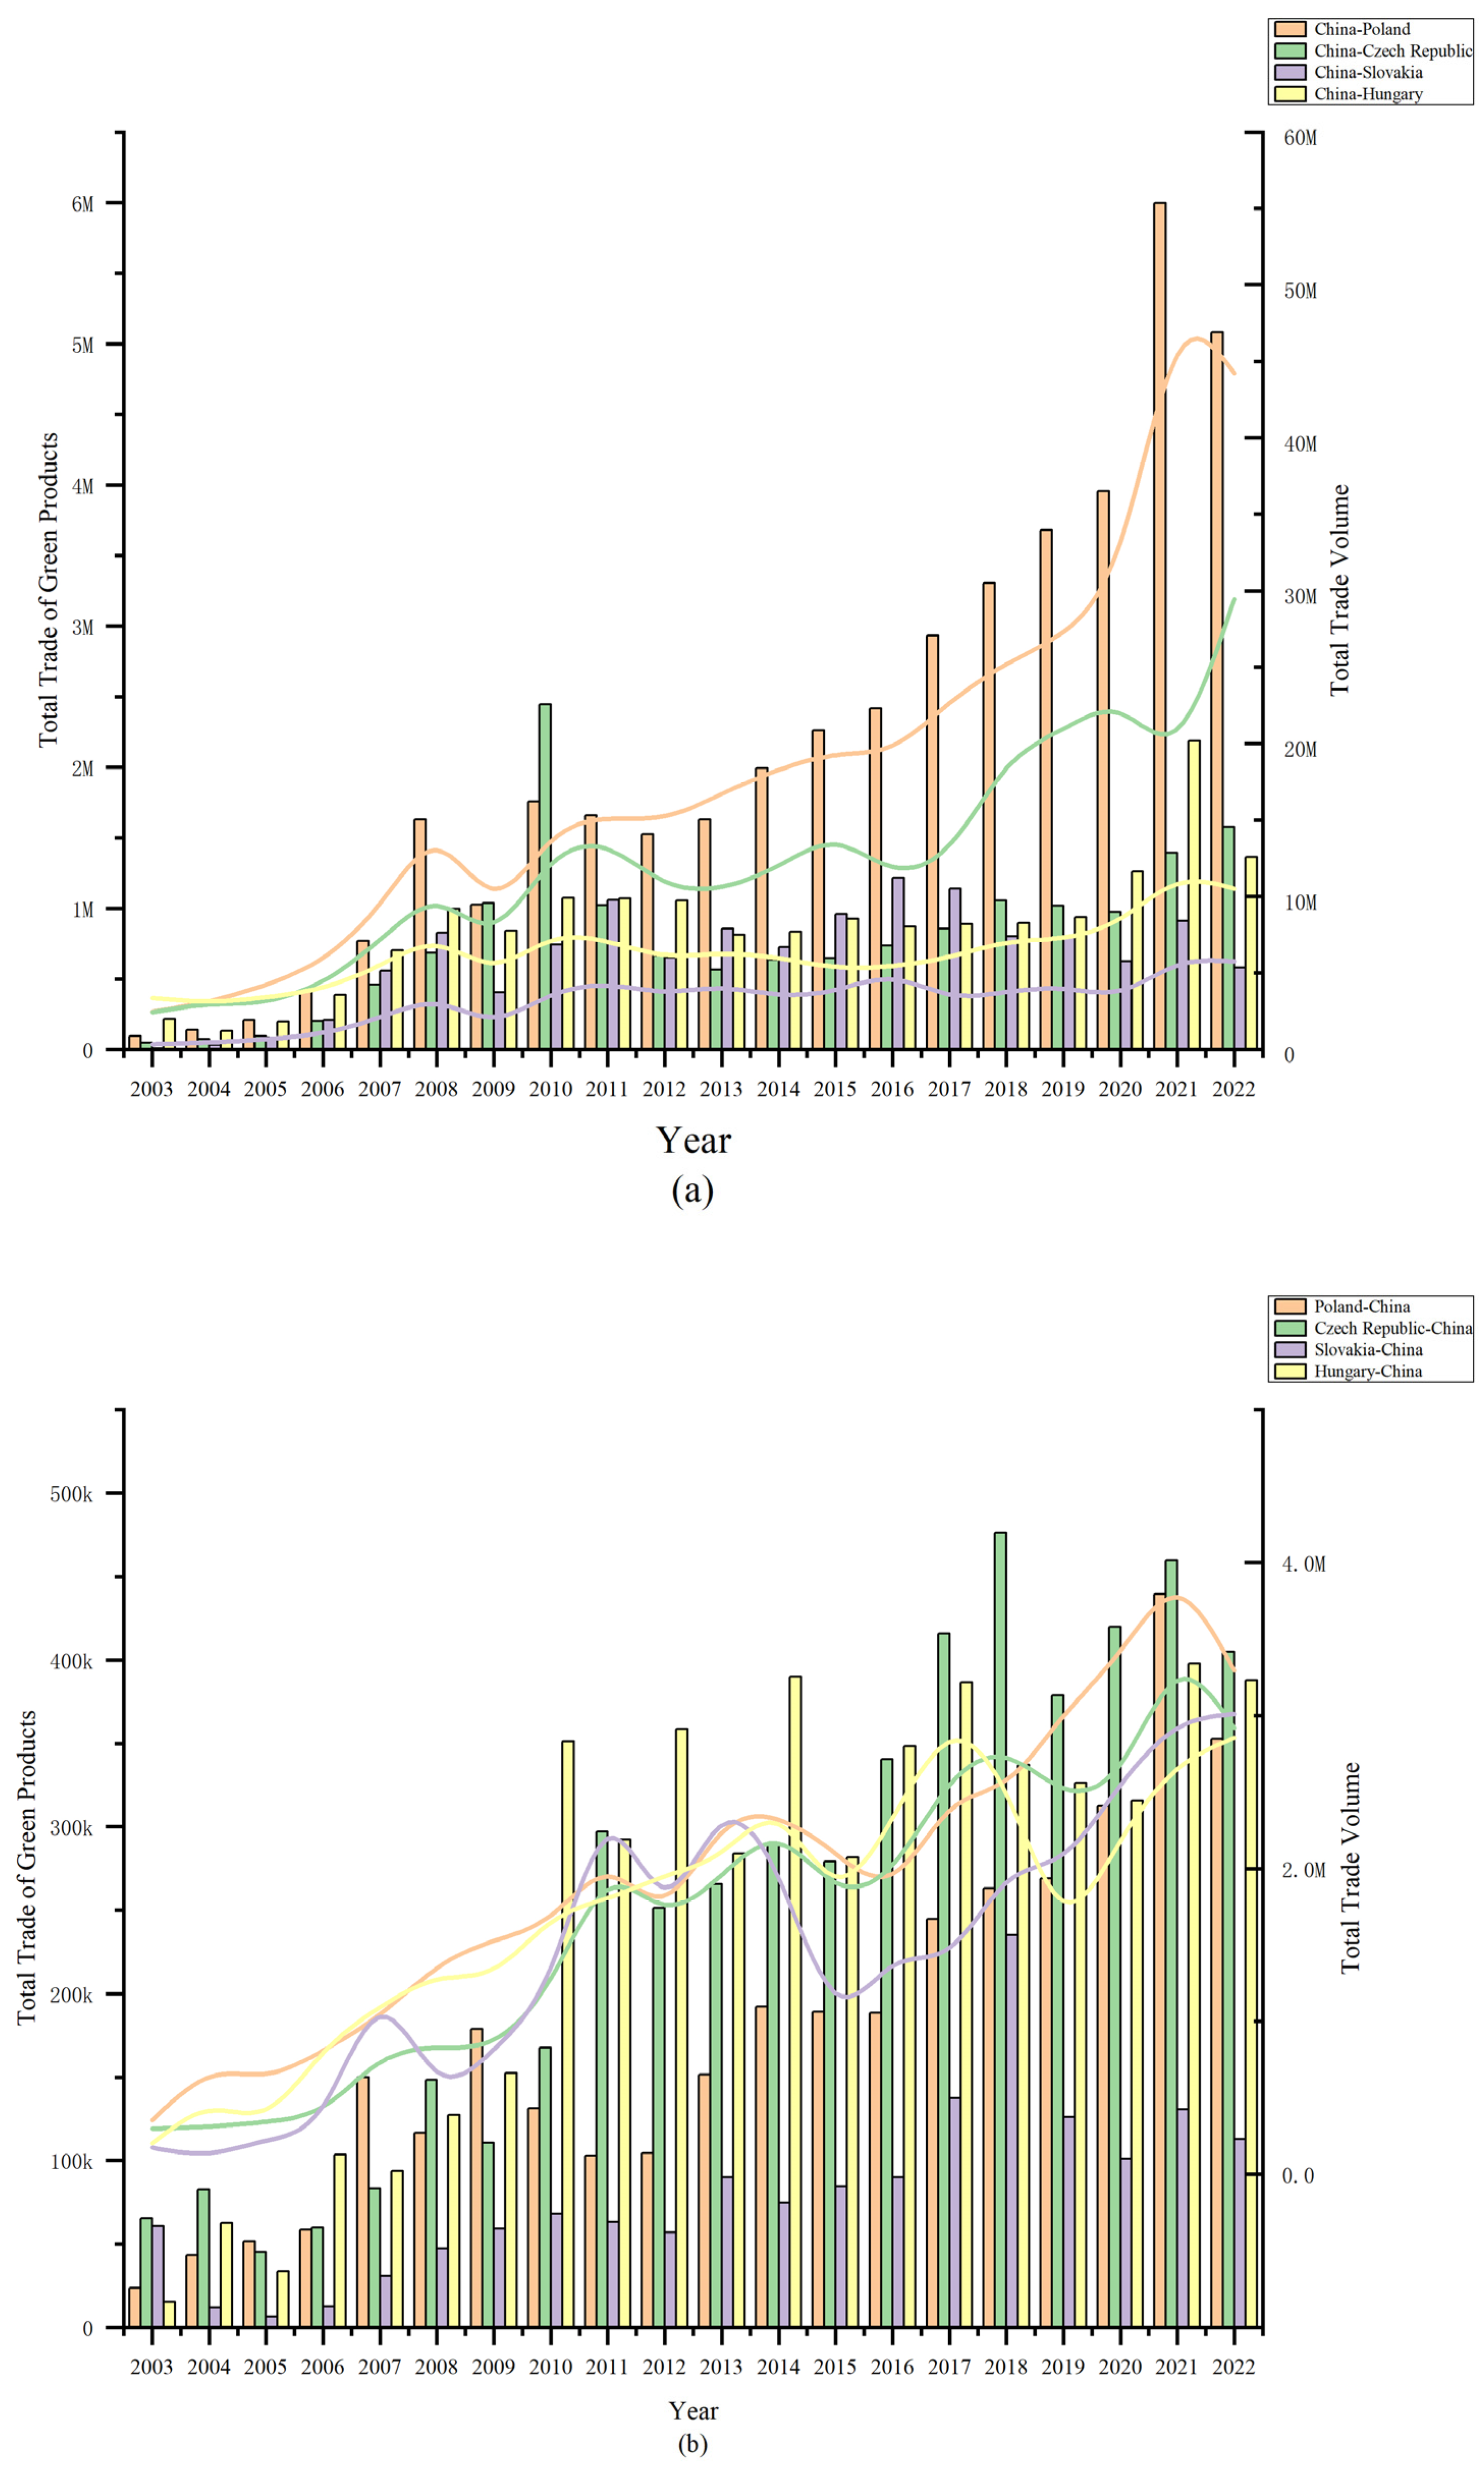
Figure 1. Total bilateral trade volume and green bilateral trade volume for China and V4 countries from 2003 to 2022 (unit: thousand USD); (a) China to V4; (b) V4 to China. Note: The bar chart represents the trade volume of green products, and the line chart shows the total trade volume. The data were compiled by the authors based on the CEPII-BACI database. The figure was drawn using Origin software (Origin 2021).
Systems 13 00508 g001
Figure 2. Evolution of the global green complexity rankings from 2003 to 2022. Note: Green complexity for the former Sudan is calculated separately for Sudan and South Sudan after 2012; green complexity for Serbia after 2006 is calculated separately, and green complexity for Serbia before 2006 is calculated together with Montenegro. The data are calculated by the authors, and the figure is drawn using Origin software (Origin 2021).
Systems 13 00508 g002
Figure 3. Evolution trends of the green industrial structure in China and V4 countries from 2003 to 2022: (a) The evolution of the average density of green products; (b) The evolution of the average density of green products. Note: Data were calculated by the authors, and the figure was drawn using Origin software (Origin 2021).
Systems 13 00508 g003
Figure 4. Evolution diagrams of the green product spaces of China and the V4 countries. Note: Green nodes represent green products for which the country has a comparative advantage in that year, and the node size represents the country’s export volume. The diagrams were drawn using Gephi software (Origin 2021).
Systems 13 00508 g004aSystems 13 00508 g004bSystems 13 00508 g004cSystems 13 00508 g004dSystems 13 00508 g004e
Figure 5. Distance heatmap of green products between China and the V4 countries in 2022. Note: Each row represents a country, with the data in parentheses indicating the number of green products with a comparative advantage in that country in 2022 (national green diversity); columns represent green products, arranged in ascending order of average product complexity from left to right; cells are filled with the distance to obtain a comparative advantage for the products. The figure was drawn using R software (RStudio2024).
Systems 13 00508 g005
Table 1. Average complexity and environmental classification of green products from 2003 to 2022.
Top 10 Green Products by Average ComplexityBottom 10 Green Products by Average Complexity
HS96Product descriptionMean PCIEnvironmental classificationHS96Product descriptionMean PCIEnvironmental classification
902750Other instruments and devices using optical radiation1.736A6. Environmental monitoring, analysis, and assessment460120Woven materials such as cushions, mats, and partitions−1.898A2. Wastewater management
902790Parts of microtome and physical and chemical analysis instruments1.719A6. Environmental monitoring, analysis, and assessment960310Brooms made of twigs or other plant materials−1.600A3. Solid waste management
847990Other parts of machines listed under catalog 84.791.714A3. Solid waste management392490Other plastic household ware and sanitary or toilet articles−1.225A3. Solid waste management
847989Other machines and mechanical apparatus not listed in this study1.656A3. Solid waste management220710Undenatured ethanol with an alcohol content of over 80%−1.124C4. Renewable energy equipment
902710Gas or smoke analyzers1.649A6. Environmental monitoring, analysis, and assessment281511Solid caustic soda−0.833A2. Wastewater management
902720Chromatographs, etc.1.622A6. Environmental monitoring, analysis, and assessment281410Anhydrous ammonia−0.751A2. Wastewater management
902730Spectrometers, etc.1.572A6. Environmental monitoring, analysis and assessment580190Linen and ramie pile woven fabrics and chenille fabrics−0.738A2. Wastewater management
903149Other optical measuring or testing instruments and apparatus1.546A6. Environmental monitoring, analysis, and assessment220190Other natural water−0.691C2. Water supply
901320Other lasers1.515A3. Solid waste management960390Brooms, brushes, mops, and dusters−0.649A3. Solid waste management
841410Vacuum pumps1.509A1. Air pollution control730820Steel towers and lattice masts−0.626C4. Renewable energy equipment
Note: A. Pollution management, B. Clean technologies and products, C. Resource management. For the detailed list of green products and their environmental classification, see Appendix A.
Table 2. GCP and GCP rankings of China and V4 countries.
2003 2008 2013 2018 2022
CountryGCPGlobal RankingGCPGlobal RankingGCPGlobal RankingGCPGlobal RankingGCPGlobal Ranking
China3.16814.16414.26514.69414.6671
Czech Republic2.07981.355121.586111.236141.13315
Hungary0.942200.683310.886240.939230.71128
Poland1.94391.81592.09672.12562.4156
Slovakia0.836280.876250.844260.970210.87821
Table 3. Competitiveness potential indices between China and the V4 countries.
2022-SGPChinaCzech RepublicHungaryPolandSlovakia2022-SGPDChinaCzech RepublicHungaryPolandSlovakia
China1.000 China1.000
Czech Republic0.4071.000 Czech Republic0.1631.000
Hungary0.2560.4631.000 Hungary0.1860.1561.000
Poland0.3260.4630.5001.000 Poland0.2050.3640.1361.000
Slovakia0.1740.3280.3650.4441.000Slovakia0.1860.3130.1940.2731.000
Disclaimer/Publisher’s Note: The statements, opinions and data contained in all publications are solely those of the individual author(s) and contributor(s) and not of MDPI and/or the editor(s). MDPI and/or the editor(s) disclaim responsibility for any injury to people or property resulting from any ideas, methods, instructions or products referred to in the content.