Article

Evaluating the Robustness of the Global LNG Trade Network: The Impact of the Russia–Ukraine Conflict

1
College of Transport & Communications, Shanghai Maritime University, Shanghai 201306, China
2
School of Economics and Management, Shanghai Maritime University, Shanghai 201306, China
*
Author to whom correspondence should be addressed.
Systems 2025, 13(7), 509; https://doi.org/10.3390/systems13070509 (registering DOI)
Submission received: 21 May 2025 / Revised: 15 June 2025 / Accepted: 23 June 2025 / Published: 25 June 2025
(This article belongs to the Special Issue Advances in Reliability Engineering for Complex Systems)

Abstract

This study examines how the Russia–Ukraine conflict has affected the robustness of the global liquefied natural gas (LNG) trade network—an essential component of the global energy transition. As environmental concerns intensify worldwide, LNG is gaining strategic importance due to its cleaner emissions and greater flexibility compared to traditional fossil fuels. However, the global LNG trade network remains vulnerable to geopolitical shocks, particularly due to its concentrated structure. In this context, we construct the LNG trade network from 2020 to 2023 and employ complex network analysis to explore its structural characteristics. We assess network robustness under various attack strategies, budget constraints, and phases of the conflict. Furthermore, we utilize the difference-in-differences (DID) method to evaluate the conflict’s impact on network robustness. Our findings reveal that the global LNG trade network exhibits a distinct center–periphery structure and regional clustering. Although the network scale has continuously expanded, its connectivity still requires improvement. The Russia–Ukraine conflict has significantly weakened network robustness, with negative impacts intensifying across attack phases and under greater budget constraints. The optimal attack strategy causes the most severe degradation, followed by high-importance attacks, while random and low-importance attacks exert limited influence. Our DID-based analysis further confirms the conflict’s significant negative impact. To strengthen its resilience, the global LNG trade network should diversify its partnerships and invest in infrastructure enhancements.

1. Introduction

Liquefied natural gas (LNG) plays a vital role in the ongoing global energy transition. In the face of growing concerns over climate change and severe environmental pollution, the advantages of LNG—namely its cleaner and more environmentally friendly characteristic—have become increasingly prominent. Compared with coal and oil, LNG combustion releases significantly lower levels of carbon dioxide and other pollutants. Moreover, LNG’s seaborne transport offers greater flexibility than pipeline gas, allowing more agile responses to market fluctuations. In recent years, the global LNG trade has expanded steadily. According to the International Gas Union (IGU), the LNG trade volume reached 0.55 trillion cubic meters in 2023, accounting for 58.6% of total natural gas trade [1].
However, the global LNG trade network remains highly centralized, rendering it more vulnerable to disruptions. According to China Petrochemical News, in 2022, five major LNG-exporting countries—Qatar, Australia, the United States, Russia, and Malaysia—accounted for 75% of global LNG exports. Meanwhile, 58% of imports were concentrated in a few countries, such as Japan, China, South Korea, France, and Spain [2]. This concentrated structure leads to heavy dependence on a limited number of key countries [3], weakening the network’s overall robustness and increasing its susceptibility to external shocks.
Since the Russia–Ukraine conflict erupted in 2022, the global LNG trade network has undergone profound and lasting transformations. As a major LNG exporter, Russia has experienced a sharp decline in its share of European markets, prompting significant shifts in global trade flows. In response, the European Union launched the REPowerEU strategy in May 2022, aiming to eliminate Russian gas and LNG imports by 2027. While approximately 19% of Europe’s gas still originated from Russia in 2023—down from nearly 45% before the conflict—many European countries have turned to alternative suppliers, such as the United States, Qatar, and Norway. Meanwhile, Russia has redirected LNG exports to Asia, actively developing its own shipping fleet to circumvent Western sanctions and planning to expand production capacity to 100 million tons per annum (Mtpa). These adjustments underscore escalating geopolitical risks and structural shifts that threaten the robustness of the global LNG trade network. Accordingly, the resilience of this network is closely linked to the stability of the global energy supply. By examining the conflict’s impact on network robustness, this study aims to identify latent vulnerabilities, provide theoretical foundations for mitigating geopolitical risks, and support countries in strengthening energy supply chains and promoting sustainable global energy development.
In recent years, the impact of the Russia–Ukraine conflict on trade networks has attracted growing academic attention. Zheng et al. (2022) argued that the conflict reshaped the global fossil fuel trade network, shifting energy influence from Europe to Asia [4]. Chowdhury et al. (2023) found that the conflict caused significant imbalances in food, energy, and ecological trade networks, revealing broader sustainability challenges [5]. Xiao et al. (2025) focused on the LNG trade network and observed that the conflict accelerated the formation of a more interconnected global LNG community [6].
This study addresses three key research questions: (1) What are the structural characteristics of the global LNG trade network? (2) How can the robustness of the global LNG trade network be assessed? (3) How has the Russia–Ukraine conflict influenced the robustness of the global LNG trade network?
To explore these questions, we build on prior studies that applied complex network theory to LNG systems [7], and we construct a global LNG trade network from 2020 to 2023, analyzing its structural features through topological and centrality-based metrics. We then simulate node removal to assess network vulnerability. Similar to Xiao et al. [8], we evaluate robustness via targeted attacks, but further innovate by incorporating multiple attack strategies, varying budget constraints, and conflict stages. This yields a more comprehensive robustness assessment. The results show a clear center–periphery structure and regional segmentation. Although the network has expanded, its connectivity remains limited. The conflict has significantly reduced robustness, and this effect intensifies with conflict progression and larger attack budgets. The optimal attack strategy leads to the most severe decline in robustness, followed by high-importance attacks, while random and low-importance attacks exert limited effects. The DID-based analysis validates the conflict’s significant negative impact on network robustness.
The structure of this study is as follows: Section 2 reviews the relevant literature. Section 3 discusses the data and research methods. Section 4 outlines the assessment of network robustness. Section 5 analyzes the impact of the Russia–Ukraine conflict on the robustness of the global LNG trade network. Section 6 presents an empirical analysis of the impact of the conflict with the DID method. Section 7 concludes with the findings and implications. The research flowchart for this study is shown in Figure 1.

2. Literature Review

2.1. Network Robustness

Studies on network robustness span various sectors, including major commodities such as food and energy. For instance, the global food trade network demonstrates high resilience to random disruptions but remains particularly vulnerable to targeted attacks [9]. A similar pattern emerges in energy networks—for example, in the lithium trade network—where robustness declines significantly under deliberate disruption [10]. Li et al. (2024) found that increasing the number of disrupted countries substantially reduces the global oil trade network’s recovery capacity [11]. Regional aggregation within the network has been identified as a critical vulnerability, emphasizing the role of major economies [12]. Likewise, disruptions in key countries have a pronounced impact on the stability of nickel ore and cobalt trade networks [13,14].
Recent research has advanced the understanding of LNG network robustness. Although the global LNG network has improved in connectivity and community integration, enhancing its adaptability to external shocks, it remains particularly exposed to targeted disruptions [15], thereby compromising its overall resilience [8]. Accounting for ripple effects, Zhu et al. (2024) found that economies with higher resilience are more capable of recovering from supply shocks [16]. Meza et al. (2022) emphasized that disruptions at strategic chokepoints—such as the Panama Canal and the Suez Canal/Mandeb Strait—significantly compromise the global LNG network’s stability [7]. Animah and Shafiee (2020) provided a comprehensive overview of risk assessment in the LNG sector, underscoring that operational and systemic risks—often overlooked in topological analyses—play a decisive role in shaping overall network vulnerability [17].

2.2. LNG Trade Analysis

LNG trade plays a central role in ensuring global energy security. Over the past two decades, trade volumes have more than tripled, firmly establishing LNG’s strategic importance within the natural gas market. Despite this growth, the LNG trade network continues to exhibit low centrality and density, suggesting substantial potential for further expansion [18]. Owing to its inherent flexibility, LNG can swiftly respond to regional demand fluctuations, making it a key enabler of the global energy transition [19]. Simultaneously, the network is undergoing structural evolution, marked by increasing market concentration. Asia and Europe have emerged as dominant LNG markets, reflecting clear regional diversification patterns [20]. This trend aligns with the findings by Peng et al. (2021), who identified stage-wise development in LNG transport networks and rising geographical concentration of trade clusters [21]. Key ports such as Singapore and Ras Laffan serve pivotal roles in facilitating global LNG flows. Additionally, the opening of Arctic shipping routes has introduced new logistical corridors, offering expanded export opportunities for gas-rich nations such as Russia and diversified import channels for Asia-Pacific economies [22].
Nevertheless, the LNG trade still faces multiple challenges. The market is highly susceptible to policy shifts, which can lead to significant price volatility and instability [23]. The scale-free nature of the LNG trade network amplifies the influence of central nodes, heightening the risk of market monopolization [3]. Wanyan et al. (2022) proposed the dependency index PMI and demonstrated that the LNG trade network follows a power-law distribution, wherein a few nodes exert disproportionate influence [24]. This concentration threatens the resilience and security of global energy systems. Moreover, geopolitical dynamics continue to reshape trade patterns. In a climate of rising global tensions, Europe must navigate complex trade-offs between decarbonization objectives and energy security, especially regarding LNG sourcing strategies [25].

2.3. Implications of the Russia–Ukraine Conflict for LNG Trade

The Russia–Ukraine conflict has profoundly reshaped global LNG trade flows and volumes [8]. In response to reduced reliance on Russian gas, the European Union adopted diversification strategies [26], leading to a sharp increase in LNG imports from the United States and other suppliers. Consequently, Russia and Ukraine’s roles in the global shipping network have diminished considerably [27]. Xiao et al. (2025) found that many countries established direct maritime routes, improving network efficiency and reinforcing the global LNG trade community [6]. Zhang et al. (2024) reported a notable rise in transatlantic LNG shipments from the United States, strengthening its transport ties with strategic partners [28]. Similarly, Ke et al. (2025) observed regional realignments in maritime flows during the conflict, indicating a geopolitical reconfiguration of the global LNG shipping network [29].
The heightened market uncertainty triggered by the conflict has also catalyzed shifts in LNG pricing models, including a growing preference for contracts indexed to short-term gas prices [30]. Chyong et al. (2024) noted a pronounced supply–demand imbalance, with surging European demand constrained by reduced Russian exports [31]. This mismatch has driven up prices, exacerbating energy poverty and, in some regions, contributing to social unrest [32]. Balmaceda et al. (2024) emphasized that the crisis has prompted governments to re-evaluate their energy systems, highlighting the importance of supply flexibility and adaptability [33]. Hartvig et al. (2024) argued that Russia’s “energy weaponization” strategy is becoming increasingly ineffective as Europe accelerates its transition to renewables and broadens its energy portfolio [34]. These shifts have collectively bolstered resilience against potential disruptions in Russian LNG supply [35]. As a result, the global LNG market is undergoing structural transformation, compelling countries to rethink energy policy to mitigate the broader social and economic risks of geopolitical instability [36].

2.4. Contributions of This Study

Most existing studies on network robustness focus primarily on the effects of random or targeted disruptions. However, they often fail to capture the interplay among different attack strategies, constraints on attack resources, and temporal variations across different stages of conflict, thereby limiting the depth and accuracy of their assessments. Additionally, many studies rely on qualitative analysis, lacking rigorous empirical validation to determine whether and to what extent geopolitical shocks influence network robustness.
To address these limitations, our study makes three primary contributions:
(1)
While earlier studies tend to examine random or targeted attacks in isolation [9,10], we incorporate a comprehensive suite of attack scenarios, including random, high-importance, low-importance, and optimal strategies. We also account for budget constraints and stage-specific conflict effects, providing a more nuanced and practical framework for assessing network vulnerability from theoretical and operational perspectives.
(2)
Building on simulation-based analyses such as Mei et al. [15] and Zhu et al. [16], we introduce a difference-in-differences (DID) model to quantify the causal effect of the Russia–Ukraine conflict on the robustness of the global LNG trade network. This empirical approach enables us to move beyond theoretical assumptions and provide statistically robust evidence of how geopolitical disruptions reshape global trade structures.
(3)
The existing literature often separates topological analysis from macroeconomic modeling [8,21,31]. In reality, however, a network’s structural fragility and real-world response to external shocks are interdependent. To capture this complexity, we integrate complex network analysis with the DID method. The former enables simulation and visualization of evolving network characteristics under stress, while the latter allows empirical identification of conflict impacts on trade relationships. This integrated approach offers a more holistic framework, bridging structural insights with measurable consequences, thus enhancing academic depth and policy relevance.

3. Structure of the Global LNG Trade Network

This section outlines the construction of the global LNG trade network from 2020 to 2023, followed by an analysis of its structural characteristics and changes based on topological and centrality measures.

3.1. Construction of the Global LNG Trade Network (2020–2023)

This study uses annual LNG data from the IGU (https://www.igu.org/, accessed on 1 November 2024) and applies data-cleaning techniques to handle missing values and outliers. An adjacency matrix of the global LNG trade network for 2020–2023 was constructed. Using Gephi 0.10.1, directed graph models were developed for each year’s LNG trade network. In these models, nodes represent countries or regions, with node size corresponding to their degree within the network. Arrows indicate the direction of LNG trade, pointing from exporting to importing countries. The thickness of the arrows reflects trade volume, indicating the intensity of trade relationships. Different line colors represent distinct modular groups, illustrating regional divisions within the network.
As shown in Figure 2, the global LNG trade network demonstrates a clear center–periphery structure and regional clustering. Before the Russia–Ukraine conflict, the network was relatively stable, with Russia as a key exporter maintaining strong trade links with European countries. Significant trade flows also existed between the Middle East (e.g., Qatar, UAE) and Asia (e.g., China, Japan, South Korea), between Europe (e.g., the United Kingdom, the Netherlands) and Africa (e.g., Nigeria, Algeria), and between North America (e.g., the United States) and South America (e.g., Argentina, Brazil). However, after the onset of the Russia–Ukraine conflict in 2022, the network structure became more complex and diversified. Trade relations between Russia and Europe were severely disrupted, and trade volumes declined sharply. European countries responded by diversifying their energy sources and strengthening LNG trade with the United States, Qatar, and Australia. Russia shifted its focus toward Asian markets, reinforcing ties with regional trading partners. By 2023, the United States, Qatar, and Australia had solidified their trade relationships with Europe, thereby enhancing their centrality within the global LNG network. Meanwhile, Russia expanded its LNG exports to Asia and developed new trade routes, demonstrating strategic flexibility and resilience in response to external shocks. In addition, Trinidad and Tobago’s LNG exports continued to grow steadily, supported by its advantageous geographic location and abundant natural gas reserves, positioning it as an increasingly important supplier in the Atlantic basin and regional markets.

3.2. Topology Analysis of the Network

As shown in Table 1, from 2020 to 2023, the global LNG trade network experienced notable structural changes. The number of nodes steadily increased, while the number of edges declined and then rose, indicating broader participation from countries and regions in LNG trade. Despite disruptions caused by the Russia–Ukraine conflict, the network exhibited an overall expansion trend. The average degree and clustering coefficient initially declined, then increased, and declined again, reflecting fluctuations in trade intensity and local connectivity. These metrics weakened before the conflict, peaked at its onset, and slightly decreased as the conflict persisted. The average weighted degree first rose and then declined, suggesting stable trade volumes before the conflict that were later disrupted by the breakdown in Russia–Europe trade. The average path length was initially shortened and then lengthened, indicating fluctuating network connectivity. Before the conflict, trade routes were relatively well established; following the conflict’s outbreak, disruptions at key hubs reduced connectivity, which gradually recovered as alternative trade routes emerged.
Overall, the global LNG trade network demonstrated a certain degree of resilience in the face of external shocks. From 2020 to 2021, the network’s size and connectivity remained relatively stable. In 2022, the network was significantly impacted by the Russia–Ukraine conflict. By 2023, the network had expanded substantially, but its overall connectivity declined due to ongoing geopolitical tensions, posing continuing challenges to its robustness.

3.3. Centrality Analysis of the Network

This section calculates degree centrality, betweenness centrality, weighted degree centrality, and weighted betweenness centrality for the global LNG trade network from 2020 to 2023. Based on these indicators, we identify the top ten countries and examine the evolution of their centrality.
(1) Degree Centrality
Degree centrality is the ratio of a node’s connected edges to the maximum number of possible edges, measuring a node’s connectivity level in the network. It is calculated using the following formula:
C D ( i ) = d i n 1
where d i is the degree of node i, and n is the total number of nodes in the network.
(2) Weighted Degree Centrality
Weighted degree centrality is the sum of the weights of all neighboring edges of a node, reflecting the strength of the node’s connectivity in a weighted network. The formula is as follows:
C W D ( i ) = j N ( i ) w i j
where N ( i ) represents the set of neighboring nodes connected to node i, and w i j is the weight of the edge between node i and its neighboring node j.
(3) Betweenness Centrality
Betweenness centrality measures the frequency with which a node appears on all shortest paths in the network, reflecting its role in mediating the flow of information or resources. It is calculated as follows:
C B ( i ) = s i t σ s t ( i ) σ s t
where σ s t is the total number of shortest paths between nodes s and t, and σ s t ( i ) is the number of those paths that pass through node i.
(4) Weighted Betweenness Centrality
Weighted betweenness centrality incorporates edge weights, measuring a node’s frequency of occurrence on all shortest paths in the weighted network. The calculation formula is as follows:
C W B ( i ) = s i t σ s t w ( i ) σ s t w
where σ s t w is the total number of shortest paths between nodes s and t, and σ s t w ( i ) is the number of those paths that pass through node i.
(5) Comparative Assessment of Centrality Indicators
As shown in Table 2 and Table 3, degree centrality primarily reflects the number of direct connections each country maintains within the global LNG trade network, whereas weighted degree centrality incorporates the strength of these connections, reflecting actual trade volumes. The United States consistently ranks first in both indicators due to its broad international partnerships and substantial trade volumes. Following the Russia–Ukraine conflict, the sharp increase in U.S. LNG exports propelled its weighted degree centrality to the highest level, highlighting its extensive connections and dominant position in global LNG trade. After the conflict began, Russia adjusted its trade strategy. Despite fluctuations in weighted degree centrality, Russia has retained a relatively stable ranking, indicating that the conflict has not completely diminished its influence in the global LNG network. Its degree centrality has also remained consistent, reflecting the resilience of its trade relationships despite geopolitical disruptions. Exporters such as Trinidad and Tobago, Nigeria, and Qatar maintain direct trade ties with multiple countries, resulting in high degree centrality, with increasing weighted centrality driven by growing export capacity and strengthened trade relationships. Likewise, Egypt and Algeria have gradually improved their centrality as their export potential expands. Major importing countries—China, Japan, and South Korea—play a crucial role in balancing global LNG supply and demand, maintaining high values in both centrality measures.
Betweenness centrality and weighted betweenness centrality provide insights into a country’s role as an intermediary within the network. Betweenness centrality emphasizes a country’s function as a transit hub in trade flows, while weighted betweenness centrality incorporates trade volume into this intermediary role. The United States again ranks highest in both indicators, underscoring its trade routes’ strategic significance and central position in shaping global LNG flows. In contrast, Russia has experienced disruptions from the conflict, leading to instability in its intermediary function and volatility in both betweenness measures. Countries such as Trinidad and Tobago, Nigeria, and Qatar are subject to fluctuating intermediary roles influenced by market dynamics, geopolitical factors, and trade cooperation, often resulting in moderate centrality values. However, their weighted betweenness centrality has trended upward as trade volumes grow. Major importers such as China and South Korea, characterized by stable trade routes and long-term partnerships, have sustained steady betweenness values that are pivotal in maintaining the stability and continuity of global LNG trade flows.
In conclusion, degree centrality captures the breadth of a country’s trade connections, while weighted degree centrality emphasizes the magnitude of those interactions. Betweenness centrality reflects the strategic significance of intermediary positions and weighted betweenness centrality further accounts for the volume of trade handled through those positions. A country’s performance across these measures illustrates the complex and dynamic nature of the global LNG trade network. The importance of a node in this network depends not only on the number of connections but also on the scale and robustness of trade relationships. Therefore, this study prioritizes weighted degree centrality as the primary indicator for assessing node importance, as it provides a comprehensive view of both the extent and intensity of trade ties. This approach emphasizes a country’s active participation and autonomous trade capacity rather than its intermediary role. Thus, a higher weighted degree of centrality reflects greater direct involvement and influence within the global LNG network.

3.4. The Impact of the Russia–Ukraine Conflict on Key Nodes

As discussed in Section 3.3, the Russia–Ukraine conflict has profoundly reshaped the centrality of key countries in the LNG trade network, notably China, Qatar, and Russia, resulting in significant shifts in their centrality rankings. Although the Netherlands does not rank among the top ten countries by centrality, the IGU LNG annual report identifies notable changes in its LNG trade volume and routing patterns. The following analysis examines the effects of the conflict on the Netherlands, China, Qatar, and Russia.
(1) The Netherlands
As shown in Table 4, the Netherlands—a leading European economy—was highly reliant on Russian LNG before the Russia–Ukraine conflict, with approximately 45% of its LNG imports originating from Russia. In response to the conflict, the Netherlands accelerated the expansion of its LNG import infrastructure and substantially increased imports from the United States while simultaneously diversifying its supply sources to include Qatar, Norway, Algeria, and Trinidad and Tobago. This strategic realignment aimed to reduce dependence on Russian LNG and strengthen energy security amid geopolitical tensions. However, the transition posed several challenges, including higher costs associated with U.S. LNG and short-term volatility in energy supply and pricing, which have complicated the Netherlands’ progress toward renewable energy goals.
(2) China
As shown in Table 5, following the onset of the Russia–Ukraine conflict, China leveraged Russia’s increasing need to diversify markets, deepening bilateral energy cooperation and boosting LNG imports from Russia. Concurrently, China expanded partnerships with other key suppliers, notably by signing long-term agreements with Qatar, thereby addressing growing domestic demand and enhancing energy supply reliability. In light of high U.S. LNG prices and persistent uncertainties in U.S.–China trade relations, China reduced its LNG imports from the United States. By diversifying its supply portfolio and integrating both Eastern and Western sources, China demonstrates strategic adaptability and resilience in its energy security framework.
(3) Qatar
As shown in Table 6, the conflict has elevated Qatar’s strategic importance as Europe actively sought alternative suppliers to reduce reliance on Russian LNG. This shift led to a significant surge in Qatari exports, solidifying its position as the world’s third-largest LNG exporter in 2023. In response to shifting demand, Qatar adopted a flexible pricing strategy, maintaining a strong presence in East and South Asia while expanding its influence in European markets. This strategic adaptation allowed Qatar to transcend its traditional role as a supplier and emerge as a key player in shaping global LNG trade dynamics.
(4) Russia
As shown in Table 7, the Russia–Ukraine conflict has profoundly impacted Russia’s position within the global LNG market. Before the conflict, Russia was a major LNG supplier to Europe, but introducing sanctions and export restrictions led to a sharp decline in market share. In response, Russia redirected its trade focus toward non-European markets such as China, partially offsetting the loss of European demand. Nevertheless, Russia faces two significant challenges: its infrastructure lacks the flexibility to shift market orientation swiftly, and it confronts intensifying competition from other LNG exporters. These pressures have placed Russia in a difficult position, characterized by short-term market contraction and long-term erosion of competitiveness.

4. Network Robustness Evaluation Methods

Network robustness evaluation primarily focuses on assessing a network’s ability to maintain functionality and structural integrity under both random and targeted attacks. Existing studies have extensively explored how networks respond to such disruptions. Yu et al. (2023) found that attacking 10–20% of nodes can lead to network collapse, with a significantly greater impact than random disturbances [37]. Liu et al. (2024) further emphasized that deliberate attacks rapidly undermine network functionality and structure, while random attacks result in more gradual degradation [38]. Random attacks typically simulate naturally occurring risks, whereas deliberate attacks represent human-induced threats.
Robustness evaluation generally involves two essential steps: (1) defining attack strategies to simulate potential disruptions and (2) selecting appropriate performance metrics to evaluate network performance. These methods have been widely applied across energy trade networks, transportation systems, and social networks. Albert et al. (2000) demonstrated that scale-free networks depend heavily on key nodes, establishing a classic framework for robustness analysis [39]. Holme et al. (2002) suggested that targeted attacks based on node centrality more accurately reveal network vulnerabilities [40]. Crucitti et al. (2004) introduced network efficiency and the size of the largest connected component as key metrics—the former quantifying global information transmission and the latter reflecting the extent of connectivity disruption [41].
Building upon this theoretical foundation and considering the structural features of the global LNG trade network, this study proposes the following robustness evaluation framework methodology: (1) constructing attack cost and budget models; (2) defining four attack strategies and selecting relevant performance indicators; and (3) applying a hybrid genetic algorithm to optimize the attack model.

4.1. Attack Cost Construction

Following the framework proposed by Wang et al. [42] and incorporating necessary modifications, the attack cost is modeled as a power-law function of the node’s weighted degree centrality. The cost formula is defined as follows:
Y ( i ) = C w ( i ) α
where Y ( i ) represents the attack cost for node, and α is a cost factor reflecting the defender’s concern for key nodes.

4.2. Attack Cost Budget Construction

In practical scenarios, attackers often operate under limited resources. To simulate such constraints, especially under conflict conditions, we define the following budget model:
p = i R C w ( i ) α i N C w ( i ) α
where R represents the set of nodes selected for removal, and p is a budget coefficient that allows attackers to adjust the total cost by varying the value.

4.3. Definition of Attack Strategies

With attack cost and budget established, node removal is executed according to different strategies. We examine four types of attacks, described as follows:
(1)
Random Attack (RA) Strategy: Nodes are randomly selected, simulating non-targeted disruptions in the network.
(2)
High-Importance Attack (HIDA) Strategy: Nodes are ranked in descending order of importance and removed sequentially. This reflects cascading failures caused by attacks on critical nodes, testing network fragility.
(3)
Low-Importance Attack (LIDA) Strategy: Nodes are ranked in ascending order of importance and removed individually. This simulates low-cost attacks under resource constraints, revealing the network’s resilience to widespread, minor disruptions.
(4)
Optimal Attack (OA) Strategy: This strategy is derived from the optimized attack model described in Section 4.5 and Section 4.6, incorporating network topology, node centrality, and attack cost. It aims to maximize disruption at minimal cost, reflecting extreme cases such as targeted cyberattacks or aggressive market competition.

4.4. Indicators for Evaluating Network Robustness

We adopt two primary indicators to evaluate the robustness of the global LNG trade network: network efficiency and the relative size of the largest connected component. These are widely used in complex network analysis (Holme et al., [40]; Crucitti et al., [41]) and reflect complementary dimensions of robustness-communication efficiency and connectivity resilience, respectively.
(1) Network Efficiency
Network efficiency measures how effectively information flows across the network based on the shortest path lengths between nodes. Greater efficiency implies lower communication and transaction costs. It is computed as follows:
E = 1 n ( n 1 ) i , j N , i j 1 d i j
where n is the total number of nodes in the network, d i j is the shortest path length between nodes i and j, and E ranges from [0, 1].
(2) Relative Size of the Largest Connected Component
The relative size of the largest connected component reflects the proportion of nodes remaining interconnected after an attack. A larger connected component indicates better connectivity and fault tolerance. The formula is as follows:
G = n n
where n is the set of nodes that remain operational after the network is attacked.

4.5. Developing the Optimal Attack Strategy Model Considering Attack Costs

The model’s objective is to minimize network efficiency and the size of the largest connected component, thereby identifying the most damaging attack configuration under budget constraints. The mathematical model is formulated as follows:
minimize   1 n ( n 1 ) i , j n ,   i j 1 d i j subject   to   i N ψ i Y ( i ) δ δ = p × i = 1 n C w ( i ) α
where Y ( i ) represents the attack cost for node i ; ψ i is a 0/1 decision variable: ψ i = 1 indicates that a node is attacked and removed from the network, while ψ i = 0 means the node is unaffected; δ represents the upper limit of the attack budget; p is the attack cost budget coefficient; and C w ( i ) α represents the nodes in the network targeted for attack.

4.6. Application of a Hybrid Genetic Algorithm to Approximate the Optimal Attack Strategy Model

As nodes are progressively removed, the network topology undergoes dynamic changes, making this a nonlinear and computationally intractable optimization problem. Given the large scale of the global LNG trade network, traditional exact methods are computationally infeasible. Therefore, this study first adopts a hybrid genetic algorithm to approximate the optimal attack strategy.
First, attack strategies are encoded as binary chromosomes, where 1 indicates that a node is attacked and 0 denotes that the node remains unaffected. An initial population is then randomly generated, with each individual (i.e., chromosome) representing a potential attack configuration.
Then, each individual’s fitness is evaluated based on its ability to reduce network robustness under the constraint of limited attack cost. Lower fitness values correspond to more effective attack strategies, i.e., those that minimize network efficiency and the size of the largest connected component within the given budget.
Next, the best-performing individuals are selected for reproduction, forming the next generation. New individuals are generated through crossover and mutation operations. Crossover involves exchanging segments between two parent chromosomes to create offspring, exploring new attack configurations.
Finally, to enhance solution diversity and avoid premature convergence, three mutation methods are employed in combination: swap, which randomly exchanges two gene positions; relocation, which reverses the order of selected gene segments; and 2-opt, which modifies the neighborhood structure of a chromosome to improve its fitness. This evolutionary process—selection, crossover, and mutation—iterates until a predefined number of generations is reached or the fitness function converges to a stable solution.

5. Impact of the Russia–Ukraine Conflict on the Robustness of the Global LNG Trade Network

This section investigates the impact of the Russia–Ukraine conflict on the robustness of the global LNG trade network. It first identifies vulnerabilities in network robustness under varying attack budgets, then analyzes the dynamic changes in robustness throughout different phases of the conflict.

5.1. Impact of Attack Budgets on Network Robustness Amid the Russia–Ukraine Conflict

(1) Assessing Network Robustness Across Different Budget Scenarios
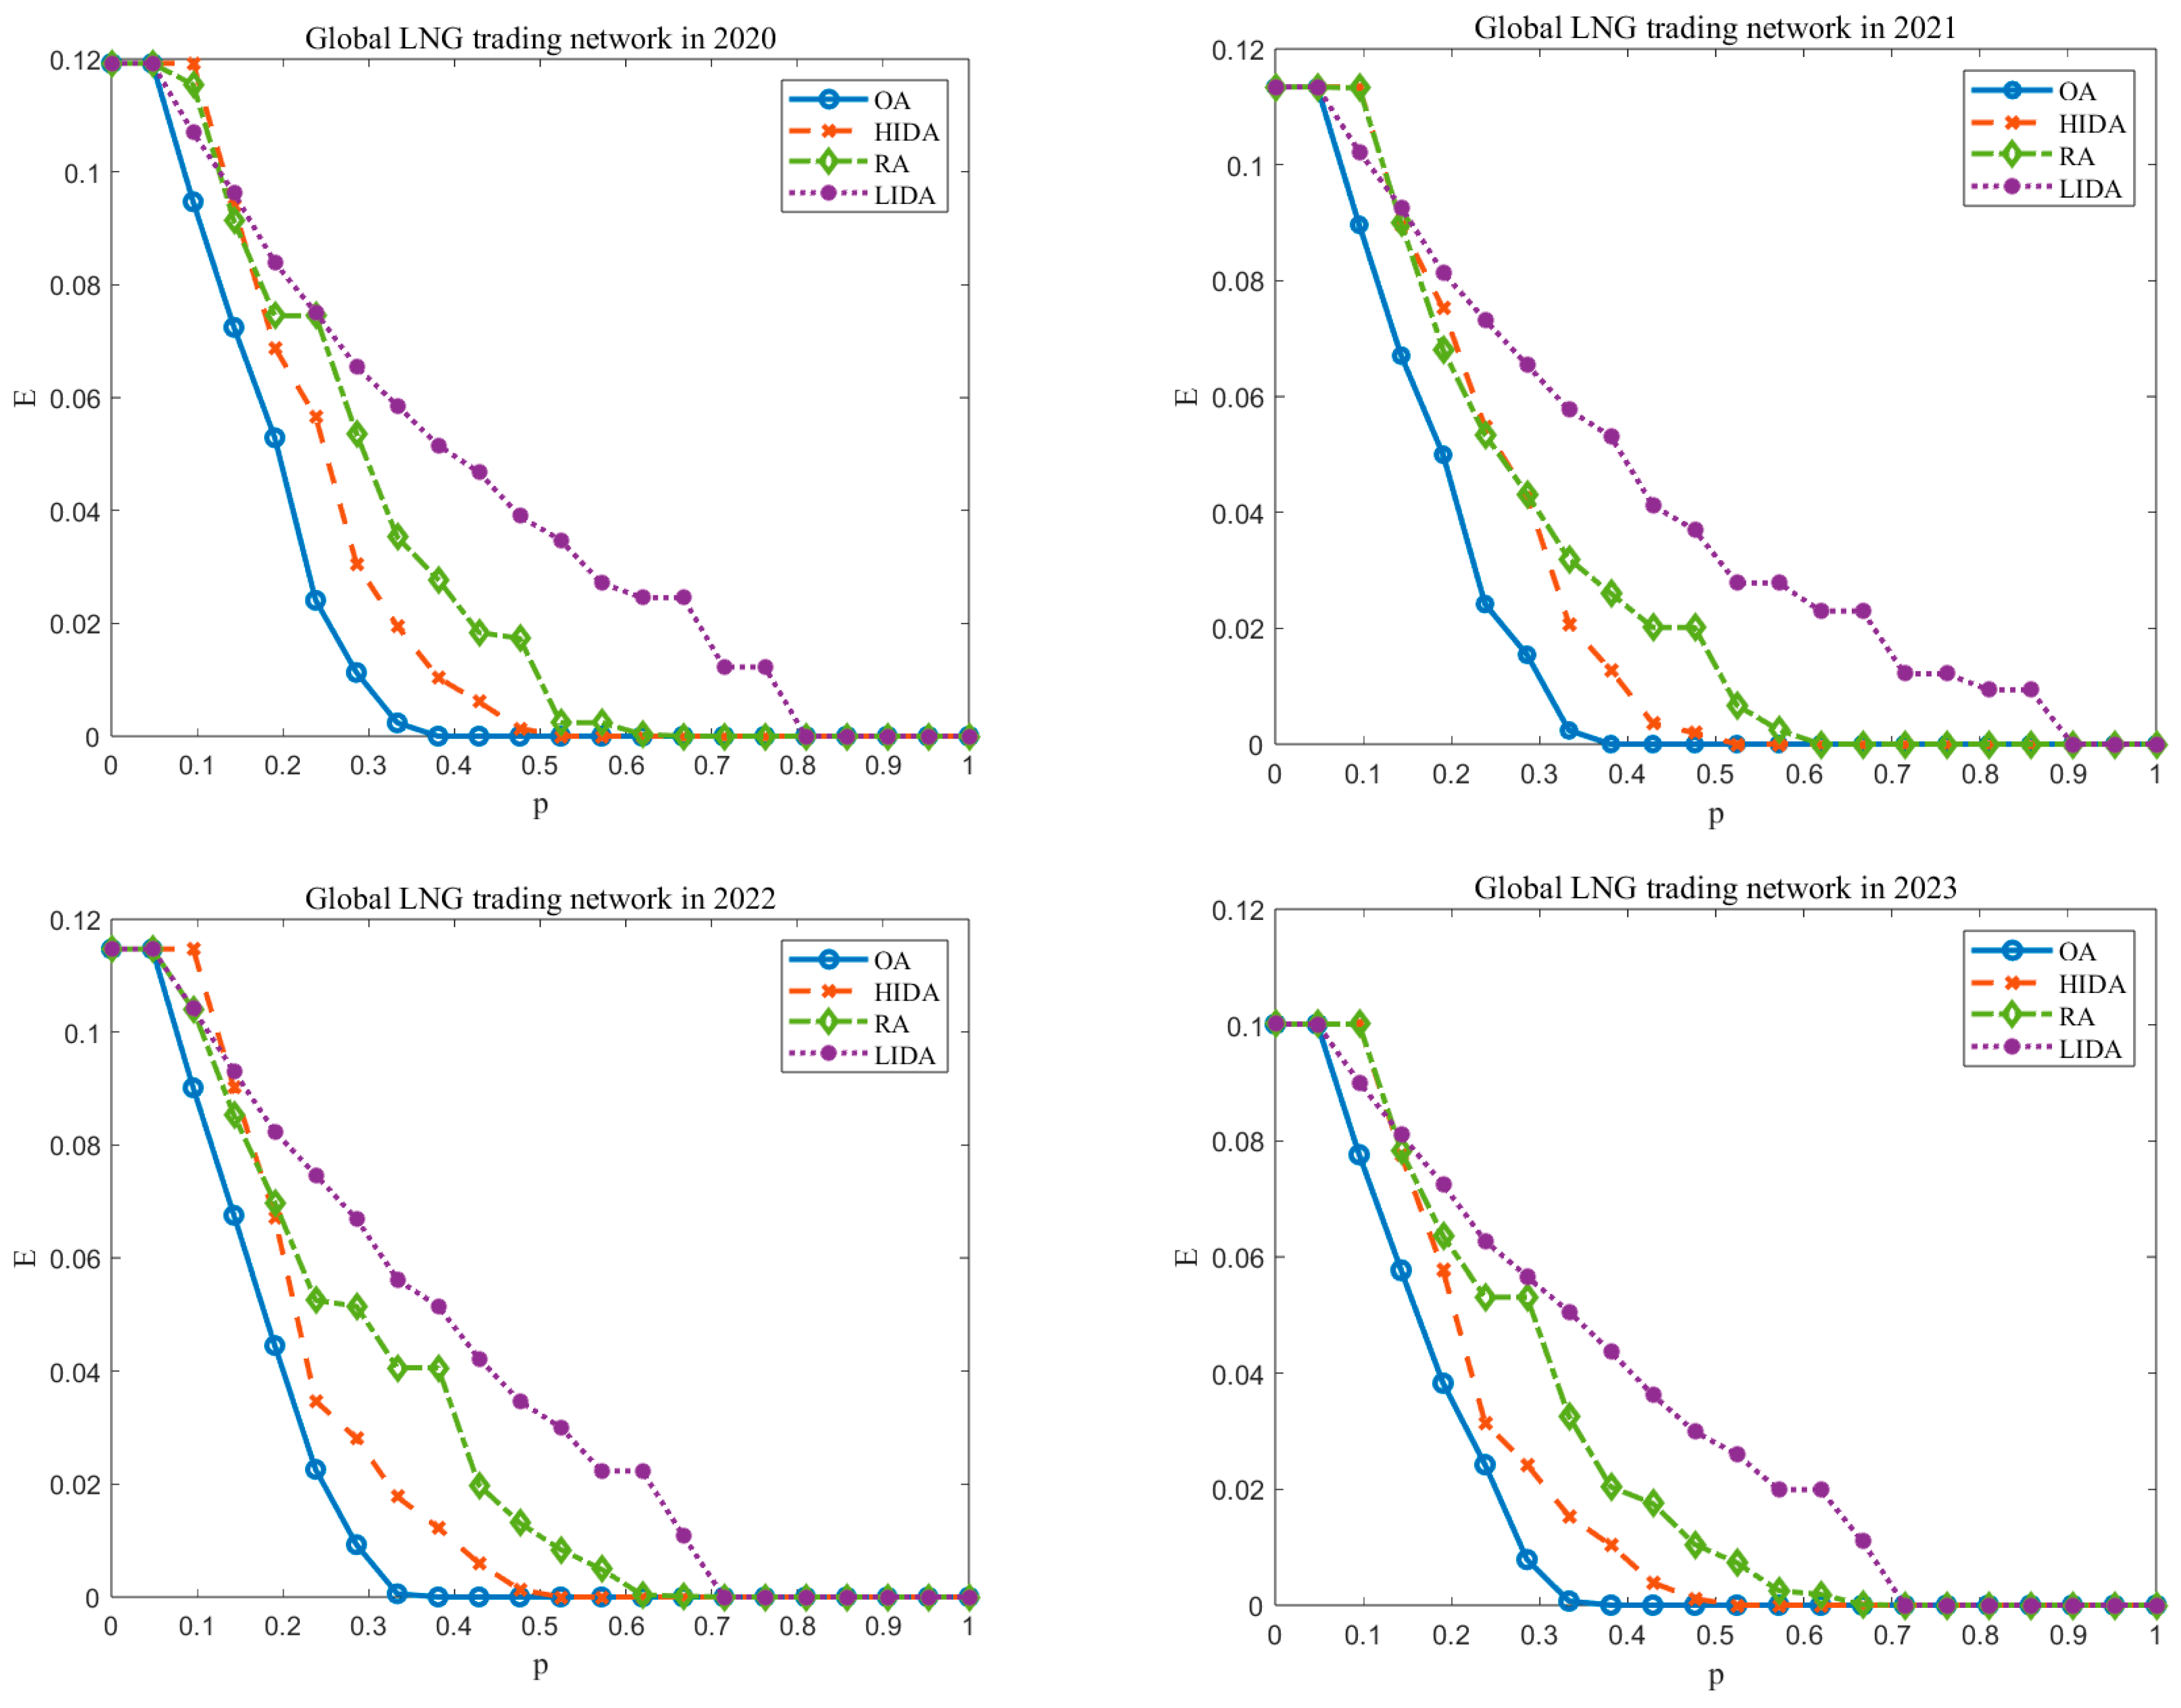
To assess the impact of the Russia–Ukraine conflict on the robustness of the global LNG trade network, this study employs simulated attack strategies to analyze changes in network robustness under varying attack budgets. The horizontal axis represents the attack budget coefficient, ranging within [0, 1], with the upper limit of the attack budget varying accordingly. The vertical axis shows both network efficiency and the size of the largest connected component, where lower values of these indicators reflect reduced network robustness.
Assuming an attack cost factor of 1 and determining node importance based on weighted degree centrality, we confirm that this approach effectively captures node connectivity. However, real-world LNG trade networks involve additional factors influencing node importance, which we further verify. First, a correlation analysis between weighted degree centrality and national economic strength reveals that countries with higher weighted degree centrality tend to have stronger economies, suggesting that centrality is a reasonable proxy for a country’s significance in LNG trade. Moreover, we examine the influence of energy strategy on node importance. A review of various national LNG trade policies indicates that countries with strategic energy roles typically exhibit higher weighted degree centrality. Hence, we conclude that using weighted degree centrality to indicate node significance is theoretically and empirically justifiable.
As shown in Figure 3, for network efficiency, when p < 0.05, there is no significant decline across all attack strategies, indicating that key nodes and pathways remain intact, thereby preserving overall network robustness. As p increases to the range of 0.05 < p < 0.35, the optimal attack (OA) strategy identifies and targets critical nodes and pathways at minimal cost, causing a sharp reduction in network efficiency. When p approaches 0.35, network efficiency is nearly reduced to zero, highlighting the network’s heavy reliance on key nodes. At this stage, robustness deteriorates most rapidly under the OA strategy. Beyond p > 0.35, the high-importance attack (HIDA) strategy also induces a steep decline in efficiency, gradually converging with the OA strategy’s impact. The random attack (RA) strategy follows while the low-importance attack (LIDA) strategy causes the slowest deterioration.
As shown in 
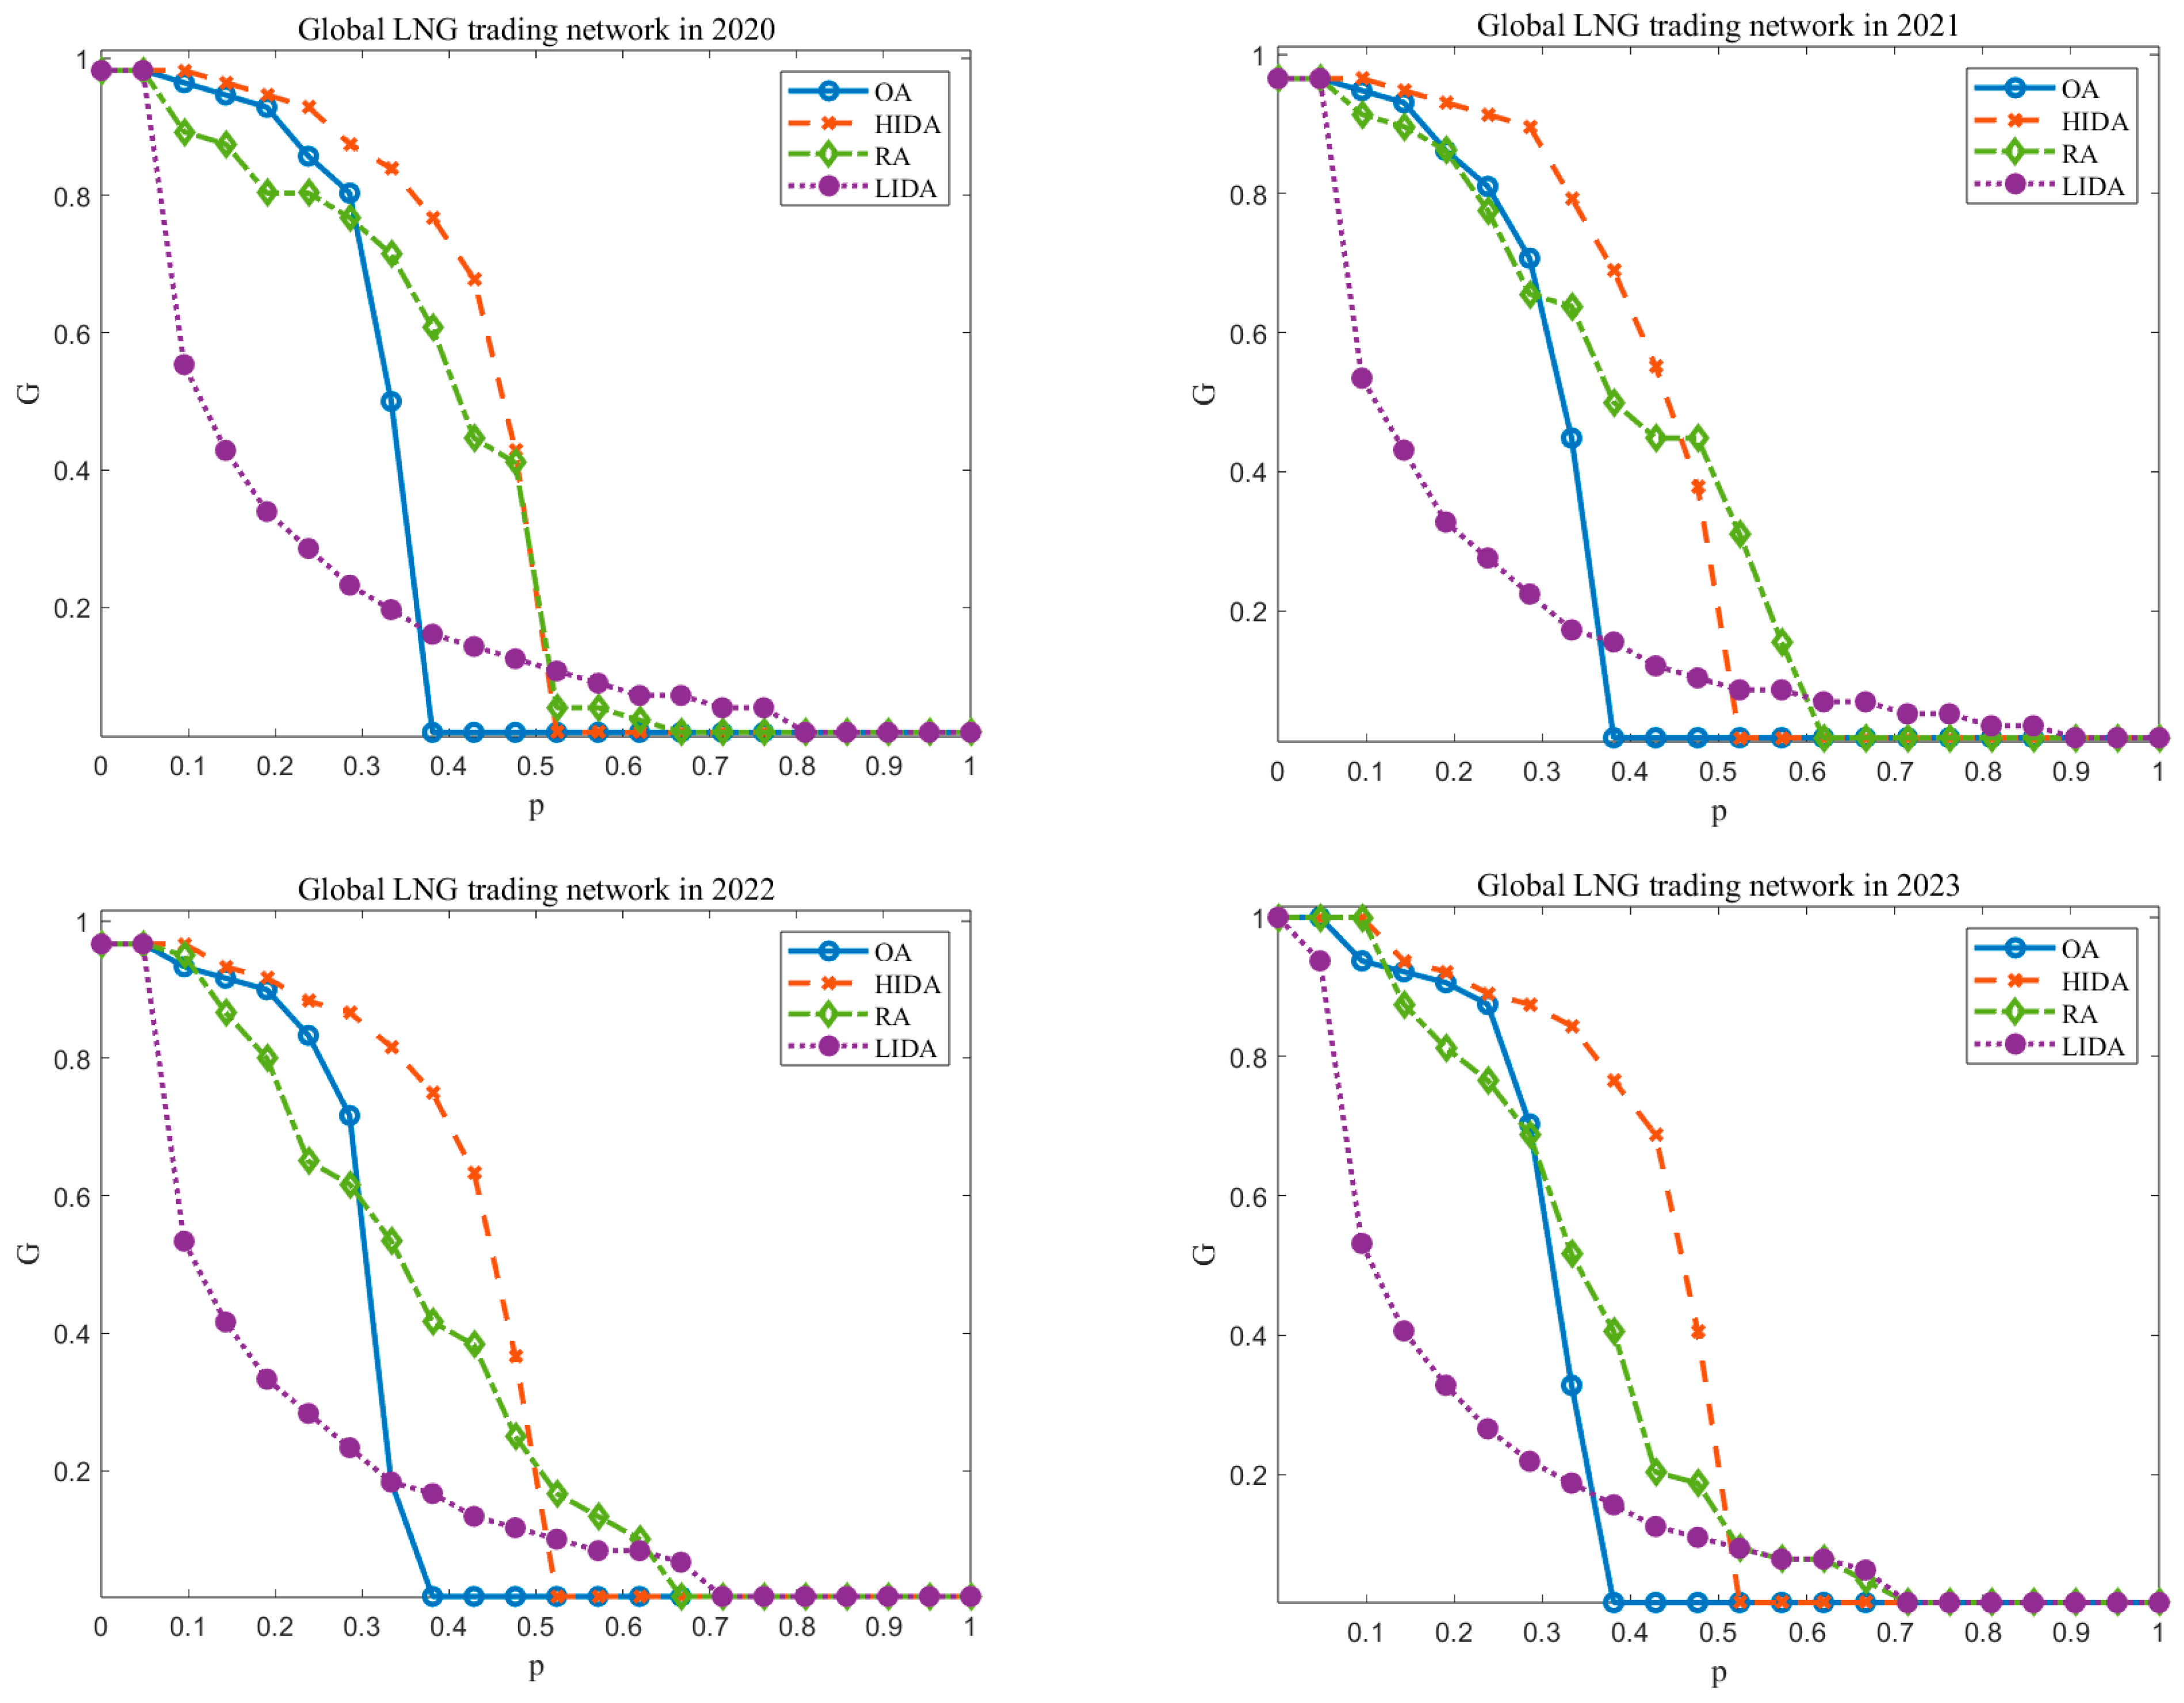
Figure 4, regarding the largest connected component, when p < 0.05, there is minimal reduction across all attack strategies, suggesting strong structural resilience. As p increases to 0.05 < p < 0.4, the LIDA strategy leads to the fastest initial decline in robustness, followed by the RA strategy. These strategies prioritize low-cost nodes, allowing more to be attacked within the budget. When p > 0.4, the OA strategy induces the most severe degradation, and as p approaches 0.4, the largest connected component nearly collapses. At this stage, the HIDA strategy also significantly reduces robustness, increasingly aligning with the OA strategy’s performance. Although the LIDA strategy causes rapid initial degradation, its impact plateaus as p rises, ultimately reducing the largest connected component to zero.
Integrating the results from network efficiency and the largest connected component, we find that network robustness is highly sensitive to attack strategy, exhibiting clear phase transitions. Different strategies lead to varied decline rates: the OA strategy triggers the fastest breakdown, followed by the HIDA and RA strategies, while the LIDA strategy causes the slowest deterioration. This pattern reflects the scale-free nature of the network, where the OA strategy achieves maximal disruption at minimal cost, exerting the most substantial impact on robustness. Although the HIDA strategy also targets critical nodes, its less optimized selection sequence limits its effectiveness compared to the OA strategy. Meanwhile, the RA and LIDA strategies result in gradual robustness loss due to their random or non-targeted approaches.
(2) Analysis in the Context of the Russia–Ukraine Conflict
The global LNG trade network exhibits substantial robustness under low attack budgets (p < 0.05), where key nodes and pathways remain largely unaffected, and the overall network structure remains intact. This implies the existence of alternative trade routes within the network. Due to its structural resilience, resource reallocation capacity, and collaborative functioning of substitute nodes and paths, the network maintains basic trade flow efficiency, mitigating disruptions’ effects and ensuring continued operation.
Under moderate attack budgets (0.05 < p < 0.4), if the LIDA strategy is applied—targeting low-cost nodes—the largest connected component is rapidly disrupted, obstructing trade flows and leading to a sharp drop in robustness. When the OA strategy is employed, critical pathways, key countries, and essential routes are precisely targeted, resulting in concentrated and severe disruptions that quickly undermine network efficiency and connectivity. The HIDA and RA strategies also degrade the network, compounding the impact and broadening the scope of vulnerability. These findings reveal that the network is highly reliant on a few key nodes and routes, making it susceptible to deliberate, targeted disruptions. Moreover, targeting low-cost nodes exposes weaknesses in redundancy and decentralization, as insufficient alternative routes exist to buffer localized failures, thereby accelerating the decline in robustness.
When the attack budget is high (p > 0.4), the OA strategy continues to inflict severe disruptions, while other strategies produce substantial damage. The combined impact of these strategies further erodes the robustness of the global LNG trade network, significantly affecting core countries and strategic routes. As network efficiency and connectivity collapse, the network loses its capacity for self-repair and becomes unable to withstand sustained or compound attacks. Even peripheral countries and marginal routes are impacted, contributing to system-wide instability and accelerating network failure.
As the attack budget approaches its upper bound, the OA strategy reduces network efficiency and the largest connected component to near zero, indicating almost complete network collapse. Other strategies also contribute to this failure, exposing the extreme vulnerability of the network under intensive and coordinated attacks with limited resistance capacity.
In conclusion, the Russia–Ukraine conflict substantially compromises the robustness of the global LNG trade network. The network’s vulnerabilities—including reliance on low-cost configurations, concentration on critical nodes, and fragility under high-budget attacks—highlight its susceptibility to targeted disruptions and structural weaknesses in times of geopolitical crisis.

5.2. Impact of Conflict Phases on Network Robustness Amid the Russia–Ukraine Conflict

(1) Assessing Network Robustness Across Different Stages
Following the method outlined in 
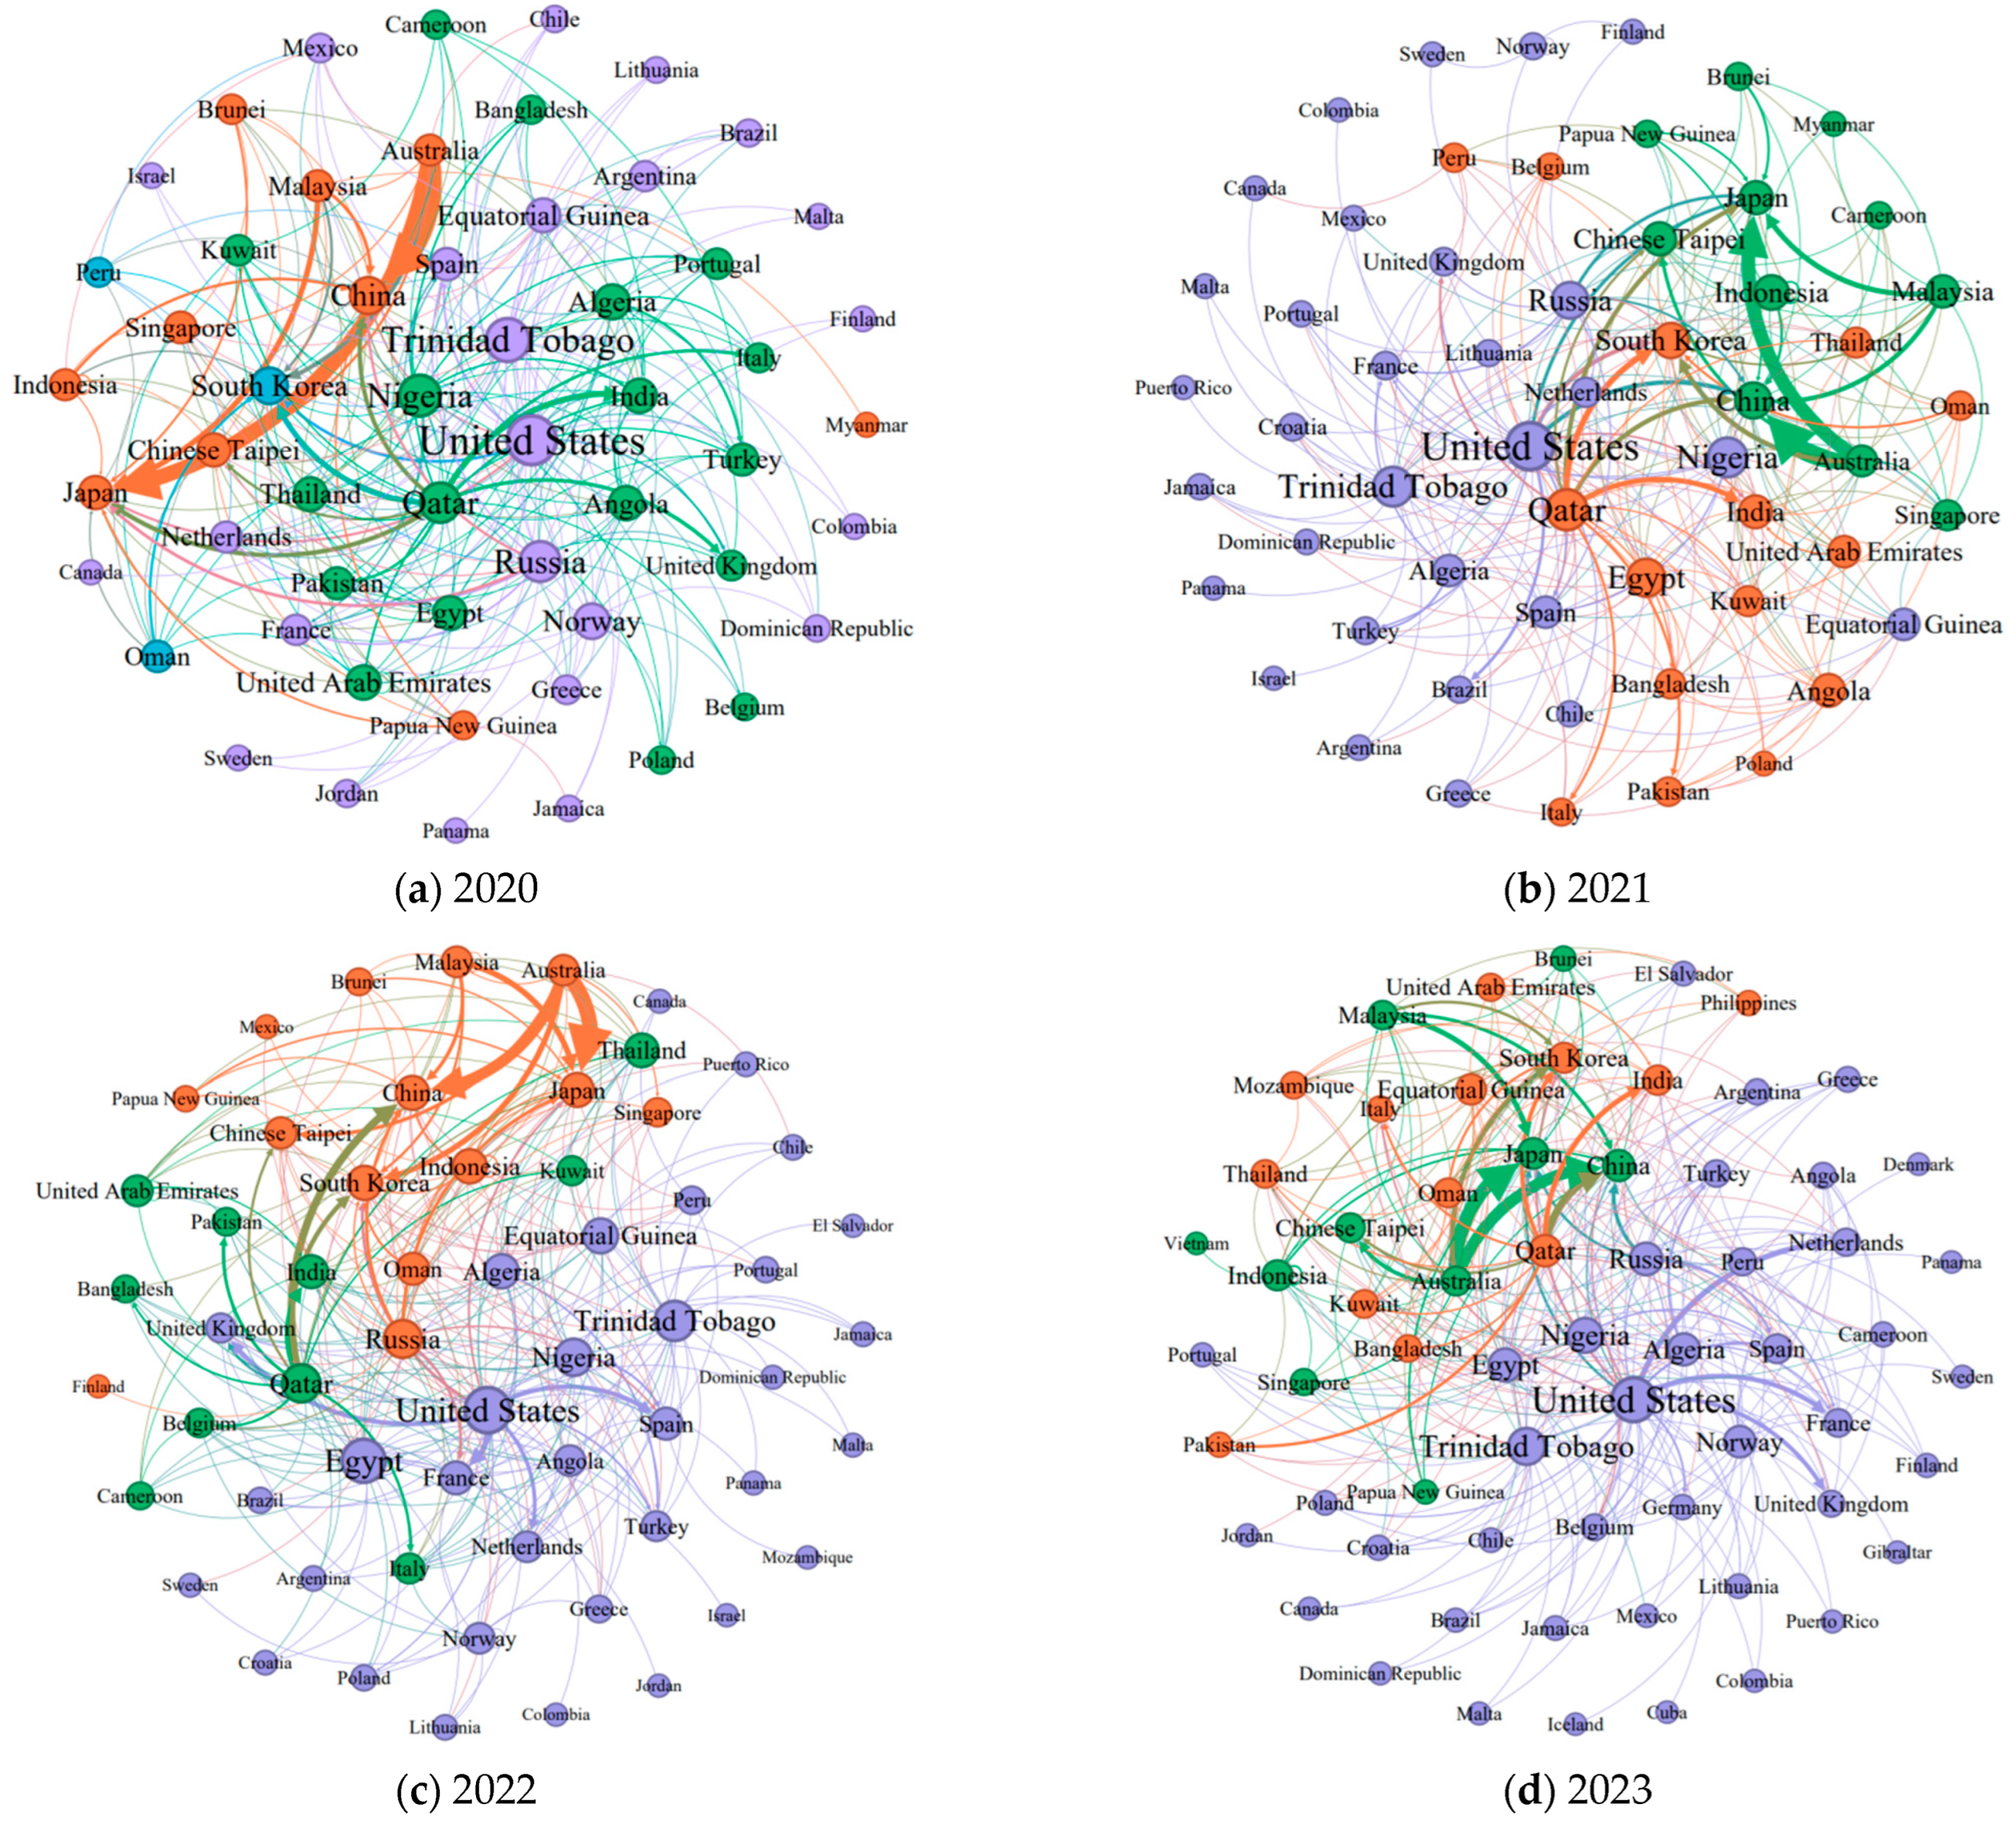
Section 5.1, this section examines the robustness of the global LNG trade network from 2020 to 2023 under simulated attack scenarios. By comparing network performance across different years under consistent attack strategies, we aim to identify the long-term structural impacts of the Russia–Ukraine conflict on network robustness.
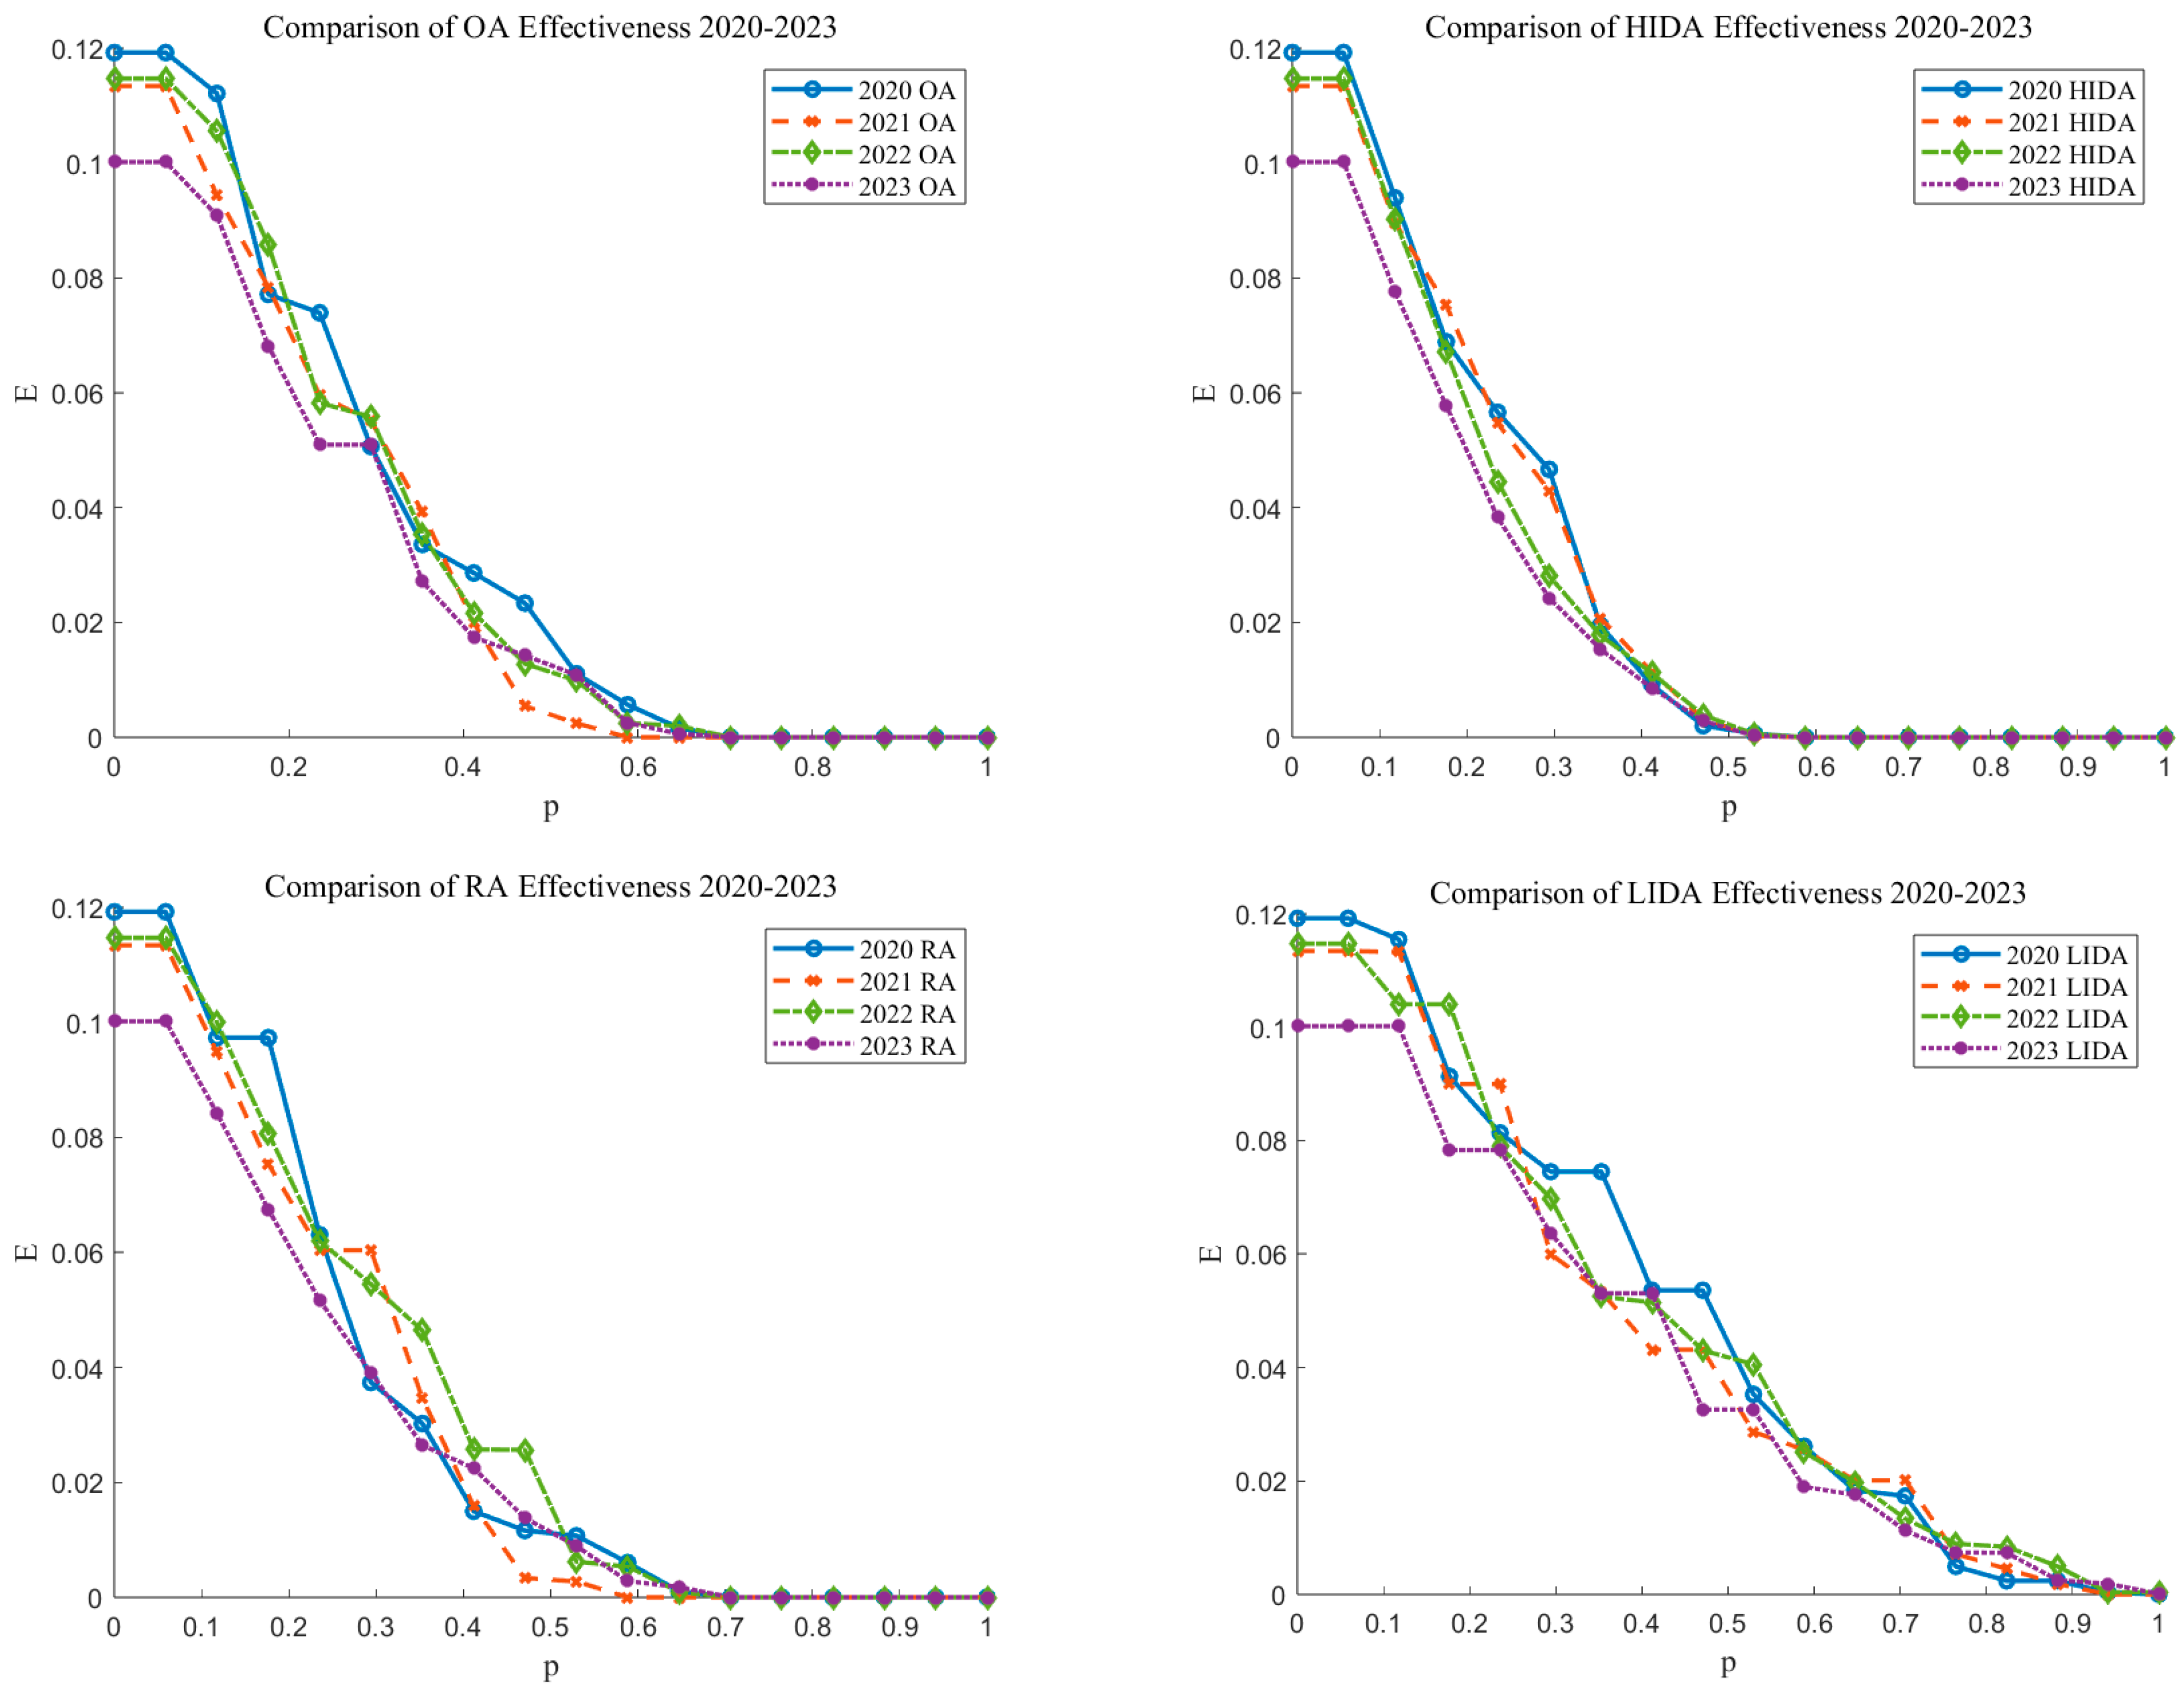
As shown in 
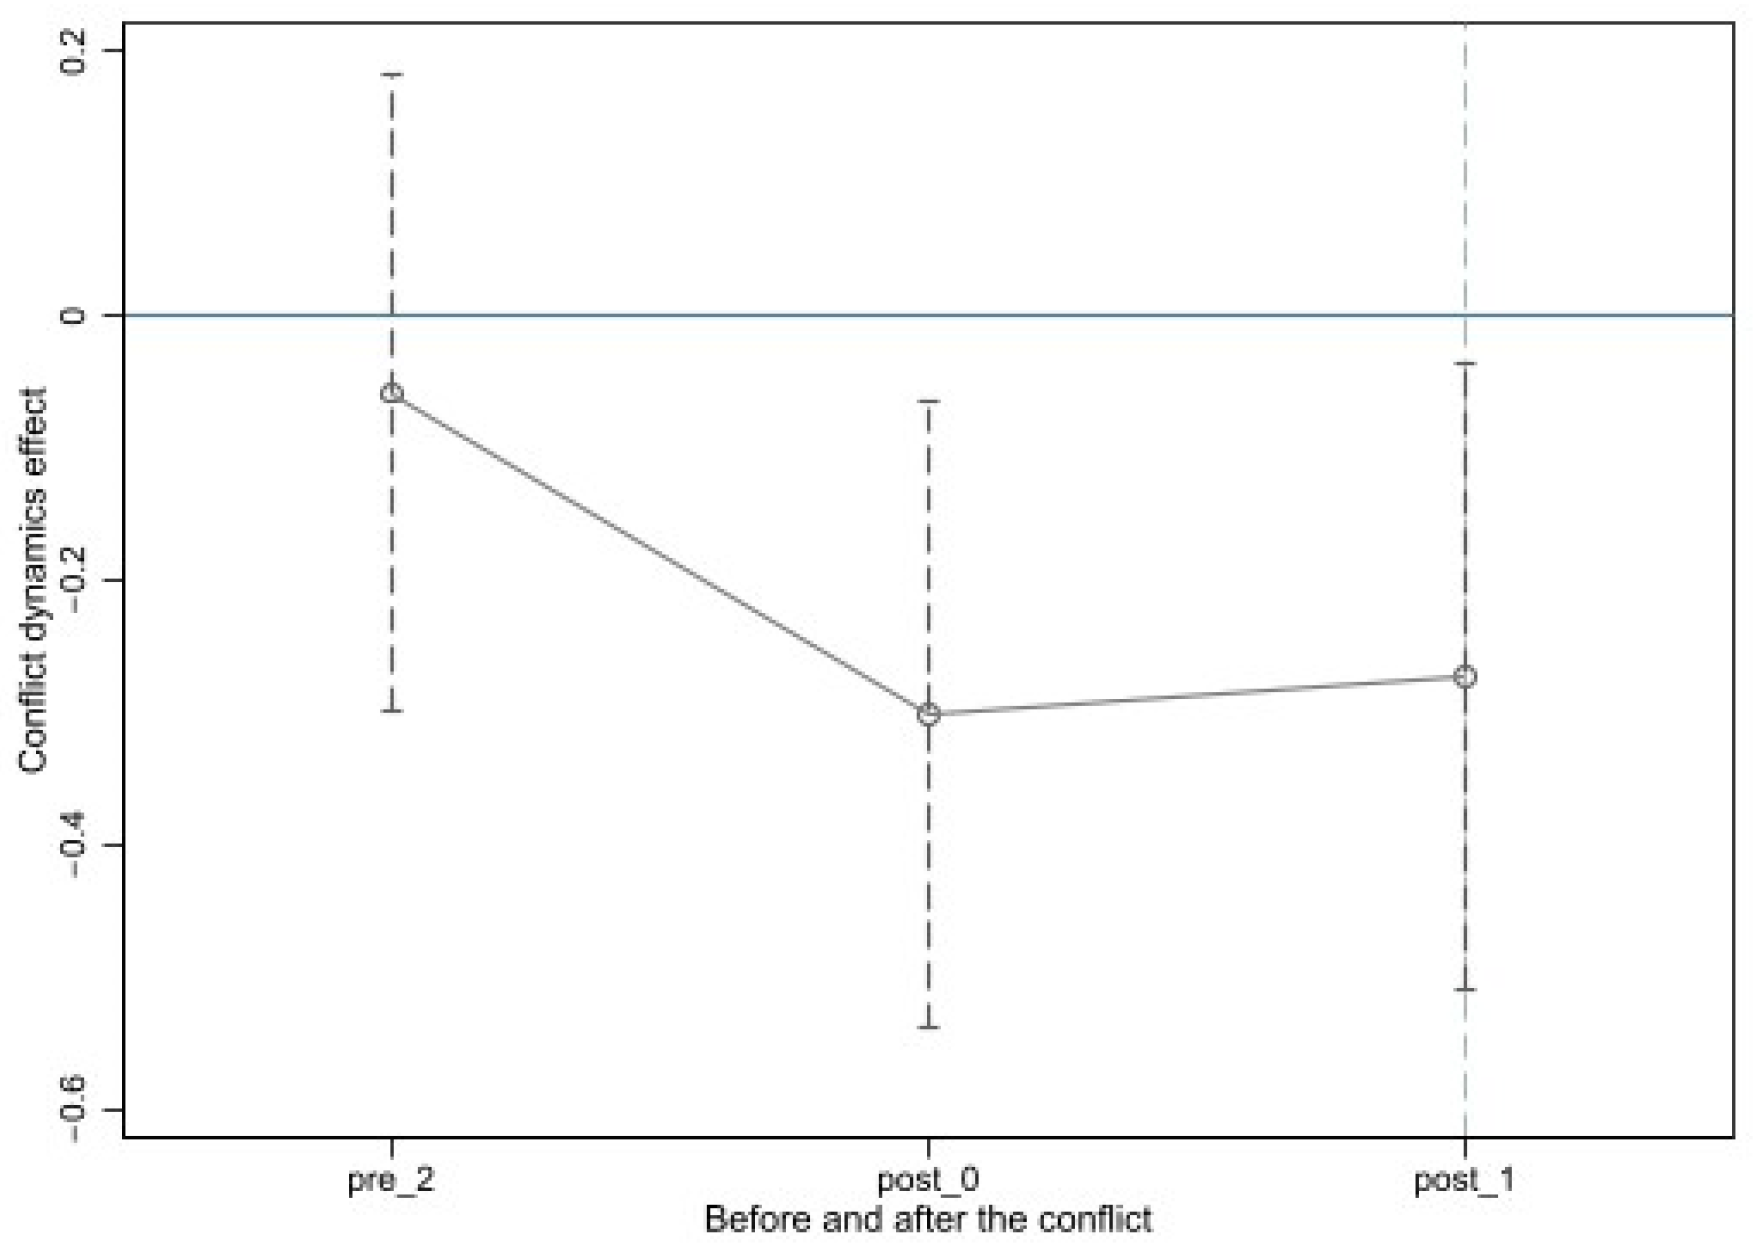
Figure 5, the impact of the conflict on network robustness intensified progressively over time. Across all attack strategies, the network experienced the slowest decline in efficiency in 2020, indicating the highest level of robustness. This suggests that, under identical attack conditions, the network was more capable of maintaining functional performance and structural coherence. However, in 2021 and 2022, network robustness weakened, though it still retained a certain level of resilience. By 2023, the network showed the most rapid decline in efficiency and the lowest robustness, with stability and recovery capacity reduced to their weakest levels under attack.
(2) Analysis in the Context of the Russia–Ukraine Conflict
Before the Russia–Ukraine conflict (2020–2021), the global LNG trade network exhibited substantial robustness. Both network efficiency and the size of the largest connected component declined only moderately, even under various attack strategies. During this period, the global energy market remained relatively stable, geopolitical tensions had not yet escalated significantly, and LNG trade relationships among countries were generally robust. Most LNG-importing countries had not yet diversified away from Russian LNG, as demand patterns and supply chains remained relatively unchanged. Key trade routes remained intact, and multiple alternative pathways ensured continued trade flow. Despite increasing attack budget coefficients, the network maintained high connectivity and efficiency, demonstrating its capacity to absorb moderate disruptions without collapse.
With the outbreak of the conflict in 2022, the robustness of the global LNG trade network began to deteriorate significantly. Both network efficiency and the size of the largest connected component experienced accelerated declines, especially under high-importance attack (HIDA) and optimal attack (OA) strategies. The network’s vulnerabilities became increasingly evident. On the one hand, Russia’s capacity as a major LNG exporter was compromised, weakening its role in the global energy supply. On the other hand, geopolitical tensions prompted importing countries to reduce reliance on Russian LNG, seeking alternative sources and suppliers. This shift triggered a reconfiguration of trade routes, reshaping the network’s topology and redistributing key nodes and pathways. As a result, network connectivity and structural stability were significantly undermined.
As the conflict persisted into 2023, network robustness continued to erode. The network became increasingly vulnerable under all attack strategies, and, even at low attack budgets, connectivity and transmission efficiency declined sharply. Ongoing disruptions and rerouting efforts further weakened the network’s structural integrity. The volatility of the global energy market compounded these challenges, making connections between nodes more unstable and reducing the effectiveness of alternative pathways. Moreover, the network had not recovered from the initial disruptions, and its self-repair capability remained constrained by continuing geopolitical instability. These factors jointly contributed to the network’s heightened susceptibility to attack and sustained degradation of robustness.
In conclusion, the Russia–Ukraine conflict has had a profoundly negative impact on the robustness of the global LNG trade network. Before the conflict, the network demonstrated strong resilience and could withstand a range of attack scenarios. However, as the conflict escalated, robustness consistently declined, with critical nodes and pathways disrupted and the network structure undergoing fundamental changes. A comparative analysis of the different phases of the conflict reveals three primary mechanisms through which robustness was undermined: (1) the inability of Russia’s alternative suppliers to promptly compensate for lost supply, resulting in reduced network connectivity and structural imbalance; (2) the reconfiguration of trade routes, which distorted trade flow distribution and increased overall vulnerability; and (3) the rise in negative correlations within the network, leading to structural fragmentation and making key nodes more exposed to targeted attacks, thereby accelerating the decline in robustness.

6. Empirical Analysis of the Russia–Ukraine Conflict’s Impact on the Robustness of the Global LNG Trade Network

This section employs a difference-in-differences (DID) approach to evaluate changes in the robustness of the global LNG trade network before and after the onset of the Russia–Ukraine conflict. By defining treatment and control groups, distinguishing between pre- and post-conflict periods, and controlling for potential confounding factors, we aim to identify the conflict’s significant influence on network robustness.

6.1. Study Design

(1) Model Construction
The Russia–Ukraine conflict is treated as a quasi-natural experiment, and a high-dimensional fixed effects (HDFE) linear regression model is employed to control for unobserved heterogeneity at the national level. The model is specified as follows:
Y i t = α + β · P o s t W a r t · T r e a t m e n t i + γ · P o s t W a r t + δ · T r e a t m e n t i + X i t · θ + ε i t
where i and t represent the country or region and the year, respectively. The dependent variable, Y i t , measures the robustness of each country’s LNG trade. A time dummy variable, P o s t W a r t , takes one after the conflict and zero before. T r e a t m e n t i is the treatment group dummy variable, where countries or regions heavily impacted by the conflict are assigned a value of 1, and those less affected are assigned a value of 0. P o s t W a r t · T r e a t m e n t i is the main explanatory variable, X i t represents control variables, and ε i t is the error term.
(2) Variable Definitions
(a) Dependent Variable
Trade Dependence ( Y i t ): This variable, adapted from Yang et al. [43], measures the proportion of a country’s LNG imports from a specific exporter relative to its total LNG imports. It reflects a country’s vulnerability to supply disruptions from particular exporters, with higher dependence indicating lower network robustness. The formula is as follows:
D i , j , t = V i , j , t k V i , k , t
where D i , j , t is the dependence of country i on country j in year t; V i , j , t represents the LNG trade volume between countries i and j in year t; and k V i , k , t is the total LNG imports of country i in year t.
(b) Explanatory Variable
Countries or regions significantly affected by the Russia–Ukraine conflict ( P o s t W a r t · T r e a t m e n t i ): This variable represents the DID interaction term and captures the net effect of the conflict on the treatment group. If a country or region i is heavily impacted by the conflict in year t, this variable is set to 1, and 0 otherwise.
To define this variable, we construct an impact indicator based on changes in LNG trade flows, which reflect the extent to which a country’s LNG supply chain was affected. Following the onset of the conflict, several countries reduced their dependence on Russian LNG and increased imports from other suppliers. Based on these trade flow adjustments, countries are categorized into T r e a t m e n t i and control groups using IGU LNG Annual Report data. If a country experiences a significant change in trade patterns, it is assigned to the treatment group (value = 1), indicating substantial exposure to the conflict. Otherwise, it is included in the control group (value = 0). A time dummy variable ( P o s t W a r t ) distinguishes pre- and post-conflict periods. If the year is 2022 or 2023, P o s t W a r t = 1; otherwise, it is 0. The core explanatory variable is the interaction term ( D I D i t ) between the T r e a t m e n t i dummy and the time dummy P o s t W a r t , which equals 1 only if country i is in the treatment group during the post-conflict period, indicating a significant impact from the conflict.
(c) Control Variables
LNG Importing Country ( I m p o r t e r ) and LNG Exporting Country ( E x p o r t e r ): These variables control for heterogeneity in country-specific LNG trade behaviors, accounting for characteristics of both importing and exporting countries.
(3) Data Sources and Descriptive Statistics
We use panel data covering global LNG trade from 2020 to 2023 and original data from the IGU LNG Annual Report. Table 8 presents the descriptive statistics for each variable.

6.2. Empirical Findings and Interpretation

(1) Baseline Regression Results and Analysis
We conduct a DID regression analysis to assess the impact of the Russia–Ukraine conflict on the robustness of the global LNG trade network, controlling for both country and time-fixed effects. As shown in Table 9, the coefficient of the DID interaction term is −0.0040813, which is statistically significant at the 1% level. This result indicates that the conflict led to a 0.0040813-point decrease in the robustness index, as measured by trade dependence.
Before the conflict, global LNG trade flows were relatively stable, and countries’ import patterns exhibited low volatility. However, after the conflict began, Russia’s position as a major LNG exporter was substantially weakened, and trade flows were realigned. Many countries have decreased their dependence on Russian LNG and have turned to alternative suppliers, such as the United States and Qatar. This shift heightened supply chain complexity and price volatility, reducing the network’s overall robustness. The increased reliance on fewer alternative suppliers and longer-distance routes also raised the risk of localized disruptions and compromised the resilience of the global LNG system in the face of geopolitical shocks.
(2) Robustness Tests
To ensure the reliability of the DID model, two robustness tests are conducted: the parallel trends test and the placebo test.
(a) Parallel Trends Test
To validate the key assumption of the DID model, the parallel trends assumption must be satisfied—that is, the treatment and control groups should exhibit similar trends prior to the conflict. An event study approach is adopted, where the interaction between a series of time dummy variables and the treatment group dummy serves as the core explanatory variable, while holding other control variables constant. The regression specification is given as follows:
Y i t = β 0 + s = 2 1 β s × D s + β 1 · X i t + ε i t ( t 1 )
Here, Ds denotes a set of time dummies with the subscript s ranging from −2 to 1. Negative values indicate pre-conflict years, positive values represent post-conflict years, and s = 0 corresponds to the year the conflict began. The year immediately prior to the conflict (s = −1) is used as the baseline to avoid multicollinearity.
As illustrated in Figure 6, the estimated coefficients for the pre-conflict period (s = −2) are close to zero, and their confidence intervals include zero, indicating no significant difference between treatment and control groups prior to the conflict. However, the coefficient at s = 0 drops sharply and becomes statistically significant, confirming the immediate adverse effect of the Russia–Ukraine conflict on network robustness. The effect persists post-conflict (s = 1), suggesting sustained adverse impacts.
(b) Placebo Test
To address concerns about potential bias from unobserved factors, a placebo test is performed using a counterfactual setup. The sample is randomly split into pseudo-treatment and pseudo-control groups, and the baseline regression is re-estimated. This process is repeated 500 times, and the distributions of the estimated coefficients, t-values, and p-values are plotted using kernel density estimation. As shown in Figure 7, the simulated coefficients follow a normal distribution centered around zero and deviate substantially from the observed DID coefficient (−0.0040813). Moreover, the t-values and p-values generated from the placebo tests are statistically insignificant, while the actual t-values are considerably larger and the p-value markedly lower than those of the simulated results. These findings support the conclusion that the observed treatment effect is not driven by random variation or omitted variables but reflects a genuine causal impact of the conflict.

6.3. Empirical Summary

Overall, the empirical analysis based on the DID model provides robust evidence that the Russia–Ukraine conflict significantly weakened the robustness of the global LNG trade network. The DID interaction term is significantly negative, indicating that countries affected by the conflict experienced a marked decline in trade stability, as reflected by increased trade dependence. This suggests that geopolitical shocks disrupted established trade relationships and introduced persistent uncertainty into global LNG supply chains.
The model incorporates high-dimensional fixed effects to control for unobserved heterogeneity at the country level and passes multiple robustness checks, including the parallel trends test and placebo testing. The event study confirms that the treatment and control groups followed parallel trends before the conflict and that a clear structural break occurred in 2022, consistent with the conflict’s onset. The placebo test further supports the causal inference, indicating that the observed effect does not result from random variation or unobservable confounders.
Importantly, the observed effects are not limited to short-term disruptions but reflect more profound structural changes in the architecture of the global LNG trade network. As countries reduced their reliance on Russian LNG, trade flows became increasingly concentrated toward alternative suppliers—notably the United States and Qatar—thereby introducing new dependencies and forms of vulnerability into the system. These findings are consistent with earlier simulation results and reinforce the conclusion that the global LNG trade network remains fragile under targeted or large-scale disruptions.

7. Conclusions and Implications

7.1. Conclusions

This study examines the impact of the Russia–Ukraine conflict on the robustness of the global LNG trade network by combining complex network simulation with a difference-in-differences (DID) empirical approach. Based on LNG trade data from 2020 to 2023, we construct weighted and directed annual trade networks to explore their structural characteristics and assess robustness under multiple node removal strategies, including random, targeted, and optimal attacks under varying budget constraints.
The results reveal that the global LNG trade network exhibits a typical core–periphery structure with stable modularity, where countries such as the United States, Qatar, and Russia occupy key central positions. Despite the ongoing expansion in trade volume and network size, the network remains structurally fragile. As the conflict escalates, network efficiency and the relative size of the largest connected component decline more sharply—especially under the optimal attack (OA) scenario—indicating heightened vulnerability and a rapid loss of robustness. These results highlight systemic risks stemming from overreliance on a limited number of core nodes and underscore the network’s limited resilience in the face of geopolitical disruptions.
The DID-based empirical analysis further supports the study’s main conclusion: the Russia–Ukraine conflict significantly weakened the robustness of the global LNG trade network. The treatment effect is statistically significant and validated through both placebo and parallel trend tests, providing robust evidence that geopolitical shocks can compromise global trade systems’ structural integrity and functional resilience.
Nonetheless, several limitations should be noted: (1) The research period from 2020 to 2023 may not fully capture the long-term impacts of the Russia–Ukraine conflict. Previous studies suggest that the conflict has triggered more profound structural shifts and prolonged regional instability [27,28], which may further affect network robustness beyond the study’s time frame. Future research could extend the observational window to assess delayed or cumulative effects. (2) Although the analysis is based on authoritative data from the IGU LNG Annual Reports, potential gaps in data coverage or reporting delays could influence the results’ accuracy and generalizability. Incorporating high-frequency or near-real-time data from sources such as the IEA or satellite-based tracking platforms could enhance future analyses regarding precision and timeliness. (3) This study does not account for Russia’s LNG fleet expansion strategy, which could enable it to bypass Western sanctions and reshape trade dynamics. Due to data limitations and scope constraints, this factor is excluded from the current analytical framework. Future research could integrate maritime tracking data or fleet deployment records to more accurately assess its implications for network robustness.

7.2. Implications

This study offers both theoretical and practical insights into enhancing the robustness of the global LNG trade network.
From a theoretical perspective, it contributes to the literature by bridging complex network analysis with quasi-experimental causal inference. While previous studies often examined network structure or econometric effects in isolation, this study integrates both approaches to capture potential vulnerabilities under simulated shocks and the actual impacts of real-world geopolitical events. This hybrid framework provides a more comprehensive and policy-relevant perspective for evaluating the resilience of complex trade systems.
From a practical standpoint, the findings yield actionable recommendations for policymakers, energy planners, and industry stakeholders. The demonstrated fragility of the LNG trade network under high-importance or optimal attack strategies, along with observed trade realignments triggered by the Russia–Ukraine conflict, underscores the urgent need to construct a more resilient, diversified, and adaptable LNG trade system.
To enhance the robustness of the global LNG trade network, countries should consider the following strategies:
First, prioritize the diversification of energy partnerships by building strategic alliances with multiple LNG-exporting countries. Reducing dependence on a single supplier can mitigate geopolitical risks and promote alternative trade pathways. Expanding cooperation across regions and contract structures can improve supply chain flexibility and network resilience.
Second, strengthen regional coordination mechanisms and develop comprehensive emergency response plans. Initiatives such as regional LNG trading blocs, joint infrastructure investment, and early warning systems can enhance collective preparedness and maintain supply stability during disruptions. These efforts also help preserve network connectivity and reduce fragmentation during crises.
Third, investment in LNG infrastructure should be increased to support resilient and efficient trade flows. This includes expanding LNG import terminals and underground storage, promoting carbon capture and storage (CCS) at production sites, developing small-scale LNG carriers and flexible maritime logistics. Such improvements will enhance physical connectivity and the system’s adaptability to supply shocks.
Fourth, advocate for developing and internationally harmonizing clean LNG technologies and trade standards. Encouraging the adoption of low-carbon LNG, standardizing emissions accounting and certification procedures, and promoting digitalization of LNG trading operations will strengthen LNG’s role in the global energy transition. These efforts also help enhance the credibility, transparency, and sustainability of LNG in international energy markets.

Author Contributions

Conceptualization, R.M. and Z.H.; Software, R.M.; Formal analysis, R.M.; Investigation, Z.H.; Data curation, R.M.; Writing—original draft, R.M.; Writing—review & editing, Z.H.; Visualization, R.M.; Supervision, Z.H.; Project administration, Z.H. All authors have read and agreed to the published version of the manuscript.

Funding

This research received no external funding.

Data Availability Statement

The original data presented in the study are openly available in International Gas Union. World LNG Report. 2021–2024. at https://www.igu.org.

Conflicts of Interest

The authors declare no conflict of interest.

References

  1. International Gas Union. World LNG Report. 2021–2024. Available online: https://www.igu.org (accessed on 1 November 2024).
  2. China Petrochemical News. LNG Is Hot, Natural Gas Trade Pattern Faces Deep Adjustment. 2023. Available online: http://www.sinopecnews.com.cn (accessed on 2 January 2025).
  3. Mei, Q.; Hu, Q.; Liu, X.; Zhao, R.; Yang, C.; Wang, P.; Qi, Y.; Yang, Y.; Yuan, Q. Research on the evolution of Global LNG maritime transportation network and trade condition of China. J. Geo-Inf. Sci. 2022, 24, 1701–1716. [Google Scholar]
  4. Zheng, S.; Zhou, X.; Tan, Z.; Zhang, H.; Liu, C.; Hao, H.; Hu, H.; Cai, X.; Yang, H.; Luo, W. Preliminary study on the global impact of sanctions on fossil energy trade: Based on complex network theory. Energy Sustain. Dev. 2022, 71, 517–531. [Google Scholar] [CrossRef]
  5. Chowdhury, P.R.; Medhi, H.; Bhattacharyya, K.G.; Hussain, C.M. Severe deterioration in food-energy-ecosystem nexus due to ongoing Russia-Ukraine war: A critical review. Sci. Total Environ. 2023, 902, 166131. [Google Scholar] [CrossRef]
  6. Xiao, R.; Zhao, P.; Huang, K.; Ma, T.; He, Z.; Zhang, C.; Lyu, D. Liquefied natural gas trade network changes and its mechanism in the context of the Russia-Ukraine conflict. J. Transp. Geogr. 2025, 123, 104101. [Google Scholar] [CrossRef]
  7. Meza, A.; Ari, I.; Al Sada, M.; Koç, M. Disruption of maritime trade chokepoints and the global LNG trade: An agent-based modeling approach. Marit. Transp. Res. 2022, 3, 100071. [Google Scholar] [CrossRef]
  8. Xiao, R.; Xiao, T.; Zhao, P.; Zhang, M.; Ma, T.; Qiu, S. Structure and resilience changes of global liquefied natural gas shipping network during the Russia-Ukraine conflict. Ocean Coast. Manag. 2024, 252, 107102. [Google Scholar] [CrossRef]
  9. Dong, Z.; Yang, Q. Analysis on the robustness of international grain trade network. Contemp. Econ. Manag. 2021, 43, 73–78. [Google Scholar]
  10. Hao, H.; Ma, Z.; Wang, A.; Xing, W.; Song, H.; Zhao, P.; Wei, J.; Zheng, S. Modeling and assessing the robustness of the lithium global trade system against cascading failures. Resour. Policy 2023, 85, 103822. [Google Scholar] [CrossRef]
  11. Li, N.; Song, Y.-R.; Wang, Y.; Ge, C.-B. Evolution, resilience and causes of global petroleum gas trade networks: 1995–2020. Pet. Sci. 2024, 21, 3656–3674. [Google Scholar] [CrossRef]
  12. Wei, N.; Xie, W.-J.; Zhou, W.-X. Robustness of the international oil trade network under targeted attacks to economies. Energy 2022, 251, 123939. [Google Scholar] [CrossRef]
  13. Ma, Y.; Wang, M.; Li, X. Analysis of the characteristics and stability of the global complex nickel ore trade network. Resour. Policy 2022, 79, 103089. [Google Scholar] [CrossRef]
  14. Yang, J.; Chen, W. Unravelling the landscape of global cobalt trade: Patterns, robustness, and supply chain security. Resour. Policy 2023, 86, 104277. [Google Scholar] [CrossRef]
  15. Mei, Q.; Hu, Q.; Yu, H.; Yang, Y.; Liu, X.; Huang, Z.; Wang, P. Structural analysis and vulnerability assessment of the European LNG maritime supply chain network (2018–2020). Ocean. Coast. Manag. 2024, 253, 107126. [Google Scholar] [CrossRef]
  16. Zhu, M.; Dong, P.; Ju, Y.; Fu, Z. Assessing economies’ resilience of international liquefied natural gas trade network in the presence of the ripple effect. Energy 2024, 313, 133491. [Google Scholar] [CrossRef]
  17. Animah, I.; Shafiee, M. Application of risk analysis in the liquefied natural gas (LNG) sector: An overview. J. Loss Prev. Process Ind. 2020, 63, 103980. [Google Scholar] [CrossRef]
  18. Filimonova, I.V.; Komarova, A.V.; Sharma, R.; Novikov, A.Y. Transformation of international liquefied natural gas markets: New trade routes. Energy Rep. 2022, 8, 675–682. [Google Scholar] [CrossRef]
  19. Yarlagadda, B.; Iyer, G.; Binsted, M.; Patel, P.; Wise, M.; McLeod, J. The future evolution of global natural gas trade. iScience 2024, 27, 108902. [Google Scholar] [CrossRef]
  20. Chen, S.; Xiao, Y.; Dai, Y.; Mi, J.J. The Evolution of the Global Liquefied Natural Gas (LNG) Seaborne Trade Network: A Complex Network Analysis. Procedia Comput. Sci. 2024, 242, 396–403. [Google Scholar] [CrossRef]
  21. Peng, P.; Lu, F.; Cheng, S.; Yang, Y. Mapping the global liquefied natural gas trade network: A perspective of maritime transportation. J. Clean. Prod. 2021, 283, 124640. [Google Scholar] [CrossRef]
  22. Meza, A.; Ari, I.; Al Sada, M.; Koç, M. Relevance and potential of the Arctic Sea Routes on the LNG trade. Energy Strategy Rev. 2023, 50, 101174. [Google Scholar] [CrossRef]
  23. Roudari, S.; Sadeghi, A.; Gholami, S.; Mensi, W.; Al-Yahyaee, K.H. Dynamic spillovers among natural gas, liquid natural gas, trade policy uncertainty, and stock market. Resour. Policy 2023, 83, 103688. [Google Scholar] [CrossRef]
  24. Wanyan, Z.; Zhang, H.; Wang, L. Analysis of characteristics of global LNG trade network and China’s LNG imports. China Min. Mag. 2022, 31, 1–13. [Google Scholar]
  25. Zwickl-Bernhard, S.; Neumann, A. Modeling Europe’s role in the global LNG market 2040: Balancing decarbonization goals, energy security, and geopolitical tensions. Energy 2024, 301, 131612. [Google Scholar] [CrossRef]
  26. Sassi, F. The (Un)Intended consequences of power: The global implications of EU LNG strategy to reach independence from Russian gas. Energy Policy 2025, 198, 114494. [Google Scholar] [CrossRef]
  27. Cong, L.; Zhang, H.; Wang, P.; Chu, C.; Wang, J. Impact of the Russia-Ukraine conflict on global marine network based on massive vessel trajectories. Remote Sens. 2024, 16, 1329. [Google Scholar] [CrossRef]
  28. Zhang, S.; Wang, L.; Ng, A.K.Y. Turning the ships around: The Russia-Ukraine conflict reshapes the US LNG maritime transportation network. Ocean Coast. Manag. 2024, 257, 107351. [Google Scholar] [CrossRef]
  29. Ke, R.; Wang, X.; Peng, P. Analysis of the impact of the Russia-Ukraine conflict on global liquefied natural gas shipping network. J. Mar. Sci. Eng. 2025, 13, 53. [Google Scholar] [CrossRef]
  30. Yusuf, N.; Govindan, R.; Al-Ansari, T. Energy markets restructure beyond 2022 and its implications on Qatar LNG sales strategy: Business forecasting and trend analysis. Heliyon 2024, 10, e27682. [Google Scholar] [CrossRef]
  31. Chyong, C.K.; Henderson, J. Quantifying the economic value of Russian gas in Europe in the aftermath of the 2022 war in Ukraine. Energy 2024, 292, 130604. [Google Scholar] [CrossRef]
  32. Zhang, S.; Wang, L. The Russia-Ukraine war, energy poverty, and social conflict: An analysis based on global liquified natural gas maritime shipping. Appl. Geogr. 2024, 166, 103263. [Google Scholar] [CrossRef]
  33. Balmaceda, M.; Högselius, P.; Johnson, C.; Pleines, H.; Rogers, D.; Tynkkynen, V.-P. Rethinking energy materialities in the shadow of Russia’s war on Ukraine. Energy Res. Soc. Sci. 2024, 117, 103678. [Google Scholar] [CrossRef]
  34. Hartvig, Á.D.; Kiss-Dobronyi, B.; Kotek, P.; Takácsné Tóth, B.; Gutzianas, I.; Zareczky, A.Z. The economic and energy security implications of the Russian energy weapon. Energy 2024, 294, 130972. [Google Scholar] [CrossRef]
  35. Sampedro, J.; Van de Ven, D.-J.; Horowitz, R.; Rodés-Bachs, C.; Frilingou, N.; Nikas, A.; Binsted, M.; Iyer, G.; Yarlagadda, B. Energy system analysis of cutting off Russian gas supply to the European Union. Energy Strategy Rev. 2024, 54, 101450. [Google Scholar] [CrossRef]
  36. Chen, Y.; Jiang, J.; Wang, L.; Wang, R. Impact assessment of energy sanctions in geo-conflict: Russian-Ukrainian war. Energy Rep. 2023, 9, 3082–3095. [Google Scholar] [CrossRef]
  37. Yu, Y.; Ma, D.; Qian, Y. A resilience measure for the international nickel trade network. Resour. Policy 2023, 86, 104296. [Google Scholar] [CrossRef]
  38. Liu, J.; Fu, Y.; Han, K.; Cui, Y. Resilience analysis of the RCEP shipping network. Ocean Coast. Manag. 2024, 257, 107317. [Google Scholar] [CrossRef]
  39. Albert, R.; Jeong, H.; Barabási, A.L. Error and attack tolerance of complex networks. Nature 2000, 406, 378–382. [Google Scholar] [CrossRef] [PubMed]
  40. Holme, P.; Kim, B.J.; Yoon, C.N.; Han, S.K. Attack vulnerability of complex networks. Phys. Rev. E 2002, 65, 056109. [Google Scholar] [CrossRef]
  41. Crucitti, P.; Latora, V.; Marchiori, M. Model for cascading failures in complex networks. Phys. A Stat. Mech. Its Appl. 2004, 340, 388–394. [Google Scholar] [CrossRef]
  42. Wang, N.; Gao, Y.; He, J.-T.; Yang, J. Robustness evaluation of the air cargo network considering node importance and attack cost. Reliab. Eng. Syst. Saf. 2022, 217, 108026. [Google Scholar] [CrossRef]
  43. Yang, G.-Z.; Chen, X.-S. Measurement and analysis of Sino-US export dependence ratio and import dependence ratio. Stat. Inf. Forum 2015, 30, 38–43. [Google Scholar]
Figure 1. Research flowchart.
Systems 13 00509 g001
Figure 2. Structural representation of the global LNG trade network (2020–2023).
Systems 13 00509 g002
Figure 3. Comparative robustness of the global LNG trade network under different attack strategies (E: Network Efficiency).
Systems 13 00509 g003
Figure 4. Comparative robustness of the global LNG trade network under different attack strategies (G: Relative Size of the Largest Connected Component).
Systems 13 00509 g004
Figure 5. Comparative robustness of the global LNG trade network in different years (E: Network Efficiency).
Systems 13 00509 g005
Figure 6. Parallel trend test results.
Systems 13 00509 g006
Figure 7. Placebo test results. (Note: The red dots represent the distribution of the estimated coefficients derived from the placebo tests in this study, while the blue line indicates the standard kernel density.)
Systems 13 00509 g007aSystems 13 00509 g007b
Table 1. Evolution of key characteristics in the global LNG trade network (2020–2023).
YearNumber of NodesNumber of Connected EdgesAverage DegreeAverage Weighted DegreeAverage Clustering CoefficientAverage Path Length
2020552724.9456.4740.1031.104
2021562534.5186.650.0851.115
2022582884.9666.9280.0931.09
2023643094.8286.2720.0821.302
Table 2. Top 10 countries by degree centrality and weighted degree centrality (2020–2023).
Degree CentralityWeighted Degree Centrality
Rank2020202120222023Rank2020202120222023
1United StatesUnited StatesUnited StatesUnited States1United StatesUnited StatesUnited StatesUnited States
2Trinidad TobagoQatarEgyptTrinidad Tobago2Trinidad TobagoRussiaEgyptTrinidad Tobago
3NigeriaNigeriaTrinidad TobagoNigeria3RussiaTrinidad TobagoTrinidad TobagoNorway
4RussiaTrinidad TobagoQatarEgypt4NigeriaQatarRussiaNigeria
5QatarEgyptRussiaAlgeria5ChinaNigeriaSpainRussia
6ChinaRussiaNigeriaRussia6QatarChinaQatarIndonesia
7South KoreaChinaEquatorial GuineaQatar7South KoreaSouth KoreaNigeriaChina
8AlgeriaSouth KoreaSouth KoreaChina8MalaysiaIndonesiaSouth KoreaJapan
9IndiaIndiaAlgeriaJapan9NorwayEgyptChinaSouth Korea
10NorwayJapanChinaNorway10ThailandChinese TaipeiJapanAlgeria
Table 3. Top 10 countries by betweenness centrality and weighted betweenness centrality (2020–2023).
Betweenness CentralityWeighted Betweenness Centrality
Rank2020202120222023Rank2020202120222023
1United StatesUnited StatesUnited StatesUnited States1United StatesUnited StatesUnited StatesUnited States
2Trinidad TobagoRussiaEgyptTrinidad Tobago2Trinidad TobagoRussiaEgyptTrinidad Tobago
3RussiaTrinidad TobagoTrinidad TobagoNorway3RussiaTrinidad TobagoTrinidad TobagoNorway
4NigeriaQatarRussiaNigeria4NigeriaQatarRussiaNigeria
5ChinaNigeriaSpainRussia5ChinaNigeriaSpainRussia
6QatarChinaQatarIndonesia6QatarChinaQatarIndonesia
7South KoreaSouth KoreaNigeriaChina7South KoreaSouth KoreaNigeriaChina
8MalaysiaIndonesiaSouth KoreaJapan8MalaysiaIndonesiaSouth KoreaJapan
9NorwayEgyptChinaSouth Korea9NorwayEgyptChinaSouth Korea
10ThailandChinese TaipeiJapanAlgeria10ThailandChinese TaipeiJapanAlgeria
Table 4. Major LNG imports by the Netherlands (2020–2023).
YearNorwayUnited StatesAlgeriaAngolaEquatorial GuineaNigeriaQatarRussiaTrinidad TobagoEgypt
20200.371.710.060.20.070.280.182.580.250
202103.180.060.270.070.130.092.080.070
20220.447.740.140.690.210.080.091.810.430.36
20230.8711.970.190.740.280.20.570.720.690.13
Table 5. Major LNG imports by China (2020–2023).
YearIndonesiaMalaysiaUnited StatesAustraliaNigeriaOmanPapua New GuineaQatarRussia
20205.376.383.2129.672.541.162.98.24.92
20214.728.859.0330.971.531.523.169.174.68
20224.057.451.8922.80.360.82.4515.846.34
20234.066.793.1724.341.211.082.5416.758.15
Table 6. Major LNG exports from Qatar (2020–2023).
YearChinaIndiaPakistanBangladeshJapanSouth KoreaChinese TaipeiThailandUnited KingdomItalyBelgiumPolandKuwait
20208.210.724.642.988.699.464.962.186.535.051.841.642.27
20219.1710.25.242.988.9711.724.772.594.364.711.961.752.64
202215.8410.36.043.892.829.535.272.375.555.224.691.633.01
202316.7510.926.323.752.838.675.552.822.044.823.21.743.41
Table 7. Major LNG exports from Russia (2020–2023).
YearChinaJapanSouth KoreaChinese TaipeiSpainUnited KingdomFranceTurkeyNetherlandsBelgium
20204.926.142.112.42.612.073.440.162.580.64
20214.686.632.871.892.462.353.5902.081.21
20226.347.053.061.133.690.375.590.231.812.32
20238.155.951.650.564.8303.471.160.722.82
Table 8. Descriptive statistics.
Variable NameObservationsMeanStandard DeviationMinimumMaximum
Year14,18120221.12120202023
Treatment14,1810.08680.28201
PostWar14,1810.5420.49801
DID14,1810.08680.28201
Trade dependence14,1810.01250.080701
Importer14,18133.4819.29166
Exporter14,18133.4719.27166
Table 9. Baseline regression result.
VariablesTrade Dependence
DID−0.00408 ***
(0.00124)
Importer-
Exporter0.000481 ***
(7.22 × 10⁻⁵)
Constant−0.00323
(0.00244)
Observations14,181
R-squared0.020
Robust standard errors in parentheses; *** p < 0.01.
Disclaimer/Publisher’s Note: The statements, opinions and data contained in all publications are solely those of the individual author(s) and contributor(s) and not of MDPI and/or the editor(s). MDPI and/or the editor(s) disclaim responsibility for any injury to people or property resulting from any ideas, methods, instructions or products referred to in the content.

