Abstract
This study investigates the dynamic relationship between environmental tax revenue and economic development in the European Union from 2013 to 2022. The findings reveal that these taxes significantly contribute to economic development in the long run, although short-run effects vary by tax type and country. The PMG model results indicate that energy tax revenues increase GDP per capita by 0.038, transport tax revenues by 0.041, and resource tax revenues by 0.018, all of which are statistically significant. Pollution tax revenues have an effect of 0.002 in the long run but are not statistically significant. In the short run, none of the tax variables show significant effects, although pollution tax revenues have a transitional impact of 0.196. The error correction term of −1.321 confirms a strong long-run adjustment, reinforcing the gradual economic benefits of environmental taxation. The results underscore the importance of resource and pollution taxes, which exhibit robust positive impacts, particularly in resource-rich and pollution-intensive economies. Energy and transport taxes also influence economic performance; however, their effectiveness depends on the structural and sectoral differences among countries. This study provides valuable insights for policymakers by highlighting the necessity of designing tailored environmental taxation policies that align with national conditions and long-term sustainability goals. Additionally, this study adopts a systems thinking perspective to capture the interconnectedness between environmental fiscal instruments and macroeconomic sustainability, offering a holistic interpretation of policy impacts.
1. Introduction
The increase in human activities in the context of resource competition worldwide has turned environmental issues into a persistent problem. This has led policymakers to search consistently for effective solutions that promote sustainable development [1]. Rising global concerns about climate change have encouraged policymakers to consider environmental factors in the formulation and evaluation of economic policies. Integrating fiscal reforms with environmental strategies can address the dual goals of fostering economic growth and ensuring environmental sustainability. This approach acknowledges the interdependence between economic development and ecological preservation.
By incorporating environmental measures into fiscal frameworks, governments can promote policies that are both economically and environmentally effective. Such strategies highlight the importance of balancing growth and climate action in policy design [2]. Governments and policymakers are implementing strategies and measures to mitigate the negative effects of environmental degradation and climate change [3].
As concerns about environmental conservation increase, renewable energy has become an important consideration. It is crucial not only for its ability to decrease carbon emissions but also for enhancing energy security [4], but also for its potential to foster a well-rounded expansion of renewable energy sources. This expansion can alleviate disparities in economic development among nations and contribute to the stability of the global economy [5]. Implementing effective environmental taxes should be a key component of state policies aimed at both environmental protection and economic development [6]. Environmental taxation serves as a tool for policies aimed at protecting the environment and improving the efficiency of tax systems. Governments impose these taxes on activities that harm the environment to address negative externalities.
Unlike traditional taxes, which are primarily focused on generating revenue, environmental taxes are intended to influence the behavior of households and businesses. Their design and implementation require careful consideration to ensure that they effectively achieve their objectives [7]. Environmental taxes represent one of the most effective alternative strategies for achieving environmental quality standards [8]. Environmental fiscal policy serves as a key mechanism for addressing pollution externalities by establishing a price for emissions. It promotes sustainable growth by encouraging innovation in green technologies, enhancing energy efficiency, and facilitating a reduction in carbon emissions [9]. Environmental taxes are designed to encourage sustainability by imposing costs on activities that contribute to pollution [10].
Environmental taxes have become a critical policy tool for addressing environmental challenges while simultaneously influencing economic structures. Accordingly, these taxes are defined as a popular strategy for addressing ecological decline and decreasing global carbon dioxide emissions [11]. The phrases environmental tax, green tax, and environmentally related tax typically refer to taxes imposed on practices that have a negative impact on the environment. These taxes serve as an important policy tool for managing pollution and enhancing environmental outcomes while also playing a role in generating government revenue [12]. Environmental taxes, often levied on activities that generate pollution or deplete natural resources, aim to internalize externalities and encourage sustainable practices in the long run.
By shifting the financial burden onto polluters, environmental taxes incentivize businesses and individuals to adopt cleaner technologies and reduce harmful emissions. This framework aligns with the “polluter pays” principle, emphasizing accountability for environmental damage. The revenue generated from environmental taxes has significant potential to reshape public finance systems. Governments can utilize these funds to reduce fiscal deficits, invest in green infrastructure, and provide subsidies for renewable energy development. In some cases, these revenues may be redirected to offset other taxes, such as income or corporate taxes, leading to a “double dividend” effect, improving environmental quality while promoting economic efficiency.
However, the economic implications of environmental taxation are multifaceted and depend on factors such as tax design, revenue allocation, and the socio-economic context of implementation. An environmental tax is designed to target a specific physical unit or its proxy that is known to adversely affect the environment. These taxes are generally categorized into four main types: energy, transport, pollution, and resource taxes. Energy taxes apply to various energy sources, such as coal, oil, natural gas, and electricity, for both stationary applications and transportation.
Transport taxes encompass a range of levies associated with vehicle ownership and usage. Pollution taxes are imposed on the discharge of harmful emissions into the air and water, including substances like nitrogen oxides (NOx) and sulfur dioxide (SO2). Resource taxes are related to the extraction of raw materials and can address issues such as noise pollution and waste management.
Overall, environmental taxes serve as financial instruments aimed at mitigating environmental degradation by discouraging harmful activities [13]. Environmental taxes can influence economic growth and development positively and negatively. On the one hand, they stimulate innovation, enhance resource efficiency, and foster new industries in the green economy. On the other hand, poorly designed taxes may impose excessive burdens on businesses or disproportionately affect lower-income households, potentially hindering economic growth and exacerbating social inequalities. Policymakers must navigate these complexities to ensure that environmental taxes achieve their intended goals without compromising economic stability.
The main research question of this study is to determine how various environmental tax revenues—such as energy taxes, transport taxes, pollution taxes, and resource taxes—impact gross domestic product per capita in European Union member states. GDP per capita measures the economic output per person and serves as a proxy for economic development. By exploring these relationships, additional research questions arise, such as identifying which categories of environmental tax revenues have the most significant influence on GDP per capita in the short term and the long term. These research questions are further elaborated through the development of specific hypotheses in the hypothesis formulation section of the paper.
This study’s primary contribution lies in its focus on the European Union, a unique region characterized by economic integration and a shared policy framework, yet with diverse fiscal and environmental strategies across member states. This research provides valuable insights into the representative environmental tax categories that drive economic growth in economies with varied structures but shared policy goals. Moreover, this paper employs an innovative empirical approach, applying the Pooled Mean Group (PMG) estimator to examine the long-term equilibrium relationship between environmental tax revenues and GDP per capita, thereby offering a novel perspective in this area of research. The PMG estimator is especially appropriate for this study, as it is designed for panel data analysis within the varied economic context of the European Union. In contrast to conventional estimators (e.g., fixed effects, random effects, or dynamic ordinary least squares), which typically impose homogeneity in long-run coefficients or fail to account for cross-country heterogeneity, the PMG model effectively considers differences in fiscal policies, economic structures, and the effects of environmental taxation across countries, leading to more dependable long-term estimates. This approach stands out due to its capability to simultaneously capture both short-run adjustments and long-run equilibrium effects.
The novelty of this research lies in its provision of fresh empirical evidence through a comprehensive analysis that incorporates a panel approach for the EU as a whole alongside individual cross-country analysis. This dual perspective helps identify the specific environmental tax forms that are most impactful in each EU country. Furthermore, this study employs dynamic methods in order to provide a better understanding of how selected environmental tax revenues influence GDP per capita, enriching the discourse on sustainable fiscal policy in the European Union context.
Given the complexity of environmental, economic, and institutional interactions, a systems-thinking approach is essential. This perspective allows us to analyze how different tax components function as part of a dynamic system rather than in isolation. By integrating systems theory, we interpret environmental taxation as an intervention within an interconnected policy–environment–economy framework.
This paper is organized into five sections. The first section outlines the introduction, focusing on environmental tax issues from the perspective of concepts such as the Environmental Kuznetz Curve and Double Dividend Theory. The second section provides a theoretical background on environmental taxes and economic growth and development. The third section focuses on the methodology employed and the process of data collection. In the fourth section, the findings of the study are presented and accompanied by a discussion. Finally, the fifth section concludes the paper by summarizing the results, highlighting the policy implications, addressing the limitations, and offering suggestions for future research.
1.1. Concept of Environmental Kuznetz Curve (EKC)
The Environmental Kuznets Curve (EKC) theory emerged in the early 1990s to describe the relationship between economic growth and environmental degradation. Accordingly, Stern [14] defined this approach as the proposed relationship between various measures of environmental degradation and income per capita. The Environmental Kuznets Curve (EKC) is a key theoretical framework for understanding the interplay between environmental policies and economic development. This concept hypothesizes a U-shaped relationship between environmental degradation and economic growth, suggesting that environmental quality deteriorates during the early stages of industrialization but improves as economies mature and prioritize sustainability. According to the Environmental Kuznets Curve hypothesis, environmental degradation often increases during early economic development but tends to decline once a certain income level is surpassed, as societies can afford cleaner technologies and stronger regulations [15]. Specifically, environmental degradation increases at a faster rate than income during the initial development stages but decelerates relative to GDP growth as income levels rise. By analyzing the EKC, policymakers can gain insights into how environmental taxes and revenues impact economic trajectories. Initially, as economies develop, industrialization and urbanization intensify pollution and resource depletion due to increased production and waste. Over time, however, technological advancements, structural shifts toward service-based economies, and rising environmental awareness have led to reduced pollution and improved resource management. Despite its insights, the “grow now, clean later” approach has contributed to significant global challenges, such as climate change, deforestation, and loss of biodiversity, particularly in rapidly growing economies [16]. The Environmental Kuznets Curve (EKC) is analyzed by examining the impact of income and its squared term on environmental degradation to confirm the curve’s concave shape. The validation of the inverted U-shape occurs when the coefficient and elasticity of income are significantly positive while those of the squared income term are significantly negative. Consequently, if β1 represents the coefficient of income and β2 represents the coefficient of income squared, the EKC is confirmed in the long run under the condition that β1 > 0 and β2 < 0 [17].
1.2. Concept of Double Dividend Theory (DDT)
The Double Dividend Theory (DDT) is a foundational concept in environmental economics, emphasizing the dual benefits of environmental tax reforms. When a tax is applied, the price buyers pay differs from the amount sellers receive, creating a price gap. Under standard economic theories, such price distortions hinder the efficient allocation of resources, leading to a loss of economic efficiency and consumer welfare greater than the tax revenue generated. This inefficiency is commonly referred to as “deadweight loss” or the “excess burden” of taxation. However, proponents of environmental tax reform (ETR) argue that raising environmental taxes while reducing other taxes—without altering overall government revenues—can yield dual benefits: mitigating environmental harm and boosting economic performance, a concept known as the “double dividend” (DD) hypothesis [18]. It posits that implementing environmental taxes, such as carbon taxes, can yield two primary dividends: improved environmental quality and enhanced economic efficiency. The first dividend arises from reducing pollution and internalizing the social costs of environmental harm, while the second stems from using tax revenues to lower distortionary taxes, such as income or payroll taxes, thereby boosting economic growth and employment. Central to the theory is revenue recycling, where the collected taxes are strategically reinvested, either to reduce existing tax burdens or to support green investments like renewable energy. One way a double dividend (DD) can occur is through the impact of lower taxes on work or the economy overall. Combining pollution or energy taxes with reduced taxes on labor can make labor (or human capital) relatively cheaper than energy. As mentioned earlier, achieving DD depends on balancing the economic costs of ecological taxes with the benefits gained from using tax revenues effectively [19].
1.3. Environmental Taxes in the European Union
The European Union is grappling with severe challenges, including climate change, water contamination, air pollution from fine particulate matter, and notable environment-related economic losses. Over the past decade, climate change has resulted in economic damages exceeding €145 billion, with annual losses increasing by nearly 2%, according to Eurostat. Despite recent reductions in air pollutant emissions, air pollution remains Europe’s most significant environmental health hazard, with over 96% of urban residents exposed to fine particulate matter above the World Health Organization standards in 2020 [20].
Additionally, the European Union has seen a rise in environmental pollution taxes to meet emissions and sustainable development targets, aiming to reduce carbon emissions by 5%. Key taxes, including energy, environment, and transport levies, have been implemented in countries like Slovenia, Poland, France, and Denmark. These taxes address harmful externalities, such as pollution, land degradation, and the greenhouse effect, which negatively impact living standards, product quality, income, and energy consumption. More stringent regulation of toxic emissions is required to protect ecosystems, enhance public health, and stabilize the global climate.
Environmental taxation is a widely adopted policy tool across Europe, gradually implemented by member states since the early 1990s to combat the escalating environmental degradation. Numerous studies have highlighted its success in improving environmental quality [21,22]. Beyond environmental benefits, ET has been shown to influence economic performance significantly. This dual impact was emphasized through the Environmental Tax Reform [23], which advocated shifting the tax burden from productive activities like labor, capital, and consumption to environmentally harmful practices and resource overuse.
At the start of the 2000s, environmental taxation played a more prominent role in Europe, particularly in Scandinavian countries, than in other regions. This was evident in the higher share of environmental tax revenues relative to GDP in European nations compared to countries like the USA, Canada, Australia, Turkey, Switzerland, and Japan. Additionally, European countries have pursued more ambitious goals for reducing fossil fuel use, especially in the transportation sector [24]. Over the past two decades, the European Union (EU) has implemented various measures to harmonize environmental tax policies among its member states. Directive 2003/96/EC serves as the framework for taxing energy products within the EU, aligning with the broader goals of environmental sustainability and climate change mitigation.
2. Literature Review
2.1. Theoretical Background on Environmental Taxes and Economic Development
Environmental taxes have gained considerable attention as a strategy to combat climate change, leading to numerous studies on this emerging tax framework over the past two decades [25]. Examining the relationship between environmental tax revenues and economic growth and development is a critical area of research within the framework of sustainable economic policy. Environmental taxes are increasingly recognized as a dual-purpose tool that aims to reduce environmental harm while contributing to fiscal revenue that can support economic objectives. Understanding how these revenues influence economic growth, whether by fostering innovation, creating green jobs, or reducing tax distortions, is essential for crafting effective policy measures. In line with systems theory, environmental taxation should be viewed not only as a fiscal tool but also as part of a broader interconnected system that simultaneously influences innovation, employment, and ecological outcomes. Andreoni [26] emphasized that economic development is a fundamental driver of environmental tax revenue growth, reinforcing the theoretical expectation that environmental taxation evolves in tandem with broader developmental progress.
2.2. The Relationship Between Environmental Taxes and Economic Development
The interplay between environmental taxation and economic development varies across countries and regions, reflecting differences in tax structures, economic conditions, and policy priorities. Several studies have analyzed this relationship, offering insights into the potential synergies and trade-offs between environmental and economic goals. Hassan et al. [27] examined the impact of environmentally related taxes on economic growth using data from 31 OECD countries over the period 1994–2013. Applying a Correlated Random Effects (CRE) model and a multiple imputation method to address data limitations and heterogeneity, the results revealed no significant relationship between overall environmentally related tax revenues and GDP growth in the short or long term unless interactions with initial GDP levels were considered. When factoring in the initial GDP per capita, environmentally related tax revenues positively impact economic growth in wealthier countries but hinder it in poorer countries. Tchapchet-Tchouto et al. [28] investigated the impact of environmental taxes on economic growth in 31 European countries between 2009 and 2019. Using Pooled OLS, the findings suggest that increases in environmental taxes through tax reforms negatively influence economic growth. Quantile regression further revealed a consistent negative effect of environmental taxes across all quantiles, significant at the 1% level. However, the impact varies by income level, with low-income countries experiencing more pronounced negative effects than medium- and high-income countries. Mirović et al. [29] employed an econometric analysis to investigate the relationship between environmental taxes, economic growth, and government spending in the Visegrad Group (VG) countries—Czechia, Hungary, Poland, and Slovakia—between 1995 and 2018. The research finds that increases in both total and energy tax revenues positively affect economic growth, while transport tax revenues have a negative impact. This suggests that different types of environmental taxes may have distinct effects on economic performance, underscoring the need for careful tax policy designs. Similarly, Oueslati [30] demonstrates that environmental tax reform, when paired with strategic shifts in public spending, can foster long-term economic growth and improve social welfare, highlighting the importance of integrated fiscal planning.
2.3. Environmental Taxes and Fiscal Policy Implications
The study by [31] used panel Granger causality tests to examine the relationship between environmental taxes and economic growth in EU and OECD countries from 1995 to 2006. The results show a long-run causal effect from GDP to environmental taxes, particularly gasoline taxes, indicating that wealthier countries are more inclined to adopt such measures. Short-run effects were limited, with only environmental taxes relative to total taxes significantly impacting output. Bidirectional causality was asymmetrical, with stronger evidence of economic conditions influencing environmental tax revenue than the reverse. Spinesi [32] analyzed the impact of environmental taxes on income inequality, human capital accumulation, and economic growth. A tighter environmental tax, combined with a lower share of the tax on final consumption, increases incentives for human capital accumulation, innovation, and the per capita growth rate while also modestly raising income inequality. The findings show that market-based instruments like carbon taxes are more effective than command-and-control policies in fostering innovation and long-term growth. Ajeigbe et al. [33] analyzed data from 65 economies from 2010 to 2021 using FMOLS and DOLS methods. The findings show that carbon emissions negatively impact environmental quality, economic growth, and financial development, except for greenhouse gas emissions in developed economies, which are insignificant. The results highlight the need for stricter fiscal and monetary policies, including environmental and carbon taxes, to effectively control pollution and support sustainable growth, particularly in emerging economies. These results reinforce the argument that well-designed environmental taxation can play a crucial role in balancing economic growth and ecological sustainability. Adding to this discourse, Chengao et al. [34] conducted a comparative panel data analysis across China, Germany, and the UK from 2013–2022, revealing substantial cross-country differences in environmental tax responsiveness. Their results indicate that in China, a one percentage point increase in overall tax revenue correlates with a 0.85 percentage point rise in environmental tax revenues—suggesting strong fiscal linkages between broader economic capacity and environmental taxation.
2.4. Environmental Taxes and Sustainability Policies
Erdogan [35] investigated the impact of green fiscal policies on environmental sustainability in Germany from 1995 to 2020. Using the Autoregressive Distributed Lag method and robustness checks with Fully Modified Least Squares and Canonical Regression, this study incorporated variables like energy consumption, innovation, economic growth, and population density. The results found that environmental taxes are ineffective as green fiscal tools, while energy use worsens pollution, and economic growth and population density reduce it. Zhang et al. [36] examined the effects of natural resource exploitation, energy consumption, and carbon tax revenues on emissions in developing countries using data from 48 nations between 1990 and 2020. Second-generation econometric methods were applied to address heterogeneity and cross-sectional dependence in panel data. The CS-ARDL model provided robust results, showing that natural resource rents and excessive energy consumption significantly contribute to increased carbon emissions, exacerbating environmental degradation. Conversely, tax revenue and education improve environmental quality in the analyzed countries. Wolde-Rufael and Mulat-weldemeskel [37] estimated the impact of environmental taxes and stringent environmental policies on CO2 emission reduction across 20 European countries from 1995 to 2012. Using panel cointegration tests, the analysis revealed a significant negative relationship between CO2 emissions and both environmental taxes (including total, energy, and transport taxes) and stringent environmental policies.
The findings were further validated using a quantile regression model, demonstrating that stricter policies and higher revenues from environmental taxes were associated with substantial reductions in CO2 emissions.
2.5. Case Studies: Country-Specific Analyses
Toutou and Langarita [38] analyzed the impact of economic growth on CO2 emissions in Algeria from 1973 to 2016, testing the Environmental Kuznets Curve (EKC) hypothesis using the ARDL method. The findings confirm a positive long-term relationship between economic growth and CO2 emissions, with causality running from growth to emissions. The results also support the EKC hypothesis, which states that emissions initially rise with economic growth but decline after reaching a certain threshold. Fang et al. [39] examined the link between environmental tax revenues and renewable energy consumption across 15 Belt and Road countries from 1998 to 2019, encompassing both developed and developing nations. The findings reveal a non-linear effect of environmental tax revenue on renewable energy usage. While higher environmental tax revenue positively influenced renewable energy consumption in the long term, this relationship did not hold in the short term. Finally, Stameski et al. [40] evaluated the impact of environmental tax revenues on economic development in Nordic countries (Denmark, Finland, Iceland, Norway, and Sweden) from 2013 to 2022. The results show that energy and transport tax revenues have significant positive effects on GDP per capita, with a 1% increase in energy taxes raising GDP per capita by 0.189% and transport taxes by 0.171%. Pollution taxes also have a positive but less significant effect on the GDP per capita. The GMM model highlights the importance of past GDP per capita values and confirms the significant influence of energy, transportation, and pollution taxes at various significance levels. These findings underscore the effectiveness of well-structured environmental taxes in promoting long-term economic growth.
3. Materials and Methods
This study analyzes European Union countries for the period 2013–2022. The analysis period was determined by the availability of data on environmental taxes in the selected countries. This study utilizes annual data obtained from the Eurostat database and employs STATA version 15.0 for statistical analysis.
This paper applies a systems-based modeling approach by analyzing the four main components of environmental taxation—energy, transport, pollution, and resource taxes—as interconnected elements. Using the PMG estimator, we capture both short-term dynamics and long-term equilibrium within the system, allowing us to trace how systemic adjustments unfold over time across EU member states.
The model uses gross domestic product per capita as the dependent variable. In contrast, the explanatory variables consist of energy, transport, pollution, and resource tax revenues (Table 1). This framework and hypotheses were developed following the research cited in [28,40]. To explore the impact of environmental taxes on economic development, several key hypotheses were formulated. These include the primary hypothesis and additional auxiliary hypotheses. This study aims to assess how energy, transport, pollution, and resource taxes influence economic development. The null hypothesis is as follows:

Table 1.
Variable description.
H1.
Environmental tax revenues have a positive effect on economic development in the European Union in the long run.
The premise of this hypothesis is that environmental taxes contribute to economic growth by promoting sustainable practices, mitigating negative externalities, and encouraging innovation, as suggested by previous research [27,28].
By incorporating the costs of environmental damage into market prices, these taxes provide incentives for businesses and consumers to transition to more sustainable alternatives, which can ultimately lead to improved efficiency and long-term economic benefits [29]. Auxiliary hypotheses are defined as follows:
H1.1.
Energy tax revenues have a positive effect on economic development in the European Union in the long run.
Energy taxes play a significant role in reducing fossil fuel consumption and promoting the adoption of renewable energy sources, aligning with the findings on the effectiveness of energy taxation [37]. By encouraging energy efficiency and investment in clean technologies, these taxes can contribute to structural economic transformation, stimulate job creation in the renewable energy sector, and enhance energy security [7]. Additionally, studies have highlighted that energy taxation supports the reduction of carbon emissions while fostering the sustainable growth of industries that prioritize environmental responsibility [13].
H1.2.
Transport tax revenues have a positive effect on economic development in the European Union in the long run.
Transport taxation is an essential policy tool for addressing traffic congestion, lowering emissions, and fostering investment in sustainable mobility solutions, consistent with prior studies [40]. Well-designed transport taxes contribute to the expansion of public transportation networks, infrastructure improvement, and greater adoption of low-emission vehicles, which, in turn, benefits economic development [35]. The positive economic effects extend to industries such as electric vehicle manufacturing, public transport, and infrastructure development, reinforcing the role of transport tax in supporting overall economic growth.
H1.3.
Pollution tax revenues have a positive effect on economic development in the European Union in the long run.
Pollution taxes serve as an effective mechanism to reduce environmental damage by increasing the cost of polluting activities, as suggested by the existing literature [36]. By incentivizing businesses to invest in cleaner technologies and more sustainable production methods, these taxes contribute not only to environmental protection but also to economic innovation [8]. A reduction in pollution has been associated with improved public health outcomes, lower healthcare expenditures, and increased productivity, all of which play a role in fostering long-term economic development [24].
H1.4.
Resource tax revenues have a positive effect on economic development in the European Union in the long run.
Resource taxation is designed to promote the responsible use of natural resources by discouraging excessive extraction and waste, a principle supported by previous research [5]. By incentivizing circular economy practices, including recycling and resource efficiency, such taxes enhance long-term economic resilience [10]. Countries that successfully implement resource taxation policies often experience more stable and sustainable economic growth, as industries that efficiently utilize resources tend to become more competitive in global markets [20].
Based on the established variables and formulated hypotheses, the following model has been created (see Figure 1).
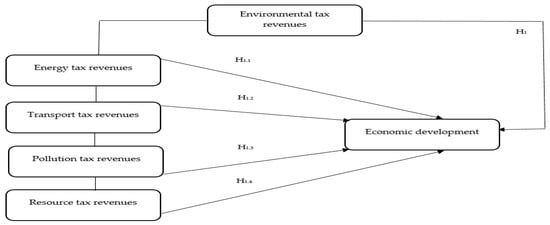
Figure 1.
Model construction.
3.1. Preliminary Tests and Diagnostics
Before estimating the panel model, it is essential to conduct preliminary tests to ensure the robustness and validity of the results. First, panel unit root tests, such as Pesaran’s CADF and CPIS, are applied to check for stationarity. Based on [41,42], these tests can be presented as
where yi,t—the dependent time series variable for unit i at time t; αi—the intercept (individual fixed effect for each unit i); γiyi,t−1—the key term for testing stationarity; λiyt−1—the coefficient determines whether a unit root is present. If γi = 0, the series has a unit root (non-stationary). If γi < 0, the series is stationary; yi,t−j—this term includes lagged first differences of the dependent variable to account for serial correlation in the residuals; yt−1—a component incorporating first differences of the aggregate panel data yt−1 to account for cross-sectional dependence; εi,t—the error term. λiyt−1—a term that controls for the level of the dependent variable, allowing better estimation of long-term effects. To confirm stationarity in practice, γ1 must not only be negative but also statistically significant. Thus, the test examines whether the estimate of γ1 is significantly less than zero, typically using a t-statistic, as follows: if the test rejects the null hypothesis (γ1 = 0), the series is considered to be stationary.
where N is the number of cross-sectional units (e.g., individuals, countries, and firms); ti is the individual CADF t-statistic for unit i, obtained from the regression specified in Equation (1).
Second, multicollinearity is assessed using the Variance Inflation Factor (VIF), which measures the extent to which the variance of an estimated coefficient increases due to collinearity [43].
Finally, cross-sectional dependence is tested using the Pesaran CD, Friedman CD, and Frees CD tests, which evaluate whether residuals across cross-sections are correlated [41,44,45].
where ρij represents the pairwise correlation coefficient of the residuals from the cross-sectional units i and j. The test detects the presence of cross-sectional dependence by averaging pairwise correlations across all panel units.
These preliminary tests (panel unit root tests (CADF and CIPS), multicollinearity assessment (VIF), and cross-sectional dependence tests (Pesaran CD, Friedman CD, and Frees CD)) are crucial for ensuring the reliability and validity of the panel model.
3.2. Panel Data Modeling
The Pooled Mean Group (PMG) model is a dynamic panel data estimation technique that accounts for both short-run heterogeneity and long-run homogeneity across individuals in a panel. The PMG model starts from the equality of the long-term coefficients and assumptions about the short-term coefficient variation and variance of errors. The model can be presented as follows:
where GDPpci,t per capita for country i at time t represents the dependent variable. In addition, μ is the intercept or constant term in the model, and λi is a scalar value vector that represents the autoregressive coefficient for the lagged dependent variable GDPpci,t−n. In addition, GDPpci,t−n is the GDP per capita for country i at time t − n, where n is the number of time periods lagged. β1 β2, β3, β4 are long-run parameter coefficients for the independent variables ETRi,t TTRi,t PTRi,t and RTRi,t. ETRi,t is the energy tax revenue for country i at time t, TTRi,t is the transport tax revenue for country i at time t, PTR is the pollution tax revenue for country i at time t, and RTR is the resource tax revenue for country i at time t. Finally, εi,t is the error disturbance term, which captures all unobserved factors affecting GDP per capita that are not included in the model.
GDPpci,t = μ +λiGDPpci,t−n + β1 ETRi,t + β2 TTRi,t + β3PTRi,t + β4RTRi,t + εi,t
This model possesses significant strength because it accommodates both stationary (I(0)) and non-stationary (I(1)) variables within a unified autoregressive distributed lag (ARDL) framework [46]. This estimator is ideal for analyzing dynamic panel data that encompasses both extensive time series and cross-sectional data [47]. This technique effectively enables the assessment of both aggregated and individual country policies while accounting for the shared long-term relationships among the countries under study [48]. This method is suitable for panel data that display homogeneity in long-run regression coefficients while allowing for heterogeneity in short-run coefficients and error variances.
The PMG estimator addresses endogeneity issues by optimizing the lag structure of both the dependent and independent variables. Additionally, it provides flexibility in estimating non-stationary dynamic panel data with heterogeneous coefficients across groups. Three approaches are available under this framework: the pooled mean group (PMG) estimator, mean group (MG) estimator, and dynamic fixed effects (DFE) method. These options make the PMG estimator a robust tool for analyzing complex panel datasets [49]. The starting null hypothesis between the MG and PMG posits that the PMG demonstrates greater efficiency than the MG. If the p-value is greater than 0.05, the null hypothesis remains valid, indicating that PMG is a better estimator. Conversely, a p-value below 0.05 leads to the rejection of the null hypothesis, suggesting that the MG is the preferred estimator. In evaluating MG versus DFE, the initial hypothesis asserts that DFE is more efficient, and this is dismissed when the p-value is less than 0.05, confirming that MG is the optimal choice; otherwise, DFE is employed. Finally, when comparing DFE and PMG, the null hypothesis claims that PMG is more efficient, which is also rejected with a p-value under 0.05, leading to the conclusion that DFE is the suitable estimator, while PMG is favored otherwise [50]. Grounded in likelihood principles, this estimator requires long-run elasticity to be uniform across all panels. This assumption leads to consistent and efficient estimates, striking a balance between short-term variability and long-term stability in the analysis. When this restriction is validated, the PMG approach yields reliable results across the examined panels [51]. This comprehensive framework ensures a robust foundation for dynamic panel analysis in various economic contexts and facilitates the exploration of nuanced policy impacts.
4. Results
This section presents the empirical results, including descriptive statistics, panel unit root tests, and dynamic panel models. Initially, we provided a descriptive overview of economic development and environmental tax revenues in the European Union, which can be found in Table 2 and Table 3.
Table 2.
Economic development in the European Union (GDPpc growth rate).
Table 3.
Environmental tax revenues in the European Union (millions of EUR).
Table 2 shows the descriptive statistics for GDP per capita growth across EU countries, revealing significant variations in economic development. Austria (AUS) and Belgium (BEL) show modest average growth rates (0.440 and 1.001) with moderate variability, while Bulgaria (BUL) and Croatia (CRO) exhibit higher averages (3.175 and 3.74) but also substantial fluctuations, especially in Croatia. Cyprus (CYP) and the Czech Republic (CZE) have moderate averages (1.156 and 1.877) and variability. Denmark (DEN) displays stable growth with a low standard deviation. Estonia (EST) and Hungary (HUN) have strong averages (2.71 and 3.65) but notable variability, while Finland (FIN), France (FRA), and Germany (GER) show lower averages, with France experiencing larger swings. Greece (GRE) has a moderate mean of 1.25 but wide fluctuations, while Ireland (IRE) stands out with the highest mean (6.87) and range. Italy (ITA) has a slightly negative mean (−0.147), indicating stagnation, while the Baltic states, Latvia (LAT) and Lithuania (LIT), report high averages (3.812 and 4.245), with Latvia showing greater variability. Luxembourg (LUX) and the Netherlands (NED) display modest averages (0.249 and 0.765), while Malta (MAL) exhibits significant volatility. Poland (POL) and Romania (ROM) have strong growth rates (3.865 and 4.057) with moderate variability, while Slovakia (SLK) and Slovenia (SLO) report modest averages (2.082 and 2.657). Spain (SPA) and Portugal (POR) show moderate growth, with Spain experiencing significant swings. Sweden (SWE) demonstrates stable growth with a low average (1.258). The EU aggregate (EU) reflects an average growth of 2.165 with wide fluctuations. Overall, the data highlight heterogeneity across countries, with some experiencing robust growth and others showing stagnation or high variability.
Table 3 summarizes environmental tax revenues across countries, categorized into energy tax revenues (ETR), transport tax revenues (TTR), pollution tax revenues (PTR), and resource tax revenues (RTR), all measured in millions of euros from 2013 to 2022. Germany (GER) and Italy (ITA) led with the highest ETRs at 50,756.26 and 44,583.5, respectively, followed by France (FRA) with 40,896.4. Smaller countries, like Cyprus (CYP) and Malta (MAL), report significantly lower ETRs of 432.24 and 143.43, respectively. Austria (AUS) and Denmark (DEN) exhibit strong ETRs (5182.73 and 5717.14), with Denmark also showing a high TTR (4106.69). Poland (POL) and the Netherlands (NED) report high ETRs (11,517.96 and 13,608.10) and notable PTR contributions (551.97 and 3073.30). Spain (SPA) and Sweden (SWE) have moderate ETRs (17,073.1 and 6856.86) and strong TTRs. Croatia (CRO) and Bulgaria (BUL) report low ETRs but stand out with Croatia’s RTR of 308.77. Ireland (IRE) shows moderate ETR (2977.20) and TTR (1831.11), while Finland (FIN) and Hungary (HUN) exhibit balanced revenues across categories. Latvia (LAT) and Lithuania (LIT) show low revenues, while Luxembourg (LUX) has a small ETR of 906.85 and negligible PTR and RTR. France leads in PTR at 2860.28, while Italy follows at 565.61, and Germany shows no PTR contribution. Resource taxes (RTR) are generally the smallest category, with notable contributions from Denmark and Slovenia (SLO). The EU aggregate indicates an average ETR of 8915.53, with smaller contributions from other tax types. Overall, larger economies dominate environmental tax revenues, while smaller nations and Eastern European countries show significantly lower figures, reflecting the varying tax structures and environmental policies across Europe.
Table 4 presents the results of the panel unit root tests, specifically the Pesaran CADF and CIPS tests, for GDPpc, ETR, TTR, PTR, and RTR. The tests examined the stationarity of the variables at their level and first-difference forms. GDPpc is stationary at both levels and first differences, with highly significant results (p < 0.01), confirming a strong stationarity. ETR, TTR, PTR, and RTR are non-stationary at the level but become stationary after the first differencing, with varying significance levels. ETR, PTR, and RTR achieve stationarity at the first difference at p < 0.05, while TTR shows stationarity at a more robust level (p < 0.01). The Pesaran CADF and CIPS results are consistent, as all variables that are non-stationary at the level exhibit stationarity after differencing.
Table 4.
Panel unit root tests.
To assess the suitability of our explanatory variables, we utilized the Variance Inflation Factor (VIF) analysis presented in Table 5. The average VIF value observed was 2.95, which is significantly below the thresholds of 10 [52] or 15 [53] typically used to indicate potential multicollinearity issues. This finding suggests that the independent variables included in the model do not exhibit significant correlations with one another. Consequently, we can confidently conclude that multicollinearity is not a concern in this analysis.
Table 5.
VIF test.
Cross-sectional dependence tests assess whether the units in a panel dataset are interrelated (Table 6). The Pesaran CD test reports a statistic of 17.147 with a p-value of 0.000, indicating significant dependence. The Friedman CD test also shows significant dependence with a statistic of 94.111 and a p-value of 0.000.
Table 6.
Cross-section dependence.
The Frees CD test reports a statistic of 4.345 compared to the critical values for different significance levels (10%, 5%, and 1%). Since the statistic exceeds the critical values for 10% and 5% but not for 1%, dependence is confirmed at significant levels of up to 5%. All tests consistently indicate the presence of cross-sectional dependence. The results of these tests indicate that the economies of the observed countries are interconnected, suggesting the presence of spatial spillover effects. This implies that when a disturbance occurs in one economy, it will have repercussions for other countries.
Table 7 presents the results of three estimation models—PMG (Pooled Mean Group), MG (Mean Group), and DFE (Dynamic Fixed Effects)—to analyze the impact of various environmental tax revenues on GDP per capita, separating short-run and long-run effects. The Error Correction Term (ECT) is negative and highly significant (p-value < 0.05) in all models, with PMG showing the fastest adjustment speed (ECT = −1.321) and MG the slowest (ECT = −0.628), indicating a robust, long-term equilibrium relationship across models. In the PMG model, ETR shows no significant short-run effect (p-value = 0.146) but a positive and significant long-run impact (p-value = 0.000), reflecting the delayed benefits of energy taxation on economic growth. TTR and PTR are insignificant in the short run (p-value = 0.379 and p-value = 0.191, respectively) but significant in the long run (p-value = 0.000), with PTR showing a larger effect. RTR, while insignificant in the short run (p-value = 0.698), demonstrates a positive and significant long-run effect (p-value = 0.001), highlighting its importance for resource-dependent economies. The MG model reveals a significant long-run effect for ETR (p-value = 0.003) and PTR (p-value = 0.004) but weaker short-run dynamics, emphasizing cross-country heterogeneity in tax effectiveness. The DFE model identifies significant short-run impacts for ETR (p-value = 0.000) and PTR (p-value = 0.033), although the long-run effects are less pronounced for ETR and insignificant for other taxes.
Table 7.
Different panel modelling.
The Hausman test (p-value = 0.111) supports the use of the PMG model in this analysis. In the long run, energy tax revenues (ETR) have a significant positive effect on GDP per capita (0.038, p-value = 0.000), confirming H1.1. Similarly, transport tax revenues (TTR) exhibit a significant positive long-run impact (0.041, p-value = 0.000), validating auxiliary hypothesis H1.2.
Pollution tax revenues (PTR) have a positive effect in both the short run (0.196, p-value = 0.191) and the long run (0.002, p-value = 0.913), but neither is statistically significant, offering no strong support for auxiliary hypothesis H1.3. Lastly, resource tax revenues (RTR) significantly influence economic development in the long run (0.018, p-value = 0.001), supporting auxiliary hypothesis H1.4. Based on the results, environmental tax revenues significantly and positively influence GDP per capita in the European Union, with the exception of pollution taxes. This implies that the general hypothesis H1 can be partially accepted. The significant long-term effects of ETR, TTR, and RTR, combined with the short-run relevance of PTR, reinforce the overall hypothesis that environmental taxes contribute to economic development. The absence of significant short-term effects for most environmental taxes can be attributed to several structural and behavioral factors inherent in environmental taxation systems. Environmental taxes typically require substantial adjustment periods for both businesses and consumers to modify their consumption and production patterns, as these taxes are designed to incentivize long-term behavioral changes rather than immediate responses. Additionally, the short-term costs associated with compliance and adaptation to new tax regimes may initially offset potential benefits, creating a lag before positive economic outcomes occur. Furthermore, environmental taxes frequently generate revenues that are reinvested in green infrastructure and technology development, where returns on investment become evident only over extended time horizons, consistent with the double-dividend hypothesis that emphasizes long-term economic and environmental gains. Despite some variations in individual tax components, the findings confirm that environmental taxation is a key driver of sustainable economic growth, aligning with the theoretical expectations outlined in H1. Furthermore, there are empirical results of the applied PMG model analyzed by country level in the European Union (Table 8).
Table 8.
PMG model by country.
The analysis examines the impact of energy tax revenues (ETR), transport tax revenues (TTR), pollution tax revenues (PTR), and resource tax revenues (RTR) on GDP per capita in EU countries during 2013–2022 using the Pooled Mean Group (PMG) model. The Error Correction Term (ECT) indicates significant negative values (p-value < 0.05) across all countries, confirming long-term relationships and varying speeds of adjustment, with Croatia (ECT= − 1.885) showing the fastest and Germany (ECT= − 0.412) the slowest correction. ETR has mixed effects, with the largest positive impacts observed in Belgium, Denmark, Finland, and Italy (p-value < 0.05), while Greece and Lithuania show weaker or negative effects, reflecting differing energy consumption and taxation structures.
TTR demonstrates significant positive effects in Cyprus, Spain, and Portugal, with Cyprus exhibiting the largest coefficients, while the effects are insignificant in Belgium and Luxembourg, possibly due to variations in transport infrastructure or tax effectiveness. PTR exhibits consistent positive impacts, with the largest effects seen in Finland, Ireland, and Bulgaria (p-value < 0.05), indicating well-integrated pollution taxation policies, while impacts in Latvia and the Czech Republic are negligible, likely due to weaker enforcement or smaller tax bases. RTR has the strongest and most consistent positive effects, with the largest impacts observed in resource-rich countries like Bulgaria, Ireland, and Romania (p-value < 0.05), while effects are insignificant in resource-poor countries such as Slovenia and Malta. Overall, PTR and RTR often show strong positive effects, particularly in Finland, Bulgaria, and Ireland, while ETR and TTR are more variable, with significant effects in countries like Denmark, Cyprus, and Italy and weaker impacts in Germany and Lithuania (Table 8). These discrepancies may stem from underlying institutional and structural factors, such as variations in administrative efficiency, the level of public support for environmental taxation, and the effectiveness of tax policies integrated with national environmental and economic development strategies. The findings highlight the need for tailored tax policies that align with national conditions, as resource-rich countries benefit most from RTR, and pollution-intensive economies can enhance their growth through PTR. ETR and TTR require careful design to avoid negative impacts, particularly in energy-dependent countries. The consistent significance of the ECT term underscores the role of taxation policies in influencing long-term economic dynamics.
5. Discussion
The findings of this study emphasize the nuanced relationship between environmental tax revenue and economic growth across the European Union. The results demonstrate that environmental taxes, particularly resource and pollution taxes, play significant roles in fostering long-term economic development. The Error Correction Term (ECT) results confirm robust long-term equilibrium relationships, aligning with studies [26,29], which also highlighted the significant long-term effects of environmental taxes on economic outcomes. These results align with systems thinking, emphasizing that environmental taxes do not act in isolation but influence and are influenced by broader institutional and economic systems. For instance, the long-term effects captured by the model reflect system-level adjustments rather than isolated policy effects.
Energy tax revenues (ETR) have mixed impacts across models and countries, with a positive long-run effect in the PMG model (p-value < 0.05). These findings are consistent with those of [34], who reported a positive long-term relationship between environmental taxes and renewable energy adoption. However, the variability in short-run ETR impacts underscores the importance of energy dependency and tax structure, as evidenced by the weak or negative effects in Germany and Lithuania. In countries that are highly dependent on fossil fuels, higher energy taxes may initially lead to increased costs for industries and consumers, dampening short-term economic performance. Conversely, in countries with advanced renewable energy sectors, energy taxes can accelerate the transition to sustainable energy, leading to long-term benefits.
Transport tax revenues (TTR) have significant positive effects in the long run, particularly in Cyprus, Spain, and Portugal, aligning with the results of Stameski et al. [37], who showed that transport taxes significantly enhance GDP per capita. This positive relationship can be explained by investments in transportation infrastructure, as revenue from transport taxes is often reinvested in public transportation and road networks, boosting economic productivity.
Pollution tax revenues (PTR) demonstrate strong and consistent long-term impacts in countries such as Finland, Bulgaria, and Ireland, corroborating the results of Zhang et al. [33], who found that pollution taxes are effective in reducing emissions and supporting economic growth. The strong impact of PTR in these countries is likely due to stringent enforcement mechanisms and clear reinvestment strategies, where revenues are allocated to environmental protection and industrial modernization. Conversely, the negligible effects in Latvia and the Czech Republic highlight the role of enforcement and tax base size, as suggested by Erdogan [32]. In these countries, pollution taxes may be too low to incentivize significant behavioral changes or may lack proper regulatory frameworks to ensure compliance, thereby reducing their economic impact.
Resource tax revenues (RTR) emerge as the most influential, with robust positive effects on resource-rich economies such as Bulgaria and Romania. The significant impact of RTR in these countries can be explained by their reliance on natural resource industries, where taxation helps regulate extraction while providing government revenue that can be reinvested in sustainable development projects. These results highlight the importance of aligning tax policies with national resource endowments, supporting the argument by [35] that economic conditions significantly shape the efficacy of environmental taxes. In contrast, the weaker effects of the RTR in resource-scarce countries suggest that the economic benefits of resource taxation are more limited when resource extraction plays a minor role in national economies.
The Hausman test validates the PMG model as the most appropriate for analyzing the dataset, aligning with the methodology employed in similar studies, including that of [26]. The consistent significance of the ECT term across all models underscores the importance of environmental taxes in driving long-term adjustments, a conclusion also supported by [34]. The strong long-term relationship suggests that while the short-term effects of environmental taxes can vary due to factors such as industry structure, policy design, and enforcement levels, their long-term benefits are more stable and significant than their short-term effects.
Comparing these results with the existing literature, the findings align with studies indicating that environmental taxes have a dual purpose: reducing environmental harm and fostering economic growth. The differences in results across countries highlight the crucial roles of policy implementation, economic structure, and enforcement mechanisms in determining the effectiveness of environmental taxation. In general, this study contributes to the growing body of literature confirming the positive role of well-structured environmental taxes in achieving sustainable economic growth, especially in resource-rich and pollution-intensive economies. This supports the argument that environmental taxes when adequately designed and implemented, align with the dual objectives of environmental protection and economic development.
6. Conclusions
This study provides valuable insights into the complex dynamics between environmental tax revenue and economic growth in the European Union. By examining the distinct effects of various tax types, this analysis highlights the importance of strategic policy design tailored to the national context. Resource and pollution taxes have emerged as particularly effective in promoting sustainable economic development, demonstrating their potential as critical tools for long-term growth strategies. The results underline the need for policymakers to consider economic conditions, resource endowments, and enforcement mechanisms when implementing environmental taxes. Variations in the short- and long-run impacts across countries and models emphasize the importance of balancing immediate economic priorities with broader sustainability goals. This study underscores the role of environmental taxes in addressing both fiscal and environmental challenges, advocating their integration into comprehensive policy frameworks.
While energy and transport taxes offer opportunities to enhance economic performance, their success depends on addressing structural and sectoral differences among nations. Evidence suggests that well-coordinated fiscal measures can maximize the benefits of environmental taxes, fostering innovation and investment in green technologies. Moreover, the findings support the view that environmental taxes are essential for driving transitions toward low-carbon, resource-efficient economies. This study reinforces the critical role of environmental taxation in shaping sustainable economic trajectories. However, it also calls for further exploration of how these taxes interact with other policy instruments and economic variables to optimize their effectiveness. The systemic nature of our findings highlights the importance of designing environmental taxes with an understanding of their interactions with national and supranational policy frameworks. Recognizing these as part of a wider system enables the creation of more adaptive and effective policy instruments. By aligning tax measures with broader policy objectives, countries can better navigate the challenges of achieving both economic growth and environmental sustainability. This reinforces the systemic nature of the relationship between environmental taxation and economic development, where long-term outcomes emerge from the interaction of fiscal, social, and environmental subsystems.
6.1. Policy Implications
In the context of the European Union’s commitment to achieving the United Nations’ Sustainable Development Goals (SDGs), environmental taxation has several key policy implications. First, it supports SDG 13 (Climate Action) by reducing greenhouse gas emissions and SDG 8 (Decent Work and Economic Growth) by fostering green jobs and sustainable economic opportunities. By discouraging harmful environmental practices while generating revenue, these taxes help to balance economic development with ecological protection, facilitating the EU’s transition to a low-carbon economy. Revenues can be strategically reinvested in renewable energy, green infrastructure, and circular economy initiatives to enhance long-term resilience. Additionally, revenue recycling—such as reducing distortionary taxes on labor—can yield a “double dividend” by boosting economic efficiency while mitigating ecological damage. Environmental taxes also drive innovation, encouraging industries to adopt cleaner technologies and strengthening the EU’s global competitiveness under the Green Deal. Furthermore, reduced pollution improves public health, lowers healthcare costs, and increases workforce productivity, thereby contributing to overall well-being. However, to ensure social equity, policymakers must implement compensatory measures, such as subsidies or tax credits, to mitigate the disproportionate impacts on lower-income households, ensuring a just and inclusive transition toward sustainability. By adopting a well-designed and inclusive approach, environmental tax can become a powerful policy instrument that promotes sustainable development. In this way, it can align economic, environmental, and social objectives, creating a balance between growth and environmental protection. As a result, such a policy contributes to a fairer distribution of resources and the long-term sustainability of society.
6.2. Limitations and Future Research Directions
One of the primary limitations of this study is the relatively small dataset covering the period from 2013 to 2022, which was determined by the availability of public data related to environmental taxes. Limited data availability and transparency may have influenced the reliability and depth of the findings. Future research could address these constraints by incorporating more extensive datasets or by exploring alternative empirical approaches. By expanding the timeframe or including additional variables, researchers would be able to better evaluate long-term trends and their implications, thereby enhancing the reliability of the conclusions.
Focusing on tax variables in this study allows for a focused analysis of the relationship between tax policies and economic development, providing clear and interpretable insights. However, future studies with broader datasets may uncover more comprehensive patterns, leading to a deeper understanding of the topic. Future research can expand on the findings of this study by including a wider variety of environmental indicators, leveraging larger and more comprehensive datasets, and broadening the regional scope of the analysis. This implies including this region and adding the United States and China in order to provide a comparative analysis among them. Additionally, accounting for potential feedback mechanisms could offer a more nuanced understanding of the intricate connection between environmental tax and economic development. These enhancements would provide richer insights and further refine our understanding of this multifaceted relationship.
Author Contributions
Conceptualization, B.K. and V.M.; methodology, D.B.; validation, S.S.A. and M.R.; data analysis, B.K.; writing—original draft preparation, B.K.; writing—review and editing, B.K., V.M., D.B., S.S.A. and M.R. All authors have read and agreed to the published version of the manuscript.
Funding
This research was funded by the Provincial Secretariat for Higher Education and Scientific Research of the Autonomous Province of Vojvodina, the Republic of Serbia, during the project “Financial, marketing and management aspects of energy efficiency in the function of sustainable development of AP Vojvodina”, grant number: 003062555 2024 09418 003 000 000 001-02.
Data Availability Statement
Data are available on the websites of the Eurostat Open Data database.
Conflicts of Interest
The authors declare no conflicts of interest.
References
- Alola, A.A.; Muoneke, O.B.; Okere, K.I.; Obekpa, H.O. Analysing the co-benefit of environmental tax amidst clean energy development in Europe’s largest agrarian economies. J. Environ. Manag. 2023, 326, 116748. [Google Scholar] [CrossRef] [PubMed]
- Socci, C.; Ahmed, I.; D’Andrea, S.; Deriu, S.; Mathkur, N.M. Role of carbon tax in sustainable economic growth. Environ. Dev. Sustain. 2024, 26, 20987–21017. [Google Scholar] [CrossRef]
- Hunjra, A.I.; Bouri, E.; Azam, M.; Azam, R.I. Economic growth and environmental sustainability in developing economies. Res. Int. Bus. Financ. 2024, 70, 102341. [Google Scholar] [CrossRef]
- Milicevic, N.; Djokic, N.; Mirovic, V.; Djokic, I.; Kalas, B. Banking Support for Energy Security: The Customer Aspect. Sustainability 2023, 15, 112. [Google Scholar] [CrossRef]
- Kukharets, V.; Čingiene, R.; Juočiūnienė, D.; Kukharets, S.; Blažauskas, E.; Szufa, S.; Muzychenko, A.; Belei, S.; Lahodyn, N.; Hutsol, T. Regression Analysis of the Impact of Foreign Direct Investments, Adjusted Net Savings, and Environmental Tax Revenues on the Consumption of Renewable Energy Sources in EU Countries. Energies 2024, 17, 4465. [Google Scholar] [CrossRef]
- Štreimikienė, D.; Samusevych, Y.; Bilan, Y.; Vysochyna, A.; Sergi, B.S. Multiplexing efficiency of environmental taxes in ensuring environmental, energy, and economic security. Environ. Sci. Pollut. Res. 2022, 29, 7917–7935. [Google Scholar] [CrossRef]
- Delgado, F.J.; Freire-Gonzáles, J.; Presno, M.J. Environmental taxation in the European Union: Are there common trends? Econ. Anal. Policy 2022, 73, 670–682. [Google Scholar] [CrossRef]
- Esen, O.; Yildrim, D.C.; Yildrim, S. Pollute less or tax more? Asymmetries in the EU environmental taxes—Ecological balance nexus. Environ. Impact Assess. Rev. 2021, 91, 106662. [Google Scholar] [CrossRef]
- D’Errico, M.C. Sustainable economic growth and energy security nexus: A stochastic frontier analysis across OECD countries. Energy Econ. 2024, 132, 107447. [Google Scholar] [CrossRef]
- Citil, M. Is green finance a prerequisite for green growth of G-20 economies. Innov. Green Dev. 2024, 3, 100170. [Google Scholar] [CrossRef]
- Shakerin, S.; Moosavi, S.N.; Aminifard, A. Economic-environmental assessment of emission tax policy in developing countries: Evidence from Iran. China Agric. Econ. Rev. 2024, 16, 368–386. [Google Scholar] [CrossRef]
- Chu, L.K. Towards achieving energy transition goal: How do green financial policy, environmental tax, economic complexity, and globalization matter? Renew. Energy 2024, 222, 119933. [Google Scholar] [CrossRef]
- Štreimikienė, D. Impact of Environmental Taxes on Sustainable Energy Development in Baltic States, Czech Republic and Slovakia. E+M Ekon. Manag. 2015, 18, 4–23. [Google Scholar] [CrossRef][Green Version]
- Stern, D.I. The environmental Kuznets curve after 25 years. J. Bioecon. 2017, 19, 7–28. [Google Scholar] [CrossRef]
- Dinda, S. Environmental Kuznets Curve Hypothesis: A Survey. Ecol. Econ. 2004, 49, 431–455. [Google Scholar] [CrossRef]
- Gill, A.R.; Viswanathan, K.K.; Hassan, S. The Environmental Kuznets Curve (EKC) and the environmental problem of the day. Renew. Sustain. Energy Rev. 2018, 81 Pt 2, 1636–1642. [Google Scholar] [CrossRef]
- Leal, P.H.; Marques, A.C. The evolution of the environmental Kuznets curve hypothesis assessment: A literature review under a critical analysis perspective. Heliyon 2022, 8, e11521. [Google Scholar] [CrossRef]
- Freire-González, J. Environmental taxation and the double dividend hypothesis in CGE modelling literature: A critical review. J. Policy Model. 2018, 40, 194–223. [Google Scholar] [CrossRef]
- Patuelli, R.; Nijkamp, P.; Pels, E. Environmental tax reform and the double dividend: A meta-analytical performance assessment. Ecol. Econ. 2005, 55, 564–583. [Google Scholar] [CrossRef]
- Xu, Y.; Liao, X.; He, R.; Liu, S. Impact of environmental regulation intensity on the efficiency of sustainable economic growth in the European Union. J. Clean. Prod. 2024, 434, 140047. [Google Scholar] [CrossRef]
- European Environment Agency—EEA. Market-Based Instruments for Environmental Policy in Europe; Technical Report No. 8; European Environmental Agency: Copenhagen, Denmark, 2005. [Google Scholar]
- Ekins, P.; Summerton, P.; Thoung, C.; Lee, D. A Major Environmental Tax Reform for the UK: Results for the Economy, Employment and the Environment. Environ. Resour. Econ. 2011, 50, 447–474. [Google Scholar] [CrossRef]
- European Commission. Tax Provisions with a Potential Impact on Environmental Protection; Office for Official Publications of the European Communities: Luxembourg, 1997. [Google Scholar]
- Radulescu, M.; Sinisi, C.I.; Popescu, C.; Iacob, S.E.; Popescu, L. Environmental Tax Policy in Romania in the Context of the EU: Double Dividend Theory. Sustainability 2017, 9, 1986. [Google Scholar] [CrossRef]
- Patel, S.K.; Jhalani, P. Formulation of variables of environmental taxation: A bibliometric analysis of Scopus database (2001–2022). Environ. Dev. Sustain. 2024, 26, 7687–7714. [Google Scholar] [CrossRef]
- Andreoni, V. Environmental taxes: Drivers behind the revenue collected. J. Clean. Prod. 2019, 221, 17–26. [Google Scholar] [CrossRef]
- Hassan, M.; Oueslati, W.; Rousselière, D. Environmental taxes, reforms and economic growth: An empirical analysis of panel data. Econ. Syst. 2020, 4, 100806. [Google Scholar] [CrossRef]
- Tchapchet-Tchouto, J.-E.; Koné, N.; Njoya, L. Investigating the Effects of Environmental Taxes on Economic Growth: Evidence from Empirical Analysis in European Countries. Environ. Econ. 2022, 13, 1–15. [Google Scholar] [CrossRef]
- Mirović, V.; Kalaš, B.; Andrašić, J.; Milenković, N. Implications of Environmental Taxation for Economic Growth and Government Expenditures in Visegrad Group Countries. Politická Ekon. 2024, 71, 422–446. Available online: https://polek.vse.cz/pdfs/pol/2023/04/03.pdf (accessed on 19 June 2025). [CrossRef]
- Oueslati, W. Growth and welfare effects of environmental tax reform and public spending policy. Econ. Model. 2015, 45, 1–13. [Google Scholar] [CrossRef]
- Abdullah, S.; Morley, B. Environmental taxes and economic growth: Evidence from panel causality tests. Energy Econ. 2014, 42, 27–33. [Google Scholar] [CrossRef]
- Spinesi, L. The Environmental Tax: Effects on Inequality and Growth. Environ. Resour. Econ. 2022, 82, 529–572. [Google Scholar] [CrossRef]
- Ajeigbe, K.B.; Ganda, F. The Impact of Pollution and Carbon Emission Control on Financial Development, Environmental Quality, and Economic Growth: A Global Analysis. Sustainability 2024, 16, 8748. [Google Scholar] [CrossRef]
- Chengao, Y.; Mayburov, I.A.; Ying, W. Fiscal Effects of Environmental Tax Reform: A Comparative Analysis of China, Germany and the United Kingdom. J. Tax Reform 2024, 10, 258–270. Available online: https://taxreform.ru/en/archive/journal/301/article/2735/ (accessed on 19 June 2025). [CrossRef]
- Erdogan, S. Linking green fiscal policy, energy, economic growth, population dynamics, and environmental degradation: Empirical evidence from Germany. Energy Policy 2024, 189, 114110. [Google Scholar] [CrossRef]
- Zhang, Y.; Khan, I.; Zafar, M.W. Assessing environmental quality through natural resources, energy resources, and tax revenues. Environ. Sci. Pollut. Res. 2022, 29, 89029–89044. [Google Scholar] [CrossRef]
- Wolde-Rufael, Y.; Mulat-weldemeskel, E. Effectiveness of environmental taxes and environmental stringent policies on CO2 emissions: The European experience. Environ. Dev. Sustain. 2023, 25, 5211–5239. [Google Scholar] [CrossRef]
- Touitou, M.; Langarita, R. Environmental Kuznets Curve for Carbon Dioxide Emissions and Economic Growth in Algeria. Margin J. Appl. Econ. Res. 2021, 15, 418–432. [Google Scholar] [CrossRef]
- Fang, G.; Yang, K.; Tian, L.; Ma, Y. Can environmental tax promote renewable energy consumption?—An empirical study from the typical countries along the Belt and Road. Energy 2022, 260, 125193. [Google Scholar] [CrossRef]
- Stameski, N.; Radulescu, M.; Zelenović, V.; Mirović, V.; Kalaš, B.; Pavlović, N. Investigating the Effects of Environmental Tax Revenues on Economic Development: The Case of Nordic Countries. Sustainability 2024, 16, 7957. [Google Scholar] [CrossRef]
- Pesaran, M.H. General diagnostic tests for cross section dependence in panels. In Cambridge Working Papers in Economics 2004; No. 0435; Faculty of Economics, University of Cambridge: Cambridge, UK, 2004. [Google Scholar] [CrossRef]
- Pesaran, M.H. A simple panel unit root test in the presence of cross-section dependence. J. Appl. Econom. 2007, 22, 265–312. [Google Scholar] [CrossRef]
- Wooldridge, J.M. Introductory Econometrics: A Modern Approach, 5th ed.; Cengage Learning: Boston, MA, USA, 2013. [Google Scholar]
- Friedman, M. The use of ranks to avoid the assumption of normality implicit in the analysis of variance. J. Am. Stat. Assoc. 1937, 32, 675–701. [Google Scholar] [CrossRef]
- Frees, E.W. Assessing cross-sectional correlation in panel data. J. Econom. 1995, 69, 393–414. [Google Scholar] [CrossRef]
- Neog, Y.; Gaur, A.K. Macro-economic determinants of tax revenues in India: An application of dynamic simultaneous equation model. Int. J. Econ. Policy Emerg. Econ. 2020, 13, 13–35. [Google Scholar] [CrossRef]
- Jalles, J.T. Tax capacity and growth in the Asia-Pacific region. J. Asia Pac. Econ. 2021, 26, 527–551. [Google Scholar] [CrossRef]
- Asandului, M.; Lupu, D.; Maha, L.-G.; Viorică, D. The asymmetric effects of fiscal policy on inflation and economic activity in post-communist European countries. Post-Communist Econ. 2021, 33, 899–919. [Google Scholar] [CrossRef]
- Espoir, D.K.; Sunge, R.; Bannor, F. Exploring the dynamic effect of economic growth on carbon dioxide emissions in Africa: Evidence from panel PMG estimator. Environ. Sci. Pollut. Res. 2023, 30, 112959–112976. [Google Scholar] [CrossRef]
- Hausman, J.A. Specification tests in econometrics. Econometrica 1978, 46, 1251–1271. [Google Scholar] [CrossRef]
- Isiksal, A.Z.; Assi, A.F. Determinants of sustainable energy demand in the European economic area: Evidence from the PMG-ARDL model. Technol. Forecast. Soc. Change 2022, 183, 121901. [Google Scholar] [CrossRef]
- Batrancea, I.; Batrancea, L.; Rathnaswamy, M.M.; Tulai, H.; Fatacen, G.; Rus, M.I. Greening the Financial System in USA, Canada and Brazil: A Panel Data Analysis. Mathematics 2020, 8, 2217. [Google Scholar] [CrossRef]
- Mazanec, J. The Impact of Working Capital Management on Corporate Performance in Small–Medium Enterprises in the Visegrad Group. Mathematics 2022, 10, 951. [Google Scholar] [CrossRef]

Disclaimer/Publisher’s Note: The statements, opinions and data contained in all publications are solely those of the individual author(s) and contributor(s) and not of MDPI and/or the editor(s). MDPI and/or the editor(s) disclaim responsibility for any injury to people or property resulting from any ideas, methods, instructions or products referred to in the content. |
© 2025 by the authors. Licensee MDPI, Basel, Switzerland. This article is an open access article distributed under the terms and conditions of the Creative Commons Attribution (CC BY) license (https://creativecommons.org/licenses/by/4.0/).