Abstract
The sustainable development of the new energy vehicle (NEV) industry necessitates the dynamic optimization of policies tailored to local circumstances. However, certain regional policies may face ineffectiveness and demand urgent attention and adjustment. This study aims to promote the sustainable development of the NEV industry by dynamically optimizing and adjusting regional policies and policy environments. This research delves into the dynamic joint effect of regional policies and policy environments on sustainable development from the perspective of the industrial ecosystem. First, this study dynamically reveals China’s cross-regional policy intensity’s evolutionary differences through improved word embeddings. Secondly, it further compares dynamic differences in configuration paths of regional policy mixes and policy environments through dynamic Qualitative Comparative Analysis and Necessary Condition Analysis. Finally, it uncovers dynamic changes and differences in the necessity degree of various elements in cross-regional configuration paths. Key findings include the following: (1) The joint effect of policy mixes and policy environments can promote sustainable development of the NEV industry. (2) There exists spatial heterogeneity in each region’s configuration paths for sustainable development of the NEV industry. The Eastern region of China has rich configuration paths, while those in other regions are relatively few. (3) The configuration paths across regions change dynamically, showing four evolutionary trajectories: shifting, oscillating, emerging, and sustained.
1. Introduction
Compared with the environmental pollution and carbon emission problems caused by traditional energy vehicles, new energy vehicles (NEVs) can significantly reduce greenhouse gas emissions and reduce the degree of pollution to the atmospheric environment, which is of great significance for achieving carbon reduction goals and mitigating climate change [1]. The increasing awareness of environmental protection and the pressing need for sustainable development have significantly heightened the demand for new energy vehicles to replace traditional fossil fuel vehicles [2]. Governments around the world have issued incentive policies to promote the development of the new energy vehicle industry. As China is the world’s largest market for new energy vehicles, the sustainable development of China’s NEV industry plays a vital role in promoting the global transportation sector’s green transformation. The core of the sustainable development of the NEV industry lies in three-dimensional coordination and dynamic balance among economic growth, social progress, and environmental protection [3]. However, the NEV industry faces multifaceted challenges in the process of sustainable development. In terms of the economy, companies face high costs in research, development, and manufacturing, as well as intense market competition [4]. Some NEV companies are on the verge of shutdown or closure, particularly after the withdrawal of purchase subsidies. Regarding ecology, enterprises confront difficulties in achieving breakthroughs in key green technology innovations. With respect to society, consumers’ concerns about the performance, safety, and after-sales service of NEVs drive these enterprises to enhance corporate social responsibility practices [5]. Meanwhile, consumers’ interaction with technology in diverse transportation environments also affects their willingness to adopt [6]. Given the external characteristics of the industry’s economic, ecological, and social objectives [7], relying solely on market mechanisms to drive its sustainable development may lead to market risks and even failures. Therefore, systematic policy support is essential for sustainable development in the NEV industry [8].
However, industrial policies in various regions may not be effectively integrated with the local environment, lacking flexibility and dynamics, which can result in policy ineffectiveness [9]. Firstly, due to the lack of a policy environment that is compatible with industrial policies, some regions implement insufficient or excessive measures, resulting in ineffective policy implementation. According to institutional theory, policies do not exist independently but are influenced by the policy environments. Therefore, formulating industrial policies that align with local policy environments is crucial for enhancing the effectiveness of policy implementation and promoting the sustainable development of the NEV industry. Secondly, industrial policies exhibit characteristics of regional imbalance and homogenization [9]. Thus, it is crucial to develop and implement more differentiated and localized policy strategies. This ensures that policies can not only drive the overall development of the NEV industry at the macro level but also address the specific conditions, resource endowments, and actual needs of each region at the micro level. Thirdly, the dynamic changes in policy formulation are insufficient to meet the dynamic demands of industrial sustainable development [10], such as technological advancements and shifts in market demand. Therefore, it is necessary to enhance the adaptability and flexibility of policies according to the current situation, enabling timely adjustments to new demands in industrial development and promoting the sustainable growth of the NEV industry. Therefore, it is necessary to consider the joint effects of various policies comprehensively to ensure their effectiveness and sustainability [7]. Overall, these problems severely constrain the effectiveness of local industrial policies, making it difficult to adequately address the complex challenges faced by the NEV industry in its sustainable development. How to combine the policy environment and dynamically and adaptively formulate systematic industrial policies, thereby effectively promoting the sustainable development performance of the NEV industry, has become a critical issue worthy of in-depth exploration.
In this context, dynamic analysis of regional industrial policy has become a hot topic for researchers. Although existing research has covered analyses of policy effects and policy influence mechanisms, there are still notable research gaps that warrant particular attention. Firstly, most existing research examines the impact of a specific type of policy or a single policy environment element on the sustainable development of the NEV industry, ignoring the analysis of the joint effects of industrial policy mixes and multiple policy environment elements [11]. A more comprehensive analysis of the joint impact of policy mixes and policy environment elements is needed. On the one hand, in the aspect of policy mixes, existing research overlooks the interaction and comprehensive effects of different industrial policies. However, as the NEV industry is an emerging industry, its sustainable development is a complex process, which is influenced by complicated factors and has a strong policy dependence. Relying solely on a single policy often fails to effectively drive the sustainable development of the industry [9]. Therefore, to promote sustainable development, there is an urgent need for various policies to complement and collaborate to form strong policy joint effects, jointly address the complex problems in industry development, and improve the sustainable development performance [12]. On the other hand, the existing research lacks the consideration of the joint effects of policy elements and policy environment elements on sustainable development. In fact, policy implementation needs to be combined with policy environments such as basic resources, demand conditions, and technological innovation. Therefore, NEV policies do not exist in isolation but work together with policy environment elements such as capital [13], talent, and technology innovation [14]. This highlights the necessity of considering the interaction with various policy environment elements when studying NEV industry policies, to thoroughly reveal the policy effects on promoting the sustainable development performance of the NEV industry.
Moreover, the existing research ignores regional differentiated impacts and the dynamic effects of industrial policy mixes and policy environment elements on sustainable development performance. Few studies have considered the joint effects of both time and region simultaneously. The limitations of past studies make it difficult to provide comprehensive optimization recommendations for industrial policies and the policy environments tailored to specific temporal–spatial contexts, thereby limiting their potential to promote the sustainable development of the NEV industry. On the one hand, there are significant disparities in the resource endowments and market demands of the NEV industry in different regions [15]. Therefore, it is essential to provide targeted policy guarantees and optimize environmental elements. Blind and disorderly policy measures will to some extent lead to policy mistakes and resource misallocation [16], inhibiting the sustainable development of the NEV industry. On the other hand, the sustainable development of the NEV industry is indeed a complex and dynamic process [3], which requires the support of flexible industrial policies and policy environments. This support can enable the NEV industry to have sufficient flexibility to adapt to constantly changing economic, social, and environmental development needs. In addition, the NEV industry features multiple developmental stages, namely the embryonic, growth, and mature stages. To better adapt to the variations in internal and external resources, as well as the environment across different stages, flexibly adjustable industrial policies and policy environments are essential, which can effectively prevent policy lags, address policy mismatches, and meet the sustainable development needs of the NEV industry. Hence, it is necessary to introduce temporal–spatial policy analytical perspectives to reveal how to dynamically and pertinently design regional NEV industrial policies and optimize environmental elements for driving its sustainable development.
In order to address the research gaps mentioned above, this study aims to improve the sustainable development of the NEV industry through exploring the joint mechanism of regional policy mixes and policy environment elements on the sustainable development of the NEV industry from the perspective of regional differences and dynamic evolution. Specifically, this research proposes the following research questions (RQ).
RQ1: What policy mixes and policy environment elements’ joint effect can effectively improve the sustainable development performance of the NEV industry?
RQ2: What are the differentiated configuration paths across different regions composed of policy mixes and policy environment elements to promote the sustainable development performance of the NEV industry?
RQ3: How can the policy configuration paths of each region dynamically evolve to continuously improve sustainable development performance of the NEV industry?
This study makes several contributions toward relevant research and practice in the field of industrial policy analysis and sustainable development: (1) This study addresses the limitation of previous research that primarily analyzed single industry policies or policy environment elements, greatly expanding the research boundary of the elements influencing sustainable development performance through policy mixes and policy environments. On the basis of previous studies that only focused on the impact of a single policy type on the sustainable development of the NEV industry [17], this study innovatively analyzes the joint effects of policy mixes and policy environment elements from the perspective of the industrial sustainable development ecosystem, enriching the analysis of improving sustainable development performance. Specifically, it profoundly reveals the effects of demand-type, supply-type, and environment-type industrial policies and five types of multi-dimensional policy environment elements on sustainable development performance. (2) This research enriches the research on the regional differentiated impact of policy mixes and policy environment elements on the sustainable development performance of the NEV industry, providing a new spatial dimension perspective for understanding the implementation effects of industrial policies in different regions. Previous studies lack the exploration of regional differences in policy mix [18]. This study conducts an in-depth analysis of the spatial heterogeneity of policy mixes and policy environments in the industrial ecosystem on the sustainable development of the NEV industry. Using the methods of dynamic Qualitative Comparative Analysis (QCA) and Necessary Condition Analysis (NCA), this study explores the differences in configuration paths for the sustainable development of NEV industries in different regions. (3) This study further innovatively explores the time mechanism of the configuration path and the necessity of each element in the configuration path of each region, and it provides key theoretical support for dynamic research on the sustainable development of the NEV industry. Existing studies ignore the dynamic change analysis of the regional policy portfolio of the NEV industry in combination with the time dimension [19]. This study elucidates the dynamic evolution process of the sustainable development path of the NEV industry from the time dimension and expands the research on the dynamic effects of policy mixes and policy environment elements on the sustainable development performance of the NEV industry. (4) The findings also provide practical insights for governments to dynamically and targetedly formulate NEV industry policies and optimize the policy environments. The government can dynamically adjust industrial policies according to the differences and changes of regional industrial development, realize the efficient allocation of various policy types, and play the synergy of policy mixes. In addition, it helps enterprises gain a deep understanding of the policy orientation and development priorities of the NEV industry in various regions, dynamically optimizing and adapting decisions to achieve efficient resource allocation. Moreover, these findings serve as valuable references for other countries or regions.
The subsequent sections are organized as follows. Section 2 is a literature review that reviews previous relevant literature. Section 3 provides a theoretical framework for analyzing the sustainable development and factor allocation of the NEV industry. Section 4 outlines the research framework and provides a detailed introduction to data sources and methods, including latent Dirichlet allocation (LDA), word embeddings for policy quantification, and dynamic QCA and NCA methods for analyzing configuration paths. Section 5 presents the results of policy analysis, as well as the dynamic differences in configuration paths and key elements. Section 6 presents discussions. Finally, Section 7 summarizes key findings and offers recommendations for governments and enterprises, limitations, and future research.
2. Literature Review
As a means for the government to promote industrial development, the formulation and implementation of reasonable and effective policies for NEVs is an important guarantee to promote the sustainable development of the NEV industry [20]. Economically, tax incentives and government procurement policies for the NEV industry play a positive role in promoting the industry’s capital market [21]. Subsidy policies in different regions have differential impacts on corporate performance [22]. Ecologically, relieving energy and environmental pressures is an important part of the NEV industry policy. The increasingly strict environmental protection policies in the new energy vehicle industry are conducive to further improving the performance of core components such as batteries and motors [23], which have significant effects on reducing carbon emissions [24] and improving environmental quality [25] and have facilitated green technology innovation [10,26]. Socially, preferential policies for NEVs significantly contribute to the social popularization of NEVs [27]. Government subsidy policies can effectively accelerate the dissemination of NEVs [28].
At the same time, scholars have conducted extensive research on the mechanisms by which policies affect the sustainable development of industries. On one hand, scholars analyzed the effects of a certain type of policy, exploring the impact of single policy measure such as subsidy policies [29,30], demonstration and promotion policies [31], incentive policies [28], and carbon tax policies [32] on the development of the NEV industry, or conducting separate studies on the impact and effects of a certain policy [2,17]. For example, fiscal and tax policies can relieve the financial pressure of enterprises to a certain extent [13], and environmental regulation policies can facilitate the green transformation of the industry [33]. On the other hand, scholars compared the effects of two policies, such as analyzing the differences in the impact of carbon management and subsidy policies on the profits and carbon emissions of NEV products [34] or comparing the effect of new energy vehicle promotion policies and environmental policies on carbon emissions [35]. However, these studies have overlooked the joint effects of different types of policies. Multiple policies need to complement each other to form an effective policy synergy, promoting the sustainable development of the NEV industry [36]. Scholars have also studied other influencing factors, indicating that in addition to policy support, elements such as the industry’s basic resources [19] and technological innovation [37] also have essential impacts on the sustainable development of the NEV industry. To achieve better policy outcomes, they need to form a linkage effect with various policy environment elements, including local industry, financial resources [13], and innovation [14]. For example, without adequate basic resource support, NEV policies may be ineffective in promoting the industry’s development [19]. At the same time, given the significant differences in technological levels, infrastructure, and market demand across regions, one-size-fits-all policies may not effectively promote sustainable industrial development in the different regions [15]. Therefore, policies for the NEV industry do not exist in isolation, but rather work together with the market, resources [13], technology [14], and other factors. When studying the role of NEV policies, it is necessary to comprehensively consider the joint effects of policies and other elements.
In addition, the existing research lacks the comprehensive consideration of the regional differences and dynamic impact of the NEV industry policy on the sustainable development of the industry. Blind policies and measures may hinder the sustainable development of the NEV industry. For example, if policy measures lack specificity or are poorly implemented, it may cause the direction of research and development (R&D) investment to deviate from market demands and technological development trends, thereby suppressing the innovation capabilities and development impetus of NEV enterprises. Unreasonable policies may lead to distorted market signals, resulting in inefficient resource allocation. This not only affects the sustainable operation capabilities of NEV enterprises but also has an impact on the healthy development of the entire NEV industry. In terms of regional heterogeneity of policy effects, scholars have compared the differences in the effectiveness of subsidy policies across various regions and explored the impact of policies on corporate performance [22]. There are also differences in incentive policies for NEVs in different countries [18]. Compared to other countries, China’s NEV industry policies need to further improve subsidy and tax policies, while setting more reasonable targets for NEV infrastructure and research and development investment [38]. However, these studies have overlooked the exploration of regional differences in policy mixes. In terms of the dynamic evolution of policy effects, some scholars have analyzed the evolution of policy tools for NEVs from a temporal perspective, exploring the process of policy evolution from simple subsidies to comprehensive measures. The analysis found that the policy focus has shifted from relying solely on subsidies to promoting technology research and development and improving product quality, gradually shifting from subsidy-driven to technology innovation and market-mechanism-driven [3]. In the early stages of NEV development, fiscal subsidy policies can stimulate the rapid development of new technologies [39] and immature markets [40]. In the later stages of NEV development, elements such as technological innovation and resource support can help them shift from subsidy stimulation to endogenous development [19].
In summary, current research has conducted a comprehensive exploration of policies for the NEV industry (as shown in Table 1). First, numerous scholars have deeply analyzed the key impacts of single policy types and non-policy factors such as resources and technology on the sustainable development of the NEV industry, enriching the research on influencing factors of sustainable development in the new energy vehicle industry. However, they have not emphasized the joint effects of different policy types or the importance of synergies between policies and non-policy elements. Second, at the regional level, existing studies have compared and analyzed the effectiveness differences of demand-type policies (such as subsidy policies) across different regions, providing initial ideas for formulating tailored policies, but have overlooked the impact differences of policy mixes in different regions. Additionally, existing research has explored the evolutionary process of NEV policy tools from a temporal dimension, clarifying the trend of policies shifting from subsidy dependence to market mechanism-driven approaches, which provides directional guidance for dynamic policy adjustment. However, existing studies have not fully integrated the temporal dimension to deeply analyze the dynamic variation differences in the joint action mechanisms of policy mixes and policy environment elements. Therefore, there are still knowledge gaps in the literature. Firstly, the mechanism of the joint effects of policy mixes and policy environment elements needs to be explored. Previous studies have mainly analyzed the effects of a specific type of policy, but there remains a lack of in-depth research on the interaction mechanism between policy mixes and various elements of the policy environment. Secondly, existing research has examined the regional differences in the impact of policy elements but has not taken into account the regional heterogeneity of the impact of policy mixes on the sustainable development of the NEV industry. Finally, existing research has not yet further analyzed the differences and dynamic changes in regional policies for the NEV industry in conjunction with the time dimension. This study aims to fill the gaps in existing research, enrich theoretical insights into the sustainable development of industries, and provide a reference for policy formulation and industry development in the NEV industry.

Table 1.
Relevant studies list.
3. Theoretical Framework
This study builds a conceptual model based on industry policy theory, industrial sustainable development ecosystem theory, and configuration theory. Firstly, industry policy theory enhances the understanding of the government’s role in sustainable industrial development. The government designs and implements different types of policy tools to optimize resource allocation and market conditions and promote industrial growth. Industrial policies are classified into demand-type, supply-type, and environment-type policies [43]. Various specific measures of these three types of policy tools form a policy mix that promotes industrial development after careful evaluation and selection [44]. Secondly, an industrial ecosystem is the collection and interaction of various elements that have a significant impact on the development of an industry. It is an organic system composed of industrial subjects and policy systems, factor supply, social environment, and other industrial external environments [45]. In the NEV industry, the industrial ecosystem is a complex system composed of industrial subjects and industrial environmental elements. These industrial subjects interact with multiple environmental elements such as policy, economy, technology, and society to jointly promote the development of the industrial ecosystem [46]. As an essential environmental element of the NEV industry ecosystem, policy tools need to work together with policy environment elements such as industrial subjects, economic environment, social environment, and technical environment. Therefore, the sustainable development of the NEV industry needs to comprehensively consider the complex role of the main factors of the industry and the industrial environment [47]. Thirdly, configuration theory identifies and analyzes how various conditions interact and combine in specific contexts to jointly produce certain outcomes [48]. Traditional data analysis methods (regression analysis) can only analyze a single part of the system separately, attributing linear relationships and unidirectional causality to organizational attributes and environmental elements [49]. Configuration theory explores how multiple conditions work jointly within the configuration of a specific context to produce outcomes. It focuses on analyzing the coexistence and complementary relationships of various organizations and environmental elements within the system from a holistic perspective, which helps identify issues and propose strategic recommendations [50].
Based on the above theoretical analysis, policy elements need to jointly act with industrial subjects and industrial environmental elements in the industrial ecosystem to achieve the sustainable development of the NEV industry. This study is based on the theories of sustainable development and industrial ecosystem and constructs a comprehensive analytical conceptual model for the sustainable development of the NEV industry. This conceptual model comprises three components: policy objectives, policy tools, and policy scenarios. This study constructs a conceptual model, as shown in Figure 1.
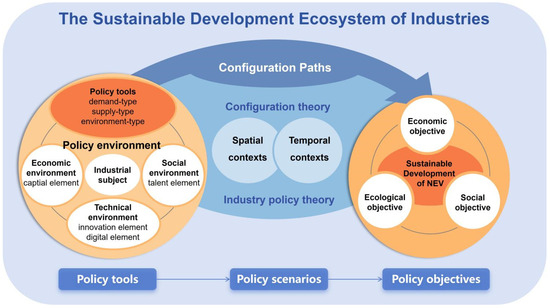
Figure 1.
Conceptual model.
Firstly, regarding the policy objectives, this conceptual model takes the sustainable development of the NEV industry as the policy goal, including three dimensions: economy, ecology, and society [3]. The economic dimension aims to promote the improvement of industrial economic benefits and ensure the long-term stable development of enterprises. The ecological dimension focuses on reducing the negative impact of industrial development on the environment by enhancing green innovation capabilities, reducing carbon emissions, and improving energy efficiency [51]. The social dimension focuses on the contribution of industries to social development, including creating employment opportunities, improving consumer welfare, etc. [52].
Secondly, regarding the policy tools, the joint effects of demand-type, supply-type, and environment-type policies need to be comprehensively considered. First, demand-type policy tools can stimulate the market demand side [53], with the government enhancing demand through procurement, market subsidies [54,55], etc. The government promotes market demand through procurement, market subsidies, price guidance, pilot demonstrations, and import and export trade control of NEVs to reduce market uncertainty surrounding NEVs. Second, supply-type policy tools focus on supporting enterprises by providing essential resources through industrial subsidies, infrastructure construction [56], technical support [57], etc. In the NEV industry, the government promotes from the supply side of enterprises and provides various types of resource support for the development of enterprises through industrial subsidies, infrastructure construction, technical support, talent introduction, and public services. Third, environment-type policy tools indirectly influence industrial development by guiding it through regulatory standards [58] and environmental regulations [25]. The government plays an indirect role in the industrial environment of NEVs through environmental policy tools and guides and supports industrial development through industrial planning, finance, tax incentives, regulations and standards, and environmental regulation. Only by coordinating three types of policy tools can we promote the sustainable development of the NEV industry [3].
Regarding the policy environments, NEV enterprises, as core entities can utilize resources more effectively, reduce costs, enhance corporate competitive advantage, and assist in the optimization and management of the industry by optimizing the upstream and downstream enterprises within the industrial chain. This approach helps minimize environmental impacts, boosts social benefits, and promotes sustainable industrial development [59]. Therefore, this study identifies the industrial subject as one of the antecedent variables for sustainable development. In addition, the environment of the new energy vehicle industry policy also covers the economic environment, social environment, technical environment, and other aspects, including capital, talent, innovation [60], and digitization [61]. Regarding the economic environment, the NEV industry, as an emerging industry, requires substantial capital investment [37], which can facilitate research and development, accelerate technological innovation, and enhance market promotion efforts [62]. Capital can better promote the synergy of different types of policies, such as demand-type and supply-type [13]. In terms of the social environment, talent is a critical component and key resource for creating enterprise value and achieving sustainable development [63]. High-quality talent can drive technological progress, optimize resource utilization, and improve innovation performance and production efficiency [64]. R&D talent provides essential technical support for sustainable development through continuous technological innovations, thereby enhancing a sustainable competitive advantage [65]. The technological environment characterized by technological innovation and digital development is the intrinsic driving force for industrial transformation and upgrading [66]. Through green innovation activities, enterprises can reduce energy consumption and pollutant emissions [67], while improving green total factor productivity [68] and energy efficiency [51]. As a core element of the policy environment, innovation elements can be coordinated with environmental regulatory policies [69] and industrial subsidy policies [29] to promote the effectiveness of NEV industry policies in reducing carbon emissions, thereby promoting the sustainable development of the industry. In addition, digitalization, as an emerging driving force [70], alleviates information asymmetry within the industrial chain and improves the effective utilization and allocation of resources [71], thereby providing strong technical support for sustainable development. These policy tools, in conjunction with the policy environment elements within the industrial ecosystem, collectively constitute the antecedent variables that affect sustainable industrial development [13,14].
Thirdly, policy scenarios consider the variations in the roles of policy mixes and policy environments in different temporal–spatial contexts. Specifically, spatial scenarios highlight the differences between regions, necessitating policy tools that adapt to the industrial bases and market demands of various areas. Policy environments have significant heterogeneity, and differences in policy environments across different regions can have different impacts on the implementation of industry policy [72]. Local governments should consider the regional heterogeneity of policy environment elements, such as local economic development and ecological environment, when implementing regional policies [73]. Temporal scenarios highlight the co-evolutionary relationship between the industrial ecosystem and policy tools, necessitating the adaptive adjustment of policy tools as the industry evolves.
The mechanism of policy mixes and policy environment elements on the sustainable development of NEV industry is as follows: Regarding the policy mixes, they stimulate the demand for NEVs in the market through demand-type policies, support the expansion of production scale and optimization of resource allocation through supply-type policies, optimize and integrate the NEV industry through environment-type policies, and promote the green development of the industry. The rational use of policy mixes can achieve market demand and supply matching for NEVs, guide the standardized development of the industry, and achieve sustainable development of the industry.
In terms of policy environment elements, firstly, industrial policies need to be combined with the local industrial development foundation. The level of industrial benefits can improve the efficiency of sustainable development of the NEV industry by enhancing its scale effect. Promoting outward cooperation among industrial entities can accelerate technological exchanges and industrial upgrading [74]. Secondly, the implementation of industrial policies requires the support of local industrial capital. The capital element supports the industry in obtaining funds by expanding financing channels, reducing financing costs and expenses. Capital turnover can open up channels for the transformation of achievements and promote the market transformation of innovative results. In terms of capital appreciation, enhancing the added value of research and development achievements through the transformation and market promotion process [13] can improve the overall efficiency of the industry and promote sustainable development [37]. Thirdly, policy implementation needs talent support. For the talent elements, the expansion of the talent scale can provide sufficient human resources for the industry. Talent education promotes technological innovation and industrial upgrading by cultivating composite talents with professional skills and innovative abilities and drives the sustainable development of industries [75]. Fourthly, the implementation of industrial policy needs to be combined with technological innovation. Innovation elements enhance research and development capabilities and accelerate the development of new technologies and products by increasing innovation investment and output. Enhancing market competitiveness and promoting sustainable development of industries by improving innovation transformation and innovation output [76]. Fifthly, the implementation efficiency of industrial policies needs to be improved by digitization. Digital industrialization provides the necessary digital facilities and technical basis [77,78]. Furthermore, through industrial digitization, the development of intelligent manufacturing is promoted, and the traditional production mode is transformed to the direction of sustainable intelligence [79].
4. Research Design
4.1. Research Framework
Figure 2 illustrates the research framework of this study. This study aims to dynamically and targetedly optimize the combination of industrial policies and policy environment elements, as well as the joint effect path, through a temporal–spatial analysis to improve the sustainable development performance of the NEV industry. Firstly, this study conducts dynamic mining and quantitative analysis of the policy mixes in each region. It employs LDA-based topic mining and word embedding techniques to analyze policy themes and keywords of provincial NEV policies and calculates the intensity of industrial policies to analyze their dynamic evolution. Secondly, dynamic QCA is utilized to analyze the policy intensity of three types of policies and the joint effects of five types of policy environment elements on sustainable development performance, thereby identifying key configuration paths in each region. Thirdly, this study further investigates the dynamic evolution of the configuration path formed by the joint effects of policy mixes and policy environment elements across four regions, aiming to improve sustainable development performance more effectively.
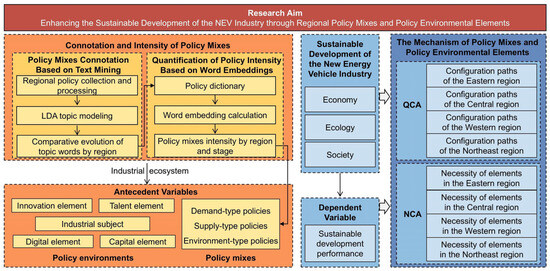
Figure 2.
Research framework of this study.
4.2. Research Samples and Data Collection
New energy vehicles include vehicles using non-traditional fuels (ethanol, biogas, biodiesel), electric vehicles, fuel cell vehicles, and various hybrids of these. This study selects A-share listed companies in the NEV industry from 2010 to 2023 in China as empirical samples. (In China’s securities market, A-shares refer to the stocks issued by companies registered in mainland China and listed on the stock exchanges in mainland China. These companies are usually an important part of the Chinese economy). By searching the concept of “new energy vehicle” on the iWencai website, a total of 589 A-share listed companies are identified. (iWencai is an online platform that provides financial data and information. It offers a wealth of macroeconomic data, corporate financial data, industry reports, etc., and is widely used for data queries and analysis in China’s financial market). A total of 263 listed companies in the NEV industry are determined as sample enterprises after manually excluding companies with ST, *ST designations, and those with incomplete financial data. (In China’s securities market, ST and *ST are markers used to identify abnormal financial conditions or other issues of listed companies. ST indicates that a company is facing financial difficulties or other risks, while *ST indicates a higher risk of delisting). These sample enterprises not only include emerging NEV manufacturers and vehicle manufacturers transformed from traditional vehicle manufacturers but also cover enterprises in the upstream and downstream NEV business (such as raw materials, batteries, engines, and controls, charging stations, etc.). They can reflect the development characteristics and operating conditions of the NEV industry from multiple dimensions, thus ensuring the representativeness of the sample for the NEV industry to the greatest extent possible.
The data of antecedent variables includes policy data and policy environment elements data. Among them, policies are retrieved by searching for titles containing the keyword “new energy vehicle” on PKULAW.COM and supplemented with policies proposed in literature research [80], ultimately determining 1604 provincial-level policies in the region where the sample enterprises are located. The data of policy environment elements come from the provincial statistical data of 20 provinces (municipalities directly under the central government, autonomous regions) where the sample enterprises are located, including statistical yearbooks, statistical bulletins, the China Stock Market and Accounting Research (CSMAR) database, the Economy Prediction System (EPS) Global Statistical Data Platform, and “Peking University Digital Inclusive Finance Index.”
The data of the dependent variable of sustainable development performance comes from the CSMAR database, the Incopat patent database, and two corporate social responsibility rating agencies, Hexun and Huazheng.
To facilitate a discussion on the dynamic evolution and regional differences in the sustainable development of the NEV industry, this study categorizes the samples by region. In terms of regional division, this article refers to the Fourteenth Five-Year Plan for National Economic and Social Development of the People’s Republic of China and the 2035 Long Range Objectives Outline and the Eleventh Five-Year Plan [81]. The Eastern region includes the most developed industrial clusters in China, such as the Bohai Rim, Yangtze River Delta, Pearl River Delta, and other national industrial clusters. These regions are in a leading position in the field of NEV industry by virtue of geographical location, economic base, and infrastructure. The Central region includes the urban agglomerations such as the Yangtze River Midstream Urban Agglomeration and the Central Plains Urban Agglomeration. The NEV industry in these regions also shows a relatively good development trend, has a certain industrial foundation and development potential, and the industrial chain is gradually improved. The Western region includes the Chengdu Chongqing Urban Agglomeration. The NEV industry in these regions has not been fully developed and is still at the key stage of industrial cultivation and upgrading. The Northeast region, including the Harbin–Changchun megalopolis and the Central and Southern Liaoning Urban Agglomeration, is a traditional industrial and manufacturing base in China with a sound industrial system. However, the development of the NEV industry is relatively slow [82]. Therefore, the 263 sample companies are divided into four geographic areas—Central, Eastern, Western, and Northeastern regions—based on their registered locations in provinces (including municipalities directly under the central government and autonomous regions).
Regarding phase division, the development of the NEV industry is characterized by four stages [81]: The first stage (2010–2013) is the pilot demonstration phase of NEVs, during which the government began selecting representative cities for demonstration and promotion of NEVs. The second stage (2014–2016) is the large-scale promotion phase, in which the government incentivized NEV purchases across more cities nationwide through comprehensive measures such as central and local purchase subsidies, government procurement, vehicle purchase tax exemption, and fuel vehicle traffic restrictions, promoting the large-scale development of the NEV industry. The third stage (2017–2019) is the market transition and development phase balancing quantity and quality, with purchase subsidies gradually phasing out and market competition for NEVs intensifying, focusing on improving product quality while advancing large-scale development. The fourth stage (2020–2023) is the high-quality development phase, with purchase subsidies eliminated and the ‘double credit’ policy further revised and improved, where NEVs place greater emphasis on technological innovation and enhancement of product service quality. The regional and phase classifications are detailed in Appendix A.
4.3. Variables Setting
4.3.1. Dependent Variables
The dependent variable NSP represents the sustainable development performance of the NEV industry, measured in terms of its economic, social, and ecological objectives [41]. The economic objective reflects the long-term and short-term financial status of enterprises [83,84]. The social objective is measured using the corporate social responsibility scores of NEV companies [85]. The ecological objective assesses the performance of green technology innovation, aiming to enhance the energy-saving efficiency of NEV products to meet ecological development requirements. The patent classification numbers of NEVs comply with the “International Patent Classification Green Inventory” published by the World Intellectual Property Organization (WIPO), and these patent data serve as a measure of green technology innovation performance [86]. The weights of each indicator are calculated using the entropy weight method. The entropy weight method is an objective weighting method that avoids the interference of human factors on the determination of weights [87].
4.3.2. Antecedent Variables
Table 2 displays eight antecedent variable indicators in this study, including nine first-level indicators, twenty second-level indicators, and forty-six third-level indicators, and the weight values of the tertiary indicators are determined by the entropy weight method. Missing data for some indicators are supplemented using the interpolation method. Specifically, policy elements include three types of policy intensity, demand-type (DP), supply-type (SP), and environment-type (EP) policies [88], to explore the dynamic differences in the impact of different policy types on sustainable performance. The quantification of these three types of policy intensity is completed using word embeddings (for specific calculations, see Section 4.3.2). Industrial subjects (IS) reflect the industry’s overall development status and sustainability foundation, including industrial infrastructure, industrial economy, industrial cooperation, and industrial environmental protection [89]. Capital elements (CE) reflect the flow and growth of capital within the industry, encompassing three key dimensions: capital financing, capital turnover, and capital appreciation [90]. Talent elements (TE) reflect the breadth and depth of sustainable development absorption capacity, including two aspects: talent scale and talent education [90]. Innovation elements (IE) can promote industrial technological progress and sustainable development, which are measured from three aspects: input, output, and transformation of innovation [90]. Digital elements (DE) are essential driving forces for promoting industrial transformation and upgrading, including digital industrialization and industrial digitalization [91]. Digital industrialization includes the scale of digital industries, digital infrastructure, and employment in digital industries [92]. Industrial digitalization includes construction, transactions, and services [93,94].
Table 2.
Explanation of dependent and antecedent variables.
4.4. Policy Text Mining Methods
4.4.1. LDA Model for Theme Word Identification
This study uses the LDA model to explore themes in industrial policy texts and identify theme words. The LDA model, an unsupervised machine learning technique, is highly effective in processing large-scale heterogeneous text data. This characteristic renders it particularly well-adapted for dealing with diverse text sources like policy documents and reports. Additionally, the LDA model does not necessitate predefined themes or categories, enabling it to uncover themes within the data automatically. It can minimize potential semantic relationships and thematic information in the text, thereby enhancing the objectivity and comprehensiveness of the analysis results [103,104]. Due to the need for large-scale text analysis in researching policies for the NEV industry and the wide coverage and diverse sources of policy texts, complex semantic structures and potential thematic associations exist. Traditional text analysis methods have difficulty comprehensively and deeply exploring the key information and potential patterns within it. Therefore, the LDA model provides a powerful and effective tool for analyzing policies in the NEV industry in this study.
In this study, the number of themes to be extracted by the LDA model needs to be preset. To determine the optimal number of themes, the theme coherence score is employed [105]. First, the policy documents are preprocessed by removing stop words and categorizing them into demand-type, supply-type, and environment-type groups. Then, the LDA model is applied to mine themes from the preprocessed policy corpus. The calculations of the theme coherence score are shown in Equations (1) and (2), where is a set of words under a theme, is the smoothing coefficient, calculates the number of documents that contain both words and , and calculates the number of documents that contain the word . When the theme coherence score reaches its peak, select the model of corresponding number of themes for theme extraction. Finally, each group of topics obtained contains the keywords of that group of topics and the probability distribution corresponding to each keyword. The higher the probability of a keyword appearing, the higher the contribution of the keyword to the topic. By analyzing the probability of occurrence of relevant keywords for each topic and combining expert knowledge and relevant policy documents such as the New Energy Vehicle Industry Development Plan, core keywords related to demand-type, supply-type, and environment-type policies are identified (see Appendix B).
4.4.2. Word Embeddings for Policy Intensity Calculation
The word embedding method is employed to calculate the intensity of industrial policy. In the field of policy research in the NEV industry, policy texts often have rich semantic connotations. Traditional word frequency statistics focus solely on the frequency of vocabulary occurrence, which can easily overlook semantic associations and contextual information between words, leading to a deviation in understanding the policy focus and core content. And word embeddings can not only capture the semantic relationships between words but also better understand the complex semantic structures in policy texts [106,107], thereby enhancing the accuracy of policy text identification. Therefore, this study adopts the Word2vec model in word embeddings to implement the vector representation of policy text keywords. First, based on the theme words extracted from LDA theme modeling and expert knowledge, general words that have obvious errors in machine recognition and have no obvious effect on policy analysis, such as “new energy” and “vehicles,” are removed to establish policy dictionaries for demand-type, supply-type, and environment-type policies. Second, a word embedding model is trained using policy texts to represent the vectors of words. This study uses the CBOW algorithm to train the word embedding model, and then the similarity of each policy with various policy types is calculated. The window size of this model is set to 10, the learning rate is set to 0.025, the number of iterations is set to 5, with a word frequency threshold of 1 for training, and 100 iterations are conducted. Other parameters are set to default values. Then, cosine similarity is used as the method for calculating the distance between word vectors; the closer the absolute value of the result is to 1, the stronger the relevance between words A and B, as shown in Equation (3).
Finally, the vector relevance of each policy document is calculated, and the similarity of the policy to each policy type is used as its policy intensity value. Then, the policy intensities of policy documents issued by the same province in the same year are summed up. Let the number of policy documents issued by a certain province in a certain year be , the demand-type policy intensity of each policy document be , the supply-type policy intensity be , and the environment-type policy intensity be . The calculation of policy intensity for that year is represented by Equations (4)–(6):
where is the total demand-type policy intensity for the year, is the total supply-type policy intensity, and is the total environment-type policy intensity.
4.5. Dynamic QCA and NCA Methods
Dynamic QCA and NCA can be used to analyze complex causal relationships in panel data. They can identify the necessary and sufficient conditions for achieving the sustainable development of the new energy vehicle industry, capture the configuration nature of causal relationships, and identify multiple paths that lead to the same outcome. These methods can effectively answer how different policy mixes and policy environment elements jointly affect the sustainable development of the new energy vehicle industry from a temporal and spatial perspective and explore the joint mechanism of policy mixes and policy environment elements on the sustainable development of the new energy vehicle industry.
This study employs dynamic QCA and NCA to examine the temporal–spatial mechanisms of multiple elements on industrial sustainable development performance. In exploring the intricate action mechanism of diverse elements within the industry ecosystem, traditional approaches that rely on the mere aggregation of single-variable effects, like regression analysis, often fail to capture the interactions and overall impacts of multiple concurrent factors. As a research approach rooted in configurational theory, the QCA method provides a more comprehensive explanation for the joint effect of elements across different dimensions. However, traditional QCA methods primarily analyze cross-sectional data, making it challenging to investigate configuration effects across temporal dimensions. In contrast, dynamic QCA calculates the consistency and adjusts the distance between groups and within groups, handling panel data completely from three aspects, pooled results, between-group results, and within-group results, and reflects the changes of configurations across the temporal and case dimensions [108]. Given the significant changes in the industry characteristics of NEVs, substantial temporal–spatial transformations have occurred since their inception, making a single-time-point study inadequate for fully elucidating the causal relationships between antecedent variables and the industry’s sustainable development. Thus, this study employs dynamic QCA to provide a more objective understanding of the dynamic evolution of sustainable development in the NEV industry across different regions, addressing the limitations of previous studies that struggled to explore the vertical configuration effect over time.
The NCA method can complement QCA by identifying necessary conditions and further exploring the significance of antecedent variables. It precisely indicates the extent to which a single antecedent variable serves as a necessary condition for the outcome variable [109]. This supplement enhances the findings of dynamic QCA, adding greater value to the research results [110].
5. Results
5.1. Policy Dynamic Evolution Analysis
5.1.1. Results of Policy Theme Dynamic Evolution
The themes of NEV industry policies are identified in various regions at different stages by using the LDA model. Figure 3 illustrates the distribution and evolutionary trends of policy themes across different regions and development stages. Moreover, drawing on the policy theme keywords from various development stages in each region (see Appendix B), this study analyzes the content disparities among multiple policy measures and their evolving connotations.
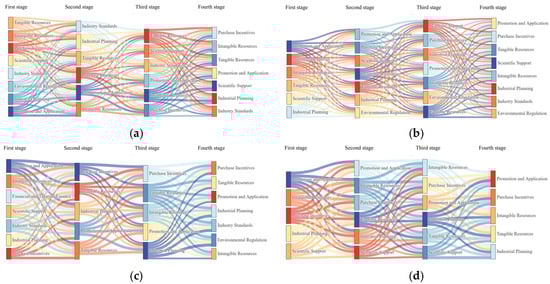
Figure 3.
Evolution of policy themes by region: (a) the evolution of policy themes in the Eastern region; (b) the evolution of policy themes in the Central region; (c) the evolution of policy themes in the Western region; (d) the evolution of policy themes in the Northeast region. Each node represents a theme in a specific stage (e.g., the ‘Promotion and Application’ theme). The links between nodes indicate the evolutionary relationships between themes in adjacent stages. The thickness of the links reflects the similarity between themes (measured by cosine similarity, where a higher value indicates greater similarity in content).
There exist disparities in the policy connotations and changes across different regions of China. The Eastern region features the greatest variety of policy themes, encompassing promotion and application, purchase incentives, intangible resource support, tangible resource support, scientific research support, industry standards, environmental regulation, and industrial planning. The policy content in this region is the richest, incorporating various market-oriented measures and updating them in a timely manner, with keywords such as “key technology,” “special funds,” “intelligent network,” and “after-sales service” appearing. The supply–demand policy themes in the Central region are similar to those in the Eastern region, but environment-type policies are relatively few and lagging behind. Compared to the Eastern and Central regions, the Western region has fewer policy themes. Although it is relatively comprehensive in the first stage, in the later stages of development, there is a reduction in policy themes such as scientific research support, finance, and taxation. As a result, the number of themes decreased, indicating potential fiscal constraints on the government and a lack of continuity in policy implementation, which hindered the accumulation and transformation of scientific and technological achievements. Compared to other regions in the country, the Northeast region has the fewest policy themes. In the cross-stage theme mining, policy measures related to research support, tangible resource support, and industry standards exhibit instability and inconsistency. In addition, there is a lack of environmental regulation. On the one hand, it may be due to the high performance requirements of NEV batteries under extreme climate conditions in Northeast China, and the immature technology restricts policy implementation. On the other hand, the prevalence of traditional industries in the Northeast region has intensified the pressure for their transformation and upgrading. Therefore, each region needs to enrich the connotation of policy measures further and keep them updated according to its own characteristics and development needs.
5.1.2. Results of Policy Intensity Dynamic Evolution
This research integrates the aforementioned policy theme keywords (in Appendix B) and supplements them with expert knowledge to establish a policy intensity mining dictionary. Policy intensity is then calculated through word embeddings. The policy intensity and its fluctuation range for each region and stage are illustrated in Figure 4.
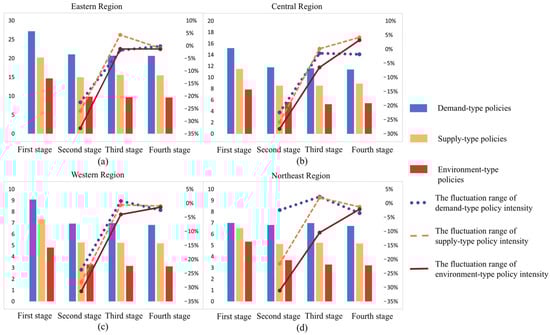
Figure 4.
Policy intensity and fluctuation range by region and phase: (a) policy intensity and fluctuation range in the Eastern region; (b) policy intensity and fluctuation range in the Central region; (c) policy intensity and fluctuation range in the Western region; (d) policy intensity and fluctuation range in the Northeast region.
As shown in Figure 4, there are pronounced regional differences in policy intensity among different areas. The Eastern region consistently demonstrates relatively high intensities in demand-type, supply-type, and environment-type policy. This can be attributed to its more mature market environment and stronger economic strength, indicating that the Eastern region utilizes policy tools to promote industrial development of the NEV industry. In contrast, the Central region maintains relatively stable and moderate levels of policy intensity, reflecting a steady-paced approach to policy implementation in industrial development. Meanwhile, the Western and Northeastern regions display lower policy intensities. This may relate to their economic development levels and industrial structures. The variations in policy intensity across different development stages indicate that both the Western and Northeastern have considerable room for improvement in their NEV industry development and should strengthen their policy support.
Overall, each region shows the highest intensity of demand-type policies, followed by supply-type policies, and the weakest intensity of environment-type policies. It can be seen that the development of China’s NEV industry is primarily driven by market size, with relatively weak but gradually strengthening policy measures, including technological innovation, industry standards, and green ecology. In addition, the overall policy intensity has shown a downward trend, reflecting the gradual weakening of government intervention in the development of the NEV industry, and further promoting industrial development through market-oriented means. However, in the process of high-quality industrial development, it is necessary to further improve and strengthen the formulation and implementation of supply-type and environment-type policies, providing support and guarantees for technological innovation and standard norms.
5.2. Configuration Path Analysis of Different Regions
5.2.1. Necessity Analysis of Single Antecedent Variables by Region
This study analyzes the necessity of antecedent variables by region. Firstly, the data of the antecedent and dependent variables must be calibrated to affiliation values between 0 and 1 before conducting the dynamic QCA analysis [111]. Based on the numerical characteristics of the variables, direct calibration is used to calibrate each variable, using the ninety-fifth, fiftieth, and fifth percentiles as the calibration anchors for full membership, crossover points, and zero membership. When the membership degree value of the calibrated fuzzy set is 0.5, it is adjusted to 0.5001. Then, the necessity of each antecedent variable is analyzed. When using dynamic QCA for necessity analysis, the necessity of a single antecedent variable is determined by the BECONS adjusted distance and the pooled consistency. Taking the Eastern region as an example (the necessity analysis results for other regions are in Appendix C), the adjusted distance for TE is less than 0.2, and the pooled consistency is less than 0.9, indicating that this variable is not a necessary condition for high NSP. In addition, the BECONS adjusted distances for DP, SP, EP, CE, IE, DE, and IS are all greater than 0.2, requiring further judgment of their necessity in combination with the consistency and coverage of specific years, as shown in Appendix D. Only when the consistency of the antecedent variable is greater than 0.9 and the coverage is greater than 0.5 can it be judged as a necessary condition [112]. It is found that the seven antecedent variables of DP, SP, EP, CE, IE, DE, and IS do not meet the judgment requirements for necessary conditions in all regions, indicating that the improvement of NSP must be achieved through the joint effect of multiple policy mixes and policy environment elements.
5.2.2. Sufficiency Analysis of Configuration Paths by Region
Furthermore, this study uses the R language to run QCA and NCA to analyze the dynamic configuration path of panel data. Referring to existing research [48], the consistency threshold is set at 0.9, the frequency threshold at 2, and the PRI threshold at 0.75. The analysis primarily focuses on enhanced intermediate solutions and secondarily on enhanced simple solutions to examine the dynamic configuration paths for achieving high levels of sustainable development performance in the NEV industry across various regions. The results are shown in Table 3.
Table 3.
Configuration paths for sustainable development of the NEV industry.
A total of 16 configuration paths lead to high sustainable development performance in the NEV industry, all with an aggregated consistency greater than 0.75, indicating the sufficiency of the configuration paths for the outcome variable. The aggregate coverage is lowest in the Northeast region at 58.4% and highest in the Central region at 69.3%, suggesting that the configuration paths in each region can explain the majority of the high-level sustainable development performance cases. The configuration paths of typical cases in different regions are shown in Figure 5.
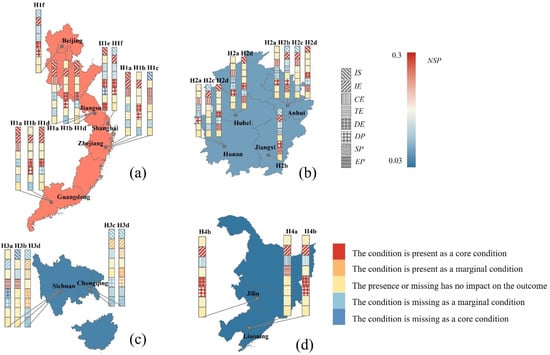
Figure 5.
Paths of typical cases in various regions: (a) shows the Eastern region; (b) shows the Central region; (c) shows the Western region; (d) shows the Northeastern region.
As shown in Figure 5, the NSP varies significantly among different regions. The average NSP in the eastern region is the highest, reaching 0.299, which indicates that the Eastern region has significant advantages in the development of the NEV industry. In contrast, the average NSP in the Central, Western, and Northeastern regions is relatively lower, standing at 0.081, 0.053, and 0.039, respectively. It shows that these regions still face many challenges in the development of NEV industry. Therefore, provinces in each region need to strategically adjust industrial policies and policy environment in accordance with the development maturity and location characteristics of their own NEV industry, so as to form a practical and effective sustainable development path of NEV industry.
Additionally, the configuration paths to achieve high-level NSP in different regions are diverse. The Eastern region has the richest configuration paths with a total of six (H1a–H1f), indicating that the Eastern region’s better policy measures and industrial ecological basis have provided diverse development paths for the NEV industry, in order to better cope with the uncertainty and changes in sustainable development of the industry. The Central and Western regions each possess four configuration paths (H2a–H2d, H3a–H3d, respectively). Compared to the Eastern region, they receive less policy support, which limits their strategic choices in the process of industrial development. The Northeast region has the fewest configuration paths (H4a and H4b), indicating that the Northeast region’s industrial development pattern is relatively singular and requires more diverse resources and policy supports.
Furthermore, the core policy and policy environment elements embodied in the configuration paths of each region are heterogeneous. Specifically, in the configuration path of the Eastern region, demand-type policy and environment-type policy are the key core policy elements, and industrial subject, digital element, and innovation element are the key core policy environment elements. The Central region takes DP and supply-type policy as the key core policy elements and capital element and IE as the key core policy environment elements. In contrast, the key core elements of the Western and Northeastern regions are relatively single. The Western region takes DP and TE as the key core elements. The Northeastern region takes DP and IE as the key core elements. On the one hand, there are similarities among the key core elements of each region. DP plays an essential role in each region, which indicates that the market demand pull for NEVs is one of the key elements in promoting the improvement of NSP. At the same time, IE as a key core policy environment element is outstanding in the Eastern, Central, and Northeastern regions, indicating that innovation is a key driving force for enhancing NSP [113]. On the other hand, there are certain differences in the key core elements of each region. The Eastern region takes DP and EP as the core policy elements and emphasizes the synergy of IS, IE, and DE. The Central region focuses on the combination of demand-type policy and SP in policy elements and, at the same time, emphasizes the two policy environment elements of CE and IE, highlighting the coordinated application of supply and demand policies in industrial development in the Central region, as well as the attention to capital support and innovation drive. The key core elements of the Western region are relatively singular. The Western region takes DP and TE as the core, indicating that because the NEV industry in the Western region is relatively backward, it is more necessary to provide intellectual and technical support through TE. The Northeastern region takes DP and IE as the key core elements and does not show obvious regional characteristics, indicating that the Northeastern region still needs to integrate more policies and policy environment elements to promote the development of the NEV industry further.
The research further conducts an in-depth analysis of configuration paths by combining typical cases in each region. In the configuration path of the Eastern region, the typical cases of H1a include Guangdong (2010–2011), Jiangsu (2010–2013), and Zhejiang (2013), indicating that in the early development stage, weak SP assists CE, IE, and IS core conditions, providing resource support for technological innovation and industrial transformation. The typical cases of H1b, H1c, and H1d are Guangdong (2012–2023), Jiangsu (2014–2023), and Zhejiang (2015–2023), where DP serves as a core or marginal condition, supplemented by weak SP or weak EP, working together with core conditions such as CE, TE, IE, DE, and IS, reflecting the characteristics of dynamic policy complementarity in combination with all elements during the middle and later stages of development. Taking Guangdong Province as an example, since 2010, it has promoted the development of the NEV industry through a series of policies. In the initial stage, supply-type policies, such as capital support and public technical service platform construction, support technological innovation and industrial cultivation. Later, demand-type policies such as purchase subsidies, government procurement, and road rights policies become more diverse to promote NEV popularization and application. Environment-type policies, such as battery recycling management and enterprise interest subsidy services, are also implemented. In terms of capital elements, the government raises funds through multiple channels to support the industry and guide financial institutions to serve industrial financing [9]. In terms of innovation elements, a technical engineering laboratory is established, and enterprises are encouraged to cooperate with universities in researching and developing core technologies. In terms of industrial subjects, leading enterprises in Guangzhou are supported in expanding production scale, attracting investment, and building a complete industrial chain. Additionally, digital projects such as intelligent NEV production are also key to promoting the sustainable development of the industry.
The typical cases of H1e and H1d are Shanghai (2018, 2021–2023) and Beijing (2020), achieving sustainable development with DP and EP as core conditions, combined with core conditions such as IE, DE, and IS. Taking Shanghai as an example, as an early NEV pilot city, it has implemented demand-type policies to promote NEV purchase and use. Environment-type policies support enterprises with tax incentives and financial services. In industrial subject elements, it optimizes the layout, introduces Tesla, and supports NEV supporting industries. In terms of innovation elements, it establishes a special fund for NEV development and key technology breakthroughs. In digital elements, it establishes a data platform and plans to build an intelligent connected vehicle area by 2025. Beijing emerges as a typical case of configuration path H1f, with demand-type policies serving as the core condition and combining with the innovation element to jointly promote the sustainable development of the NEV industry. In terms of demand-type policies, Beijing actively promotes the application of NEVs in the taxi, sanitation, and bus sectors, driving demand through policies for the promotion and application of NEVs. Regarding innovation elements, a NEV technology research and development cluster is developed in the economic–technological development areas, with the layout of research and development, design, and testing of electric vehicles aiming to create a globally influential intelligent vehicle innovation center and to accelerate innovation for NEV enterprises in the fields of intelligent hardware and Internet services. Demand-type policies create market opportunities, providing economic incentives for innovation. Innovation elements, on the other hand, enhance the effectiveness of policies by improving the technological capabilities and competitiveness of enterprises. This synergy between policy and innovation enables the NEV industry to achieve rapid technological breakthroughs and sustainable development under policy support [14].
In the configuration path of the Central region, the typical cases of H2a include Anhui (2011–2015), Hubei (2012), and Hunan (2012–2013, 2016), indicating that in the early development stage, intense DP plays a core guiding role, combines with strong CE and weak TE as core conditions, providing resource support for industrial development. The typical cases of H2b, H2c, and H2d are Anhui (2017–2018, 2020, 2022–2023), Hunan (2018, 2021–2023), and Hubei (2020), indicating that in the middle and later development stages, DP and SP serve as core or supportive conditions, working together with core conditions such as CE, IE, DE, IS, and weak TE, resulting in a richer set of elements that contribute to the development. Taking Anhui Province as an example, from 2011 to 2015, Anhui takes demand-type policies as core conditions. It encourages private purchases through subsidies and ensures promotion in multiple cities. From 2017 to 2018, Anhui increases the use of NEVs in public services, while establishing R&D teams and platforms to support the industrial development of NEVs. In 2020, Anhui weakens demand policies, encourages purchases through “trade-in,” strengthens supply policies for R&D, and constructs NEV bases. From 2022 to 2023, Anhui takes weak supply policies as auxiliary, with capital and innovation as the core, utilizes social capital to increase investment, constructs innovation centers and institutes, and implements innovation projects with subsidy support.
In the configuration path of the Western region, the typical case of H3a is Sichuan (2010–2012), indicating that weak DP supported the core condition of TE to promote the initial development of the industry. The typical case of H3b is Sichuan (2014–2021), where policy elements do not play a significant role, with weak IS and TE serving as core conditions, supplemented by weak CE. The typical case of H3c is Chongqing (2021), where this path is characterized by the joint influence of weak DP, weak SP, and weak EP along with IE, weak CE, and weak IS, forming a feature of multi-element auxiliary influence. The typical cases of H3d include Sichuan (2022) and Chongqing (2021–2023), where DP, weak SP, and weak EP, along with CE, IE, DE, and weak IS, show a characteristic of more elements jointly assisting, lacking core elements. Taking Sichuan Province as an example, from 2010 to 2012, Sichuan’s NEV industry development relies on weak demand-type policies for auxiliary promotion and the support of talent resources. Through demonstrations in buses, taxis, and special vehicles, NEVs enter the market. From 2014 to 2021, the importance of policy elements has decreased, and talent remains the core element for developing the NEV industry. In 2022, the configuration path adjusts to H3d. Demand-type policies strengthens and combines with weak supply and environment policies to assist. These policies expand the application range for NEVs, support the development of charging facilities, and promote green transportation.
In the configuration path of the Northeast region, the typical case of H4a is Liaoning (2015–2021), where none of the three policy elements play a significant role, and the industry is driven by TE, IE, and weak CE as core conditions. The typical case of H4b is Liaoning (2015, 2017–2021) and Jilin (2022–2023), reflecting the Northeast region’s core guidance with DP, combined with the core drive of IE and DE, supported by weak CE, to jointly promote the sustainable development of the industry. It can be seen that the NSP of the Northeast region is relatively lagging compared to other regions, and it has the fewest configuration paths for development. Among the policy elements, only DP plays a core role in H4b, indicating an imbalance in policies and insufficient impact. Taking Liaoning Province as an example, Liaoning promotes NEV application and popularization through demand-type policies. It increases NEV proportion in buses and logistics. At the same time, by establishing innovation project industry technology alliances, industry investment funds, and school enterprise cooperation, the Northeastern region can leverage the coupling effect of innovation, digitization, talent, and capital with policies.
5.3. Temporal–Spatial Analysis of Configuration Paths
5.3.1. Dynamic Evolution Analysis of Configuration Paths by Region
To explore the dynamic evolution differences of the sustainable development configuration paths in the NEV industry across regions, this study uses typical cases from each region for analysis of paths and core element trajectories. The dynamic trajectories of configuration paths (elements) are divided into four types: “sustained,” indicating a configuration (element) that continuously plays a role across more than three stages with a stable positive impact on the outcome; “shifting,” referring to a configuration (element) that plays a role in certain stages before disappearing, affecting the outcome only in specific phases; “oscillating,” meaning a configuration path (element) that reappears across multiple stages, reflecting the cyclical patterns or the cyclical importance of specific elements in development; “emerging,” pointing to a configuration path (element) that does not appear in the initial stages but emerges in the latest stage, emphasizing the significant role of the configuration or element in later stages. By comparing and analyzing the evolution of configuration paths and core element trajectories in typical cases from each region, this study aims to gain a deeper understanding of the dynamic characteristics of policies and their environmental elements that drive the sustainable development of NEVs. As shown in Table 4, Table 5, Table 6 and Table 7, the configuration paths of each region exhibit diverse evolution trajectories.
Table 4.
Evolution of configuration paths in the Eastern region.
Table 5.
Evolution of configuration paths in the Central region.
Table 6.
Evolution of configuration paths in the Western region.
Table 7.
Evolution of configuration paths in the Northeast region.
The configuration paths of each region exhibit diverse evolution trajectories. The configuration path of the Eastern region includes three evolution trajectories: “shifting,” “oscillating,” and “emerging,” presenting the most complex evolution mode. The configuration paths in the Central region encompass two evolutionary trajectories, “shifting” and “oscillating,” while those of the Northeastern region are “sustained” and “emerging,” indicating the differences in the evolution modes of the configuration paths of these two regions. The former reflects the phased transformation of policy orientation and industrial focus, as well as the dynamic adjustment between policies and policy environments in the industrial development process. The latter indicates that policy tools and policy environments play a relatively stable role in the industrial development process, with the gradual prominence of new configuration paths in the later stages of industrial development. The configuration path of the Western region has only one trajectory, “shifting,” reflecting that the role of industrial policies and policy environments in the Western region is relatively limited. Therefore, it is crucial to accurately understand the stage of industrial development and to flexibly adjust the policies and configurations of industrial elements.
The evolution trajectories of key core elements in each region present different characteristics. The evolution trajectories of key core elements in the Eastern region cover all types of “sustained,” “emerging,” “shifting,” and “oscillating” and are the richest. Among them, the evolution trajectories of DP, EP, IE, and DE are mainly “sustained,” and the evolution trajectory of IS is more reflected as “shifting,” which indicates that policies have continuity in supporting industrial development, innovation, and digitalization always maintain a stable driving force in the industrial development, and industrial entities show different dynamic change characteristics according to different development stages. Moreover, the evolution trajectory of key core elements in the Central region includes two types: “shifting” and “emerging.” Among policy elements, DP is mainly “shifting,” while SP is mainly “emerging,” which indicates the transformation process of industrial development from focusing on market demand stimulation to emphasizing the improvement of the industry’s own supply capacity. Among the policy environment elements, CE is mainly “shifting,” and IE is mainly “emerging.” This indicates that the role of capital is gradually weakening, while IE increasingly highlights its importance in the later stages of industrial development. Additionally, the evolution trajectory of key core elements in the Western region is characterized as “emerging” and “sustained.” DP only begins to show its effects in the later stage, and TE runs through the entire industrial development. This indicates the lag of policy support and also highlights the importance of talent. The evolution trajectories of the two key core elements of DP and IE in the Northeastern region are both “sustained” and “emerging,” indicating that DP and IE not only maintain a stable role to a certain extent but also gradually reveal new influence paths as industrial development stages evolve.
(1) Evolution of configuration paths in the Eastern region
Table 4 presents the organization of configuration path evolution and core elements for typical cases in the Eastern region. From 2010 to 2023, it has seen the emergence of typical cases every year, allowing it to maintain its competitive advantage. The six configuration paths enable NEVs to respond flexibly to environmental changes, with various elements and policies working together to enhance the effectiveness of policy implementation. Taking Guangdong, Jiangsu, and Zhejiang as examples, they have adopted three paths that exhibit “shifting” and “oscillating.” All antecedent variables are reflected in the configurations, and their evolution types also show a variety of characteristics. Among policy elements, DP has continued to play a core role in multiple stages, with specific measures shifting from government-led to market-oriented, effectively stimulating market vitality; SP and EP complement each other in a rotating manner to play a supportive role. Among the policy environment elements, only IE has always been a core condition at all stages, demonstrating the positive impact of innovation on NSP. DE, IS, CE, and TE exhibit different evolutionary trajectories in different regions, indicating that these factors have certain fluctuations and lags in certain areas.
(2) Evolution of configuration paths in the Central region
Table 5 presents the organization of configuration path evolution and core elements for typical cases in the Central region. Compared to the Eastern region, the Central region has relatively fewer configuration paths, and EP has not appeared as a core or supportive condition, indicating an imbalance in the core role of policy elements. Additionally, other elements appear as core conditions in only two configuration paths, demonstrating weaker stability of effect compared to the Eastern region. Taking Anhui as an example, it has the richest configuration paths in the Central region, exhibiting “shifting” and “oscillating” evolutionary trajectories in the order of H2a, H2c, H2b, and H2d, and finally returning to H2c. Among the policy elements, the core condition DP continues to appear in the first three stages, with SP emerging in the third stage and working in conjunction with DP as a core condition. In the fourth stage, the core policy condition shifts from DP to SP, with the two types of policies effectively connecting and cooperating to promote industrial development. Among the policy environment elements, CE continues to play a core role, providing a solid economic foundation for industrial development, while IE, IS, and DE sustain to develop and successively emerge as core conditions in the third or fourth stage.
(3) Evolution of configuration paths in the Western region
Table 6 presents the organization of configuration path evolution and core element trajectories for typical cases in the Western region. Compared to the Eastern and Central regions, there is a noticeable reduction in core elements in the configuration paths, with policy elements serving as supportive conditions. Only DP continues to support throughout the four phases, while SP and EP emerge later. Among the other elements that work in conjunction with policies, only TE continues to play a core role; although IS shows a core role, its level is weak. Other elements exhibit fluctuating auxiliary roles of “emergence” or “shift.” Taking Sichuan as an example, it demonstrates an evolutionary trajectory of “shifting + sustained + emerging” in the order of H3a, H3b, and H3d. From phase 1 to phase 2, there is a shift from H3a to H3b, which continues through to Phase 4, with H3d emerging in 2022. Among the policy elements, DP continues as a supportive condition, while SP and EP only emerge to assist in the fourth phase, having a relatively limited impact on the industry. Among other elements, TE continues to play a core role across the four phases, reflecting Sichuan’s emphasis on talent introduction and cultivation. Both DE and IS undergo “shifting,” lacking continuity.
(4) Evolution of configuration paths in the Northeast region
Table 7 shows the organization of the evolution of configuration paths and core element trajectories for typical cases in the Northeast region. Compared to other regions, the evolution of configuration paths in the Northeast region is the simplest, with only H4a and H4b, which are either “sustained” or “emerging.” Among the policy elements, only DP either “sustained” or “emerging” as a core condition, without combining with SP and EP to exert the joint effect of policy mixes. Among other elements, CE sustains but is weak, and IS never emerges as a core or supportive condition. Taking Liaoning as an example, from the second phase, it shows a “sustained” evolutionary trajectory with H4a and H4b, demonstrating the stable role of some core elements in achieving NSP. Among them, only DP sustains as a core condition, reflecting the continuity of market incentive measures and the industry’s dependence on fiscal purchase subsidies, which needs further optimization of SP and EP policy effects. In terms of other elements, weak CE is a core condition in H4a but shifts to a supportive condition in H4b, indicating that the fiscal support of DP has compensated to some extent for the impact of the lack of funds. IE sustains as a core condition in these two paths, indicating that Liaoning has formed different element combinations in conjunction with innovative development, on the one hand, combined with TE to provide intellectual resource support. On the other hand, combined with DE, it continuously promotes innovative development through industrial informatization and intelligent construction.
5.3.2. Evolution Analysis of the Necessity of Configuration Elements by Region
To further identify key configuration elements that can break through the bottleneck of sustainable development in the NEV industry, this study quantitatively analyzed the necessity of antecedent variables in each region at different stages using the NCA method. A variable is considered a necessary condition for the result if it meets the following criteria: an effect size of no less than 0.1, a p-value less than 0.01, and an upper limit of precision greater than 95% [109,114]. Figure 6 presents the further calculation of the bottleneck level (%) for each antecedent variable across different regions and stages, along with an analysis of the dynamic evolution of key elements.
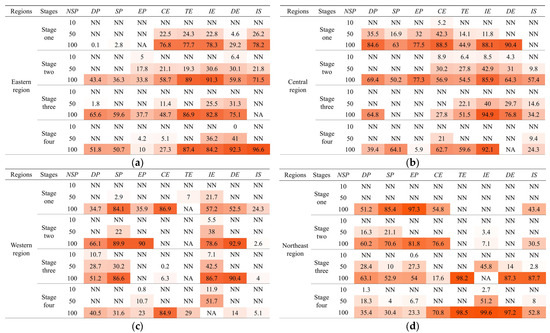
Figure 6.
Analysis of the bottleneck levels of antecedent variables by region (%): (a) the bottleneck level changes of antecedent variables in the Eastern region; (b) the bottleneck level changes of antecedent variables in the Central region; (c) the bottleneck level changes of antecedent variables in the Western region; (d) the bottleneck level changes of antecedent variables in the Northeast region. NN indicates that the variable does not produce a bottleneck level, and NA indicates that the variable is no longer a necessary determinant after reaching a certain degree. The colors in the figure indicate the bottleneck level of the antecedent variable, with darker shades corresponding to higher bottleneck levels.
The Eastern region has a lower bottleneck level of policy elements in the first stage, focusing on breaking through the limitations of other elements. The bottleneck level of IE and IS exceeds 78%, indicating that core technology breakthroughs and industrialization are key elements for overcoming the NSP bottleneck in the early stage. In the second stage, the necessity of policy mixes in industrial development increases significantly. The bottleneck levels of IE and TE reach about 90%, indicating that policy guidance for talent introduction and technological innovation is key to breaking through the NSP bottleneck. In the third stage, the bottleneck level of SP increases more than DP, gradually highlighting its necessity to overcome the NSP bottleneck. Although IE and TE, which have the highest bottleneck levels, slightly decrease compared to the previous stage, they remain key to overcoming the NSP bottleneck. In the fourth stage, the bottleneck levels of the three types of policy elements decrease, but it is necessary to focus on supporting enterprises from the supply side to adapt to market competition. Among other elements, TE, IE, DE, and IS are all key elements to breaking through the constraints of NSP, except for CE. Especially, the bottleneck values of IS and DE reach over 90%, indicating that improving industrial chain development and strengthening digitalization are crucial to overcoming the NSP bottleneck in the future. The Central region faces a high degree of constraint from policy elements in the first stage, with the bottleneck levels of DP, SP, and EP all reaching over 60%, indicating the need to strengthen policy guidance further. CE, DE, and IE also pose severe constraints, indicating the need to accelerate capital acquisition to support digital transformation and technological innovation. In the second stage, policy elements still have a high degree of constraint. IE remains a key element in breaking through the constraints of NSP, while DE and IS become increasingly important, necessitating improvements to the industrial chain through strengthened digital development. In the third stage, there is a significant improvement in the constraints of policy elements, with the optimization of DP being key to the market transition. IE and DE continue to be the elements with the highest bottlenecks, and TE becomes a new breakthrough point, indicating the need to cultivate core competitiveness in innovation, digitalization, and talent to break through the constraints of NSP. In the fourth stage, the bottleneck level of SP increases significantly, far exceeding DP, indicating the need to focus on strengthening supply-type policies. The constraints of IE, CE, and TE are significant, indicating a continued focus on innovation-driven development and a key breakthrough in capital and talent constraints.
In the Western region, during the first phase, as the NSP level increases, the constraining effect of SP is far higher than the other two types of policy elements, indicating the need to provide support in R&D and production from the enterprise supply side. In terms of other elements, CE has the highest bottleneck level, requiring an enhancement of the leverage effect of social capital to break through financial constraints. In the second phase, the bottleneck level of policy elements further increases, necessitating improvements to the three types of policies to support the healthy growth of the industry and enhance market competitiveness. In terms of other elements, the importance of IE and DE significantly rises, reflecting the urgent need for innovation and the application of digital technology. In the third phase, the bottleneck value of SP is significantly higher than that of DP, indicating a need to focus on strengthening supply-side support to overcome product R&D and production bottlenecks. In terms of other elements, IE and DE continue to show high bottleneck levels and are key elements in achieving NSP. In the fourth phase, the bottleneck effect of policies eases, and policy mixes become more coordinated. Among other elements, IE and CE exert significant constraining impact, indicating the importance of continuous innovation and financial security.
In the Northeast region, during the first phase, the bottleneck value of policy elements is higher than in other regions, indicating a more pronounced policy constraint, which necessitates the improvement of various policy measures. CE and IS show higher bottleneck levels, suggesting the need for financial support and rapid industrial foundation development at the initial stage. In the second phase, the bottleneck values for SP and EP decrease compared to the previous phase, but still require further refinement. The bottleneck value for DP increases compared to the last phase, indicating some lag. The bottleneck level for CE rises, which cannot fully meet the needs of industrial-scale development. The bottleneck level for IS decreases, indicating some improvement in industrial constraints, but further industrial transformation is still necessary. In the third phase, the bottleneck levels for SP and EP further decrease, but the constraint of DP becomes more pronounced, failing to adapt to the changes in the market transition. The bottleneck levels for TE, IE, and DE are high, necessitating breakthroughs in talent-supported innovation bottlenecks and further strengthening of the industrial chain to meet the needs of scaled production. In the fourth phase, the constraints of policy elements on NSP significantly decrease, and the industry gradually shifts from policy-driven to market-oriented development. The bottleneck levels for IE and TE remain the highest, necessitating continued emphasis on innovation breakthroughs and talent support.
6. Discussion
This study aims to improve the sustainable development performance of NEV industry through analyzing policy elements and their joint effects with the policy environment from the perspective of the industrial sustainable development ecosystem, as well as the regional heterogeneity and dynamic evolution of this effect.
6.1. Discussion of Configuration Path Results
This study proposes a sustainable development ecosystem for industries. It elucidates the influence mechanism of the joint effect of multi-dimensional industrial policies and policy environment elements on sustainable development performance. This research lays a valuable theoretical foundation for future studies in the field of industrial sustainable development. Distinct from prior studies centered on single elements [26], this research provides new insights into the mechanism of achieving sustainable development in the NEV industry from the perspective of multiple elements working together. The findings indicate that policy mixes should jointly act with policy environment elements to effectively promote sustainable development performance. This discovery expands upon the previous research’s emphasis on NEV policy mixes [115].
Overall, demand-type policies are recognized as the core element for enhancing NSP in various regions. By implementing policies such as purchase incentives and application promotion, these demand-type policies stimulate the demand for NEVs, which validates the significance of demand-type policies for the sustainable development of the NEV industry [18]. Contrary to the negative impact of previous demand driven policies on the NEV industry [22], some regions adopt the joint effect of demand-type policies and supply-type policies, or demand-type policies and environment-type policies as the core policy mixes, promoting industrial development through the joint effect of policy mixes. Moreover, the joint effect of policies and policy environments promotes the sustainable development of the NEV industry. Innovation is the most critical core element in the policy environment [113], yet it is not the sole one. Policy mixes are closely integrated with innovation elements. The government creates a favorable innovation environment and provides resource support for enterprise innovation through policies such as scientific research support and enterprise subsidies. This encourages NEV enterprises to increase their investment in innovation and enhance their innovation capabilities, thereby promoting the sustainable development of the NEV industry. These findings enrich previous research on the impact mechanism of sustainable development in the NEV industry [37]. They further indicate that policy mixes and environmental elements must work in concert to achieve sustainable development in the NEV industry [19]. This study addresses the limitations of existing research that focuses solely on individual policies or environmental elements [76], offering a comprehensive understanding of the complex interactions that influence sustainable development performance.
6.2. Discussion of Typical Cases of Configuration Paths in Various Regions
To conduct a comprehensive analysis of the regional differences in policy mixes and policy environment elements, dynamic QCA is employed to analyze the spatial heterogeneity of the configuration paths and key core elements for achieving high-level NSP, which expands the previous research on the policy of the NEV industry only at the national level [113,116]. The Eastern region, characterized by the highest sustainable development performance, drives demand for NEVs through policies such as purchase incentives and promotional initiatives and fosters standardized and environmentally friendly industry development by establishing industry norms and implementing environmental regulations. Additionally, the configuration path of the Eastern region further confirms the crucial role of regionally differentiated policies [117] and technological innovation [118] in industrial development. For example, through measures such as guiding school-enterprise cooperation, expanding industrial scale, and implementing intelligent production projects, the sustainable development of the NEV industry can be promoted through the synergy of policies and policy environment elements.
Conversely, the Northeastern region, with the lowest sustainable development performance, promotes demand for NEVs through application policies and increases their presence in municipal and public transportation sectors. However, it fails to fully leverage the joint effects of policy combinations and environmental elements. Despite implementing technological innovation projects in the NEV industry, it lags behind other regions, resulting in a substantial gap in industrial sustainable development. This study builds upon existing research on the spatial comparative analysis of policy mixes and policy environment elements in the sustainable development of the NEV industry [9]. It offers valuable insights for different regions to formulate tailored industry policies according to their unique characteristics. In future research, the study of regional policy mixes can be expanded to compare the heterogeneity among different countries. Furthermore, in-depth research on specific regional policies can be conducted through case studies and other methods to propose more valuable policy recommendations.
6.3. Discussion of the Evolution Trajectory of Configuration Paths in Various Regions
Furthermore, this study conducts a temporal evolution analysis of configuration paths and key core elements for achieving high-level NSP. Research has found that the configuration paths of various regions exhibit four different evolutionary trajectories at different stages of development: shifting, oscillating, emerging, and sustained. Based on previous research on the dynamic adjustment of industrial policies, this finding further emphasizes the necessity of targeted adjustments to industrial policies in different regions [115]. In the Eastern region, with its relatively mature market and abundant industrial resources and innovation capabilities, some configuration paths exhibit evolutionary trajectories, including “sustained,” “shifting,” and “oscillation,” with a predominant focus on the “sustained” trajectory. The industrial policy remains centered on DP and EP, effectively stimulating market demand for NEVs and fostering the development of green industries through targeted subsidies, enhanced promotional efforts, and stricter environmental regulatory standards. In contrast, the types and scope of policy mixes involved in other regions are relatively narrow, and policy implementation lacks flexible adjustments and long-term guidance [80]. For example, the Northeast region, characterized by a significant presence of traditional industries, faces economic transformation challenges, exhibiting only two modes of “sustained” and “emerging.” Demand-type policies remain in a relatively stable yet slowly changing state over time, and other types of policy are not “emerging” and have not demonstrated the joint effect of policy mixes with demand-type policies, restricting their sustainable development performance. In terms of the policy environment, only the innovation elements began to “emerge” in the later stage of the industry, and the linkage effect between capital investment, talent training, and innovation was not brought into play. These findings enhance the understanding of how industrial policies can effectively promote the sustainable development of the NEV industry in dynamic changes, and they may also apply to policy research in other industries in the future. It is worth noting that although continuous policy implementation plays a vital role in promoting industrial development, policy dynamic optimization also needs to pay attention to the frequency and cycle of policy adjustment [119], which is worth further exploration in the future. This study addresses the limitations of existing research on the dynamic effects of policy mixes and policy environment elements on the sustainable development performance of the NEV industry [18,102] and can provide a reference for future research. It offers crucial insights for different regions to devise customized industrial policies that are well-adapted to their distinct characteristics and cultivate a multi-dimensional policy environment.
7. Conclusions and Recommendations
7.1. Conclusions
This study examines the configuration path of the joint effects of NEV industry policies and policy environment elements and compares the dynamic changes in policy configuration paths and the necessity of configuration elements across different regions, considering both spatial and temporal dimensions (as shown in Table 3, Table 4, Table 5, Table 6 and Table 7). The key findings are summarized in the following three aspects.
Firstly, policy mixes and policy environment elements jointly promote the sustainable development of the NEV industry, which differs from previous studies that solely focused on single policy elements to promote industry development. Specifically, regarding policy mixes, demand-type policies serve as the core policy elements in different regions, and these regions form combinations of “demand-type + supply-type policies” or “demand-type + environment-type policies“ around demand-type policies. Moreover, innovation, as a type of policy environment, plays a crucial role in the process of sustainable development of the NEV industry. In terms of policy environments, innovation can play a more prominent role in the sustainable development of industries compared to policy environment elements such as industry, talent, capital, and digitization. These findings profoundly reveal that a single policy mix or policy environment cannot effectively promote the sustainable development of the industry. This research enhances the understanding of the combined effect of policy mixes and policy environments in the industrial sustainable development ecosystem, and also points the way for the targeted optimization of industrial policies and the improvement of the policy environment.
Secondly, there is regional heterogeneity in the impact of cross-regional policy mixes and configurations on the sustainable development of industries. Compared to previous studies on regional heterogeneity that only focused on a single element, this study further investigated the regional differences in the configuration paths of multiple elements and found that the Eastern region had the most diverse configuration paths, with good coordination between policy and environmental elements. There are shortcomings in policy mixes coordination in other regions, especially in the Northeast region. Based on their regional characteristics, each region combines differentiated policy mixes and policy environment elements to form distinct configuration paths that promote sustainable industrial development. In general, each region is mainly based on demand-type policies, combined with supply-type policies or environment-type policies to form policy mixes. Innovation is the most important element in the policy environment. Additionally, the diversity level of configuration paths across different regions is inconsistent, which is related to the development of regional NEV industries. Specifically, the number of configuration paths in the four regions is ranked as follows: the Eastern region has the most, the Central region is second, the Western region is third, and the Northeast region has the least. These findings comprehensively clarify the inherent differences in the configuration paths of different regions and point out the composition of key elements in these paths. This study also fully demonstrates the crucial role of the dynamic joint effect between policy mixes and policy environment elements in shaping the advantages of industrial sustainable development, which can provide a reference for the differential guidance of the sustainable development of the NEV industry.
Thirdly, each region dynamically enhances the sustainable development performance of the NEV industry through different types of configuration path evolutionary trajectories. There are dynamic differences in the configuration paths and necessary elements for achieving sustainable industrial development in different regions. Regions with high sustainable development performance (such as the Eastern region) have more diverse configuration path evolutionary trajectories, while regions with lower sustainable development performance (such as the Northeast region) have relatively single evolutionary trajectories of configuration paths. It is specifically manifested in four types of configuration path evolutionary trajectories. The Eastern region has flexible path adjustments, and the evolution trajectory includes all evolution modes of “shifting”, “oscillating”, “emerging”, and “sustained”. The Central region is shifting from a demand side to a supply side, which is consistent with existing research findings. In the early stage, the Western region lacks industrial policy guidance, and in the later stage, a policy mix of supply-type policies and environment-type policies is not formed, resulting in the ineffective effectiveness of the industrial policy combination. The Northeast region relies on demand-type policies and innovation elements, lacking coordination with other key elements, which hinders the sustainable development of the NEV industry. This finding highlights the necessity for each region to dynamically adjust the configuration paths and further strengthen the joint effect of policy mixes and policy environment elements to promote the sustainable development of the NEV industry more effectively.
7.2. Recommendations
Based on the major findings above, some recommendations are developed for the government and NEV-related enterprises.
7.2.1. Recommendations for Governments
Firstly, the government should comprehensively consider the joint effects of policy mixes and policy environment elements. In policy formulation, the government should pay attention to demand-type policies and supply-type policies, as well as the synergy between demand-type policies and environmental-type policies, strengthen the synergy between policies, and avoid the limitations of a single policy. At the same time, the government should emphasize the linkage mechanism between different policy tools and elements, such as industry subject, capital, talent, innovation, and digitization, and pay special attention to combining policy mixes with innovation elements.
Secondly, the government should implement precise policies based on the actual situation of its own industry and the characteristics of the market environment. The Eastern region should continue to leverage the diversified advantages of policy mixes, maintain sustained support for the NEV industry from demand-type and environment-type policies. At the same time, it should increase supply-type policy measures, such as scientific research support and funding support, and achieve sustainable development of the NEV industry through diversified policy mix configuration paths. The Central region should continue to play the key role of demand-type and supply-type policies, while improving environment-type policies, such as industry standards and regulatory norms, and forming a policy synergy to realize the sustainable development of the NEV industry. The Western region should increase the implementation of supply-type policies and change the backward situation of industrial development through strengthening infrastructure construction, providing industrial subsidies, optimizing resource allocation, and fully leverage the fundamental role of talents to increase industrial innovation and development. The Northeast region should strengthen the joint effect of supply-type policies and environment-type policies, carry out technological transformation and innovation through scientific research support and financial support, accelerate industrial transformation, and formulate strict environmental regulatory policies to ensure the green and sustainable development of industries.
Thirdly, the configuration path trajectories in different regions indicate that the government should design and dynamically adjust NEV policies based on the stages of industrial development and regional differences. Specifically, in the Eastern region, where industrial development is rapid and the market environment is mature, it is essential to maintain the sustainability of demand-type and environment-type policies while further strengthening the interaction between supply-type policies and the industrial environment. For the Central region, policies should facilitate a transition from a demand-side to a supply-side focus, increasing support for enhancing industrial supply capacity while emphasizing the crucial role of innovation in the later stages of development, guiding enterprises to bolster technological innovation (e.g., innovation funds, diversified financing systems, and regional technology innovation centers). For the Western region, the government should continue to introduce the implementation of supply-type policies and environment-type policies, actively layout resource supply support and industrial development planning. Continuously leveraging the fundamental role of talent elements to promote industrial chain development and foster industrial innovation clusters in the Western region (e.g., key projects of new energy vehicles). In response to the transformation needs of traditional industries, the Northeast region should formulate targeted supply-type and environment-type policies emphasizing investment in funds, talent, and other resources to stimulate internal innovation and accelerate the sustainable development of the NEV industry.
7.2.2. Recommendations for NEV-Related Enterprises
NEV enterprises should dynamically optimize their own development strategies to adapt to regional differences and dynamic changes in policies and industries. Enterprises should deeply understand policy trends, and adjust their own development strategies according to regional characteristics. In the Eastern regions with a strong industrial foundation and a mature market environment, NEV enterprises can further respond to demand-type and environment-type policies. They should focus on the development of high-end products, enhance the innovation capabilities of enterprises, and promote the transformation and upgrading of the entire industrial chain. Enterprises in the Central regions can respond to the development trend of supply-type policies, concentrate on developing cost-effective products, and optimize the production process to reduce costs. Enterprises in the Western regions can closely integrate with local realities and actively respond to supply-type policies, enhance industrial foundations, and fully leverage the key role of talent to promote industrial innovation and development. The Northeastern regions have the advantages of traditional industries. Local NEV enterprises can respond to the supply-type and environment-type policies of the government, focus on the transformation and upgrading of traditional industries, expand the production scale, and improve product quality.
7.3. Limitations and Future Improvement
This study can be improved and extended by addressing the limitations and future research issues as follows. This study still has limitations in terms of data sources, sample subjects, and policy quantification methods. Firstly, this study relies on publicly available data and does not cover non-public policies. Consequently, the setting of relevant policy variables may not fully capture the nuanced characteristics of different regions. Secondly, the sample of this study is limited to A-share listed companies and does not cover all small and medium-sized NEV enterprises and the upstream and downstream of the industrial chain. This may weaken the universality of the conclusion. Thirdly, the limitations in temporal span and spatial dimensions of the research sample may affect the analysis of long-term trends and the comprehensive exploration of regional differences. Fourthly, while the analysis results of methods such as LDA and word embeddings utilized in this study are robust, they are constrained by textual nuances and the quality of data. These limitations can obscure complex causal relationships. Fifthly, this study does not conduct an in-depth analysis of the life cycle environmental impact of new energy vehicles, which may limit the comprehensive assessment of the overall policy impact.
In response to the above limitations, future research can improve in the following aspects: Firstly, future research can integrate non-public policy data and supplement data from non-listed enterprises and small and medium-sized NEV manufacturers through in-depth interviews, in order to enrich the database and conduct more comprehensive analysis, thereby enhancing the ecological perspective. Secondly, the research on the configuration path of NEV industry can further expand to the international perspective. Comparative research on the sustainable development of NEV industries in different countries can be expanded to understand the policy mixes and industrial development situations of different countries and regions, and to gain reference and inspiration from a broader international perspective. Thirdly, future surveys can apply more advanced deep learning algorithms to improve the accuracy of policy text interpretation, thereby further enhancing the objectivity and accuracy of policy mixes quantification. Finally, future research is recommended to incorporate life cycle assessment methods to conduct an in-depth analysis of the life cycle environmental impact of new energy vehicles, thereby providing a more comprehensive evaluation of the integrated impact of policies on the sustainable development of the new energy vehicle industry. This would help policymakers better understand the role of different policy tools at various life cycle stages, leading to the development of more scientific and effective policies.
Author Contributions
Q.L., conceptualization, methodology, visualization, project administration, funding acquisition, and writing—review and editing. X.X., formal analysis, investigation, software, data curation, visualization, and writing—original draft. R.C., writing—review and editing and funding acquisition. L.L., writing—review and editing. All authors have read and agreed to the published version of the manuscript.
Funding
This research was funded by the National Social Science Foundation of China, grant number: “No. 19BSH105”. This research was also funded by the Fundamental Research Funds for the Central Universities, grant number: “WUT: 104972024JYS0017”.
Data Availability Statement
Data will be made available on request.
Conflicts of Interest
The authors declare no conflicts of interest.
Abbreviations
The following abbreviations are used in this manuscript:
| NEV | New energy vehicle |
| QCA | Qualitative Comparative Analysis |
| NCA | Necessary Condition Analysis |
| LDA | Latent Dirichlet allocation |
| R&D | Research and development |
| DP | Demand-type policy |
| SP | Supply-type policy |
| EP | Environment-type policy |
| IS | Industrial subject |
| CE | Capital element |
| TE | Talent element |
| IE | Innovation element |
| DE | Digital element |
| NSP | Sustainable development performance of the NEV industry |
Appendix A
Table A1.
Regional division.
Table A1.
Regional division.
| Region | Provinces (Municipalities and Autonomous Regions) |
|---|---|
| Eastern region | Beijing, Tianjin, Hebei, Shanghai, Jiangsu, Zhejiang, Fujian, Shandong, Guangdong |
| Central region | Anhui, Jiangxi, Henan, Hubei and Hunan |
| Western region | Guangxi, Sichuan, Chongqing |
| Northeast region | Liaoning, Jilin and Heilongjiang |
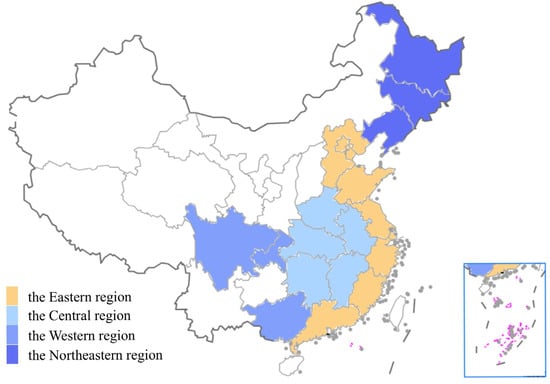
Figure A1.
Regional division.
Figure A1.
Regional division.
Table A2.
Phase division.
Table A2.
Phase division.
| Stages | Interpretation |
|---|---|
| Stage one (2010–2013): Pilot Demonstration Phase. | The government selects representative cities to serve as demonstration bases for the promotion of NEVs verifying the feasibility, performance, and market promotion potential of NEVs through on-site operation and testing. |
| Stage two (2014–2016): Large-scale Promotion Phase. | The government mainly encourages the purchase of NEVs in more cities across the country through measures such as purchase subsidies, government procurement, exemption from purchase tax, and restrictions on fuel vehicles, promoting the large-scale development of the NEV industry. |
| Stage three (2017–2019): Market Transition and Development Phase. | Purchase subsidies are gradually phased out, and market competition for NEV intensifies, focusing on improving product quality while promoting large-scale development. |
| Stage four (2020–2023): High-quality Development Phase. | Purchase subsidies are canceled, and the “dual credit” policy is further revised and improved, with NEV paying more attention to technological innovation and product quality enhancement. |
Appendix B
Table A3.
Policy theme keywords by region and phase.
Table A3.
Policy theme keywords by region and phase.
| Stages | Policy Tool Types | Policy Theme | Eastern Region Theme Keywords | Central Region Theme Keywords | Western Region Theme Keywords | Northeast Region Theme Keywords |
|---|---|---|---|---|---|---|
| Stage one | Demand-type | Promotion and Application | Buses, passenger cars, taxis, coaches, sanitation vehicles, public services, pilot cities, pilot work | Buses, passenger cars, taxis, coaches, official vehicles, pilot | Buses, passenger cars, taxis, coaches, pilot cities, ten cities, one thousand cars | Passenger cars, taxis, buses, pilot cities |
| Purchase Incentives | Subsidies, sales, vehicle purchase | Subsidies, financial subsidies, sales, vehicle purchase | Subsidies | Subsidies, financial subsidies, sales | ||
| Supply-type | Intangible Resources | Supporting funds, special funds, matching funds, subsidies, talents, services, platforms, information | Funding, special funds, subsidies, talent, services, platforms, information | Funding, talent, platform, information | Funding, special funds, subsidies, tertiary institutions | |
| Tangible Resources | Charging station, charger, power supply, meter, device | Charging infrastructure, parking lot, distribution, support, construction | / | / | ||
| Scientific Support | Key components, key technology, technological innovation, science and technology department, science and technology bureau, motor, power battery | Key components, science and technology bureau, motor, power battery, assembly, lithium-ion, control system | Key components, core technology, key technology, product development, technological innovation, R&D funding, science and technology department, control technology | Key core components, key components, research, core components, research, research unit, motor, power battery | ||
| Environment-type | Industrial Planning | Automobile industry, industry development, industrialization, emerging industry, agglomeration, industry chain, high-end, market, users | Automotive industry, industrial development, industrialization, industrial planning, production capacity, industrial park, development zone | Automobile industry, industry development, industrialization, production capacity, industry alliance, economic development zone, introduction | Automobile industry, industrialization, FAW Group, independent brand, development zone | |
| Financial and Taxation Finance | / | / | Discount, mortgage, pledge | / | ||
| Industry Standards | Testing, quality, monitoring, qualification, quota | / | Testing, quality supervision bureau | / | ||
| Environmental Regulation | Exhaust, pollution, environment, environmental protection | / | / | / | ||
| Stage two | Demand-type | Promotion and Application | Buses, passenger cars, taxis, coaches, specialty vehicles | Buses, passenger cars, taxis, coaches, specialty vehicles | Buses, passenger cars, taxis, coaches, public services | Buses, cabs, coaches |
| Purchase Incentives | Subsidies, financial subsidies, sales, disbursements | Subsidies, financial subsidies, sales, model catalogs | Subsidies, financial subsidies, sales, prices | Subsidies, financial subsidies, sales, allocations, prices | ||
| Supply-type | Intangible Resources | Funding, subsidy, service, information, platform | Funding, subsidies, incentives, services, information, platforms | Funding, subsidies, services, events | Subsidies, funding, services, management systems, platforms | |
| Tangible Resources | Charging infrastructure, parking, support, allocation, parking, charging stations | Charging infrastructure, parking lot, parking space, allocation, supporting, charging and switching station | Charging infrastructure, parking, parking spaces, support, allocation, charging stations | Charging infrastructure, distribution, infrastructure, charging station, power supply | ||
| Scientific Support | / | Key components, science and technology bureau, special funds, power battery | / | Motor, patent, key components, power battery, lithium battery | ||
| Environment-type | Industrial Planning | Automobile industry, consumer, market | Automobile industry, industrialization, market, users | Automobile industry, industry development, market, users, management committee | Automobile industry, industry development, production, production capacity, production line, consumer, market | |
| Industry Standards | Testing, monitoring, supervision | / | / | / | ||
| Environmental Regulation | / | Environmental protection, exhaust gas, pollutants, environmental impact, pollution, emission standards, hazardous waste | / | / | ||
| Stage three | Demand-type | Promotion and Application | Buses, passenger cars, pilots, coaches | Buses, passenger cars, cabs, coaches, public institutions | Buses, passenger cars, cabs, coaches | Buses, passenger cars, taxis, coaches |
| Purchase Incentives | Subsidy, financial subsidy, sales, price, clearance, | Subsidies, financial subsidies, land grants, sales, extensions, disbursements | Subsidies, financial subsidies, sales, price settlements | Subsidies, financial subsidies, sales, prices | ||
| Supply-type | Intangible Resources | Funding, subsidy, subsidy standard, service, information, platform, competition | Funding, subsidy, service, platform | Funding, subsidy, service, information, platform, competition | Funding, special funds, service, information, platform, introduction | |
| Tangible Resources | Charging infrastructure, fast charging, supporting, parking lot, parking space | Charging infrastructure, allocation, supporting, fast charging, parking, parking spaces | Charging infrastructure, support, parking, allocation, parking, construction subsidies | Charging infrastructure, charging station, support, parking lot | ||
| Scientific Support | Key components, motor, fuel cell | Key components, science and technology bureau, battery, motor | / | Science and technology, key special projects, national key R&D programs | ||
| Environment-type | Industrial Planning | / | Automotive industry, industrialization, development zone, management committee, authority | Automobile industry, new district | Automobile industry, industrial development, industrial park, introduction | |
| Industry Standards | Testing, supervision, monitoring, recycling | / | / | / | ||
| Environmental Regulation | / | Pollutants, emission standards, environmental protection, pollution | / | / | ||
| Stage four | Demand-type | Promotion and Application | Buses, passenger cars, cabs | Passenger cars, cabs, buses, public institutions | Buses, taxis, official vehicles, public institutions | Buses, passenger cars, cabs |
| Purchase Incentives | Subsidies, financial subsidies, sales, vehicle purchases, new purchases, trade-ins, concessions, liquidation, disbursements | Subsidies, financial subsidies, sales, liquidation | Subsidies, financial subsidies, sales, concessions, exemption from vehicle purchase tax, model catalogs, subsidy standards | Subsidies, financial subsidies, sales, prices, purchase subsidies | ||
| Supply-type | Intangible Resources | Funding, special funds, rewards, subsidies, information, platform, service, competition, vocational skills | Funding, platform, service, information, award, subsidy, competition | Funding, construction subsidy, platform, service, information, data, competition | Funding, service, platform, information | |
| Tangible Resources | Charging infrastructure, charging station, power exchange station, parking lot, support, hydrogen refueling | Charging infrastructure, parking, parking spaces, allocation, supporting, charging pile construction, power exchange, power exchange station, hydrogenation | Charging infrastructure, parking, parking spaces, supporting, charging stations, service facilities, charging pile construction, power exchange | Charging infrastructure, parking, infrastructure, allocation, support, charging station | ||
| Scientific Support | Science and technology, technological innovation, smart grid, fuel cell | Key components, science and technology bureau, science and technology department, smart grid, fuel cell, competition | / | / | ||
| Environment-type | Industrial Planning | Automobile industry, industry chain, high quality, market, consumers | Automotive industry, industry chain, high quality, demonstration zone, development zone, market | Automobile industry, new area, supply chain | Automobile industry, development planning, high quality, consumers | |
| Industry Standards | Supervision, calibration, rectification, recycling, after-sales service | Supervision, calibration, monitoring, authenticity, recycling, authority | Testing, supervision, regulation | Monitoring, qualification, regulation | ||
| Environmental Regulation | / | Ecological environment, natural resources, emission reduction | Natural resources, energy saving | / |
Appendix C
Table A4.
Necessity analysis of antecedent variables.
Table A4.
Necessity analysis of antecedent variables.
| Regions | Antecedent Variables | NSP | ~NSP | ||||||
|---|---|---|---|---|---|---|---|---|---|
| Pooled Con | Pooled Cov | BECONS Adjusted Distance | WICONS Adjusted Distance | Pooled Con | Pooled Cov | BECONS Adjusted Distance | WICONS Adjusted Distance | ||
| Eastern region | DP | 0.649 | 0.611 | 0.219 | 0.311 | 0.702 | 0.664 | 0.141 | 0.234 |
| ~DP | 0.644 | 0.683 | 0.207 | 0.269 | 0.589 | 0.628 | 0.244 | 0.329 | |
| SP | 0.572 | 0.623 | 0.215 | 0.371 | 0.612 | 0.669 | 0.306 | 0.287 | |
| ~SP | 0.696 | 0.641 | 0.166 | 0.203 | 0.655 | 0.606 | 0.277 | 0.266 | |
| EP | 0.658 | 0.67 | 0.228 | 0.238 | 0.617 | 0.631 | 0.215 | 0.364 | |
| ~EP | 0.638 | 0.624 | 0.253 | 0.297 | 0.677 | 0.665 | 0.174 | 0.269 | |
| CE | 0.693 | 0.643 | 0.211 | 0.311 | 0.654 | 0.609 | 0.282 | 0.388 | |
| ~CE | 0.579 | 0.624 | 0.244 | 0.374 | 0.617 | 0.669 | 0.323 | 0.364 | |
| TE | 0.699 | 0.738 | 0.066 | 0.489 | 0.464 | 0.492 | 0.128 | 0.731 | |
| ~TE | 0.519 | 0.491 | 0.128 | 0.598 | 0.753 | 0.716 | 0.104 | 0.385 | |
| IE | 0.737 | 0.833 | 0.24 | 0.322 | 0.411 | 0.467 | 0.406 | 0.647 | |
| ~IE | 0.528 | 0.472 | 0.273 | 0.528 | 0.853 | 0.765 | 0.153 | 0.189 | |
| DE | 0.742 | 0.765 | 0.385 | 0.175 | 0.484 | 0.502 | 0.476 | 0.521 | |
| ~DE | 0.517 | 0.499 | 0.526 | 0.468 | 0.773 | 0.751 | 0.29 | 0.224 | |
| IS | 0.693 | 0.738 | 0.265 | 0.409 | 0.483 | 0.517 | 0.397 | 0.573 | |
| ~IS | 0.546 | 0.513 | 0.327 | 0.51 | 0.755 | 0.712 | 0.269 | 0.262 | |
| Central region | DP | 0.691 | 0.631 | 0.269 | 0.336 | 0.559 | 0.64 | 0.319 | 0.461 |
| ~DP | 0.606 | 0.523 | 0.381 | 0.383 | 0.678 | 0.734 | 0.29 | 0.301 | |
| SP | 0.707 | 0.624 | 0.24 | 0.235 | 0.594 | 0.656 | 0.389 | 0.293 | |
| ~SP | 0.61 | 0.545 | 0.211 | 0.328 | 0.659 | 0.739 | 0.277 | 0.194 | |
| EP | 0.583 | 0.564 | 0.455 | 0.301 | 0.588 | 0.712 | 0.29 | 0.243 | |
| ~EP | 0.702 | 0.576 | 0.319 | 0.261 | 0.64 | 0.658 | 0.323 | 0.241 | |
| CE | 0.764 | 0.674 | 0.294 | 0.325 | 0.52 | 0.575 | 0.53 | 0.577 | |
| ~CE | 0.518 | 0.463 | 0.476 | 0.554 | 0.705 | 0.789 | 0.443 | 0.162 | |
| TE | 0.704 | 0.604 | 0.244 | 0.27 | 0.656 | 0.706 | 0.244 | 0.493 | |
| ~TE | 0.657 | 0.604 | 0.29 | 0.371 | 0.632 | 0.728 | 0.219 | 0.539 | |
| IE | 0.728 | 0.675 | 0.406 | 0.238 | 0.543 | 0.631 | 0.534 | 0.461 | |
| ~IE | 0.603 | 0.513 | 0.497 | 0.33 | 0.72 | 0.768 | 0.402 | 0.18 | |
| DE | 0.7 | 0.62 | 0.53 | 0.261 | 0.557 | 0.618 | 0.609 | 0.356 | |
| ~DE | 0.568 | 0.506 | 0.604 | 0.272 | 0.657 | 0.733 | 0.518 | 0.252 | |
| IS | 0.674 | 0.566 | 0.414 | 0.246 | 0.615 | 0.647 | 0.501 | 0.38 | |
| ~IS | 0.58 | 0.546 | 0.526 | 0.441 | 0.587 | 0.693 | 0.563 | 0.383 | |
| Western region | DP | 0.581 | 0.581 | 0.46 | 0.38 | 0.653 | 0.646 | 0.381 | 0.245 |
| ~DP | 0.646 | 0.653 | 0.373 | 0.23 | 0.577 | 0.577 | 0.472 | 0.429 | |
| SP | 0.683 | 0.689 | 0.418 | 0.369 | 0.554 | 0.553 | 0.435 | 0.418 | |
| ~SP | 0.556 | 0.557 | 0.418 | 0.563 | 0.688 | 0.682 | 0.331 | 0.23 | |
| EP | 0.559 | 0.611 | 0.352 | 0.361 | 0.663 | 0.717 | 0.439 | 0.318 | |
| ~EP | 0.741 | 0.689 | 0.253 | 0.207 | 0.64 | 0.589 | 0.389 | 0.403 | |
| CE | 0.609 | 0.638 | 0.58 | 0.403 | 0.581 | 0.602 | 0.584 | 0.351 | |
| ~CE | 0.62 | 0.6 | 0.489 | 0.377 | 0.65 | 0.622 | 0.464 | 0.269 | |
| TE | 0.708 | 0.72 | 0.132 | 0.635 | 0.456 | 0.459 | 0.513 | 0.806 | |
| ~TE | 0.469 | 0.465 | 0.182 | 0.821 | 0.722 | 0.71 | 0.315 | 0.312 | |
| IE | 0.735 | 0.819 | 0.414 | 0.238 | 0.43 | 0.475 | 0.509 | 0.726 | |
| ~IE | 0.529 | 0.484 | 0.617 | 0.503 | 0.836 | 0.757 | 0.344 | 0.046 | |
| DE | 0.676 | 0.753 | 0.472 | 0.377 | 0.461 | 0.508 | 0.609 | 0.578 | |
| ~DE | 0.558 | 0.512 | 0.443 | 0.56 | 0.776 | 0.703 | 0.319 | 0.238 | |
| IS | 0.434 | 0.443 | 0.654 | 0.695 | 0.776 | 0.785 | 0.244 | 0.33 | |
| ~IS | 0.789 | 0.781 | 0.244 | 0.204 | 0.449 | 0.44 | 0.273 | 0.8 | |
| Northeast region | DP | 0.784 | 0.642 | 0.186 | 0.014 | 0.675 | 0.784 | 0.282 | 0.374 |
| ~DP | 0.737 | 0.615 | 0.248 | 0.258 | 0.692 | 0.819 | 0.331 | 0.229 | |
| SP | 0.754 | 0.598 | 0.368 | 0.125 | 0.668 | 0.753 | 0.422 | 0.258 | |
| ~SP | 0.688 | 0.593 | 0.397 | 0.342 | 0.643 | 0.788 | 0.439 | 0.301 | |
| EP | 0.703 | 0.585 | 0.435 | 0.191 | 0.631 | 0.745 | 0.522 | 0.284 | |
| ~EP | 0.694 | 0.57 | 0.426 | 0.275 | 0.649 | 0.756 | 0.53 | 0.293 | |
| CE | 0.586 | 0.509 | 0.484 | 0.525 | 0.679 | 0.837 | 0.364 | 0.067 | |
| ~CE | 0.813 | 0.641 | 0.277 | 0.261 | 0.602 | 0.674 | 0.385 | 0.609 | |
| TE | 0.633 | 0.509 | 0.199 | 0.875 | 0.585 | 0.668 | 0.253 | 0.878 | |
| ~TE | 0.587 | 0.499 | 0.157 | 0.962 | 0.569 | 0.688 | 0.207 | 1.014 | |
| IE | 0.78 | 0.667 | 0.224 | 0.426 | 0.541 | 0.656 | 0.422 | 0.765 | |
| ~IE | 0.598 | 0.478 | 0.228 | 0.809 | 0.726 | 0.824 | 0.24 | 0.736 | |
| DE | 0.717 | 0.588 | 0.476 | 0.33 | 0.623 | 0.725 | 0.563 | 0.194 | |
| ~DE | 0.664 | 0.554 | 0.414 | 0.455 | 0.645 | 0.764 | 0.447 | 0.461 | |
| IS | 0.686 | 0.553 | 0.331 | 0.351 | 0.649 | 0.743 | 0.422 | 1.676 | |
| ~IS | 0.682 | 0.578 | 0.311 | 0.53 | 0.609 | 0.733 | 0.439 | 0.641 | |
Appendix D
Table A5.
Inter-group data with an adjusted distance greater than 0.2.
Table A5.
Inter-group data with an adjusted distance greater than 0.2.
| Regions | Cause-and-Effect Combinations | 2010 | 2011 | 2012 | 2013 | 2014 | 2015 | 2016 | 2017 | 2018 | 2019 | 2020 | 2021 | 2022 | 2023 | |
|---|---|---|---|---|---|---|---|---|---|---|---|---|---|---|---|---|
| Eastern region | IS and NSP | consistency | 0.884 | 0.92 | 0.894 | 0.906 | 0.883 | 0.828 | 0.706 | 0.565 | 0.619 | 0.502 | 0.55 | 0.549 | 0.525 | 0.494 |
| coverage | 0.613 | 0.584 | 0.632 | 0.698 | 0.663 | 0.668 | 0.898 | 0.99 | 0.972 | 0.974 | 0.813 | 0.801 | 0.847 | 0.755 | ||
| ~IS and NSP | consistency | 0.348 | 0.297 | 0.361 | 0.352 | 0.39 | 0.435 | 0.56 | 0.677 | 0.646 | 0.682 | 0.664 | 0.653 | 0.725 | 0.747 | |
| coverage | 0.418 | 0.487 | 0.545 | 0.537 | 0.485 | 0.474 | 0.417 | 0.577 | 0.485 | 0.52 | 0.6 | 0.519 | 0.567 | 0.494 | ||
| IE and NSP | consistency | 0.47 | 0.542 | 0.572 | 0.586 | 0.669 | 0.661 | 0.731 | 0.681 | 0.772 | 0.789 | 0.854 | 0.93 | 0.984 | 1 | |
| coverage | 0.908 | 0.867 | 0.858 | 0.871 | 0.855 | 0.857 | 0.89 | 0.943 | 0.884 | 0.89 | 0.874 | 0.775 | 0.777 | 0.648 | ||
| ~IE and NSP | consistency | 0.76 | 0.677 | 0.642 | 0.646 | 0.579 | 0.581 | 0.54 | 0.581 | 0.51 | 0.49 | 0.458 | 0.361 | 0.322 | 0.302 | |
| coverage | 0.433 | 0.434 | 0.455 | 0.505 | 0.428 | 0.419 | 0.414 | 0.568 | 0.464 | 0.52 | 0.568 | 0.484 | 0.51 | 0.483 | ||
| CE and NSP | consistency | 0.885 | 0.875 | 0.797 | 0.783 | 0.757 | 0.668 | 0.685 | 0.612 | 0.557 | 0.467 | 0.464 | 0.66 | 0.785 | 0.821 | |
| coverage | 0.532 | 0.537 | 0.563 | 0.646 | 0.625 | 0.631 | 0.659 | 0.806 | 0.784 | 0.767 | 0.93 | 0.735 | 0.65 | 0.543 | ||
| ~CE and NSP | consistency | 0.413 | 0.39 | 0.509 | 0.542 | 0.563 | 0.632 | 0.611 | 0.663 | 0.708 | 0.756 | 0.764 | 0.637 | 0.43 | 0.387 | |
| coverage | 0.677 | 0.702 | 0.766 | 0.731 | 0.61 | 0.575 | 0.562 | 0.673 | 0.561 | 0.62 | 0.595 | 0.608 | 0.623 | 0.591 | ||
| DE and NSP | consistency | 0.201 | 0.303 | 0.417 | 0.544 | 0.682 | 0.778 | 0.825 | 0.815 | 0.875 | 0.894 | 0.94 | 0.977 | 0.98 | 1 | |
| coverage | 1 | 1 | 1 | 0.969 | 0.887 | 0.835 | 0.793 | 0.854 | 0.735 | 0.738 | 0.749 | 0.686 | 0.683 | 0.597 | ||
| ~DE and NSP | consistency | 0.966 | 0.883 | 0.809 | 0.745 | 0.652 | 0.586 | 0.526 | 0.508 | 0.428 | 0.357 | 0.315 | 0.24 | 0.191 | 0.17 | |
| coverage | 0.466 | 0.469 | 0.487 | 0.536 | 0.477 | 0.478 | 0.484 | 0.643 | 0.549 | 0.579 | 0.596 | 0.461 | 0.411 | 0.346 | ||
| NP and NSP | consistency | 0.443 | 0.493 | 0.612 | 0.671 | 0.58 | 0.671 | 0.713 | 0.677 | 0.833 | 0.831 | 0.826 | 0.657 | 0.544 | 0.441 | |
| coverage | 0.438 | 0.45 | 0.792 | 0.671 | 0.44 | 0.512 | 0.717 | 0.82 | 0.684 | 0.678 | 0.721 | 0.626 | 0.583 | 0.443 | ||
| ~NP and NSP | consistency | 0.858 | 0.714 | 0.762 | 0.653 | 0.65 | 0.602 | 0.633 | 0.7 | 0.471 | 0.424 | 0.469 | 0.64 | 0.716 | 0.796 | |
| coverage | 0.679 | 0.655 | 0.584 | 0.685 | 0.795 | 0.71 | 0.559 | 0.762 | 0.626 | 0.702 | 0.734 | 0.715 | 0.742 | 0.679 | ||
| SP and NSP | consistency | 0.439 | 0.59 | 0.612 | 0.408 | 0.455 | 0.422 | 0.84 | 0.537 | 0.634 | 0.655 | 0.604 | 0.614 | 0.606 | 0.571 | |
| coverage | 0.733 | 0.698 | 0.449 | 0.533 | 0.778 | 0.7 | 0.736 | 0.67 | 0.635 | 0.745 | 0.635 | 0.579 | 0.582 | 0.476 | ||
| EP and NSP | consistency | 0.746 | 0.898 | 0.84 | 0.816 | 0.799 | 0.688 | 0.643 | 0.519 | 0.6 | 0.571 | 0.446 | 0.464 | 0.581 | 0.713 | |
| coverage | 0.495 | 0.754 | 0.678 | 0.771 | 0.645 | 0.615 | 0.704 | 0.743 | 0.686 | 0.674 | 0.551 | 0.628 | 0.764 | 0.738 | ||
| ~EP and NSP | consistency | 0.526 | 0.319 | 0.447 | 0.559 | 0.538 | 0.643 | 0.654 | 0.804 | 0.741 | 0.683 | 0.867 | 0.798 | 0.668 | 0.561 | |
| coverage | 0.686 | 0.321 | 0.533 | 0.624 | 0.6 | 0.618 | 0.538 | 0.769 | 0.676 | 0.696 | 0.89 | 0.661 | 0.587 | 0.467 | ||
| Central region | NP and NSP | consistency | 0.533 | 0.704 | 0.917 | 0.867 | 1 | 0.657 | 0.59 | 0.445 | 0.918 | 0.795 | 0.514 | 0.587 | 0.557 | 0.674 |
| coverage | 0.994 | 0.913 | 0.693 | 0.538 | 0.511 | 0.497 | 0.551 | 0.493 | 0.673 | 0.751 | 0.887 | 0.847 | 0.557 | 0.443 | ||
| ~NP and NSP | consistency | 0.803 | 0.706 | 0.573 | 0.435 | 0.199 | 0.651 | 0.633 | 0.891 | 0.27 | 0.418 | 0.858 | 0.801 | 0.627 | 0.511 | |
| coverage | 0.312 | 0.382 | 0.594 | 0.434 | 0.37 | 0.634 | 0.561 | 0.601 | 0.38 | 0.443 | 0.803 | 0.801 | 0.584 | 0.333 | ||
| SP and NSP | consistency | 0.587 | 0.645 | 0.767 | 0.766 | 0.539 | 0.849 | 0.992 | 0.655 | 0.776 | 0.61 | 0.81 | 0.811 | 0.495 | 0.429 | |
| coverage | 0.747 | 0.503 | 0.667 | 0.606 | 0.519 | 0.538 | 0.634 | 0.458 | 0.701 | 0.487 | 0.776 | 0.946 | 0.684 | 0.515 | ||
| ~SP and NSP | consistency | 0.573 | 0.619 | 0.706 | 0.561 | 0.814 | 0.395 | 0.406 | 0.743 | 0.691 | 0.582 | 0.488 | 0.671 | 0.66 | 0.67 | |
| coverage | 0.246 | 0.462 | 0.621 | 0.416 | 0.559 | 0.512 | 0.64 | 0.78 | 0.715 | 0.778 | 0.809 | 0.803 | 0.489 | 0.302 | ||
| EP and NSP | consistency | 1 | 0.996 | 0.932 | 0.824 | 0.569 | 0.561 | 0.598 | 0.191 | 0.739 | 0.314 | 0.362 | 0.487 | 0.441 | 0.444 | |
| coverage | 0.736 | 0.673 | 0.581 | 0.497 | 0.411 | 0.373 | 0.596 | 0.473 | 0.839 | 0.608 | 0.821 | 0.82 | 0.463 | 0.287 | ||
| ~EP and NSP | consistency | 0.348 | 0.49 | 0.358 | 0.473 | 0.698 | 0.644 | 0.744 | 1 | 0.73 | 0.906 | 0.875 | 0.889 | 0.692 | 0.673 | |
| coverage | 0.198 | 0.429 | 0.525 | 0.495 | 0.63 | 0.76 | 0.623 | 0.505 | 0.612 | 0.61 | 0.725 | 0.809 | 0.617 | 0.447 | ||
| CE and NSP | consistency | 0.957 | 1 | 1 | 1 | 1 | 0.793 | 0.771 | 0.822 | 0.528 | 0.461 | 0.4 | 0.572 | 0.859 | 0.984 | |
| coverage | 0.341 | 0.418 | 0.56 | 0.631 | 0.725 | 0.744 | 0.841 | 0.829 | 0.943 | 0.878 | 1 | 1 | 0.999 | 0.681 | ||
| ~CE and NSP | consistency | 0.197 | 0.223 | 0.327 | 0.369 | 0.301 | 0.463 | 0.604 | 0.477 | 0.772 | 0.75 | 0.864 | 0.694 | 0.441 | 0.31 | |
| coverage | 0.646 | 0.984 | 0.652 | 0.359 | 0.269 | 0.361 | 0.471 | 0.342 | 0.51 | 0.509 | 0.693 | 0.619 | 0.363 | 0.192 | ||
| HE and NSP | consistency | 0.356 | 0.546 | 0.581 | 0.616 | 0.591 | 0.622 | 0.706 | 0.688 | 0.776 | 0.711 | 0.767 | 0.865 | 0.883 | 0.971 | |
| coverage | 0.338 | 0.548 | 0.641 | 0.584 | 0.568 | 0.598 | 0.688 | 0.585 | 0.724 | 0.631 | 0.745 | 0.75 | 0.578 | 0.409 | ||
| ~HE and NSP | consistency | 0.925 | 0.893 | 0.881 | 0.805 | 0.762 | 0.722 | 0.766 | 0.722 | 0.568 | 0.555 | 0.57 | 0.481 | 0.364 | 0.403 | |
| coverage | 0.449 | 0.549 | 0.638 | 0.517 | 0.524 | 0.551 | 0.654 | 0.598 | 0.567 | 0.634 | 0.921 | 0.891 | 0.666 | 0.59 | ||
| IE and NSP | consistency | 0.203 | 0.306 | 0.385 | 0.548 | 0.59 | 0.605 | 0.742 | 0.801 | 0.864 | 0.806 | 0.972 | 0.971 | 0.999 | 1 | |
| coverage | 0.649 | 0.847 | 0.892 | 0.78 | 0.7 | 0.753 | 0.849 | 0.703 | 0.767 | 0.641 | 0.845 | 0.718 | 0.555 | 0.359 | ||
| ~IE and NSP | consistency | 0.988 | 0.972 | 0.95 | 0.832 | 0.763 | 0.739 | 0.729 | 0.643 | 0.637 | 0.461 | 0.437 | 0.339 | 0.125 | 0.114 | |
| coverage | 0.353 | 0.43 | 0.512 | 0.435 | 0.461 | 0.478 | 0.551 | 0.517 | 0.672 | 0.619 | 0.878 | 1 | 0.452 | 0.418 | ||
| DE and NSP | consistency | 0.117 | 0.167 | 0.236 | 0.385 | 0.477 | 0.583 | 0.743 | 0.832 | 0.912 | 0.9 | 1 | 0.968 | 0.984 | 1 | |
| coverage | 0.853 | 0.88 | 0.872 | 0.78 | 0.698 | 0.66 | 0.747 | 0.621 | 0.667 | 0.589 | 0.729 | 0.66 | 0.531 | 0.358 | ||
| ~DE and NSP | consistency | 1 | 1 | 1 | 0.929 | 0.876 | 0.761 | 0.728 | 0.614 | 0.453 | 0.297 | 0.276 | 0.227 | 0.123 | 0.132 | |
| coverage | 0.336 | 0.411 | 0.496 | 0.438 | 0.483 | 0.519 | 0.606 | 0.587 | 0.642 | 0.627 | 1 | 1 | 0.554 | 0.509 | ||
| IS and NSP | consistency | 0.972 | 0.973 | 0.951 | 0.845 | 0.799 | 0.78 | 0.223 | 0.296 | 0.357 | 0.318 | 0.792 | 0.778 | 0.776 | 0.736 | |
| coverage | 0.354 | 0.398 | 0.486 | 0.436 | 0.523 | 0.604 | 0.792 | 0.997 | 0.927 | 0.911 | 0.915 | 0.839 | 0.662 | 0.417 | ||
| ~IS and NSP | consistency | 0.189 | 0.172 | 0.265 | 0.443 | 0.517 | 0.509 | 0.994 | 1 | 0.92 | 0.821 | 0.569 | 0.547 | 0.396 | 0.551 | |
| coverage | 0.514 | 0.982 | 0.811 | 0.655 | 0.534 | 0.482 | 0.519 | 0.479 | 0.545 | 0.497 | 0.727 | 0.715 | 0.439 | 0.427 | ||
| Western region | Cause-and-Effect Combinations | 2010 | 2011 | 2012 | 2013 | 2014 | 2015 | 2016 | 2017 | 2018 | 2019 | 2020 | 2021 | 2022 | 2023 | |
| NP and NSP | consistency | 0.085 | 0.467 | 0.379 | 0.828 | 0.332 | 0.462 | 0.604 | 0.526 | 0.688 | 0.908 | 0.416 | 0.602 | 0.76 | 1 | |
| coverage | 0.127 | 0.447 | 0.758 | 0.842 | 0.384 | 0.567 | 0.483 | 0.452 | 0.772 | 0.83 | 0.682 | 0.569 | 0.612 | 0.581 | ||
| ~NP and NSP | consistency | 1 | 0.75 | 0.79 | 0.563 | 0.911 | 0.752 | 0.612 | 0.888 | 0.639 | 0.406 | 0.796 | 0.563 | 0.314 | 0.219 | |
| coverage | 0.619 | 0.747 | 0.537 | 0.465 | 0.854 | 0.558 | 0.674 | 0.867 | 0.59 | 0.37 | 0.615 | 0.93 | 1 | 1 | ||
| SP and NSP | consistency | 0.654 | 0.789 | 0.924 | 0.486 | 0.512 | 0.863 | 0.989 | 0.951 | 0.821 | 0.981 | 0.877 | 0.545 | 0.253 | 0.14 | |
| coverage | 0.451 | 0.645 | 0.676 | 0.909 | 0.761 | 0.991 | 0.737 | 0.905 | 0.655 | 0.584 | 0.629 | 0.687 | 0.677 | 0.699 | ||
| ~SP and NSP | consistency | 0.419 | 0.394 | 0.201 | 0.7 | 0.733 | 0.498 | 0.357 | 0.578 | 0.479 | 0.475 | 0.362 | 0.62 | 0.843 | 1 | |
| coverage | 0.5 | 0.478 | 0.331 | 0.422 | 0.583 | 0.385 | 0.438 | 0.508 | 0.663 | 0.929 | 0.712 | 0.712 | 0.714 | 0.575 | ||
| EP and NSP | consistency | 0.773 | 0.716 | 0.688 | 0.417 | 0.42 | 0.718 | 0.937 | 0.776 | 0.396 | 0.474 | 0.52 | 0.412 | 0.34 | 0.41 | |
| coverage | 0.519 | 0.538 | 0.461 | 0.609 | 0.47 | 0.715 | 0.665 | 0.703 | 0.532 | 0.457 | 0.626 | 0.925 | 1 | 1 | ||
| ~EP and NSP | consistency | 0.566 | 0.612 | 0.392 | 0.947 | 0.877 | 0.718 | 0.514 | 0.744 | 0.989 | 0.951 | 0.816 | 0.753 | 0.732 | 0.745 | |
| coverage | 0.709 | 0.852 | 0.814 | 0.628 | 0.845 | 0.619 | 0.689 | 0.687 | 0.803 | 0.825 | 0.761 | 0.618 | 0.603 | 0.487 | ||
| CE and NSP | consistency | 0.893 | 0.978 | 0.916 | 0.843 | 0.63 | 0.438 | 0.41 | 0.552 | 0.132 | 0.085 | 0.131 | 0.56 | 0.885 | 1 | |
| coverage | 0.606 | 0.602 | 0.632 | 0.583 | 0.703 | 0.599 | 0.604 | 0.759 | 1 | 0.957 | 0.905 | 0.705 | 0.694 | 0.539 | ||
| ~CE and NSP | consistency | 0.572 | 0.385 | 0.458 | 0.508 | 0.598 | 0.773 | 0.774 | 0.914 | 1 | 1 | 0.98 | 0.604 | 0.212 | 0.085 | |
| coverage | 0.702 | 0.907 | 0.876 | 0.679 | 0.578 | 0.54 | 0.524 | 0.626 | 0.543 | 0.476 | 0.558 | 0.695 | 0.756 | 1 | ||
| IE and NSP | consistency | 0.209 | 0.253 | 0.349 | 0.543 | 0.686 | 0.678 | 0.754 | 0.866 | 0.899 | 0.949 | 0.942 | 0.993 | 0.967 | 1 | |
| coverage | 1 | 1 | 1 | 0.983 | 0.994 | 0.932 | 0.885 | 0.879 | 0.932 | 0.823 | 0.848 | 0.787 | 0.728 | 0.561 | ||
| ~IE and NSP | consistency | 1 | 0.956 | 0.834 | 0.845 | 0.674 | 0.792 | 0.666 | 0.554 | 0.431 | 0.4 | 0.263 | 0.148 | 0.096 | 0.081 | |
| coverage | 0.481 | 0.532 | 0.514 | 0.515 | 0.543 | 0.552 | 0.511 | 0.461 | 0.426 | 0.386 | 0.332 | 0.368 | 0.422 | 0.516 | ||
| DE and NSP | consistency | 0.123 | 0.19 | 0.294 | 0.491 | 0.511 | 0.68 | 0.775 | 0.847 | 0.849 | 1 | 0.976 | 0.83 | 0.804 | 0.969 | |
| coverage | 1 | 0.943 | 0.914 | 0.878 | 0.865 | 0.885 | 0.859 | 0.772 | 0.739 | 0.699 | 0.729 | 0.689 | 0.694 | 0.655 | ||
| ~DE and NSP | consistency | 1 | 0.925 | 0.799 | 0.738 | 0.717 | 0.602 | 0.548 | 0.55 | 0.53 | 0.422 | 0.366 | 0.292 | 0.255 | 0.29 | |
| coverage | 0.462 | 0.501 | 0.484 | 0.452 | 0.535 | 0.431 | 0.437 | 0.504 | 0.642 | 0.555 | 0.65 | 0.637 | 0.642 | 0.631 | ||
| IS and NSP | consistency | 0.882 | 0.842 | 0.741 | 0.728 | 0.468 | 0.422 | 0.092 | 0.113 | 0.167 | 0.16 | 0.376 | 0.344 | 0.346 | 0.455 | |
| coverage | 0.488 | 0.526 | 0.555 | 0.525 | 0.453 | 0.407 | 0.15 | 0.191 | 0.253 | 0.213 | 0.411 | 0.445 | 0.515 | 0.608 | ||
| ~IS and NSP | consistency | 0.48 | 0.447 | 0.632 | 0.748 | 0.822 | 0.812 | 1 | 1 | 1 | 1 | 0.748 | 0.815 | 0.751 | 0.806 | |
| coverage | 1 | 1 | 0.993 | 0.927 | 0.914 | 0.72 | 0.647 | 0.628 | 0.76 | 0.694 | 0.757 | 0.914 | 0.849 | 0.677 | ||
| Northeast region | Cause-and-Effect Combinations | 2010 | 2011 | 2012 | 2013 | 2014 | 2015 | 2016 | 2017 | 2018 | 2019 | 2020 | 2021 | 2022 | 2023 | |
| ~NP and NSP | consistency | 0.696 | 0.97 | 0.802 | 0.517 | 0.655 | 0.514 | 0.998 | 0.806 | 0.631 | 0.497 | 0.697 | 0.877 | 0.784 | 1 | |
| coverage | 0.723 | 0.81 | 0.652 | 0.502 | 0.445 | 0.75 | 0.555 | 0.392 | 0.52 | 0.707 | 0.79 | 0.802 | 0.88 | 0.339 | ||
| SP and NSP | consistency | 1 | 1 | 1 | 0.88 | 0.845 | 0.733 | 0.957 | 0.868 | 0.666 | 0.835 | 1 | 0.708 | 0.193 | 0.212 | |
| coverage | 0.476 | 0.491 | 0.486 | 0.529 | 0.854 | 0.727 | 0.556 | 0.444 | 0.524 | 0.697 | 0.695 | 1 | 1 | 1 | ||
| ~SP and NSP | consistency | 0.335 | 0.381 | 0.371 | 0.547 | 0.83 | 1 | 0.725 | 1 | 0.649 | 0.507 | 0.483 | 0.979 | 0.91 | 1 | |
| coverage | 0.914 | 0.732 | 0.573 | 0.476 | 0.466 | 0.514 | 0.684 | 0.578 | 1 | 0.699 | 0.551 | 0.726 | 0.77 | 0.26 | ||
| EP and NSP | consistency | 1 | 1 | 1 | 0.886 | 0.796 | 1 | 0.383 | 0.934 | 0.723 | 0.643 | 0.963 | 0.568 | 0.165 | 0.2 | |
| coverage | 0.459 | 0.454 | 0.406 | 0.459 | 0.677 | 0.502 | 0.619 | 0.922 | 0.572 | 0.745 | 0.889 | 1 | 1 | 1 | ||
| ~EP and NSP | consistency | 0.286 | 0.354 | 0.223 | 0.541 | 0.596 | 0.777 | 1 | 1 | 0.608 | 0.658 | 0.691 | 0.993 | 0.945 | 1 | |
| coverage | 1 | 1 | 0.928 | 0.611 | 0.373 | 0.806 | 0.463 | 0.374 | 0.93 | 0.62 | 0.56 | 0.667 | 0.782 | 0.259 | ||
| CE and NSP | consistency | 0.999 | 0.963 | 0.791 | 0.849 | 0.963 | 0.429 | 0.531 | 0.733 | 0.37 | 0.172 | 0.192 | 0.399 | 0.565 | 0.659 | |
| coverage | 0.494 | 0.47 | 0.422 | 0.446 | 0.533 | 0.397 | 0.481 | 0.473 | 0.554 | 0.566 | 0.559 | 0.774 | 0.987 | 0.316 | ||
| ~CE and NSP | consistency | 0.404 | 0.461 | 0.582 | 0.707 | 0.801 | 1 | 0.999 | 1 | 0.904 | 0.978 | 1 | 1 | 0.717 | 0.865 | |
| coverage | 0.91 | 0.911 | 0.7 | 0.778 | 0.83 | 0.534 | 0.596 | 0.468 | 0.723 | 0.603 | 0.506 | 0.649 | 0.894 | 0.439 | ||
| IE and NSP | consistency | 0.504 | 0.561 | 0.638 | 0.725 | 0.662 | 0.677 | 0.89 | 0.894 | 0.628 | 0.936 | 0.93 | 0.903 | 0.916 | 1 | |
| coverage | 0.478 | 0.527 | 0.552 | 0.536 | 0.523 | 0.649 | 0.75 | 0.575 | 1 | 0.998 | 0.777 | 0.685 | 0.98 | 0.35 | ||
| ~IE and NSP | consistency | 0.772 | 0.726 | 0.693 | 0.701 | 0.664 | 0.768 | 0.715 | 0.775 | 0.448 | 0.407 | 0.488 | 0.542 | 0.439 | 0.619 | |
| coverage | 0.547 | 0.487 | 0.447 | 0.479 | 0.441 | 0.402 | 0.449 | 0.363 | 0.347 | 0.412 | 0.436 | 0.735 | 1 | 0.516 | ||
| DE and NSP | consistency | 0.105 | 0.196 | 0.286 | 0.462 | 0.623 | 0.737 | 0.783 | 0.922 | 0.856 | 0.91 | 0.957 | 0.959 | 0.975 | 1 | |
| coverage | 1 | 1 | 0.814 | 0.747 | 0.715 | 0.512 | 0.564 | 0.409 | 0.65 | 0.647 | 0.52 | 0.576 | 0.861 | 0.295 | ||
| ~DE and NSP | consistency | 1 | 1 | 1 | 1 | 1 | 0.741 | 0.829 | 0.873 | 0.475 | 0.432 | 0.454 | 0.39 | 0.242 | 0.572 | |
| coverage | 0.423 | 0.424 | 0.425 | 0.455 | 0.527 | 0.489 | 0.596 | 0.611 | 0.788 | 0.835 | 0.954 | 1 | 1 | 0.856 | ||
| IS and NSP | consistency | 0.973 | 1 | 0.941 | 0.811 | 0.817 | 1 | 0.544 | 0.52 | 0.428 | 0.34 | 0.641 | 0.664 | 0.522 | 0.794 | |
| coverage | 0.59 | 0.452 | 0.503 | 0.497 | 0.464 | 0.456 | 0.897 | 0.513 | 0.688 | 0.618 | 0.409 | 0.551 | 1 | 0.792 | ||
| ~IS and NSP | consistency | 0.596 | 0.293 | 0.565 | 0.628 | 0.599 | 0.567 | 1 | 1 | 0.642 | 0.762 | 0.567 | 0.735 | 0.739 | 1 | |
| coverage | 0.73 | 0.856 | 0.678 | 0.53 | 0.593 | 0.744 | 0.46 | 0.374 | 0.495 | 0.554 | 0.758 | 0.862 | 0.868 | 0.327 | ||
References
- Ren, F.; Liu, X.; Charles, V.; Zhao, X.; Balsalobre-Lorente, D. Integrated efficiency and influencing factors analysis of ESG and market performance in thermal power enterprises in China: A hybrid perspective based on parallel DEA and a benchmark model. Energy Econ. 2025, 141, 108138. [Google Scholar] [CrossRef]
- Zhang, H.; Chun, W.; Yuan, X.-M.; Liu, W.; Chou, M.C. The governance of irresponsible new energy vehicle members considering differentiated subsidies. Sustain. Cities Soc. 2024, 104, 105289. [Google Scholar] [CrossRef]
- Liu, Q.; Wen, X.; Cao, Q. Multi-objective development path evolution of new energy vehicle policy driven by big data: From the perspective of economic-ecological-social. Appl Energy 2023, 341, 121065. [Google Scholar] [CrossRef]
- Palmer, K.; Tate, J.E.; Wadud, Z.; Nellthorp, J. Total cost of ownership and market share for hybrid and electric vehicles in the UK, US and Japan. Appl Energy 2018, 209, 108–119. [Google Scholar] [CrossRef]
- Guo, Z.; Du, Y.; Zhao, Y. Sustaining the advancement of new energy vehicles in the post-subsidy era: Carbon quota mechanisms and subsidy mechanisms for recycling of used batteries. Sustain. Prod. Consum. 2024, 45, 158–176. [Google Scholar] [CrossRef]
- Liu, X.; Zhang, D.; Nguyen, C.T.; Yuen, K.F.; Wang, X. “Freedom–enslavement” paradox in consumers’ adoption of smart transportation: A comparative analysis of three technologies. Transp. Policy 2025, 164, 206–216. [Google Scholar] [CrossRef]
- Liu, L.; Zhang, T.; Avrin, A.-P.; Wang, X. Is China’s industrial policy effective? An empirical study of the new energy vehicles industry. Technol. Soc. 2020, 63, 101356. [Google Scholar] [CrossRef]
- Yang, W.; Liu, J.; Li, L.; Zhou, Q.; Ji, L. How Could Policies Facilitate Digital Transformation of Innovation Ecosystem: A Multiagent Model. Complexity 2021, 2021, 1–19. [Google Scholar] [CrossRef]
- Zhang, L.; Qin, Q. China’s new energy vehicle policies: Evolution, comparison and recommendation. Transp. Res. Part A Policy Pract. 2018, 110, 57–72. [Google Scholar] [CrossRef]
- Yuan, B.; Zhang, Y. Flexible environmental policy, technological innovation and sustainable development of China’s industry: The moderating effect of environment regulatory enforcement. J Clean. Prod 2020, 243, 118543. [Google Scholar] [CrossRef]
- Ma, M.; Meng, W.; Li, Y.; Huang, B. Impact of dual credit policy on new energy vehicles technology innovation with information asymmetry. Appl Energy 2023, 332, 120524. [Google Scholar] [CrossRef]
- Liu, C.; Zhang, L.; Wu, F.; Xia, R. Role of sustainable management policy and carbon neutral processes in improving sustainable performance: Study of China’s aluminium sector. Resour. Pol 2024, 88, 104347. [Google Scholar] [CrossRef]
- Fu, S.; Liu, D.; Huang, F. Synergistic effect of government policy and market mechanism on the innovation of new energy vehicle enterprises. Energy 2024, 295, 130998. [Google Scholar] [CrossRef]
- Gong, H.; Hansen, T. The rise of China’s new energy vehicle lithium-ion battery industry: The coevolution of battery technological innovation systems and policies. Environ. Innov. Soc. Transit. 2023, 46, 100689. [Google Scholar] [CrossRef]
- Liu, B.; Song, C.; Wang, Q.; Zhang, X.; Chen, J. Research on regional differences of China’s new energy vehicles promotion policies: A perspective of sales volume forecasting. Energy 2022, 248, 123541. [Google Scholar] [CrossRef]
- Cao, H.; Wang, B.; Li, K. Regulatory policy and misallocation: A new perspective based on the productivity effect of cleaner production standards in China’s energy firms. Energy Policy 2021, 152, 112231. [Google Scholar] [CrossRef]
- Collins, A.R.; Mekky, M.F. The Impact of state policies on electric vehicle adoption—A panel data analysis. Renew. Sustain. Energy Rev. 2024, 191, 114014. [Google Scholar] [CrossRef]
- Wang, N.; Tang, L.; Pan, H. A global comparison and assessment of incentive policy on electric vehicle promotion. Sustain. Cities Soc. 2019, 44, 597–603. [Google Scholar] [CrossRef]
- Ye, R.-K.; Gao, Z.-F.; Fang, K.; Liu, K.-L.; Chen, J.-W. Moving from subsidy stimulation to endogenous development: A system dynamics analysis of China’s NEVs in the post-subsidy era. Technol. Forecast. Soc. Chang. 2021, 168, 120757. [Google Scholar] [CrossRef]
- Yin, C.; Huang, Z. The evolving policy network in sustainable transitions: The case of new energy vehicle niche in China. J. Clean. Prod. 2023, 411, 137299. [Google Scholar] [CrossRef]
- Liu, C.; Liu, Y.; Zhang, D.; Xie, C. The capital market responses to new energy vehicle (NEV) subsidies: An event study on China. Energy Econ. 2022, 105, 105677. [Google Scholar] [CrossRef]
- Wang, X.; Li, Z.; Shaikh, R.; Ranjha, A.R.; Batala, L.K. Do government subsidies promote financial performance? Fresh evidence from China’s new energy vehicle industry. Sustain. Prod. Consum. 2021, 28, 142–153. [Google Scholar] [CrossRef]
- Fotouhi, A.; Auger, D.J.; Propp, K.; Longo, S.; Wild, M. A review on electric vehicle battery modelling: From Lithium-ion toward Lithium–Sulphur. Renew. Sustain. Energy Rev. 2016, 56, 1008–1021. [Google Scholar] [CrossRef]
- Zhang, L.; Wang, L.; Chai, J. Influence of new energy vehicle subsidy policy on emission reduction of atmospheric pollutants: A case study of Beijing, China. J. Clean. Prod. 2020, 275, 124069. [Google Scholar] [CrossRef]
- Tan, R.; Tang, D.; Lin, B. Policy impact of new energy vehicles promotion on air quality in Chinese cities. Energy Policy 2018, 118, 33–40. [Google Scholar] [CrossRef]
- Wang, Z.; Li, X.; Xue, X.; Liu, Y. More government subsidies, more green innovation? The evidence from Chinese new energy vehicle enterprises. Renew. Energy 2022, 197, 11–21. [Google Scholar] [CrossRef]
- Wang, Z. Purchasing intentions of Chinese citizens on new energy vehicles: How should one respond to current preferential policy? J. Clean. Prod. 2017, 161, 1000–1010. [Google Scholar] [CrossRef]
- Jiao, Y.; Yu, L.; Wang, J.; Wu, D.; Tang, Y. Diffusion of new energy vehicles under incentive policies of China: Moderating role of market characteristic. J. Clean. Prod. 2022, 353, 131660. [Google Scholar] [CrossRef]
- Cai, J.; Zhu, M.; Wu, J.; Chen, X.; Xu, J.; Shen, Z.-Y. Evaluating the impact of new energy vehicle subsidies on urban carbon emissions: Evidence from 261 Chinese cities. Renew. Energy 2025, 240, 122261. [Google Scholar] [CrossRef]
- Nilsson, M.; Nykvist, B. Governing the electric vehicle transition—Near term interventions to support a green energy economy. Appl. Energy 2016, 179, 1360–1371. [Google Scholar] [CrossRef]
- Liu, J.; Zhang, J.; Ma, X.; Zhao, B.; Zhang, M. The road to sustainable development: Can the new energy demonstration city policy promote the industrial structure transformation? Renew. Energy 2024, 237, 121721. [Google Scholar] [CrossRef]
- Jia, S.; Zhu, W. Effects of carbon tax policy on vehicle pollution control and carbon reduction based on the availability heuristic and system dynamics. Sustain. Cities Soc. 2025, 118, 105990. [Google Scholar] [CrossRef]
- Li, J.; Ku, Y.; Liu, C.; Zhou, Y. Dual credit policy: Promoting new energy vehicles with battery recycling in a competitive environment? J. Clean. Prod. 2020, 243, 118456. [Google Scholar] [CrossRef]
- Zhu, X.; Chiong, R.; Wang, M.; Liu, K.; Ren, M. Is carbon regulation better than cash subsidy? The case of new energy vehicles. Transp. Res. Part A Policy Pract. 2021, 146, 170–192. [Google Scholar] [CrossRef]
- Kittner, N.; Lima, L.M.M.; Kear, S. Charging forward: A greenhouse gas emissions analysis of New York State’s electric vehicle and clean energy goals. Energy Policy 2025, 201, 114573. [Google Scholar] [CrossRef]
- Yang, X.; Lin, W.; Gong, R.; Zhu, M.; Springer, C. Transport decarbonization in big cities: An integrated environmental co-benefit analysis of vehicles purchases quota-limit and new energy vehicles promotion policy in Beijing. Sustain. Cities Soc. 2021, 71, 102976. [Google Scholar] [CrossRef]
- Ren, J. New energy vehicle in China for sustainable development: Analysis of success factors and strategic implications. Transp. Res. Part D Transp. Environ. 2018, 59, 268–288. [Google Scholar] [CrossRef]
- Zhang, X.; Liang, Y.; Yu, E.; Rao, R.; Xie, J. Review of electric vehicle policies in China: Content summary and effect analysis. Renew. Sustain. Energy Rev 2017, 70, 698–714. [Google Scholar] [CrossRef]
- Sun, X.; Liu, X.; Wang, Y.; Yuan, F. The effects of public subsidies on emerging industry: An agent-based model of the electric vehicle industry. Technol. Forecast. Soc. Chang. 2019, 140, 281–295. [Google Scholar] [CrossRef]
- Lu, C.; Liu, H.-C.; Tao, J.; Rong, K.; Hsieh, Y.-C. A key stakeholder-based financial subsidy stimulation for Chinese EV industrialization: A system dynamics simulation. Technol. Forecast. Soc. Chang. 2017, 118, 1–14. [Google Scholar] [CrossRef]
- Khammassi, E.; Rehimi, F.; Halawani, A.T.M.; Kalboussi, A. Energy transition policy via electric vehicles adoption in the developing world: Tunisia as a case study. Energy Policy 2024, 185, 113927. [Google Scholar] [CrossRef]
- Kamikawa, Y.; Brummer, M. Cross-national and cross-sectoral dynamics of innovation policies: The case of lithium-ion battery technology for electric vehicles in the U.S. and China. Technol. Forecast. Soc. Chang. 2024, 201, 123021. [Google Scholar] [CrossRef]
- Rothwell, R. Reindustrialization and technology: Towards a national policy framework. Sci. Publ. Policy 1985, 12, 113–130. [Google Scholar] [CrossRef]
- Meissner, D.; Kergroach, S. Innovation policy mix: Mapping and measurement. J. Technol. Transf. 2021, 46, 197–222. [Google Scholar] [CrossRef]
- Burström, T.; Lahti, T.; Parida, V.; Wincent, J. Industrial ecosystems: A systematic review, framework and research agenda. Technol. Forecast. Soc. Chang. 2024, 208, 123656. [Google Scholar] [CrossRef]
- Zheng, T.Y.; Wang, T. Research on the Health Measurement of NEV Based on Business Ecosystem. China Soft Sci. 2020, 11, 182–192. (In Chinese) [Google Scholar] [CrossRef]
- Adamides, E.D.; Mouzakitis, Y. Industrial ecosystems as technological niches. J Clean. Prod 2009, 17, 172–180. [Google Scholar] [CrossRef]
- Douglas, E.J.; Shepherd, D.A.; Prentice, C. Using fuzzy-set qualitative comparative analysis for a finer-grained understanding of entrepreneurship. J. Bus. Ventur. 2020, 35, 105970. [Google Scholar] [CrossRef]
- Greckhamer, T.; Furnari, S.; Fiss, P.C.; Aguilera, R.V. Studying configurations with qualitative comparative analysis: Best practices in strategy and organization research. Strat. Organ. 2018, 16, 482–495. [Google Scholar] [CrossRef]
- Fiss, P. Configurations of Strategy, Structure and Environment: A Fuzzy Set Analysis of High Technology Firms, 2008. Available online: https://web.mit.edu/bpsmini/2008/Peer-C-Fiss.pdf (accessed on 20 May 2025).
- Miao, C.; Fang, D.; Sun, L.; Luo, Q.; Yu, Q. Driving effect of technology innovation on energy utilization efficiency in strategic emerging industries. J. Clean. Prod. 2018, 170, 1177–1184. [Google Scholar] [CrossRef]
- Gnann, T.; Plötz, P. A review of combined models for market diffusion of alternative fuel vehicles and their refueling infrastructure. Renew. Sustain. Energy Rev. 2015, 47, 783–793. [Google Scholar] [CrossRef]
- Fan, R.; Dong, L. The dynamic analysis and simulation of government subsidy strategies in low-carbon diffusion considering the behavior of heterogeneous agents. Energy Policy 2018, 117, 252–262. [Google Scholar] [CrossRef]
- Hao, H.; Ou, X.; Du, J.; Wang, H.; Ouyang, M. China’s electric vehicle subsidy scheme: Rationale and impacts. Energy Policy 2014, 73, 722–732. [Google Scholar] [CrossRef]
- Li, Z.; Liao, G.; Wang, Z.; Huang, Z. Green loan and subsidy for promoting clean production innovation. J. Clean. Prod. 2018, 187, 421–431. [Google Scholar] [CrossRef]
- Zambrano-Gutiérrez, J.C.; Nicholson-Crotty, S.; Carley, S.; Siddiki, S. The Role of Public Policy in Technology Diffusion: The Case of Plug-in Electric Vehicles. Environ. Sci. Technol. 2018, 52, 10914–10922. [Google Scholar] [CrossRef]
- Kim, W.; Lee, J.-D. Measuring the Role of Technology-Push and Demand-Pull in the Dynamic Development of the Semiconductor Industry: The Case of the Global DRAM Market. J. Appl. Econ. 2009, 12, 83–108. [Google Scholar] [CrossRef]
- Kern, F.; Rogge, K.S.; Howlett, M. Policy mixes for sustainability transitions: New approaches and insights through bridging innovation and policy studies. Res. Policy 2019, 48, 103832. [Google Scholar] [CrossRef]
- Sen, N. Innovation chain and CSIR. Curr. Sci. 2003, 85, 570–574. [Google Scholar]
- Chi, K.X.; Wang, S.Q.; Li, X.Y. Research on scientific and technological innovation policy of small and medium-sized enterprises under the background of high-quality development—Taking the policy environment of Shandong province as a typical example to conduct the integration mode analysis of content analysis. Sci. Sci. Manag. S. T. 2024, 4, 40–53. (In Chinese) [Google Scholar] [CrossRef]
- Xu, Y.; Bi, M.X.; Cai, Y. Research on Enhancing Innovation Efficiency in Key Technology Sectors through Digital-Physical Integration: An Examination Based on Data from Chinese A-share Listed Companies. Sci. Res. Manag. 2024, 1–18. Available online: http://kns.cnki.net/kcms/detail/11.1567.G3.20241226.1147.002.html (accessed on 20 May 2025). (In Chinese).
- Zhao, M.; Sun, T.; Feng, Q. Capital allocation efficiency, technological innovation and vehicle carbon emissions: Evidence from a panel threshold model of Chinese new energy vehicles enterprises. Sci. Total Environ. 2021, 784, 147104. [Google Scholar] [CrossRef] [PubMed]
- Gallardo-Gallardo, E.; Thunnissen, M. Standing on the shoulders of giants? A critical review of empirical talent management research. Empl. Relat. 2016, 38, 31–56. [Google Scholar] [CrossRef]
- Cohen, W.M.; Levinthal, D.A. Absorptive Capacity: A New Perspective- on Learning and Innovation *. Administrative science quarterly. 1990, 35, 128–152. [Google Scholar] [CrossRef]
- Farndale, E.; Beamond, M.; Corbett-Etchevers, I.; Xu, S. Accessing host country national talent in emerging economies: A resource perspective review and future research agenda. J. World Bus. 2022, 57, 101256. [Google Scholar] [CrossRef]
- Malik, A.; Srikanth, N.R.; Silva, M.T.T.D.; Budhwar, P. Elevating talents’ experience through innovative artificial intelligence-mediated knowledge sharing: Evidence from an IT-multinational enterprise. J. Int. Manag. 2021, 27, 100871. [Google Scholar] [CrossRef]
- Zhao, C.; Wang, K.; Dong, X.; Dong, K. Is smart transportation associated with reduced carbon emissions? The case of China. Energy Econ. 2022, 105, 105715. [Google Scholar] [CrossRef]
- Zhao, C.; Jia, R.; Dong, K. How does smart transportation technology promote green total factor productivity? The case of China. Res. Transp. Econ. 2023, 101, 101353. [Google Scholar] [CrossRef]
- Dong, K.; Jia, R.; Zhao, C.; Wang, K. Can smart transportation inhibit carbon lock-in? The case of China. Transp. Policy 2023, 142, 59–69. [Google Scholar] [CrossRef]
- Ren, S.; Li, L.; Han, Y.; Hao, Y.; Wu, H. The emerging driving force of inclusive green growth: Does digital economy agglomeration work? Bus. Strategy Environ. 2022, 31, 1656–1678. [Google Scholar] [CrossRef]
- Xue, Y.; Tang, C.; Wu, H.; Liu, J.; Hao, Y. The emerging driving force of energy consumption in China: Does digital economy development matter? Energy Policy 2022, 165, 112997. [Google Scholar] [CrossRef]
- Melliger, M.; Lilliestam, J. Effects of coordinating support policy changes on renewable power investor choices in Europe. Energy Policy 2021, 148, 111993. [Google Scholar] [CrossRef]
- Zhang, X. Incentive policies from 2006 to 2016 and new energy vehicle adoption in 2010–2020 in China. Renew. Sustain. Energy Rev. 2017, 70, 24–43. [Google Scholar] [CrossRef]
- Wallner, H.P. Towards sustainable development of industry: Networking, complexity and eco-clusters. J. Clean. Prod. 1999, 7, 49–58. [Google Scholar] [CrossRef]
- Jian, X.; Du, D.; Liang, D. Scale or effectiveness? The nonlinear impact of talent agglomeration on high-quality economic development in China. Heliyon 2024, 10, e30121. [Google Scholar] [CrossRef]
- Liu, Q.; Chen, R.; Yu, Q. Improving sustainable performance of China’s new energy industry through collaborative innovation network resilience. Renew. Sustain. Energy Rev. 2024, 201, 114625. [Google Scholar] [CrossRef]
- Du, Z.-Y.; Wang, Q. Digital infrastructure and innovation: Digital divide or digital dividend? J. Innov. Knowl. 2024, 9, 100542. [Google Scholar] [CrossRef]
- Liu, B.; Wang, Y.; Jiang, N.; Zhang, X. The impact of digital industrialization and industrial digitalization on regional green innovation efficiency in China—From the perspective of the innovation value chain. J Clean. Prod 2024, 478, 144015. [Google Scholar] [CrossRef]
- Hao, X.; Liang, Y.; Yang, C.; Wu, H.; Hao, Y. Can Industrial Digitalization Promote Regional Green Technology Innovation? J. Innov. Knowl. 2024, 9, 100463. [Google Scholar] [CrossRef]
- Yang, T.; Xing, C.; Li, X. Evaluation and analysis of new-energy vehicle industry policies in the context of technical innovation in China. J. Clean. Prod. 2021, 281, 125126. [Google Scholar] [CrossRef]
- Cao, L.; Deng, F.; Zhuo, C.; Jiang, Y.; Li, Z.; Xu, H. Spatial distribution patterns and influencing factors of China’s new energy vehicle industry. J. Clean. Prod. 2022, 379, 134641. [Google Scholar] [CrossRef]
- Xu, X.L.; Chen, H.H. Exploring the innovation efficiency of new energy vehicle enterprises in China. Clean Technol. Environ. Policy 2020, 22, 1671–1685. [Google Scholar] [CrossRef]
- Martínez-Ferrero, J.; Frías-Aceituno, J.V. Relationship Between Sustainable Development and Financial Performance: International Empirical Research. Bus. Strategy Environ. 2015, 24, 20–39. [Google Scholar] [CrossRef]
- Zhou, G.; Liu, L.; Luo, S. Sustainable development, ESG performance and company market value: Mediating effect of financial performance. Bus. Strategy Environ. 2022, 31, 3371–3387. [Google Scholar] [CrossRef]
- Feng, J.; Goodell, J.W.; Shen, D. ESG rating and stock price crash risk: Evidence from China. Financ. Res. Lett. 2022, 46, 102476. [Google Scholar] [CrossRef]
- Dou, Q.; Gao, X. How does the digital transformation of corporates affect green technology innovation? An empirical study from the perspective of asymmetric effects and structural breakpoints. J. Clean. Prod. 2023, 428, 139245. [Google Scholar] [CrossRef]
- Satı, Z.E. Comparison of the criteria affecting the digital innovation performance of the European Union (EU) member and candidate countries with the entropy weight-TOPSIS method and investigation of its importance for SMEs. Technol. Forecast. Soc. Chang. 2024, 200, 123094. [Google Scholar] [CrossRef]
- Rothwell, R.O.Y.; Zegveld, W. An assessment of government innovation policies. Rev. Policy Res. 1984, 3, 436–444. [Google Scholar] [CrossRef]
- Yi, L.; Xuan, Z.; Wei, Y. Research on the Fusion Effect of Traditional Manufacturing Industrial Chain and Innovation Chain Driven by Digital Economy: Empirical Evidence from 31 Chinese Provinces. Zhejiang Soc. Sci. 2023, 156, 4–14. [Google Scholar] [CrossRef]
- Chen, Q.; Wang, T. Government support; talent, coupling of innovation chain and capital chain: Empirical analysis in integrated circuit enterprises. Chin. Manag. Stud. 2022, 17, 883–905. [Google Scholar] [CrossRef]
- Zhang, T.; Li, N. Measuring digital economy: From the perspective of digital industrialization and industry digitalization. Procedia Comput. Sci. 2023, 221, 1006–1012. [Google Scholar] [CrossRef]
- Zhang, Q.; Wu, P.; Li, R.; Chen, A. Digital transformation and economic growth Efficiency improvement in the Digital media era: Digitalization of industry or Digital industrialization? Int. Rev. Econ. Financ. 2024, 92, 667–677. [Google Scholar] [CrossRef]
- Gu, R.; Li, C.; Yang, Y.; Zhang, J. The impact of industrial digital transformation on green development efficiency considering the threshold effect of regional collaborative innovation: Evidence from the Beijing-Tianjin-Hebei urban agglomeration in China. J. Clean. Prod. 2023, 420, 138345. [Google Scholar] [CrossRef]
- Wang, L.; Chen, Q.; Dong, Z.; Cheng, L. The role of industrial intelligence in peaking carbon emissions in China. Technol. Forecast. Soc. Chang. 2024, 199, 123005. [Google Scholar] [CrossRef]
- Barker, J.M.; Hofer, C.; Hoberg, K.; Eroglu, C. Supplier inventory leanness and financial performance. J. Oper. Manag. 2022, 68, 385–407. [Google Scholar] [CrossRef]
- Liu, Q.; Wen, X.; Peng, H.; Cao, Q. Key technology breakthrough in new energy vehicles: Configuration path evolution from innovative ecosystem perspective. J. Clean. Prod. 2023, 423, 138635. [Google Scholar] [CrossRef]
- Cai, H.; Huang, Y. Corporate social responsibility on trade credit financing capacity: Facilitation or inhibition? Financ. Res. Lett. 2024, 69, 106073. [Google Scholar] [CrossRef]
- Allred, B.B.; Park, W.G. The influence of patent protection on firm innovation investment in manufacturing industries. J. Int. Manag. 2007, 13, 91–109. [Google Scholar] [CrossRef]
- Ge, G.; Xiao, X.; Li, Z.; Dai, Q. Does ESG Performance Promote High-Quality Development of Enterprises in China? The Mediating Role of Innovation Input. Sustainability 2022, 14, 3843. [Google Scholar] [CrossRef]
- Brouwer, E.; Kleinknecht, A. Innovative output, and a firm’s propensity to patent: An exploration of CIS micro data. Res. Policy 1999, 28, 615–624. [Google Scholar] [CrossRef]
- Guo, B.; Feng, Y.; Lin, J. Digital inclusive finance and digital transformation of enterprises. Financ. Res. Lett. 2023, 57, 104270. [Google Scholar] [CrossRef]
- Li, T.; Li, Y.; An, D.; Han, Y.; Xu, S.; Lu, Z.; Crittenden, J. Mining of the association rules between industrialization level and air quality to inform high-quality development in China. J. Environ. Manag. 2019, 246, 564–574. [Google Scholar] [CrossRef] [PubMed]
- Song, C.; Liu, Z.; Yuan, M.; Zhao, C. From text to effectiveness: Quantifying green industrial policies in China. J. Clean. Prod. 2024, 446, 141445. [Google Scholar] [CrossRef]
- Tazibt, A.A.; Aoughlis, F. Latent Dirichlet allocation-based temporal summarization. Int. J. Web Inf. Syst. 2019, 15, 83–102. [Google Scholar] [CrossRef]
- Mimno, D.; Wallach, H.; Talley, E.; Leenders, M.; McCallum, A. Optimizing Semantic Coherence in Topic Models. In Proceedings of the 2011 Conference on Empirical Methods in Natural Language Processing, Edinburgh, UK, 27–29 July 2011; pp. 262–272. [Google Scholar]
- Caliskan, A.; Bryson, J.J.; Narayanan, A. Semantics derived automatically from language corpora contain human-like biases. Science 2017, 356, 183–186. [Google Scholar] [CrossRef]
- Mikolov, T.; Chen, K.; Corrado, G.; Dean, J. Efficient estimation of word representations in vector space. arXiv 2013, arXiv:1301.3781. [Google Scholar]
- Garcia-Castro, R.; Ariño, M.A. A general approach to panel data set-theoretic research. J. Adv. Manag. Sci. Inf. Syst. 2016, 2, 526. [Google Scholar] [CrossRef]
- Dul, J. Necessary Condition Analysis (NCA): Logic and Methodology of “Necessary but Not Sufficient” Causality. Organ. Res. Methods 2016, 19, 10–52. [Google Scholar] [CrossRef]
- Vis, B.; Dul, J. Analyzing Relationships of Necessity Not Just in Kind But Also in Degree: Complementing fsQCA With NCA. Sociol. Methods Res. 2018, 47, 872–899. [Google Scholar] [CrossRef]
- Guedes, M.J.; da Conceição Gonçalves, V.; Soares, N.; Valente, M. UK evidence for the determinants of R&D intensity from a panel fsQCA. J. Bus. Res. 2016, 69, 5431–5436. [Google Scholar]
- Schneider, C.Q.; Wagemann, C. Set-Theoretic Methods for the Social Sciences: A Guide to Qualitative Comparative Analysis; Cambridge University Press: Cambridge, UK, 2012. [Google Scholar]
- Wang, X.; Huang, L.; Daim, T.; Li, X.; Li, Z. Evaluation of China’s new energy vehicle policy texts with quantitative and qualitative analysis. Technol. Soc. 2021, 67, 101770. [Google Scholar] [CrossRef]
- Dul, J.; van der Laan, E.; Kuik, R. A Statistical Significance Test for Necessary Condition Analysis. Organ. Res. Methods 2020, 23, 385–395. [Google Scholar] [CrossRef]
- Xu, Z.; Li, Y.; Li, F. Electric vehicle supply chain under dual-credit and subsidy policies: Technology innovation, infrastructure construction and coordination. Energy Policy 2024, 195, 114339. [Google Scholar] [CrossRef]
- Hu, S.; Liu, Z.; Tan, Y.; Cheng, X.; Chen, Z.; Long, Z. The status quo and future trends of new energy vehicle power batteries in China—Analysis from policy perspective. Energy Rep. 2022, 8, 63–80. [Google Scholar] [CrossRef]
- Qin, S.; Xiong, Y. Differences in the innovation effectiveness of China’s new energy vehicle industry policies: A comparison of subsidized and non-subsidized policies. Energy 2024, 304, 132151. [Google Scholar] [CrossRef]
- Chen, Y.; Ni, L.; Liu, K. Innovation efficiency and technology heterogeneity within China’s new energy vehicle industry: A two-stage NSBM approach embedded in a three-hierarchy meta-frontier framework. Energy Policy 2022, 161, 112708. [Google Scholar] [CrossRef]
- Cai, L.; Gao, X.; Ling, Y.; Kellermanns, F.W. Governments’ new policy frequency and firms’ performance in an emerging industry: The difference between family and non-family firms. Int. Entrep. Manag. J. 2023, 19, 1707–1737. [Google Scholar] [CrossRef]

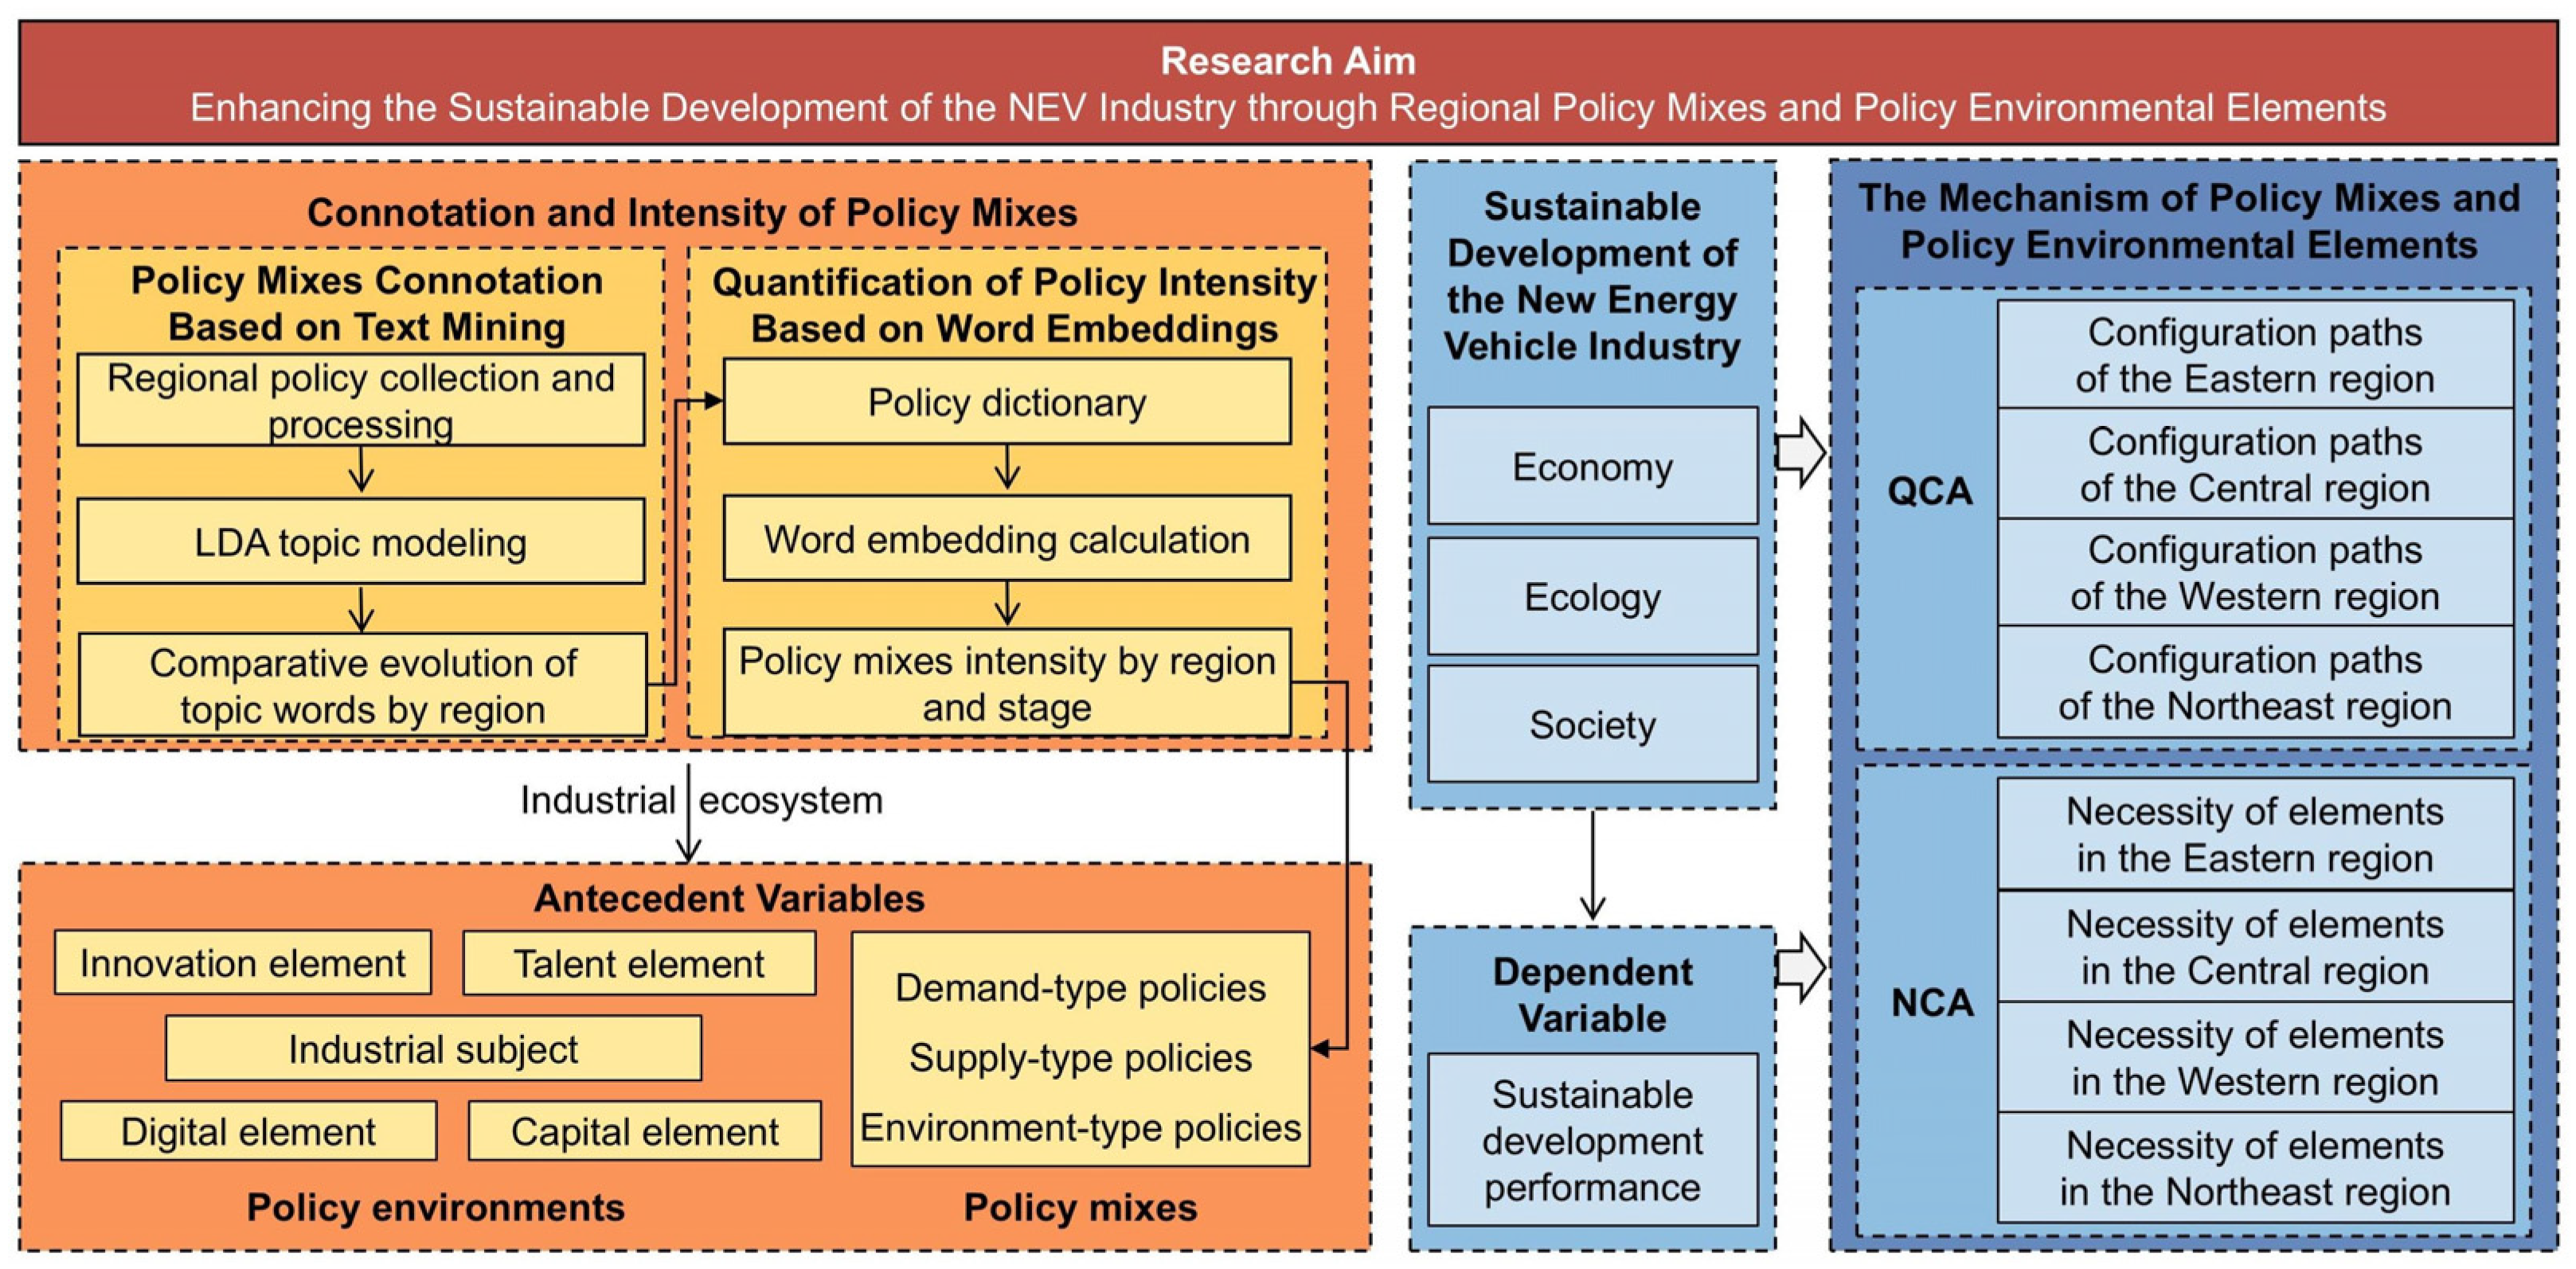

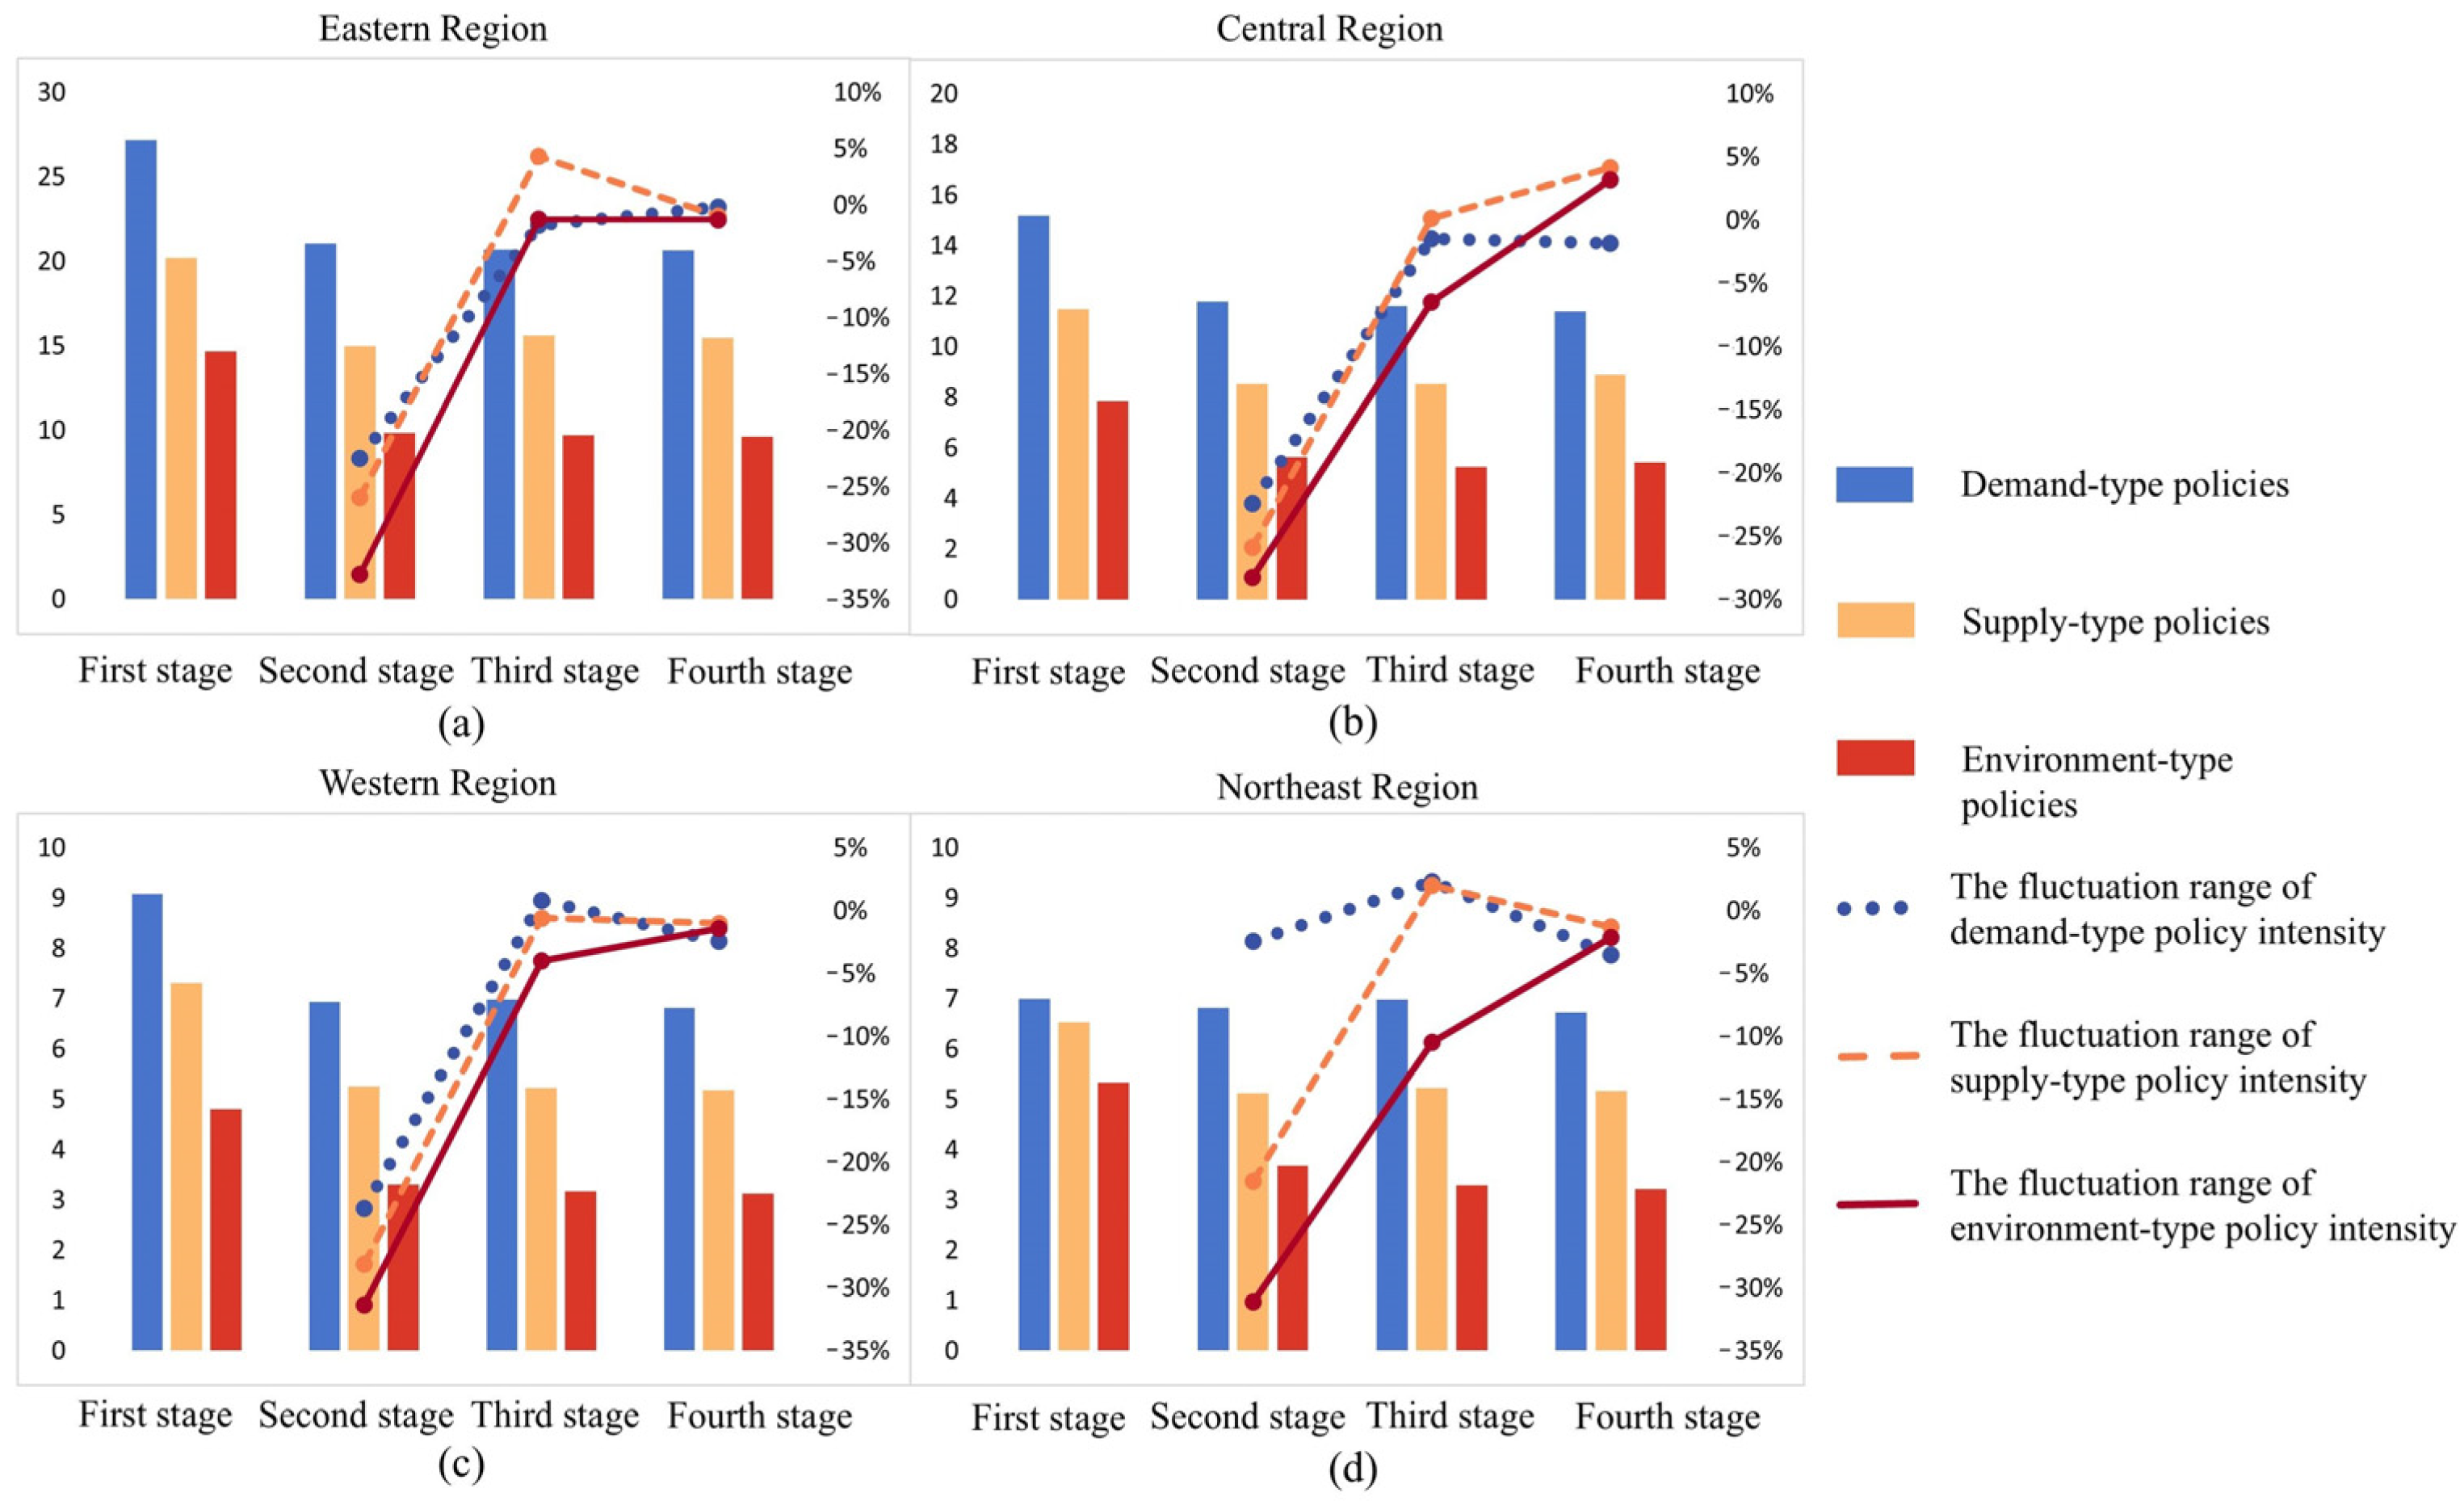
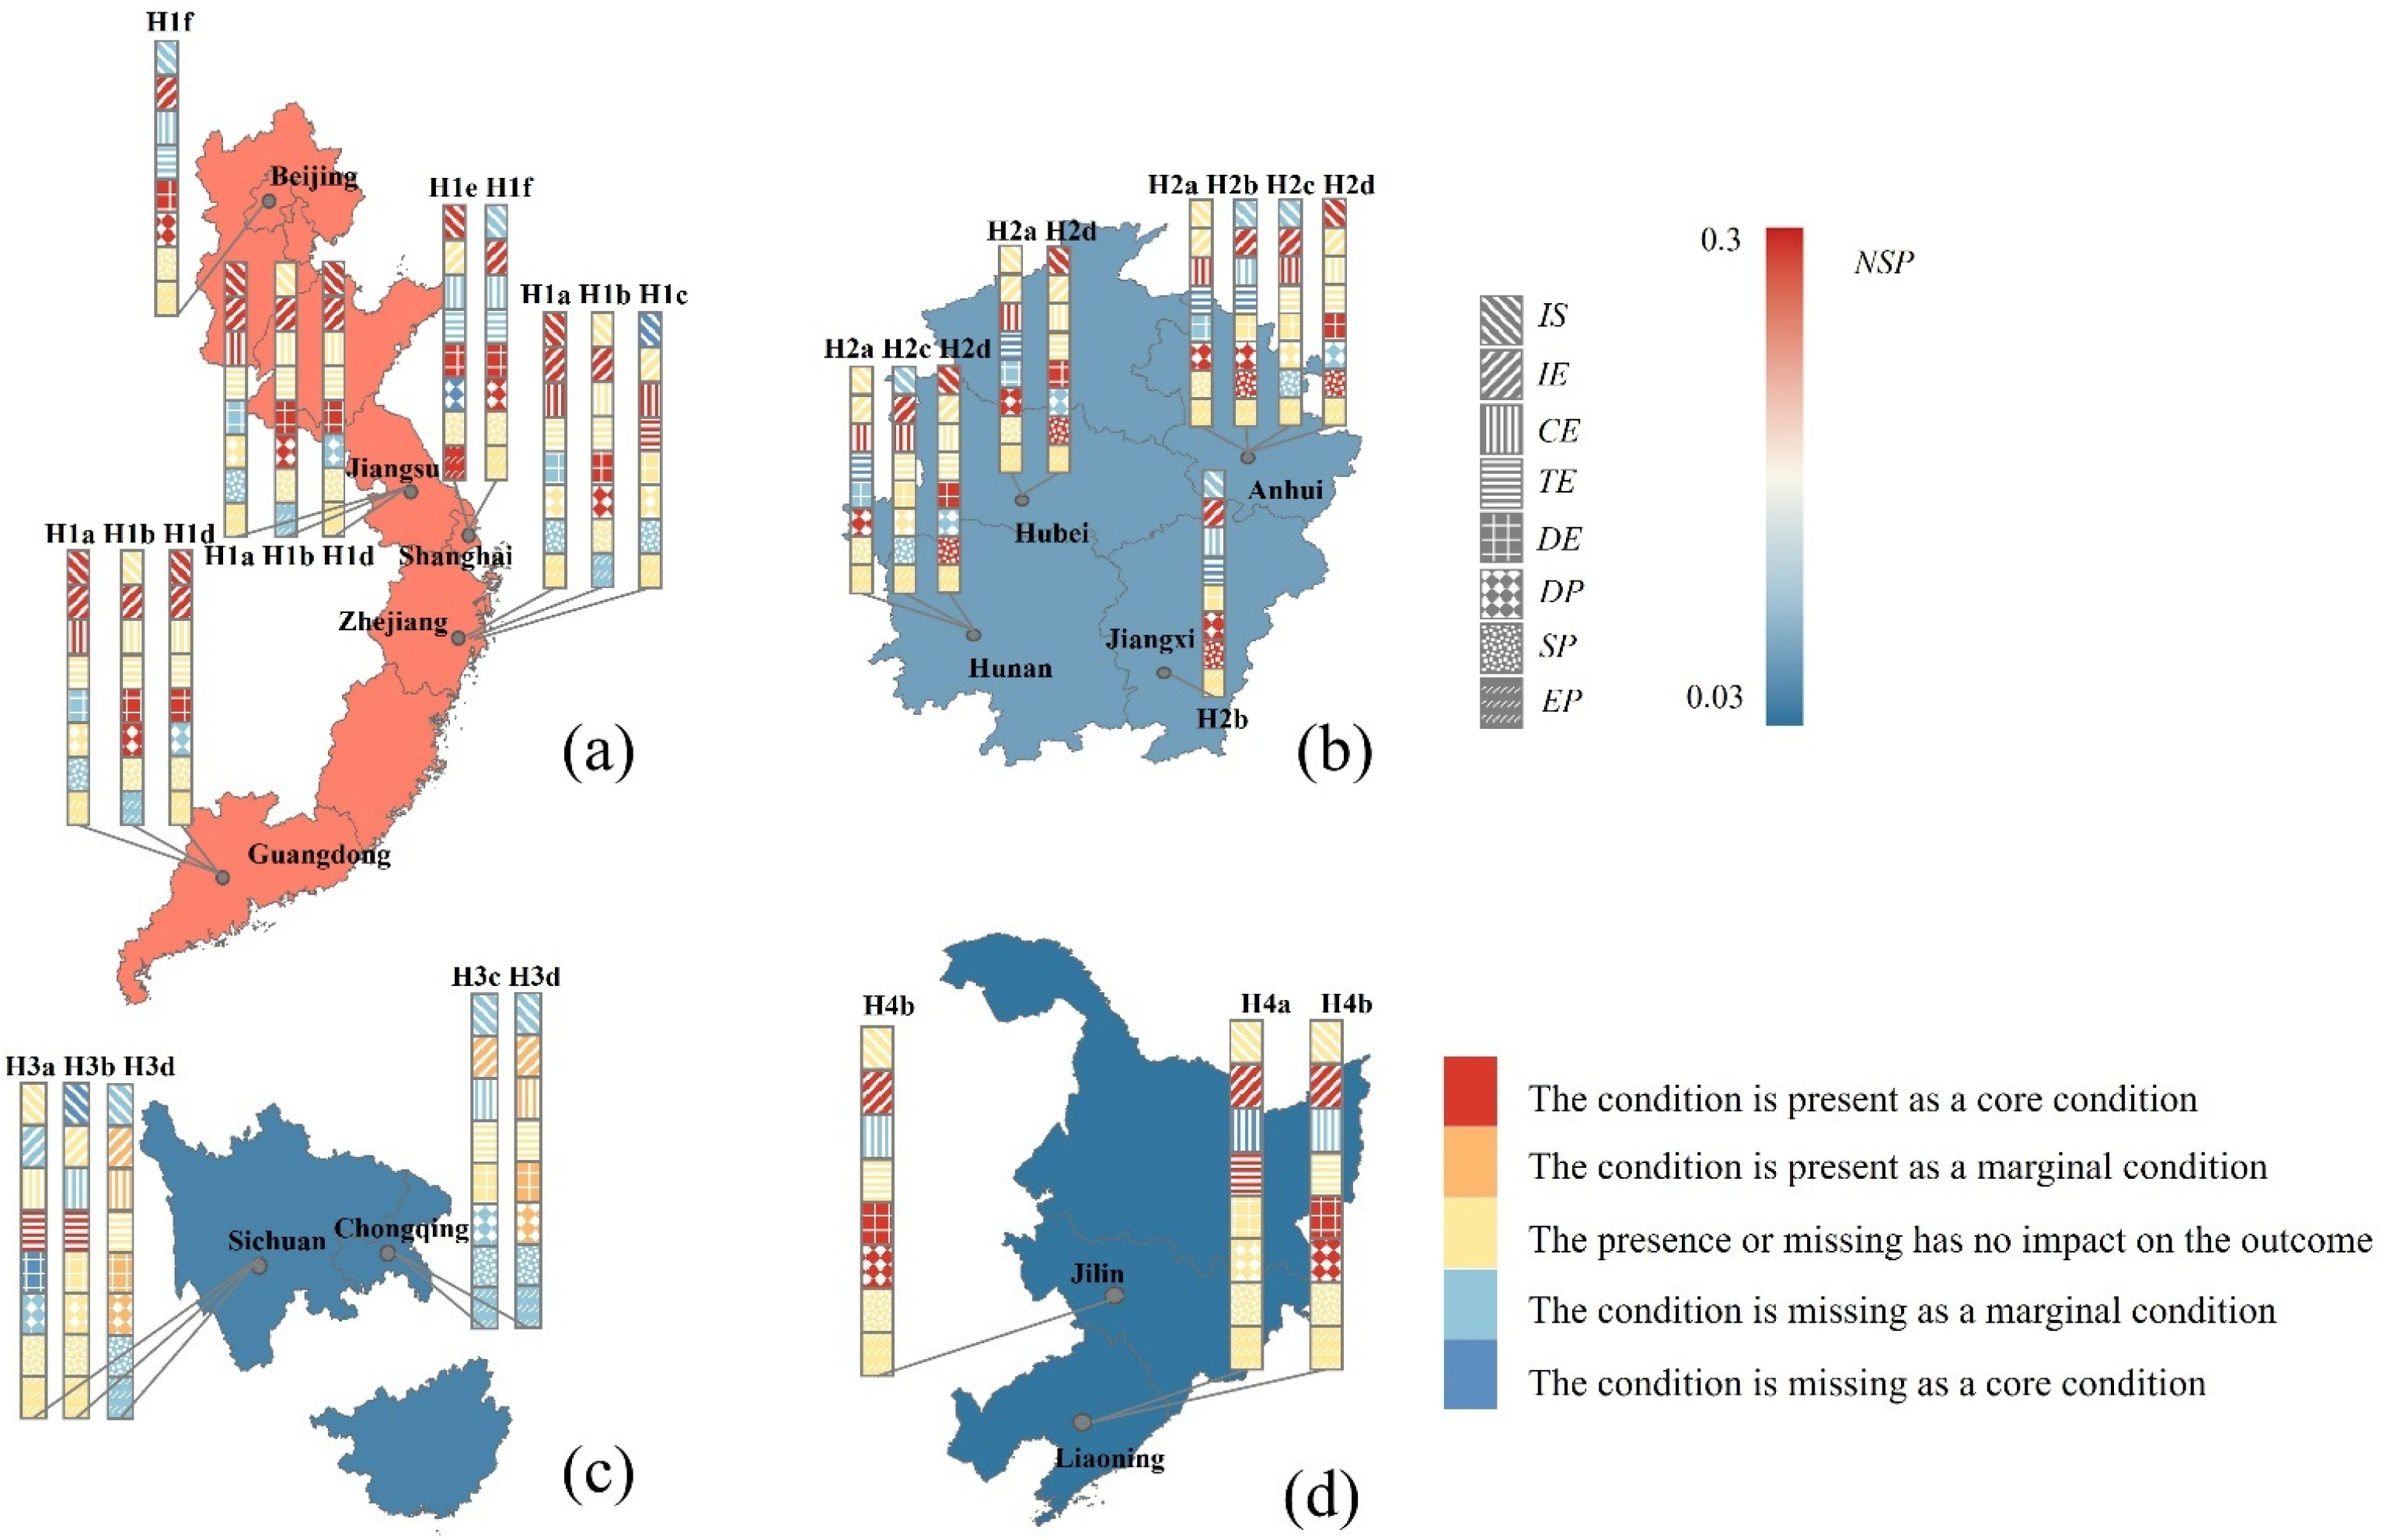

Disclaimer/Publisher’s Note: The statements, opinions and data contained in all publications are solely those of the individual author(s) and contributor(s) and not of MDPI and/or the editor(s). MDPI and/or the editor(s) disclaim responsibility for any injury to people or property resulting from any ideas, methods, instructions or products referred to in the content. |
© 2025 by the authors. Licensee MDPI, Basel, Switzerland. This article is an open access article distributed under the terms and conditions of the Creative Commons Attribution (CC BY) license (https://creativecommons.org/licenses/by/4.0/).