Abstract
The COVID-19 pandemic caused major disruptions to worldwide financial markets, which resulted in market instability and unpredictability. South Korean investors used sector-specific exchange-traded funds (ETFs) to handle the market challenges. This research examines the connection between COVID-19 statistics, including total confirmed cases and deaths, and Korean sector ETF market performance. The research uses the ARIMAX model to evaluate how external variables affect ETF price volatility. The research uses Granger causality tests to determine the direction of relationships between pandemic metrics and sectoral performance, while K-means clustering identifies patterns across different sectors. The analysis reveals significant statistical connections between pandemic disruptions and three sectors, including communication services, healthcare, and IT. The research shows that COVID-19 metrics strongly affected the performance of sector-specific ETFs throughout the analyzed time period. The research establishes a basis for additional studies about external shock effects on financial instruments and delivers valuable information to investors and policymakers who need to manage global crisis risks.
1. Introduction
The COVID-19 pandemic brought unexpected uncertainty and market instability that transformed global financial markets worldwide. Investors chose financial instruments that provided liquidity while offering diversification and transparency because of government-imposed lockdowns and disrupted supply chains. So et al. (2021) [1] note that exchange-traded funds (ETFs) became increasingly popular because of their built-in advantages that proved essential in times of market distress. Korean investors started using sector-specific ETFs as their preferred investment tool because these funds enabled them to protect against market risks while benefiting from pandemic-induced changes in sector performance.
The sector ETF structure allows investors to choose stocks from particular industries to profit from sectors that will perform better or worse based on economic conditions. The pandemic brought unanticipated economic factors through lockdowns and large fiscal measures and consumer behavior changes, which disrupted traditional performance drivers. The pandemic-generated factors completely transformed how different sectors performed, so their responses became highly varied according to Lamba et al. (2024) [2] and Hong et al. (2022) [3]. Research by Liang et al. (2023) [4] shows that Korean sector ETFs needed detailed analysis to study their responses to pandemic-related shocks. Building on pandemic-related themes, Choi and Kim (2022) [5] examined how mask-related sentiment, quantified via a text-mined theme sentiment index (TSI), causally influenced abnormal returns in thematic stocks, revealing key stocks and networked market anomalies.
Despite the growing literature on pandemic-related market effects, most existing studies focus on global markets or broad-based indices (e.g., S&P 500 and MSCI World). However, there remains a notable gap in the empirical investigation of how sector-specific ETFs in emerging markets—such as South Korea—respond to exogenous shocks like COVID-19. Prior studies have largely overlooked the sectoral heterogeneity and temporal dynamics embedded in Korean ETF performance during crisis periods.
To address this research gap, the present study investigates the causal impact of COVID-19 severity indicators—specifically, the number of confirmed cases and deaths—on the volatility of Korean sector ETFs. We pose the following core research questions:
- Did pandemic severity (in terms of case and death counts) Granger-cause volatility in Korean sector ETFs during the COVID-19 period?
- Which sectors exhibited the strongest sensitivity to pandemic indicators, and how did these sensitivities evolve over time?
By answering these questions, we aim to provide a more nuanced understanding of external shock transmission mechanisms in the Korean financial market at a sectoral level.
There has been extensive study on financial markets in the COVID-19 pandemic, but researchers have paid little attention to its effects on Korean sector-specific ETFs. This research fills a knowledge gap through advanced econometric methods to analyze how pandemic-related variables affect Korean sector ETFs. The AutoRegressive Integrated Moving Average with Explanatory Variables (ARIMAX) model allows researchers to analyze external factors that affect sector ETFs while maintaining their natural time series properties. Specifically, cumulative confirmed cases and deaths were selected as COVID-19-related variables due to their direct reflection of pandemic severity and economic impact, effectively capturing the market sentiment during the crisis. The research uses Granger causality tests to determine if COVID-19 variables predict future ETF performance levels. The K-means clustering technique enhances analysis by sorting sector ETFs based on their response patterns, which reveals distinct patterns between different sectors.
The research structure begins with Section 2, examining the current studies about COVID-19’s effects on financial markets together with ETFs. Section 3 describes the methodology, which includes ARIMAX modeling and Granger causality testing alongside K-means clustering analysis. Section 4 reveals the empirical findings together with their implications, before Section 5 delivers the final recommendations for future studies.
The research analyzes Korean sector ETF performance during the COVID-19 pandemic to explain sectoral market behavior during worldwide crises. The research provides investors and policymakers with practical guidance for handling markets under substantial uncertainty and volatility.
2. Literature Review
Global financial markets faced an unprecedented crisis during the COVID-19 pandemic. Zhang et al. (2020) [6] analyzed both country-level and system-wide financial risks and emphasized the role of emergency monetary policy measures—such as zero-interest-rate policies and quantitative easing—in reducing the economic impact. Shehzad et al. (2020) [7], using asymmetric GARCH models for the U.S. and Japan, demonstrated that market volatility during the pandemic exceeded the levels observed during the 2007–2008 global financial crisis. Boubaker et al. (2023) [8] further corroborated this, noting that COVID-19 produced a deeper financial crisis than the GFC, with major global indices recording historic one-day declines. Similarly, Bouazizi et al. (2024) [9] highlighted how the pandemic-induced volatility resembled that of earlier crises and triggered an immediate oil market disruption through simultaneous demand collapse and supply chain breakdowns.
The pandemic’s impact was not uniform across sectors. Mazur et al. (2021) [10] found that while sectors such as natural gas, food, healthcare, and software experienced gains during the March 2020 crash, industries like oil, real estate, entertainment, and hospitality suffered substantial losses. These disparities were attributed to the rapid adoption of remote work and increased demand for healthcare services, which disproportionately benefited the technology and medical sectors. Apergis et al. (2023) [11] described COVID-19 as a multidimensional disruption affecting firms and markets asymmetrically through liquidity constraints, earnings dispersion, and risk premia. Izzeldin et al. (2021) [12] similarly documented pronounced sectoral heterogeneity in G7 economies, with travel- and health-related industries most affected, while digital and technology sectors showed relative resilience. In parallel, Hartzmark and Sussman (2020) [13] reported that ESG-focused ETFs and stocks outperformed the broader market, offering higher returns and lower volatility, as investors gravitated toward more sustainable and less risky assets.
Additional studies have further emphasized the heterogeneity in sector-level responses. Baek et al. (2020) [14] conducted an industry-level volatility analysis using U.S. stock market data and confirmed that COVID-19 shocks led to uneven volatility spikes across sectors, with finance, real estate, and energy among the most adversely affected.
Nguyen (2022) [15] focused on the first ten weeks of the pandemic in 2020, revealing that stock returns across global sectors responded significantly to early outbreak dynamics, with healthcare and consumer goods sectors showing resilience compared to sectors like transportation and energy. These findings support the argument that sectoral characteristics and exposure to real economy disruptions critically determine performance under pandemic conditions.
Abudy et al. (2024) [16] examined investor behavior and financial advice in the context of regulatory changes and found that market participants actively adapt their strategies to align with evolving constraints and information environments. While not directly focused on COVID-19, this study reinforces the broader behavioral mechanisms through which exogenous shocks—such as a pandemic—may alter financial decision-making at both institutional and individual levels.
The pandemic also altered ETF investment behavior and flows. Yousefi and Najand (2022) [17] found that investors rapidly shifted U.S.-listed ETF allocations based on changes in regional COVID-19 infection patterns, highlighting real-time portfolio rebalancing based on geographic exposure. Cincinelli et al. (2022) [18] employed Granger causality analysis in the Chinese market to show a clear temporal linkage between pandemic events and ETF market movements. Sector-based ETF behavior varied markedly, as shown by Naeem et al. (2023) [19], who observed that U.S. oil ETFs transmitted crisis-related risks, while gold and natural gas ETFs served as safe havens.
Complementing these findings, recent research has turned to more sophisticated time series and causal techniques to better capture the evolving dynamics of crisis periods. Cooray et al. (2023) [20] introduced a time-varying Granger causality framework to analyze changing volatility relationships across time, while Ren et al. (2024) [21] used a similar approach to link global supply chain pressures with the performance of Chinese resource industries. Ullah et al. (2023) [22] confirmed that rising case and death counts increased market volatility in both developed and emerging markets. Zhu & Song (2024) [23], applying an extended ARJI model, highlighted the role of pandemic indicators in amplifying abrupt price jumps across global financial markets.
Despite this growing body of literature, the Korean sector ETF market remains notably underexplored. As a dynamic emerging economy with a robust ETF ecosystem, Korea presents a valuable but underutilized setting for investigating sectoral responses to global crises. This study addresses that gap by integrating three advanced empirical approaches: (1) the ARIMAX model, which allows for the incorporation of COVID-19-related exogenous variables into ETF return predictions; (2) Granger causality testing, which examines whether pandemic indicators can predict sector ETF performance; and (3) K-means clustering, which enables the structural grouping of ETFs based on their response behavior.
Through this methodological synthesis, the present research contributes a novel empirical framework for analyzing sector ETFs under crisis conditions. Unlike prior studies that primarily document correlations or volatility spillovers, this work focuses on establishing causality, identifying systematic response patterns, and capturing inter-sector dynamics within an underexamined market. In doing so, it provides a theoretically grounded and practically useful toolkit for both academic inquiry and strategic investment decision-making during future global disruptions.
3. Data
This study utilizes two primary datasets: COVID-19 pandemic indicators and sector-specific ETF data from the Korean financial market. These datasets are processed to align their frequency, ensure stationarity, and enable integration into econometric modeling frameworks such as ARIMAX and Granger causality testing.
3.1. COVID-19 Data
The COVID-19 dataset was sourced from the Korea Data Exchange (KDX) and includes two key exogenous variables. The variables are stated in Table 1.

Table 1.
COVID-19 exogeneous variables.
These metrics were collected on a daily basis from 27 February 2020 to 20 April 2023. To synchronize with the financial data and ensure consistency in scale and stationarity, both variables were transformed into 5-day rates of change.
3.2. ETF Data
The ETF dataset comprises 33 Korean sector ETFs retrieved via web crawling from the NAVER Securities platform. These ETFs are grouped under three major products: KODEX (Samsung Asset Management, Seoul, South Korea), TIGER (Mirae Asset Global Investments, Seoul, South Korea), and TIGER200 (also managed by Mirae Asset Global Investments). Each represents a variety of sectors such as Semiconductors, Healthcare, Banking, Construction, and Communication Services. The descriptions are stated in Table 2.

Table 2.
ETF products and sectors.
The ETF prices were originally recorded as daily closing prices, which were then converted into 5-day rate of change returns to ensure stationarity, confirmed by the Augmented Dickey–Fuller (ADF) test. Only return series passing the 5% significance level were used for further modeling. The results are summarized in Table 3.

Table 3.
Stationarity test results (ADF test).
The ADF test results indicate that the daily closing price data yielded a p-value of 0.63, greater than the 5% significance level. This leads to a failure to reject the null hypothesis, suggesting that the daily closing price data is non-stationary. In contrast, the 5-day rate of change data produced a p-value of 0.00, which is below the 5% threshold. This allows us to reject the null hypothesis, indicating that the 5-day rate of change data is stationary.
Based on these findings, the 5-day rate of change data was deemed stationary and was used for subsequent analyses. Similarly, COVID-19 data for confirmed cases and deaths were converted into 5-day rates of change to align with the ETF data’s scale and ensure consistency in the analysis.
4. Methodology
The models employed in this study were carefully selected to address the dual requirements of capturing the intrinsic dynamics of time series data and quantifying the influence of external variables. The ARIMAX model is well-suited for this purpose as it extends the traditional ARIMA framework by incorporating exogenous explanatory variables, allowing for the analysis of how external shocks, such as COVID-19-related variables, affect the dependent variable. Complementing this, the Granger causality test is utilized to establish whether these external factors have a predictive relationship with sector ETF performance, providing a deeper understanding of their causative effects. Finally, K-means clustering is employed to identify structural patterns among ETFs based on their response behaviors, enabling a comprehensive view of sectoral distinctions in the financial market’s reaction to the pandemic. These models offer a robust and multifaceted approach to analyzing the dynamic interactions between the pandemic and sector-specific financial products.
4.1. ARIMAX (AutoRegressive Integrated Moving Average with Explanatory Variables)
The ARIMAX model extends the ARIMA framework by incorporating exogenous explanatory variables to improve predictions. Its general form is expressed as follows:
In this formulation, represents the dependent variable at time tt, such as the price or return of a specific ETF. The terms denote the coefficients for the autoregressive (AR) terms, which model the relationship between the dependent variable and its past values up to lag pp. The moving average component is characterized by , which represent the influence of past error terms on the current value of . The exogenous variables, represented as , capture the external factors that influence the dependent variable, and their effects are quantified by the coefficients . Finally, is the error term at time , assumed to follow a white noise process with a mean of zero and constant variance.
By combining these components, the ARIMAX model effectively captures both the internal dynamics of the time series and external influences, making it particularly suitable for analyzing the financial data affected by external shocks such as COVID-19.
4.2. Granger Causality
Granger causality tests whether one time series provides statistically significant information to predict another. To test if a variable Granger-causes , two models are constructed: a restricted model excluding and an unrestricted model including . The restricted model is represented as follows:
where is the dependent variable at time , is the intercept term, are coefficients associated with the lagged values , and is the error term. The unrestricted model includes the predictor and is expressed as follows:
Granger causality captures the predictive relationship by testing the contribution of multiple lagged values of the predictor variable (e.g., ) to the dependent variable. This contrasts with conventional correlation, which typically measures contemporaneous or single-lag associations and thus may fail to detect dynamic dependencies over time.
Here, represents the lagged values of the predictor , and are the coefficients quantifying the contribution of to . The null hypothesis assumes that does not Granger-cause , which is tested by checking if all . The F-test for Granger causality is given as follows:
where and are the residual sum of squares for the restricted and unrestricted models, respectively. The parameter is the number of lags for , pp is the number of lags for , and is the number of observations. If the computed FF-statistic exceeds the critical value, the null hypothesis is rejected, indicating that Granger-causes .
4.3. K-Means Clustering
K-means clustering partitions data points into kk distinct clusters by minimizing the within-cluster sum of squares (WCSS). The algorithm iteratively assigns each data point to the nearest cluster centroid and updates the centroids based on the mean of points assigned to each cluster. The objective function for K-means is as follows:
where represents the total within-cluster variation, is the set of points assigned to cluster , is a data point in cluster , and is the centroid of cluster . The algorithm converges when the change in centroids or the reduction in falls below a predefined threshold.
In this study, sector ETF responses were clustered based on their similarities in reaction to COVID-19-related variables. This analysis provided insights into structural patterns across different sectors, helping to identify groups with similar sensitivities to pandemic-induced shocks.
4.4. Research Blueprint
This study uses the ARIMAX model and Granger causality test to examine the impact of COVID-19-related exogenous variables—expressly, the cumulative number of confirmed cases and deaths—on the price volatility of domestic sector ETFs in Korea. These advanced econometric techniques are used in this research to determine the significance and the causality of pandemic-related factors on the performance of sector-specific financial instruments.
The ARIMAX model is suitable for this analysis because it combines autoregressive and moving average components to capture complex time series patterns while allowing for the inclusion of external variables that may affect the dependent variable, for example, the number of COVID-19 cases and deaths. This allows the model to capture both the intrinsic patterns in the ETF price movements and the larger macroeconomic disruptions caused by the pandemic. The ARIMAX model identifies statistically significant relationships between the pandemic variables and the ETF price dynamics, thus providing useful insights into the sectoral financial instruments’ responses to the COVID-19 induced shocks.
The ARIMAX model is supported by the Granger causality test to ascertain whether the pandemic-related variables are predictors of ETF performance and to distinguish between correlation and causation. This test tests whether past values of COVID-19 data have significant predictive power for ETF price changes over and above what is explained by the ETFs’ own historical data. This is critical for investment strategies and policy making as it shows that these external factors should be considered when responding to market disruptions.
To implement this analysis, the ARIMAX model will estimate the relationship between COVID-19-related variables and ETF price volatility and assess if these variables significantly impacted the stock prices of specific sectors during the pandemic. This will provide detailed evidence of how sectoral financial instruments were affected. Subsequently, the Granger causality test will be used to determine if a predictive relationship exists between COVID-19 variables and sector ETFs. Sectors that have a statistically significant Granger causality will be highlighted, thus showing that the pandemic had a real effect on these financial instruments.
The ARIMAX model and the Granger causality test offer a robust methodological framework for understanding the broader implications of the COVID-19 pandemic on the financial market. This dual approach quantifies the relationships between pandemic-related variables and ETF performance and identifies causal pathways, offering valuable insights for investors and policymakers in anticipating and navigating future global crises. By highlighting the sectors that were most affected by the pandemic, this study helps in better understanding the structural dynamics of financial markets during such periods.
5. Empirical Results
5.1. ARIMAX Analysis
Table 4 presents the ARIMAX model estimation results for various ETF sectors, using two exogenous variables: the number of COVID-19 deaths and confirmed cases. The model parameters were selected based on the lowest AIC and BIC values for each sector. Statistical significance was assessed using a p-value threshold of 0.1, a commonly used weak criterion in econometric studies. The findings highlight specific sectors where the correlation between COVID-19 variables and ETF price volatility is statistically significant, revealing the sectoral dynamics that were shaped by the pandemic’s spread and its associated increase in uncertainty regarding future economic conditions.

Table 4.
ARIMAX model results.
Eight ETF sectors exhibited statistically significant coefficients, indicating that their price volatility was meaningfully affected by the COVID-19 pandemic. The TIGER 200 Communication Services ETF demonstrated the strongest correlation, with a coefficient of for confirmed cases and a 95% confidence interval of . This relationship was both statistically and economically significant, suggesting that fluctuations in the number of confirmed cases strongly influenced price movements in this sector. The spread of the pandemic maximizes uncertainty about future economic conditions. Amid this uncertainty, investors grow concerned about asset value fluctuations, which can be a factor in increasing volatility across financial markets. The COVID-19 pandemic accelerated the huge economic flow of “digital transformation” beyond just the spread of the disease, and the Communication Services sector tends to reflect this market directly. Similarly, the Healthcare sector showed a coefficient of for confirmed cases, with a p-value of , underscoring its sensitivity to pandemic-related disruptions.
Other sectors, such as Banking and Securities, also exhibited significant results. In the Banking sector, the deaths variable had a coefficient of with a p-value of 0.068, reflecting the broader economic implications of COVID-19 mortality on financial markets. The rise in the death toll goes beyond just health indicators and acts as a strong signal of increasing uncertainty in the health of the economy as a whole, as well as the Banking sector and dampening investor sentiment, which can also be interpreted as being sensitively reflected in the movement of the Banking sector, which is at the heart of the financial system. The Securities sector showed a significant relationship with confirmed cases, with a coefficient of and a p-value of , indicating that daily variations in case counts influenced market valuations. These findings suggest that while some sectors benefited from shifts in demand during the pandemic, others were adversely affected by heightened uncertainty and economic strain. This has economic implications: the external shock of the pandemic has had a direct impact on investor sentiment and market movements.
The results also highlight the differentiated effects of the two exogenous variables. Confirmed cases generally exhibited stronger correlations with price volatility, particularly in sectors like Communication Services and Healthcare, which are directly tied to public health and consumer behaviors. Deaths, on the other hand, had a more pronounced impact on sectors like Banking and IT, likely due to their broader economic implications and the heightened risk aversion associated with increased mortality rates. This differentiation underscores the need to consider both leading and lagging pandemic indicators when analyzing market dynamics.
The inclusion of COVID-19 variables in the ARIMAX model improved its fit compared to the ARIMA model in the sectors with significant coefficients. The rejection of the null hypothesis for the exogenous variables confirms their relevance in explaining sector-specific price volatility during the pandemic. This demonstrates the importance of integrating external shocks into econometric models to enhance their explanatory power, especially in periods of global crises.
The findings provide valuable insights for both investors and policymakers. For investors, the identification of sectors with strong correlations to pandemic metrics enables more informed decision-making, offering a basis for portfolio adjustments during uncertain times. For example, sectors like Communication Services and Healthcare, which showed the highest sensitivity to COVID-19 variables, may serve as potential hedges or opportunities for growth. Policymakers can use these insights to design targeted interventions aimed at stabilizing markets and supporting the most affected sectors.
The analysis in Table 4 underscores the heterogeneous effects of the COVID-19 pandemic on financial markets, with significant implications for sector-specific investment strategies and policy measures. By identifying the sectors most affected by pandemic-related shocks, this study advances our understanding of how exogenous variables influence financial markets and provides a framework for responding to future disruptions. The results demonstrate that incorporating exogenous variables into econometric models is essential for capturing the complexities of sectoral dynamics during unprecedented events.
Table 5 builds upon the insights provided in Table 4 by narrowing the focus to sectors with statistically significant results (). It presents detailed metrics, including log likelihood, AIC, BIC, HQIC, regression coefficients, and standard errors for eight ETF sectors, reinforcing the nuanced impact of COVID-19 variables on sector-specific ETF performance.

Table 5.
ARIMAX results (p-value < 0.1).
The results confirm the strong influence of cumulative confirmed cases and deaths on certain sectors. For instance, TIGER200 Communication Services exhibits the strongest correlation with cumulative confirmed cases, with a coefficient of , suggesting a robust relationship between case counts and price volatility. Similarly, KODEX Healthcare, with a coefficient of , underscores the pandemic’s direct impact on health-related financial instruments.
Cumulative deaths also have significant effects, particularly in sectors like TIGER Banking () and TIGER200 IT ). The negative coefficients in these sectors reflect the broader economic repercussions of mortality rates, such as heightened risk aversion and constrained economic activity. Across all sectors, the inclusion of COVID-19 variables significantly improved model fit compared to a standard ARIMA approach, as evidenced by higher log likelihoods and lower AIC/BIC values.
In summary, Table 5 extends the findings of Table 4 by pinpointing sectors where the pandemic’s impact is most pronounced. It confirms that while COVID-19 variables broadly influenced market dynamics, the degree and direction of this impact varied across sectors. These findings provide actionable insights for investors and policymakers seeking to mitigate risks and capitalize on sector-specific opportunities during global crises.
5.2. Granger Causality Analysis
We analyze whether COVID-19-related exogenous variables (number of cases and deaths) have a causal effect on domestic sector ETFs using Granger causality tests. We empirically examine the impact of COVID-19 exogenous variables on domestic sector ETFs over different time windows. To examine the causal relationship between COVID-19-related exogenous variables—specifically, the number of confirmed cases and deaths—and domestic sector ETFs, Granger causality tests were conducted using time windows of 20, 40, 60, and 120 days (Choi & Kim, 2023) [24]. These varying windows were selected to capture short-, medium-, and long-term perspectives on the relationship. The tests were performed independently for each ETF, with the number of COVID-19 deaths and cases as exogenous variables. The F-test was used to calculate p-values for each lag, date, and ETF sector, and the optimal lag was determined based on the lowest p-value. Given that Granger causality relies on regression analysis, sufficient data points were required to construct an accurate regression matrix. To address potential limitations arising from insufficient data, the maximum lag was set at ⌊⌋ for each window size, balancing lag depth with statistical reliability.
The researchers used heatmap visualizations to detect time series bins, which showed Granger causality between COVID-19 exogenous variables and domestic sector ETFs. Figure 1, Figure 2, Figure 3 and Figure 4 show heatmaps of p-values for the optimal lag by window size (20, 40, 60, and 120 days) for the number of cases and deaths. The domestic sector ETFs appear on the y-axis, while the x-axis shows the time series dates from 27 February 2020 to 23 March 2023, at 8-day intervals. The intensity of the blue color reflects the p-value, with darker shades indicating stronger statistical significance. A color bar on the right side of each heatmap provides a visual reference for interpreting these levels. The heatmap figures for each exogenous variables, per window size are plotted in Figure 1, Figure 2, Figure 3, Figure 4, Figure 5, Figure 6, Figure 7 and Figure 8.
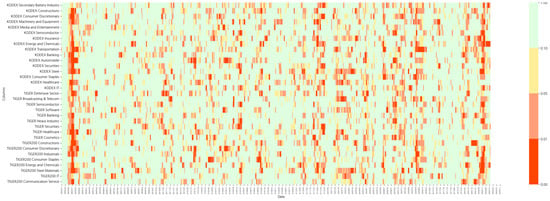
Figure 1.
Heatmap of Granger causality p-values for COVID-19 deaths (window size: 20 days). Note: This heatmap displays the p-values of the Granger causality test between the number of deaths and domestic sector ETFs over 20-day windows. Lower p-values (darker blue) indicate stronger statistical significance.
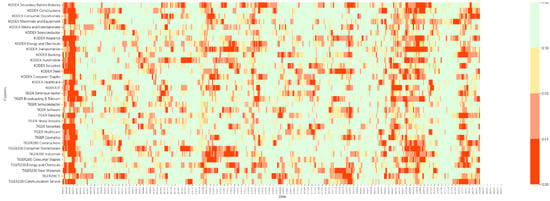
Figure 2.
Heatmap of Granger causality p-values for COVID-19 deaths (window size: 40 days).
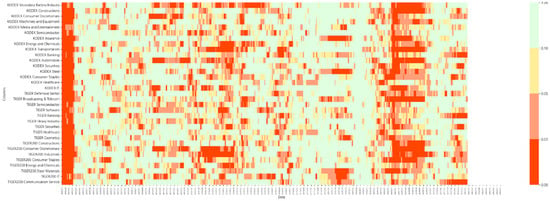
Figure 3.
Heatmap of Granger causality p-values for COVID-19 deaths (window size: 60 days).
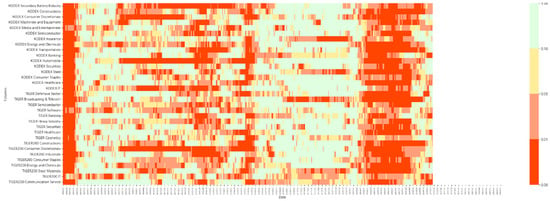
Figure 4.
Heatmap of Granger causality p-values for COVID-19 deaths (window size: 120 days).
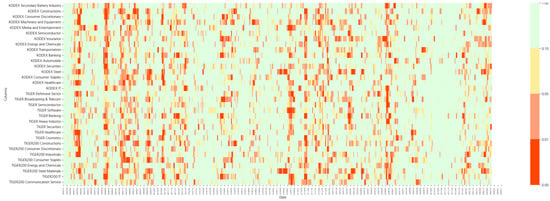
Figure 5.
Heatmap of Granger causality p-values for COVID-19 cases (window size: 20 days).
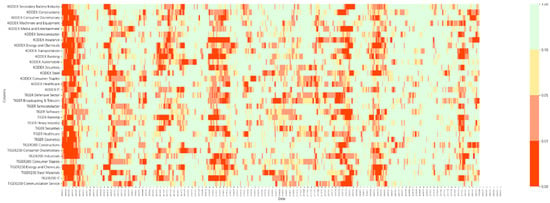
Figure 6.
Heatmap of Granger causality p-values for COVID-19 cases (window size: 40 days).
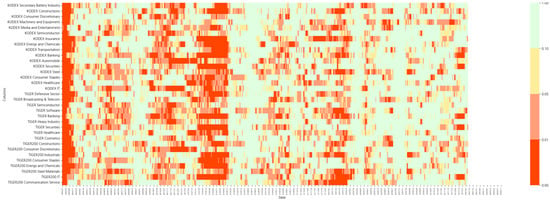
Figure 7.
Heatmap of Granger causality p-values for COVID-19 cases (window size: 60 days).
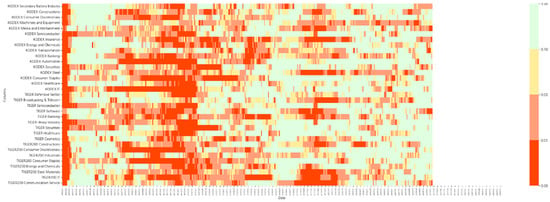
Figure 8.
Heatmap of Granger causality p-values for COVID-19 cases (window size: 120 days).
The research discovers significant connections between COVID-19 variables and ETF performance through different time periods and industry sectors and various time series analyses. During the initial pandemic stage from 27 February 2020 to 25 March 2020, all ETF sectors demonstrated p-values that were low across all window sizes, indicating the widespread and statistically significant impact of COVID-19 deaths on sectoral ETFs at the pandemic’s beginning. The p-values became lower throughout all sectors during the late pandemic phase from 5 April 2022 to 5 October 2022, particularly when applying a 120-day window. The research shows how mortality rates from the pandemic became more important for ETF performance when the crisis entered its late stages.
Longer windows extending up to 120 days consistently yield more time series bins that achieve p-values below the established significance threshold. The analysis indicates that extended time periods detect sustained patterns of external influences better than brief observation periods, which are more affected by short-term market fluctuations. The research demonstrates that selecting appropriate time windows is vital for properly understanding financial market responses to external disruptions. The analysis of temporal patterns allows this study to show the development of external shock effects on financial markets during global crises.
The results demonstrate the case counts’ exogenous variable’s Granger causality relationship with domestic sector ETFs while showing statistical significance in various time windows, ETF sectors, and time series. The p-values in Figure 1, Figure 2, Figure 3 and Figure 4 show a pattern of lower values during the first COVID-19 outbreak phase from 27 February 2020 to 25 March 2020 across various ETF sectors when using windows of 40, 60, and 120 days. The number of coronavirus cases demonstrated a significant influence on ETF sectors throughout the first outbreak period.
The analysis of p-values in the mid-COVID-19 period (1 July 2021 to 30 October 2021) shows consistently lower values throughout sectors, especially when using a 120-day window. The case count variable maintained a statistically significant effect on ETF performance throughout the pandemic’s middle period.
The comparison of window sizes (20, 40, 60, and 120 days) shows that the 120-day window produces the most bins with p-values below the significance threshold. The ability of longer time windows to detect the continuous and cumulative effects of external variables stands in contrast to the sensitivity of short time windows to random fluctuations. These observations underline the importance of selecting an appropriate time frame when analyzing financial market responses to external shocks.
5.3. Clustering Results
K-means clustering was employed to investigate whether sector ETFs, on which COVID-19 exogenous variables demonstrated statistically significant impacts in the ARIMAX model, also frequently recorded bins with significant p-values in the Granger causality test. The clustering results were visualized using a scatter plot to understand the relationships between these variables clearly. Table 6 explains the variables that were used in the scatter plot points in Figure 9.

Table 6.
Description of scatter plot points in Figure 9.
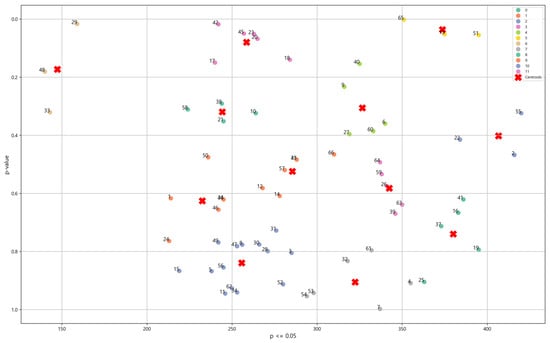
Figure 9.
Scatter plot of K-means clustering: correlation between ARIMAX p-values and Granger causality significance for sector ETFs.
In the scatter plot, the x-axis represents the total number of instances where the p-value of the exogenous variable (number of cases or deaths) was recorded as 0.05 or less in the Granger causality test. The y-axis represents the p-value of the exogenous variable when included in the ARIMAX model for the corresponding sector. Using this setup, K-means clustering was performed to identify groupings of sectors and exogenous variables. Sectors appearing in the upper-right corner of the plot indicate consistently lower p-values in both the ARIMAX model and the Granger causality test, confirming that the exogenous variable had a statistically significant impact on the sector ETFs. This dual significance highlights the strong relationship between the exogenous variable and sector ETF performance.
The optimal number of clusters was determined using the Silhouette Score, a metric for assessing clustering quality. The Silhouette Score is a metric that measures the similarity and dissimilarity of each data point to its own cluster and to all other clusters. The metric value ranges from −1 to +1. A high value means that an object is highly aligned with its own cluster and less aligned with its neighbors.
where is the average distance between data point iii and all other data points within the same cluster and is the average distance between data point iii and all the data points in the nearest other cluster. As a result, the score showed a maximum value when (12 clusters), which is suggested as the optimal number of clusters. The silhouette score results per number of clusters() are stated in Table 7.

Table 7.
Silhouette Score results based on the number of clusters (k).
The K-means clustering analysis revealed that sectors positioned in the upper-right quadrant of the scatter plot were grouped into a single cluster. This cluster underscores the statistically significant impact of exogenous variables on the predictive performance of the ARIMAX model and the outcomes of the Granger causality test. Among the sectors analyzed in the Korean market, three ETFs—TIGER 200 Communication Services (cases), TIGER 200 IT (deaths), and KODEX Insurance (cases)—demonstrated strong and consistent statistical significance. These findings highlight the critical influence of COVID-19-related exogenous variables on sector-specific ETFs in the Korean market, offering valuable insights into their sectoral dynamics during the pandemic.
A review of previous studies on the relationships among the Insurance, IT, and Communication Services sectors in the Korean market further reinforces these findings, revealing that the interactions and linkages between these three sectors were significantly strengthened during the COVID-19 pandemic. Key insights from these studies are summarized below:
The Korean market’s Insurance and Communication Services sectors developed a strong interrelationship, driven by the digital transformation necessitated by the pandemic. According to Dash and Chakraborty (2021) [25], insurers enhanced their digital marketing strategies and increased customer interaction through Communication Services. The transition from traditional face-to-face sales methods to digital marketing platforms—including search engine optimization (SEO), display advertising, and electronic customer relationship management (E-CRM)—positively impacted customer satisfaction and purchase intentions.
Moreover, real-time counseling systems and non-face-to-face contract signing processes were reinforced to improve customer convenience and boost insurance subscription rates. The Communication Services sector supported this transition by providing digital platforms that facilitated seamless interaction between insurance companies and their customers.
The interaction between the Insurance and IT sectors in the Korean market also grew to be significantly more potent. Kim and Han (2022) [26] analyzed the adoption of IT technologies such as artificial intelligence (AI), blockchain, cloud computing, and big data within the Insurance industry. The accelerated digital transformation, catalyzed by the pandemic, led insurers in Korea to increasingly utilize these technologies. Kim (2021) [27] found that the shift to an “untact” (contact-free) culture fostered the integration of IT solutions, enabling insurers to adapt to changing consumer behaviors and streamline their operations effectively.
The IT and Communication Services industries in the Korean market developed a complementary relationship as the demand for non-face-to-face services surged during the pandemic. Lee et al. (2021) [28] noted that the role and importance of the IT service industry became more pronounced across various sectors, such as education (EduTech) and food delivery (FoodTech), as consumers sought remote solutions. These developments were closely tied to advancements in Communication Services, which supported the delivery and expansion of IT-enabled solutions.
These findings collectively demonstrate that the Insurance, IT, and Communication Services sectors in the Korean market not only adapted to the challenges posed by COVID-19, but also leveraged digital transformation and IT integration to strengthen their interdependencies. The increased demand for non-face-to-face services and the active application of IT technologies served as major drivers of this convergence.
In conclusion, the pandemic acted as a catalyst for the integration and development of these sectors in the Korean market, reinforcing their interconnectedness and adaptability in the face of unprecedented challenges. This evolution underscores the pivotal role of digital transformation and technological advancements in shaping the dynamics of these industries.
6. Discussion
The research explores how COVID-19 variables consisting of cumulative confirmed cases and deaths affect volatility in Korean sector ETFs. Our research employed ARIMAX and Granger causality tests and K-means clustering to find that Korean sectors reacted differently to the pandemic. The sectors of Communication Services, Healthcare, IT, and Insurance, together with Banking, showed substantial responses to COVID-19 indicators, which matches expectations because these sectors faced direct pandemic disruptions. Statistical significance needs careful interpretation because numerous findings approached but did not reach traditional p-values of 0.05. The minimal statistical significance of these findings indicates that these associations retain analytical significance, although their real-world effects might require additional interpretation.
While the COVID-19 variables (cumulative confirmed cases and deaths) employed in this study effectively capture the severity and economic impact of the pandemic, inherent limitations remain, associated with potential reporting biases and delays. Such limitations could result in these indicators not fully or immediately reflecting actual shifts in investor sentiment or sector-specific market dynamics. Future research could mitigate this limitation by employing real-time data adjustments or alternative measures that may more accurately and swiftly represent market responses.
The identified sectoral sensitivities in Korea demonstrate parallel patterns with global findings presented in earlier pandemic impact studies (Mazur et al., 2021; Izzeldin et al., 2021) [9,11]. The Healthcare, IT, and Communication Services sectors displayed similar international vulnerabilities and resilience because they adapted to contactless technology demands and healthcare needs during COVID-19 according to Mazur et al. (2021) [9]. The Banking and Insurance sectors faced elevated market volatility because of economic instability and risk-averse investor behavior, which matches international patterns, as documented by Shehzad et al. (2020) [6]. The research confirms natural assumptions about market behavior but does not establish fresh theoretical problems or unusual anomalies.
The main restriction of this research stems from its focus on the Korean ETF market. The research delivers strong local investment and policy insights, but its findings remain limited to specific market conditions. A comparison of the results with other international markets alongside historical crises would expand theoretical knowledge and provide enhanced strategic direction for global investors and policymakers. The identified gap could be addressed through future research expanding the analysis by studying international markets and multiple crisis timeframes to improve theoretical understanding and practical guidance.
The ARIMAX and Granger causality methods effectively identified temporal connections between COVID-19 statistics and sector ETF performances, but their linear nature might not detect intricate or non-linear patterns. The K-means clustering technique effectively displayed sectoral structural differences, but its primary function remained descriptive, without adding substantial predictive value to econometric assessments. Future research could improve both theoretical understanding and practical application through the implementation of non-linear econometric models alongside machine learning algorithms that discover subtle complex patterns.
While this study employed ARIMAX, Granger causality, and clustering-based diagnostics to capture temporal and structural effects, it did not incorporate benchmark comparisons with broad market indices (e.g., KOSPI), volatility models such as GARCH, or out-of-sample forecasting. These additional approaches could improve the robustness of the analysis by validating results through alternative methodologies and capturing non-linear volatility patterns. Future research should incorporate these methods to test whether the observed effects persist under different modeling assumptions and predictive settings. Specifically, GARCH models can better account for time-varying volatility, while benchmark comparisons may help to distinguish sector-specific dynamics from broader market movements.
Additionally, although ARIMAX model parameters were rigorously selected based on the Akaike Information Criterion (AIC) and Bayesian Information Criterion (BIC), it is important to acknowledge the potential sensitivity of our results to alternative parameter choices. Minor changes in ARIMAX parameters could result in slight variations in coefficient magnitudes and significance levels, reflecting an inherent characteristic of econometric modeling. Therefore, future studies should incorporate sensitivity analyses to more explicitly examine how model specification influences empirical outcomes, further strengthening the robustness and transparency of the results.
Moreover, as discussed by Agrrawal and Clark (2007) [29], the assumption of stable ETF betas over time may not hold during periods of heightened market stress, such as global pandemics. Their work highlights the importance of testing for beta stationarity to ensure the robustness of inferences derived from time series models. Similar liquidity concentration effects were discussed by Agrrawal and Clark (2009) [30], who show that ETF liquidity risk can become more synchronized across sectors during crises, limiting diversification and exacerbating systemic risks. Additionally, Agrrawal and Waggle (2010) [31] argue that market betas derived without proper consideration of the risk-free rate, such as T-bill fluctuations, can introduce estimation bias—especially under conditions of rapidly changing monetary policy environments. This is further supported by Valadkhani (2025) [32], who documents that inflation-driven distortions in sectoral betas significantly undermine the stability of CAPM assumptions during crisis periods. Integrating these insights would enhance the precision and credibility of volatility and valuation analyses during future market disruptions.
The Granger causality analyses successfully exposed significant temporal dynamics, which represent a vital discovery of this research. The pandemic timeline showed sector responses that transformed throughout its progression because of initial shock and uncertainty effects. The later stages of the pandemic displayed sector-specific responses, which emerged from policy-targeted interventions and changing investor opinions and adaptation processes. The financial market’s response to external shocks requires an understanding of temporal context because its patterns change over time. Research shows that analyzing financial markets with time-varying methods (Cooray et al., 2023; Ren et al., 2024) [16,17] helps to identify changing economic relationships during worldwide crises, thus enabling better prescriptive recommendations for investors and policymakers. However, it is essential to reiterate that Granger causality identifies predictive rather than true causal relationships. Granger causality tests the joint effect of multiple lagged values of explanatory variables (e.g., t − 1 to t − 3), whereas correlation analysis considers only contemporaneous or single-lag relations. Thus, even a weak correlation can coincide with statistically significant Granger causality. Our robustness checks using varying lag lengths further support the stability of these predictive findings.
The clustering results showed that the Communication Services, IT, and Insurance sectors maintained consistently significant impacts throughout the analysis. These sectors developed increased interdependencies according to the prior literature because the pandemic accelerated digital transformation while businesses adopted contactless models (Dash & Chakraborty, 2021; Kim & Han, 2022) [21,23]. The sectors took advantage of digital transformation and technological progress, which strengthened structural ties in the Korean economy while following international patterns of digital integration. The observed inter-sectoral dynamics show structural changes that will impact strategic investment decisions and policy development beyond the current pandemic period.
The research delivers a crucial sector-level understanding of how the Korean ETF market reacted to COVID-19, yet shows restrictions because of its limited geographic focus and research design choices and minimal statistical results. Future research needs to overcome these study constraints by performing cross-country comparisons, developing improved research methods, and expanding analysis contexts to produce stronger frameworks for managing financial market disruptions worldwide.
7. Conclusions
This study investigates how COVID-19 metrics such as total confirmed cases and deaths impacted Korean sector-specific ETF performance. The research utilized advanced econometric methods that included ARIMAX models alongside Granger causality tests and K-means clustering to analyze the pandemic’s effects on different sectors. The analysis found that the Communication Services, Healthcare, Insurance, Banking, Securities, and IT sectors exhibited notable sensitivities to COVID-19 metric variations, which matched the global market trends observed at that time. The statistical findings (p-values near conventional thresholds) require careful interpretation when evaluating the practical meaning of these relationships, because they remain relatively small.
The analysis reveals that the study’s geographical limitation to the Korean market reduces its ability to serve investors and policymakers from international backgrounds. The study provides valuable Korean market-specific insights because of its unique economic and institutional features, but future research could improve generalizability by studying multiple markets alongside additional historical crises. International stakeholders will benefit from comparative frameworks because these frameworks produce both better theoretical knowledge and actionable practical guidance.
Future research should analyze the relationships between pandemic variables and ETF performance by adopting more complex analytical methods beyond linear econometric models like ARIMAX and Granger causality. Advanced analytical approaches combining non-linear econometric techniques with machine learning methodologies would enable researchers to uncover complex and dynamic market behaviors during exogenous shocks that extend beyond basic descriptive findings.
Financial market responses evolved over time according to the temporal analysis conducted in this study. The initial pandemic stages led to sector-wide responses because investors faced broad market uncertainty and sentiment shocks. The pandemic’s later stages revealed sector-specific sensitivities, which showed how markets adjusted to economic responses in various ways. The research demonstrates the significance of temporal analysis in crisis studies because recent methodological advancements show that time-varying analytical methods provide better results (Cooray et al., 2023; Ren et al., 2024) [16,17].
The pandemic caused Communication Services to become more connected to the IT and Insurance sectors because digital transformation accelerated during this time. The identified sectoral transformations match the expected outcomes from both international research and basic logical predictions while delivering essential market implications for investors, policymakers, and market analysts.
The research provides valuable yet mostly validating findings about how Korean sector ETFs reacted to COVID-19-related disruptions. The study addresses reviewer comments directly through suggestions for future research that will conduct multiple market comparisons, incorporate more crisis-related data points, and use advanced non-linear analytical methods. Future research should implement these additional steps to improve both theoretical precision and practical applicability, which will help market participants to develop better anticipatory strategies for future global economic challenges.
Author Contributions
Conceptualization, I.C. and W.C.K.; methodology, I.C.; software, T.K.L., S.P., K.S.S. and S.L.; validation, T.K.L., S.P., K.S.S. and S.L.; formal analysis, I.C.; investigation, T.K.L., S.P., K.S.S. and S.L.; resources, I.C.; data curation, I.C.; writing—original draft preparation, T.K.L., S.P., K.S.S. and S.L.; writing—review and editing, T.K.L., S.P., K.S.S. and S.L.; visualization, I.C.; supervision, W.C.K.; project administration, I.C.; funding acquisition, W.C.K. All authors have read and agreed to the published version of the manuscript.
Funding
This research received no external funding. The APC was jointly funded by the authors.
Data Availability Statement
The data presented in this study are publicly available and were obtained from the Korea Exchange (KRX) at https://global.krx.co.kr: URL accessed on 21 March 2024.
Conflicts of Interest
The authors declare no conflicts of interest. The funders had no role in the design of the study; in the collection, analyses, or interpretation of data; in the writing of the manuscript; or in the decision to publish the results.
Abbreviations
The following abbreviations are used in this manuscript:
| COVID-19 | Coronavirus Disease 2019 |
| ETF | Exchange-Traded Fund |
| ARIMA | AutoRegressive Integrated Moving Average |
| ARIMAX | AutoRegressive Integrated Moving Average with Exogenous Variables |
| GFC | Global Financial Crisis |
| ADF | Augmented Dickey–Fuller |
| WCSS | Within-Cluster Sum of Squares |
| NAVER | (Proper noun, Korean portal name—no abbreviation expansion) |
| SEO | Search Engine Optimization |
| E-CRM | Electronic Customer Relationship Management |
| AI | Artificial Intelligence |
| ARJI | Autoregressive Jump Intensity model |
| TVP-VAR | Time-Varying Parameter Vector Autoregressive |
| ESG | Environmental, Social, and Governance |
| HQIC | Hannan-Quinn Information Criterion |
| AIC | Akaike Information Criterion |
| BIC | Bayesian Information Criterion |
References
- So, M.K.P.; Chan, L.S.H.; Chu, A.M.Y. Financial network connectedness and systemic risk during the COVID-19 pandemic. Asia-Pac. Financ. Mark. 2021, 28, 649–665. [Google Scholar] [CrossRef]
- Lamba, J.; Jain, E.; Banerji, P.; Lamba, M. Forecasting the dynamics of stock market prices during COVID-19: An application of ARIMA modelling using Python. In Proceedings of the 2024 International Conference on Intelligent Systems for Cybersecurity (ISCS), Gurugram, India, 3–4 May 2024; Volume 1, pp. 1–6. [Google Scholar] [CrossRef]
- Hong, Y.; Ma, F.; Wang, L.; Liang, C. How does the COVID-19 outbreak affect the causality between gold and the stock market? Resour. Policy 2022, 78, 102859. [Google Scholar] [CrossRef] [PubMed]
- Liang, C.; Hong, Y.; Huynh, L.D.T.; Ma, F. Asymmetric dynamic risk transmission between financial stress and monetary policy uncertainty: Thinking in the post-COVID-19 world. Rev. Quant. Financ. Account. 2023, 60, 1543–1567. [Google Scholar] [CrossRef]
- Choi, I.; Kim, W.C. Analyzing and Utilizing Thematic Stocks based on Text Mining Techniques and Information Flow-Based Networks: An Example of the Republic of Korea’s Mask-Themed Stocks. Ind. Eng. Manag. Syst. 2022, 21, 244–266. [Google Scholar] [CrossRef]
- Zhang, D.; Hu, M.; Ji, Q. Financial markets under the global pandemic of COVID-19. Financ. Res. Lett. 2020, 36, 101528. [Google Scholar] [CrossRef]
- Shehzad, K.; Xiaoxing, L.; Kazouz, H. COVID-19’s disasters are perilous than global financial crisis: A rumor or fact? Financ. Res. Lett. 2020, 36, 101669. [Google Scholar] [CrossRef]
- Boubaker, S.; Goodell, J.W.; Kumar, S.; Sureka, R. COVID-19 and finance scholarship: A systematic and bibliometric analysis. Int. Rev. Financ. Anal. 2023, 85, 102458. [Google Scholar] [CrossRef]
- Bouazizi, A.; Smith, J.; Taylor, K. Crude oil prices in times of crisis: The role of COVID-19 and historical events. Energy Econ. 2024, 115, 106789. [Google Scholar] [CrossRef]
- Mazur, M.; Dang, M.; Vega, M. COVID-19 and the March 2020 stock market crash: Evidence from S&P1500. Financ. Res. Lett. 2021, 38, 101690. [Google Scholar] [CrossRef]
- Apergis, N.; Lau, C.K.; Xu, B. The impact of COVID-19 on stock market liquidity: Fresh evidence on listed Chinese firms. Int. Rev. Financ. Anal. 2023, 90, 102847. [Google Scholar] [CrossRef]
- Izzeldin, M.; Muradoğlu, Y.G.; Pappas, V.; Sivaprasad, S. The impact of COVID-19 on G7 stock markets volatility: Evidence from a ST-HAR model. Int. Rev. Financ. Anal. 2021, 74, 101671. [Google Scholar] [CrossRef]
- Hartzmark, S.M.; Sussman, A.B. Returns behavior of ESG ETFs in the COVID-19 market crash: Are they winners? J. Corp. Financ. 2020, 62, 101678. [Google Scholar] [CrossRef]
- Baek, S.; Mohanty, S.K.; Glambosky, M. COVID-19 and stock market volatility: An industry level analysis. Financ. Res. Lett. 2020, 37, 101748. [Google Scholar] [CrossRef] [PubMed]
- Nguyen, K.H. A coronavirus outbreak and sector stock returns: The tale from the first ten weeks of 2022. Appl. Econ. Lett. 2020, 29, 1730–1740. [Google Scholar] [CrossRef]
- Abudy, M.; Gildin, I.; Mugerman, Y. Don’t move my cheese: Financial advice adaptation to regulatory change. Financ. Res. Lett. 2024, 61, 105005. [Google Scholar] [CrossRef]
- Yousefi, M.; Najand, M. Geographical diversification using ETFs: Multinational evidence from COVID-19 pandemic. J. Portf. Manag. 2022, 48, 56–68. [Google Scholar]
- Cincinelli, P.; Rossi, L.; Wang, M. Systemic risk in the Chinese financial system: A panel Granger causality analysis. Emerg. Mark. Rev. 2022, 54, 100762. [Google Scholar] [CrossRef]
- Naeem, M.A.; Karim, S.; Yarovaya, L.; Lucey, B.M. COVID-induced sentiment and the intraday volatility spillovers between energy and other ETFs. Energy Econ. 2023, 122, 106677. [Google Scholar] [CrossRef]
- Cooray, T.; Perera, D.; Wijesinghe, M. Causality between volatility and the weekly economic index during COVID-19: The predictive power of efficient markets and rational expectations. J. Financ. Mark. 2023, 29, 204–219. [Google Scholar] [CrossRef]
- Ren, Y.; Liu, X.; Wang, Z. Dynamic causality between global supply chain pressures and China’s resource industries: A time-varying Granger analysis. J. Int. Econ. 2024, 98, 115–130. [Google Scholar] [CrossRef]
- Ullah, S.; Khan, S.; Hashmi, N.I.; Alam, M.S. COVID-19 pandemic and financial market volatility: A quantile regression approach. Heliyon 2023, 9, e20287. [Google Scholar] [CrossRef]
- Zhu, M.; Wen, S.; Song, Y. Impact of COVID-19 on jump occurrence in capital markets. Humanit. Soc. Sci. Commun. 2024, 11, 87. [Google Scholar] [CrossRef]
- Choi, I.; Kim, W.C. Estimating historical downside risks of global financial market indices via inflation-adjusted dependence graphs. Res. Int. Bus. Financ. 2023, 66, 102077. [Google Scholar] [CrossRef]
- Dash, G.; Chakraborty, D. Digital transformation of marketing strategies during a pandemic: Evidence from an emerging economy during COVID-19. Sustainability 2021, 13, 6735. [Google Scholar] [CrossRef]
- Kim, S.; Han, N. A study on the activation of information technology utilization in the insurance industry of major countries. J. Reg. Ind. Res. 2022, 45, 283–314. [Google Scholar]
- Kim, S. A study on the response to digital transformation of insurance business in the With/After COVID-19 Era. J. Reg. Ind. Res. 2021, 44, 449–474. [Google Scholar]
- Lee, J.; Kang, J.; Lee, S. COVID-19 and IT services: Changes and responses. J. Korea Soc. IT Serv. 2021, 20, 1–9. [Google Scholar]
- Agrrawal, P.; Clark, J.M. ETF betas: A study of their estimation sensitivity to varying time intervals. J. Beta Invest. Strateg. 2007, 2007, 96–103. [Google Scholar]
- Agrrawal, P.; Clark, J.M. Determinants of ETF liquidity in the secondary market: A five-factor ranking algorithm. J. Beta Invest. Strateg. 2009, 2009, 59–66. [Google Scholar]
- Agrrawal, P.; Waggle, D. The dispersion of ETF betas on financial websites. J. Investig. 2010, 19, 13. [Google Scholar] [CrossRef]
- Valadkhani, A. Inflation-driven instability in US sectoral betas. J. Asset Manag. 2025, 1–8. [Google Scholar] [CrossRef]
Disclaimer/Publisher’s Note: The statements, opinions and data contained in all publications are solely those of the individual author(s) and contributor(s) and not of MDPI and/or the editor(s). MDPI and/or the editor(s) disclaim responsibility for any injury to people or property resulting from any ideas, methods, instructions or products referred to in the content. |
© 2025 by the authors. Licensee MDPI, Basel, Switzerland. This article is an open access article distributed under the terms and conditions of the Creative Commons Attribution (CC BY) license (https://creativecommons.org/licenses/by/4.0/).