Article

Evaluation Model for Emergency Material Suppliers in Emergency Logistics Systems Based on Game Theory–TOPSIS Method

1
School of Emergency Management and Safety Engineering, Jiangxi University of Science and Technology, Ganzhou 341000, China
2
School of Civil and Surveying Engineering, Jiangxi University of Science and Technology, Ganzhou 341000, China
*
Author to whom correspondence should be addressed.
Systems 2025, 13(6), 493; https://doi.org/10.3390/systems13060493
Submission received: 16 April 2025 / Revised: 27 May 2025 / Accepted: 17 June 2025 / Published: 19 June 2025
(This article belongs to the Special Issue New Trends in Sustainable Operations and Supply Chain Management)

Abstract

Emergency material suppliers serve as a critical component within emergency logistics systems, with their capabilities directly influencing operational efficiency. To identify suppliers with comprehensive capabilities, this study establishes an evaluation index system encompassing four key dimensions: emergency resilience, logistics costs, material quality, and supplier internal conditions. The methodology integrates subjective weights derived from the G1 method and objective weights calculated by entropy weighting, subsequently employing game theory to reconcile conflicts between weighting methods and determine comprehensive weights. The TOPSIS method is applied to identify optimal suppliers through relative approximation comparisons. A case study demonstrates the model’s effectiveness, with comparative analysis against AHP and traditional combination weighting methods revealing distinct advantages: under information distortion conditions, the game theory combination weighting exhibits significantly lower weight fluctuations (0.00018) compared to the additive synthesis (0.00044) and multiplicative synthesis methods (0.000503). This evidence confirms that game theory not only demonstrates superior stability and adaptability for emergency evaluations but also effectively balances weight conflicts, yielding more rational assessment outcomes. The research findings validate the practical utility of this game theory–TOPSIS integrated evaluation model, providing valuable decision support for emergency management professionals.

1. Introduction

Emergencies are events triggered by natural disasters or human factors that require emergency response measures, and they are often complex, unpredictable, and socially hazardous. In order to respond positively to emergencies and reduce losses, regulators inevitably need a host of emergency supplies to support response actions. Emergency logistics is indispensable for the deployment of emergency supplies, which refers to the coordination of resources, personnel, and infrastructure to deliver aid during crises, such as natural disasters, conflicts, or public health emergencies. It prioritizes speed, adaptability, and scalability over cost optimization, and it is characterized by a weak economy, urgency, and timeliness [1]. The various coordinated elements in emergency logistics constitute the emergency logistics system, and its establishment and improvement is related to national security and social stability. In February 2022, the State Council issued the ‘14th Five-Year’ National Emergency Response System Plan, which clearly points out that we should further improve the emergency logistics system and strengthen the emergency material reserve. Regarding the construction of the system, whether it is material reserve or emergency supply, the system cannot be separated from material suppliers, as they are the ‘starting point’ of the operation of the emergency logistics system, to ensure the supply of emergency materials, rapid response, and efficient distribution. By selecting high-quality suppliers through scientific methods, we can provide efficient and low-cost logistics services to the government and disaster victims. Therefore, the selection of emergency material suppliers is crucial, and it is a key step in optimizing the emergency logistics system and improving the efficiency of emergency response [2].
Scholars in China and abroad have conducted some relevant studies on the selection of suppliers and achieved fruitful results. In terms of indicator establishment, Yang JQ et al. [3] combined the background of epidemics according to the characteristics of epidemic prevention materials and ranked four non-economic indicators: delivery quality, supply chain resilience, material quality, and social environment and corporate reputation. Ediz Ekinci et al. [4] established evaluation indexes from delivery factors, procurement costs, and material quality. Hui Huang et al. [5] took emergency food as the research object and established an index system from four dimensions: product level, supply response, transport response, and enterprise basic management. Qureshi et al. [6] believed that the selection of suppliers should take into account factors such as service quality, fixed assets scale, management quality, and information technology capabilities. In terms of weight calculation, XuTian Li et al. [7] used the multi-criteria decision-making method (MCDM) to take warehouses into account, followed by the AHP (Analysis of Hierarchy Process) to determine the indicator weights. CHU et al. [8] used triangular fuzzy numerical language for the calculation of weights. Zhang HY et al. [9] used the CRITIC method to measure the correlation coefficient between attributes to obtain indicator weights. Yin ZH et al. [10] used information entropy to obtain the objective weights of indicators. Shen YM [11] used the AHP to calculate subjective weights and the entropy weight method to calculate objective weights and finally obtained combined weights using multiplicative synthesis. In terms of evaluation methods, Wang XD et al. [12] constructed a distance-based VIKOR multi-criteria group decision-making model (MCGDM) to solve the problem of supplier selection. Zhang YR et al. [13] proposed a two-stage model using TOPSIS (Technique for Order Preference by Similarity to an Ideal Solution) and two-stage mixed-integer linear programming for supplier selection. Zhang NA et al. [14] proposed a green supplier selection (GSS) method, taking decision-maker uncertainty and behavioral preferences into account. This method utilizes evaluation information collected from decision-makers, followed by a TOPSIS analysis to select the best supplier. Gao YJ et al. [15] used interval q-order orthogonal fuzzy entropy in order to obtain subjective weights and then used the COADS method to give ranking results for contingent supplier selection options.
In summary, the weight results obtained by traditional methods such as the AHP, CRITIC, and entropy weighting alone have strong subjectivity or objectivity, which cannot better reflect information about indicator weights. Even if the combination of subjective and objective weights is used, this is only a simple superposition and combination of the two and cannot balance the ‘conflict’ between subjective and objective weights, resulting in an irrational distribution of weights. Furthermore, compared with other MCDM evaluation methods, the results of the TOPSIS method are presented in the form of a distance metric, which is easy to understand and suitable for rapid decision-making in emergency scenarios, and at the same time, it does not require complex parameter settings, the calculation process is simple, and the results are stable. Based on this, this paper proposes to adopt the G1 method, which is simpler in terms of calculation steps, to calculate subjective weights, and the entropy weight method to calculate objective weights, followed by the combination of weights based on game theory. Finally, the TOPSIS method is applied to assess the relative closeness of each alternative, thereby identifying the optimal supplier.
The game theoretic–TOPSIS method solves the problem of the weights calculated by existing methods being unstable and irrationally distributed. This method can reasonably allocate the proportion of subjective and objective weights, further reduce the subjective error, make the evaluation results more reliable, and then promote the construction of the emergency logistics system.
The remaining part of this article describes the construction of the index system, the calculation steps of the game theory–TOPSIS method, the analysis of examples, etc. The evaluation model is finally applied to three alternative suppliers to verify the applicability of the model, with a view of providing a scientific evaluation basis for emergency incident respondents.

2. Construction of Evaluation Index System

Based on the existing research results, consulting the experts in the field, and referring to the first-level indicators quality, flexibility, etc., mentioned in the literature [16], as well as the cost control, internal and external conditions, etc., mentioned in the literature [17], we established an evaluation framework targeting emergency material supplier capability as the objective layer. This framework comprises four primary indicators, material quality, cost control, internal situation, and emergency flexibility, with each primary indicator further refined into representative secondary indicators. The system ultimately encompasses 16 secondary indicators, with specific classifications illustrated in Figure 1.
Material quality mainly evaluates the technical level, quality pass rate, and after-sales service ability of suppliers’ products to ensure the reliability of materials. Cost control mainly evaluates the cost management efficiency of suppliers in terms of price, transportation, inventory, and other aspects to optimize the economy of procurement. The internal situation indicator is used to evaluate comprehensive management ability, such as enterprise reputation, geographical location, order execution, etc., reflecting the stability and processing efficiency of suppliers in the face of emergencies. Emergency flexibility mainly reflects the supplier’s resilience in terms of time response, product adjustment, and yield change.
The characteristics of the evaluation index system inherently align with the emergency logistics, manifested in three key dimensions: The first dimension is scientific rationality, as during the initial disaster phase, safeguarding lives and property constitutes the paramount priority of emergency response. Emergency logistics operations must prioritize ensuring material support for emergency response and rescue operations during crises. Consequently, the evaluation system integrates metrics that comprehensively address both emergency effectiveness and overarching operational requirements. The second dimension consists of conciseness and timeliness. Since emergency events are often unpredictable, excessive evaluation hierarchies or redundant indicators would counterproductively increase decision burdens and delay response processes. The system therefore emphasizes streamlined, actionable metrics optimized for rapid implementation. The third dimension is a de-emphasis on the economy. While emergency logistics shares traditional logistics’ operational emphasis on transportation efficiency, it fundamentally diverges in its strategic priorities. Unlike conventional logistics that prioritizes economic returns, emergency logistics prioritizes life-saving effectiveness over cost considerations. Consequently, when evaluating performance, metrics related to emergency effectiveness should take precedence over cost considerations.

3. Evaluation Model Based on Game Theory–TOPSIS Method

Assuming that there are a total of M emergency material suppliers to be selected and shared in the model’s N evaluation indexes, each of which is   x i j ( i = 1,2 n , j = 1,2 , n ), the evaluation matrix is X = ( x i j ) m × n .

3.1. Calculation Steps

(1) Experts are invited to score each indicator, and the subjective and objective weights of the indicators are calculated through the G1 method and entropy weighting method, respectively, with relevant data.
(2) Based on game theory, the set of coefficient vectors is optimized with the objective of minimizing the outliers to obtain the combined weights.
(3) Positive and negative ideal solutions are constructed based on the TOPSIS method, and the Euclidean geometric distance and relative approximation of each supplier to the positive and negative ideal solutions are calculated.
(4) The relative proximity of each supplier is ranked, and the largest one is selected as the object of cooperation.
The analysis flow chart is shown in Figure 2.

3.2. Calculation of Subjective Weight by G1 Method

The AHP remains a mainstream subjective evaluation methodology. This approach constructs a hierarchical structure model where experts assess relative importance ratios between indicators based on subjective experience, subsequently building comparison matrices to calculate indicator weights. However, its computational process exhibits significant dependence on expert judgment. Particularly when addressing complex evaluation index systems or intricate indicator relationships, frequent matrix adjustments become necessary to satisfy consistency check requirements, resulting in computationally intensive weight determination processes [18]. To address these limitations, Professor Guo Yajun of Northeastern University developed the Order Relation Method (G1 method), an improved subjective weighting approach derived from the traditional AHP. In the context of emergency events, the G1 method offers advantages over the AHP. It utilizes ordinal relationships instead of ratio judgments, making it suitable for rapid decision-making scenarios. It eliminates the need for consistency checks [19], thus avoiding weight fluctuations caused by minor judgment errors. Furthermore, it significantly reduces computational complexity. The specific computational steps are as follows:
(1) A Panel of experts is invited to fully discuss the N evaluation indexes. The most important indicators shall be selected after full discussion, and consensus is recorded as   C 1 , its weight is recorded as   W 1 , in the remaining N-1 indexes, repeating the process until all are evaluated. The evaluation sequence is obtained as C 1 C 2 C 3 C k , where ‘ ’ indicates the ordinal relationship between the two indicators, when   C i C j . We define the index   C i as having a greater degree of importance than C j   .
(2) According to the above evaluation sequence C 1 C 2 C 3 C k , r i is determined, the ratio of the relative importance of the indexes   C i   a n d   C j , for which the data of relative importance are shown in Table 1. The relative importance ratio is calculated as follows:
r i = W i 1 W i , i = 1,2 , 3 , n
(3) The weight W n is calculated for the nth indicator with the following formula:
W n = ( 1 + k = 2 n i = k n r i ) 1
(4) Based on the weight of the nth indicator W n , the weight of the n-1th indicator W n 1 is calculated by the importance ratio; the calculation formula is as follows:
W n 1 = r n × W n

3.3. Calculation of Objective Weight by Entropy Weight Method

The entropy weight method is an objective weighting approach based on information entropy. In information theory, an indicator with greater information content induces lower uncertainty, resulting in smaller entropy values. Consequently, such indicators receive higher weights in comprehensive evaluations and vice versa. The specific computational steps are as follows:
(1) A judgment matrix   X = ( x i j ) m × n is established. The matrix is normalized based on the attributes of secondary indicators to eliminate dimensional effects, resulting in the dimensionless original matrix R i j = ( q i j ) m × n . The dimensionless formula is as follows:
q i j = x j x m i n x m a x x m i n ; q i j = x m a x x j x m a x x m i n
The former is used for dimensionless positive indicators, and the latter is used for dimensionless negative indicators. An analysis of the attributes of each secondary indicator is shown in Table 2.
(2) The matrix R ¯ i j = ( q i j ) m × n is obtained by the column normalization processing of the original matrix R i j = ( q i j ) m × n , and all   x ¯ i j in R ¯ i j satisfy the following: 0 x ¯ i j 1 .
(3) The entropy value of each index is calculated. According to the definition of entropy value in information theory, the calculation formula is as follows:
E j = k i = 1 m x ¯ i j ln x ¯ i j , x ¯ i j 0 0 , x ¯ i j = 0
where k = 1 ln m .
(4) The entropy weight of each index   W j is calculated, and the calculation formula is as follows:
W j = 1 E j j = 1 m ( 1 E j )

3.4. Calculation of Combination Weight Based on Game Theory

The basic idea of the game theory combination assignment method is to regard subjective weights and objective weights as game opponents, with the goal of minimizing deviation, continuously optimizing the combination of linear coefficients to minimize the conflict between the two and finally reaching the Nash equilibrium state to obtain more scientific comprehensive weights [20]. Assuming that there are N kinds of assignment methods, there are N weight results, and the steps of the game theory combined assignment method are as follows:
(1) A set of weight vectors w k = w 1 , w 2 , w 3 , L w N is built based on the obtained N weights, and any linear combination of these vectors yields w * , i.e.,
w * = k = 1 N a k w k T
(2) With the objective of minimizing the deviation, w * and w k are optimized; the objective function is established as follows:
m i n | | a k w k T w j | | 2 , j = 1 , 2 , L N
(3) According to the differential properties of the matrix, it can be determined that the optimized first derivative satisfies the following system of linear equations:
w 1 · w 1 T w 1 · w N T w N · w 1 T w N · w N T a 1 a 2 = w 1 · w 1 T w N · w N T
(4) The combination coefficient a k * = a k k = 1 N a k is normalized; then the optimal weight coefficient is obtained, and the comprehensive weight is as follows:
𝒲 = k = 1 N a k * w k T

3.5. TOPSIS

TOPSIS (Technique for Order Preference by Similarity to an Ideal Solution), also known as the Approximate Ideal Solution Ordering Method, is derived from the discriminant problem in multivariate statistics. It is used to determine the best solution by establishing a set of positive and negative ideal solutions, calculating the Euclidean geometric distance between the alternative solutions and the optimal (inferior) ideal solution, and comparing the relative approximation of each solution. The specific calculation steps of this method are as follows:
(1) According to the comprehensive weight and R i j = ( q i j ) m × n , the initial decision matrix X is constructed:
X * = 𝒲 1 q 11 𝒲 n q 1 m 𝒲 1 q n 1 𝒲 n q n m
(2) The optimal value under each indicator is individually proposed as a combination of the positive ideal point, which is the best emergency material supplier, and the negative ideal point and the worst emergency material supplier can be obtained under the same reasoning. The positive and negative ideal points are, respectively, as follows:
D + = D 1 + , D 2 + , D 3 + , D n +
D = ( D 1 , D 2 , D 3 , D n )
(3) The Euclidean geometric distance is calculated. When an emergency material supplier is closer to the positive ideal solution, it means that the supplier’s comprehensive ability is stronger and more trustworthy, and if there are two or more suppliers with the same distance from the optimal solution, the supplier that is farther away from the negative ideal solution is selected. The calculation formulas of the Euclidean geometric distance are as follows:
d i + = j = 1 n ( D j + X i j ) 2
d i = j = 1 n ( D j X i j ) 2
(4) The relative approximation S i is calculated. The closer it is to 1, the better the supplier performs and vice versa. The calculation formula of S i is as follows:
S i = d i d i + + d i

4. Model Application and Analysis

To verify the practicality of the supplier evaluation model, the model is applied to an example in the literature [21] for discussion and analysis. The secondary indicator values for suppliers A, B, and C are shown in Table 3.

4.1. Calculation of Index Weight

Referring to the calculation steps presented in the previous section, the index weights are calculated.

4.1.1. Calculation of Subjective Weight by G1 Method

In order to obtain a more accurate evaluation result, an expert group composed of university professors and experts with rich experience was established. After full discussion, the relative importance of the four first-level indicators was ranked as material quality emergency flexibility internal situation cost control. The corresponding weight of each index is in turn as follows: w 1 ,   w 2 ,   w 3 ,   w 4 . At the same time, the relative importance ratio can be obtained by Formula (1): r 1 = 1.8 ,   r 2 = 1.7 ,   r 3 = 1.5 . According to Formulas (2) and (3), we can obtain the following: w 1 = 0.476 ,   w 2 = 0.265 ,   w 3 = 0.156 ,   w 4 = 0.104 . Therefore, the weight of each index in the criterion layer can be obtained as 0.476 ,   0.104 ,   0.155 ,     0.265 . Similarly, the importance order under the material quality is ranked as Technological process Product qualification rate Return processing capacity. The index weight is 0.419 ,   0.348 ,   0.233 . The importance order under the cost control is Inventory cost Transportation cost Price cost Processing cost. The indicator weight is 0.205 ,   0.157 ,   0.245 ,   0.393 . The importance order under the internal situation is ranked as Order fulfillment Quality assurance capacity Geographical advantages Enterprise reputation Information level Development potential. The index weight is 0.117 ,   0.197 ,   0.308 ,   0.077 ,   0.256 ,   0.045 . The importance order under emergency flexibility is ranked as Time flexibility Quantity flexibility Product flexibility. The index weight is 0.519 ,   0.193 ,   0.288 .
Based on the above calculation results, the weight of each secondary indicator is as follows:
( 0.199 0.166 0.111 0.022 0.016 0.025 0.041 0.018 0.031 0.047 0.012 0.04 0.007 0.138 0.051 0.076 )

4.1.2. Calculation of Objective Weight by Entropy Weight Method

Based on the original data in Table 3, the initial matrix R i j   is obtained after transposing and non-dimensionalizing:
R i j = 0.000 0.000 0.895 1.000 0.000 1.000 0.500 0.000 0.000 0.600 0.000 0.667 0.000 1.000 1.000 1.000 1.000 1.000 1.000 0.566 1.000 0.385 0.000 0.000 1.000 1.000 1.000 1.000 1.000 0.000 0.000 0.000 0.333 0.429 0.000 0.000 0.500 0.000 1.000 1.000 0.333 0.000 1.000 0.000 0.000 0.446 0.545 0.128
The data in the columns is normalized to obtain matrix R ¯ i j :
R ¯ i j = 0.000   0.000   0.472   0.639   0.000   0.722   0.333   0.000   0.000   0.375   0.000   0.400   0.000   0.692   0.647   0.886 0.750   0.700   0.528   0.361   0.667   0.278   0.000   0.000   0.750   0.625   0.500   0.600   1.000   0.000   0.000   0.000 0.250   0.300   0.000   0.000   0.333   0.000   0.667   1.000   0.250   0.000   0.500   0.000   0.000   0.308   0.353   0.114
The entropy value of each index E j is calculated:
E j = 0.512 0.556 0.630 0.596 0.579 0.538 0.579 0.000 0.512 0.602 0.631 0.613 0.000 0.562 0.591 0.322
According to the entropy value of each indicator   E j and Formula (6), the objective weights of indicators at all levels are calculated:
w j * = 0.16 0.208 0.445 0.187 w j = ( 0.06 0.054 0.045 0.049 0.051 0.057 0.051 0.122 0.06 0.049 0.045 0.047 0.122 0.054 0.05 0.083 )

4.1.3. Calculation of Combination Weight by Game Theory

In order to avoid the one-sidedness of the single weight calculation method, the combination of indicator weights is assigned based on game theory.
Based on the computational steps written above, a linear combination is obtained: ω * = α 1 ω 1 + α 2 ω 2 , where ω 1 and ω 2 are the subjective and objective weights, respectively. Then a polar minimization objective function is constructed to obtain a system of linear equations:
w 1 w 1 T w 1 w 2 T w 2 w 1 T w 2 w 2 T α 1 α 2 = w 1 w 1 T w 2 w 2 T w 1 w 1 T = 0.115232 ,   w 2 w 2 T = 0 . 071701 ,   w 1 w 2 T = w 2 w 1 T = 0 . 057252
Solving the system of equations and then normalizing the coefficients gives the following:
α 1 * = 0 . 7143 ,   α 2 * = 0 . 2857
According to ω * , the linear combination expression, the combination weights are obtained as follows:
ω * = 0.3902 0.1322 0.233 0.2446 ω = 0.1583 0.1380 0.0939 0.0296 0.0254 0.0338 0.0434 0.0486 0.0393 0.0476 0.0212 0.0406 0.0357 0.1153 0.0507 0.0786
Combining the results of the above calculations, the various weights of the secondary indicators are shown in Table 4.

4.2. TOPSIS

(1) The decision matrix X   is constructed based on the dimensionless matrix   R i j and the combined weights calculated by game theory:
X = 0.000 0.000 0.084 0.030 0.000 0.034 0.022 0.000 0.000 0.029 0.000 0.027 0.000 0.115 0.051 0.079 0.158 0.138 0.094 0.017 0.025 0.013 0.000 0.000 0.039 0.048 0.021 0.041 0.036 0.000 0.000 0.000 0.053 0.059 0.000 0.000 0.013 0.000 0.043 0.049 0.013 0.000 0.021 0.000 0.000 0.051 0.028 0.010
(2) The optimal (inferior) values of the columns in the decision matrix X are individually set as the set of optimal (inferior) solutions, and the positive and negative ideal solutions D + and D are set as follows:
D + = 0.1583 0.138 0.0939 0.0296 0.0254 0.0338 0.0434 0.0486 0.0393 0.0476 0.0212 0.0406 0.0357 0.1153 0.0507 0.0786 D = 0 0 0 0 0 0 0 0 0 0 0 0 0 0 0 0
(3) The Euclidean distances of the three alternative suppliers are calculated from the positive and negative ideal solutions, respectively, according to Formulas (14) and (15):
d i + = 0.22692 0.163968 0.208651 ,   i = 1 , 2 , 3 d i = 0.182041 0.247382 0.121738 ,   i = 1 , 2 , 3
(4) The relative approximation S i of each alternative supplier is calculated:
S i = 0.4451 0.6014 0.3685 ,   i = 1 , 2 , 3
Referring to Table 5, since the relative approximation order of suppliers is B A C , supplier B shall be selected as the cooperation object.

4.3. Discussion and Analysis

Regarding the index weights, we compared our weighting methods in a graph. We found significant differences in how they rank indicators. The graph in Figure 3 reveals that the G1 weight curve exhibits a pattern of low in the middle and high on both sides, indicating that the G1 method emphasizes the quality of emergency products and the resilience of the supplier’s logistics supply chain. This highlights the subjective characteristics of emergency response, aligning with the importance ranking of indicators provided by the expert group. The other curve shows a pattern of high in the middle and low on both sides, with the internal situation indicator having the highest weight. This is because information about different suppliers’ internal situations significantly fluctuates, reflecting the objective sensitivity of the entropy weight method to information. However, this method does not distinguish the importance of cost control from other indicators. In emergency logistics situations, speed matters more than economy. Cost considerations are rarely a decision-maker’s top priority. Therefore, the entropy weight method’s results still need improvement.
Therefore, in Figure 4, we introduced game theory for combination weighting. This improves on traditional methods like simple averaging or multiplication. These basic approaches combine subjective and objective weights through mathematical operations. They do not capture the relationship between them. In contrast, game theory finds an optimal strategy to balance subjective and objective weights. It significantly improves how comprehensively our evaluation weights reflect reality. This is evident in our results. Supplier B outperformed suppliers A and C in product quality, qualification rate, geographical advantages, order fulfillment, and time flexibility. This confirms the practical value of our approach.
In addition, we analyzed the data with both the AHP and G1 methods on the first-level indicators in Figure 5. The results showed similar trends in both methods, confirming consistent indicator importance. However, the G1 method showed greater variance between weights. It provided better discrimination between indicators and improved calculation reliability.
Regarding the selection results, the core reason for choosing supplier B is that it has higher product quality while maintaining a high order fulfillment rate, and its advantageous indicators are not only given higher importance by the experts but also have high fluctuation in objective data, which leads to the allocation of more weights. In practical terms, this choice is reasonable, which further verifies the practicability of the evaluation model.

4.4. Comparative Analysis

Common combination weighting methods are the additive synthesis method and the multiplicative synthesis method. In order to further validate the practical application of game theory in the evaluation, the results are compared and analyzed; see Table 6.
From Table 6 and Figure 6, the additive synthesis method obviously emphasizes cost and neglects product quality. It simply carries out the mathematical operation of seeking the average value, which is dull. And its weight fluctuation is small, making it difficult to differentiate important information. The multiplicative synthesis method can exacerbate the influence of both high and low subjective and objective weights, which makes it difficult to ensure evaluation accuracy. In contrast, the game theory-based weighting method mitigates these limitations. It regards their weights as strategic opponents. This method considers not only the data of the indicators but also the interrelationships among the indicators, thereby ensuring the rationality of the weighting results.
In addition, to assess the stability of the combined weighting methods under conditions of extreme data distortion, the technical process indicator value for supplier C was set to zero. The weights and their fluctuations ( ( w i w i ) 2 ) were recalculated, and the results are presented in Table 7.
Analyzing Table 7, it can be seen that game theory has the smallest weight change, which indicates that its calculation results have high robustness and are more suitable in the context of unexpected events. Based on the above, game theory overcomes the problems of the traditional combination weighting method, like simple logic, insufficient consideration, and susceptibility to data influence, and can fully improve the rationality of weight allocation.

5. Conclusions

(1) To facilitate the selection of suppliers for the emergency logistics system, an evaluation index system for emergency material suppliers is constructed, considering material quality, cost control, internal conditions, and emergency flexibility. Game theory is employed to optimize the combined weights, and the TOPSIS method is used for ranking and evaluation. Finally, a case study is conducted to validate the model’s applicability.
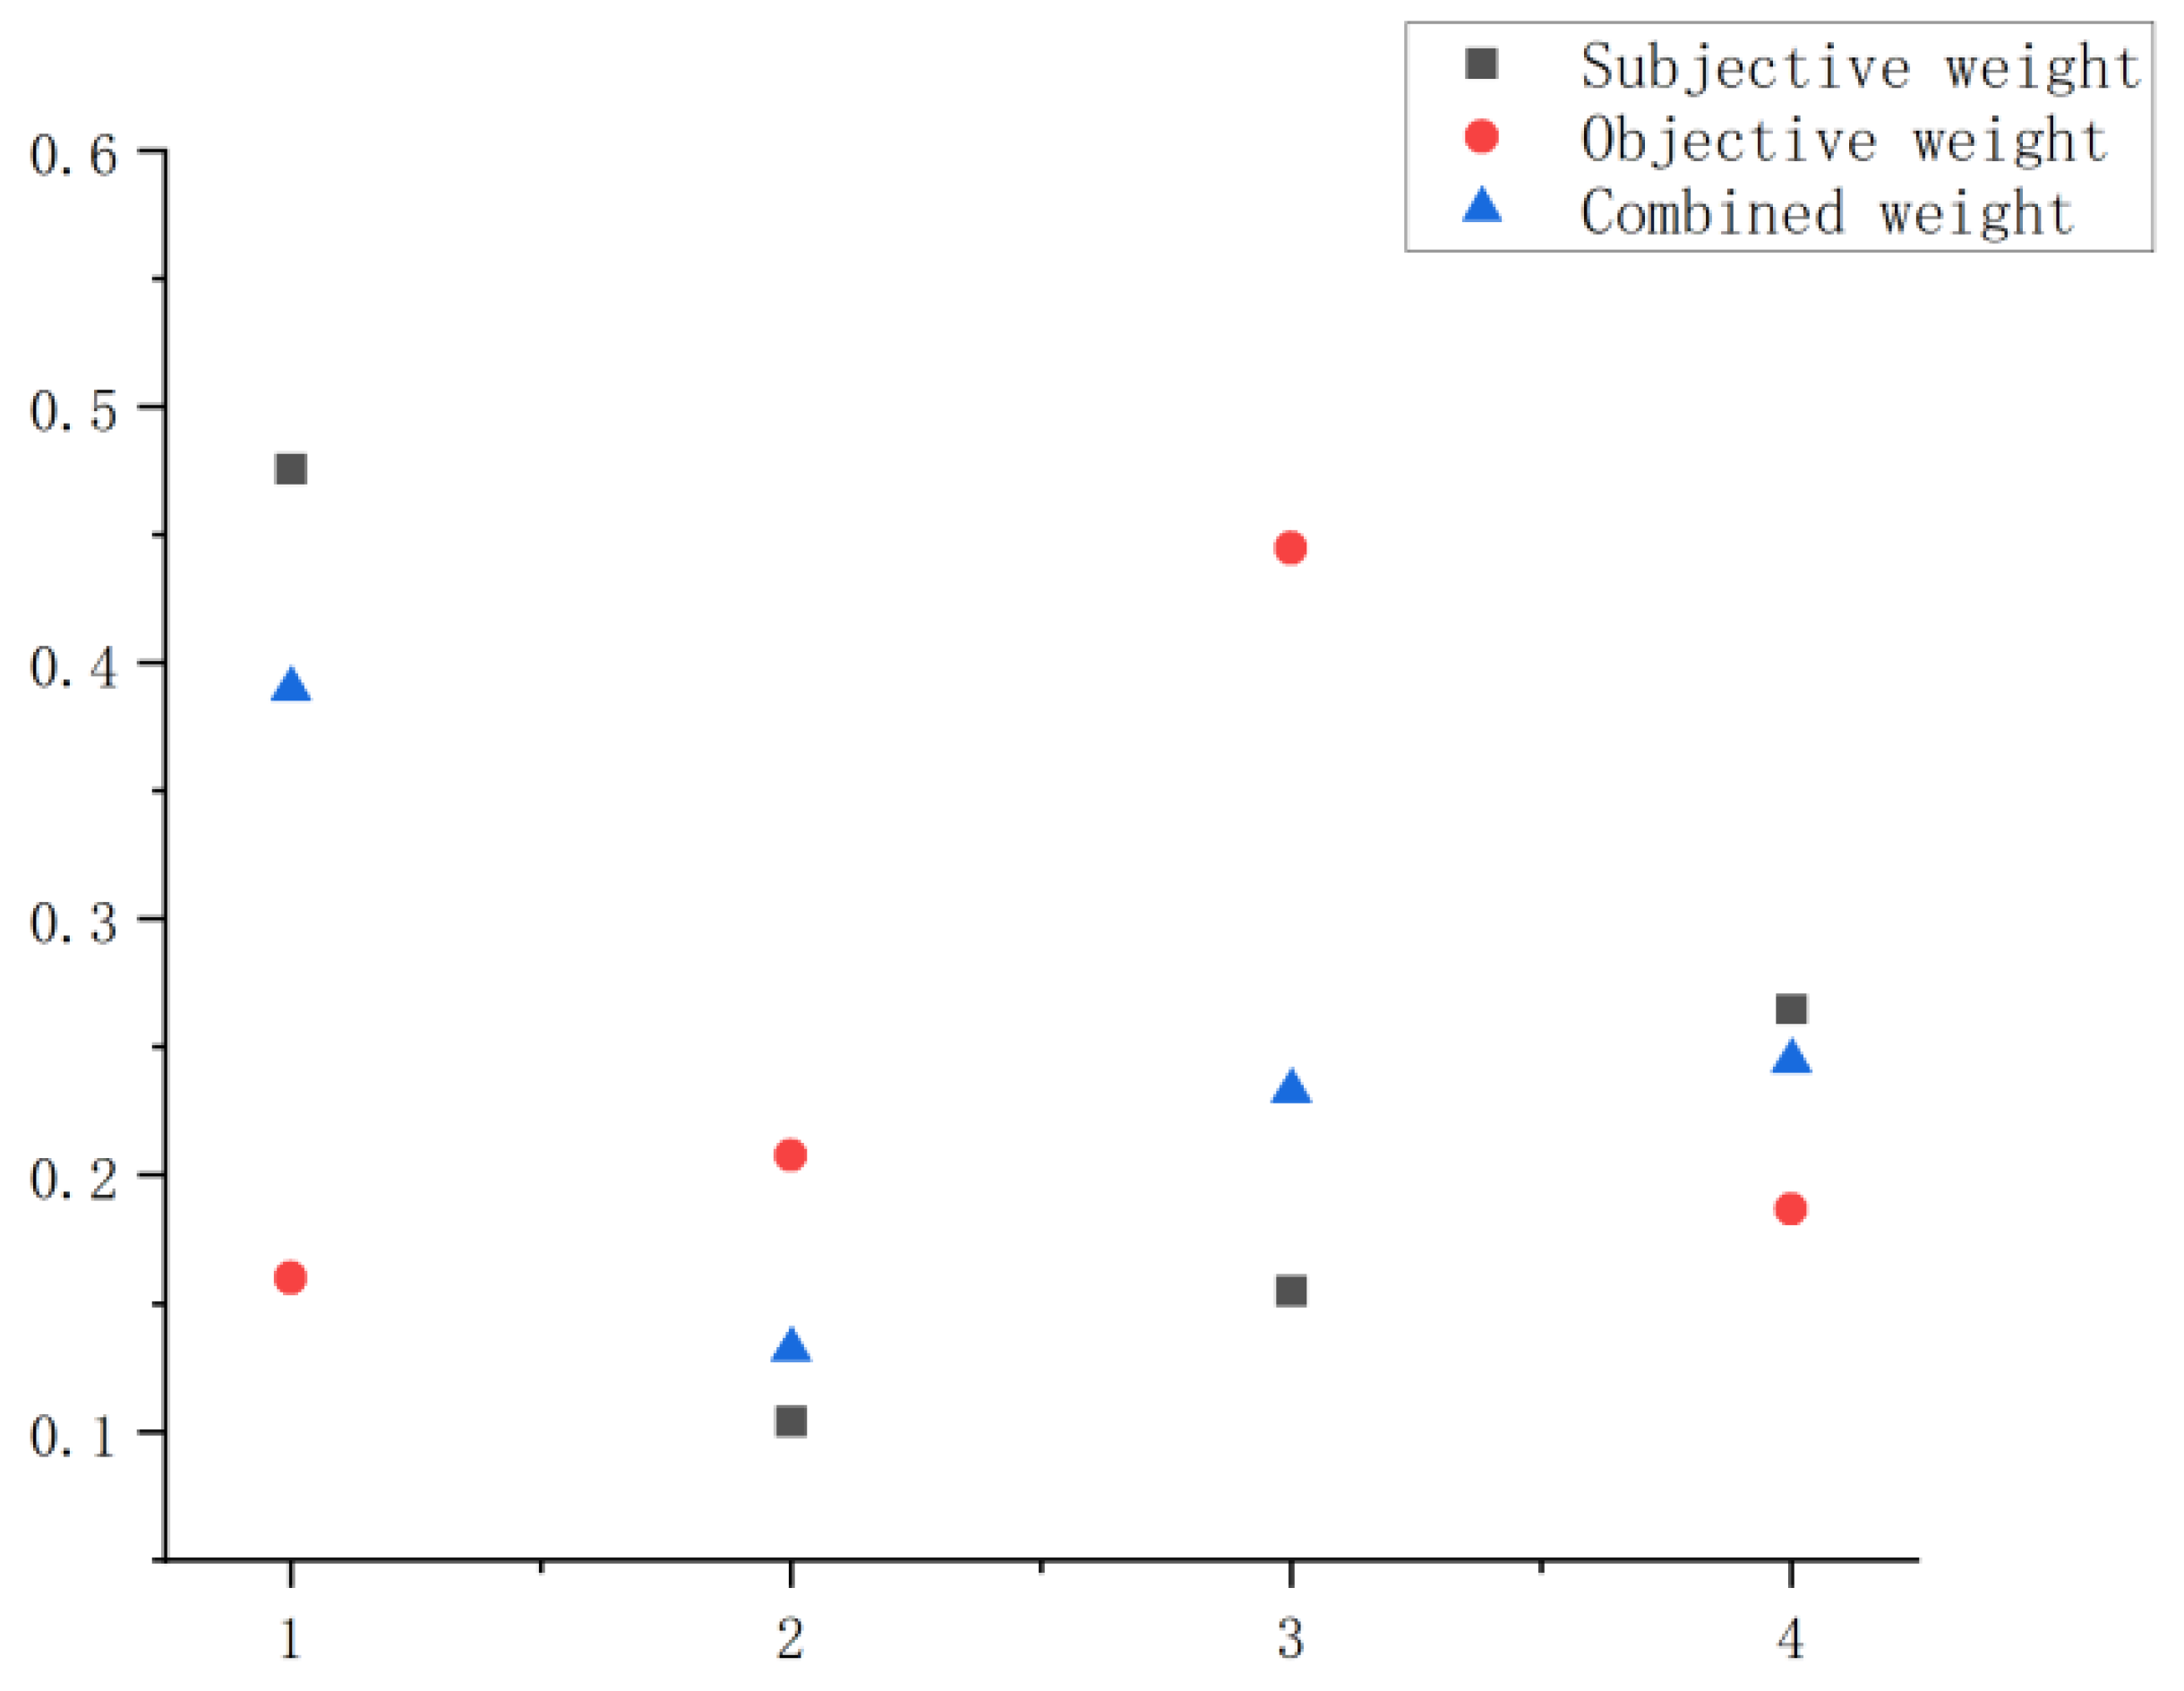
(2) A comparative analysis of the calculation results of game theory and the traditional combination weighting method shows that the former overcomes the problems of the latter and has higher robustness, which can be fully adapted to the uncertainty of the emergency logistics situation and helps in the construction of the emergency logistics system.
(3) Both weighting methods have limitations. While the G1 method is straightforward and useful in emergencies, it can be limited by experts’ inability to assess the order of indicators, affecting subjective weight determination. The entropy weight method’s results are sensitive to data quality; data distortion or absence can impact objective weight determination.
(4) The model is applicable to common emergencies, but when facing health events such as COVID-19, the indicator ‘health compliance’ should be added, and other indicators should be reprioritized. Future research could further optimize the weighting method and incorporate numerical techniques to improve the model’s applicability in complex scenarios.

Author Contributions

L.L.: investigation and editing; Q.K.: conceptualization and formal analysis; L.D.: writing—original draft; Y.K.: software and writing—review and editing; S.Y.: formal analysis and validation. All authors have read and agreed to the published version of the manuscript.

Funding

This research was supported by Jiangxi Provincial Social Science Youth Foundation (Grant No. 24GL68D) and Research Project of Education Department of Jiangxi Province (Grant No. GJJ2200829).

Institutional Review Board Statement

Not applicable.

Informed Consent Statement

Not applicable.

Data Availability Statement

Date are contained within the article.

Conflicts of Interest

The authors declare no conflict of interest.

References

  1. Zheng, Y.; Ling, H. Emergency transportation planning in disaster relief supply chain management: A cooperative fuzzy optimization approach. Soft Comput. Fusion Found. Methodol. Appl. 2013, 17, 1301–1314. [Google Scholar] [CrossRef]
  2. Dong, Z.D. Supplier selection and pre-positioning strategy in humanitarian relief: A case study. Omega 2018, 83, 287–298. [Google Scholar]
  3. Li, H.; Yang, J.; Xiang, Z. A Fuzzy Linguistic Multi-Criteria Decision-Making Approach to Assess Emergency Suppliers. Sustainability 2022, 14, 13114. [Google Scholar] [CrossRef]
  4. Özdamar, L.; Ekinci, E.; Küçükyazici, B. Emergency Logistics Planning in Natural Disasters. Ann. OR 2004, 129, 217–245. [Google Scholar] [CrossRef]
  5. Huang, H.; Yang, J.; Wu, H.; Wei, K. Construction of evaluation index system for emergency logistics service providers. Logist. Technol. 2017, 40, 74–77+81. [Google Scholar]
  6. Qureshi, M.N.; Kumar, P.; Kumar, D. Evaluation and selection under a fuzzy environment: A case study. ICFAI J. Supply Chain. Manag. 2008, 5, 39–53. [Google Scholar]
  7. Li, X.; Zhang, L. Evaluation of emergency material suppliers based on BP neural network. Logist. Eng. Manag. 2021, 43, 10–14. [Google Scholar]
  8. Chu, T.C.; Varma, R. Evaluating suppliers via a multiple levels multiple criteria decision making method under fuzzy environment. Comput. Ind. Eng. 2012, 62, 653–660. [Google Scholar] [CrossRef]
  9. Zhang, H.; Wei, G.; Chen, X. SF-GRA method based on cumulative prospect theory for multiple attribute group decision making and its application to emergency supplies supplier selection. Eng. Appl. Artif. Intell. 2022, 110, 104679. [Google Scholar] [CrossRef]
  10. Yin, Z.; Lu, Q.; Cui, L. Third party logistics supplier selection based on information entropy and grey situation decision. China Mark. 2010, 10, 18–19. [Google Scholar]
  11. Shen, Y. Research on Evaluation and selection of emergency logistics suppliers based on combination weighting method. Shanxi Agric. Sci. 2011, 57, 165–169. [Google Scholar]
  12. Wang, X.; Cai, J. A group decision-making model based on distance-based VIKOR with incomplete heterogeneous information and its application to emergency supplier selection. Kybernetes 2017, 46, 501–529. [Google Scholar] [CrossRef]
  13. Zhang, Y.; Niu, Z.; Zuo, Y.; Liu, C. Two-stage hybrid model for supplier selection and order allocation considering cyber risk. INFOR Inf. Syst. Oper. Res. 2023, 61, 530–558. [Google Scholar] [CrossRef]
  14. Zhang, N.; Zhou, Q.; Wei, G. Research on Green Supplier Selection Based on Hesitant Fuzzy Set and Extended LINMAP Method. Int. J. Fuzzy Syst. 2022, 24, 3057–3066. [Google Scholar] [CrossRef]
  15. Gao, Y.; Guo, J. Research on emergency supplier selection method based on interval q-order orthogonal fuzzy sets. Digit. Manuf. Sci. 2023, 21, 237–242. [Google Scholar]
  16. Liu, L.; Zhu, Q.; Yang, D.; Liu, S. Extended Multicriteria Group Decision Making with a Novel Aggregation Operator for Emergency Material Supplier Selection. Entropy 2023, 25, 702. [Google Scholar] [CrossRef]
  17. Haung, G.; Lei, H. Comprehensive evaluation of emergency logistics suppliers based on TOPSIS method. Saf. Sci. J. 2024, 34, 217–224. [Google Scholar]
  18. Liu, H.; Kang, Q.; Zou, Y.; Yu, S.; Ke, Y.; Peng, P. Research on Comprehensive Evaluation Model of Metal Mine Emergency Rescue System Based on Game Theory and Regret Theory. Sustainability 2023, 15, 10879. [Google Scholar] [CrossRef]
  19. Wang, W.; Li, H.; Hou, X.; Zhang, Q.; Tian, S. Multi-Criteria Evaluation of Distributed Energy System Based on Order Relation-Anti-Entropy Weight Method. Energies 2021, 14, 246. [Google Scholar] [CrossRef]
  20. Ju, W.; Wu, J.; Kang, Q.; Jiang, J.; Xing, Z. Fire Risk Assessment of Subway Stations Based on Combination Weighting of Game Theory and TOPSIS Method. Sustainability 2022, 14, 7275. [Google Scholar] [CrossRef]
  21. Shang, L.; Tan, Q. Evaluation of emergency logistics suppliers based on grey entropy model. Stat. Decis. Mak. 2013, 3, 45–47. [Google Scholar]
Figure 1. Evaluation indicators for emergency supplier.
Systems 13 00493 g001
Figure 2. The calculation steps of the evaluation model.
Systems 13 00493 g002
Figure 3. Comparison of first-level indicators’ weights calculated by entropy weight method and G1 method.
Systems 13 00493 g003
Figure 4. Comparison of results of single weighting and combined weighting of first-level indicators.
Systems 13 00493 g004
Figure 5. Comparison of results of AHP and G1 method.
Systems 13 00493 g005
Figure 6. Comparison of results of three combined weighing methods.
Systems 13 00493 g006
Table 1. Values of relative importance ratio.
r j Relatively Important Degree
1.0 C i 1  is equally important as C i
1.1 C i 1  is between equally as and slightly more important than C i
1.2 C i 1  is slightly more important than C i
1.3 C i 1  is between slightly and significantly more important than C i
1.4 C i 1  is significantly more important than C i
1.5 C i 1  is between apparently more important and strongly more important than C i
1.6 C i 1  is strongly more important than C i
1.7 C i 1  is between strongly more important and extremely more important than C i
1.8 C i 1  is extremely more important than C i
Table 2. Attributes of each secondary indicator.
Objective LayerCriterion LayerIndicator LayerInterpretation
Comprehensive capacity of emergency suppliesMaterial quality ATechnological process A1Qualitative and positive
Product qualification rate A2Quantitative and positive
Return processing capacity A3Quantitative and positive
Cost control BPrice cost B1Quantitative and negative
Processing cost B2Quantitative and negative
Transport cost B3Quantitative and negative
Inventory cost B4Quantitative and negative
External situation CEnterprise reputation C1Qualitative and positive
Geographical superiority C2Qualitative and positive
Order fulfillment C3Quantitative and positive
Information level C4Qualitative and positive
Quality assurance capacity C5Qualitative and positive
Development potential C6Qualitative and positive
Emergency flexibility DTime flexibility D1Qualitative and positive
Product flexibility D2Qualitative and positive
Quantity flexibility D3Qualitative and positive
Table 3. Details of suppliers A, B, and C.
Indicator (Unit)Supplier ASupplier BSupplier C
Technological process (decimal system)697
Product qualification rate/%89.294.191.3
Return processing capacity/%1.22.61.7
Price cost/(CNY · t 1 )271.0282.5297.5
Processing cost/(CNY · t 1 )292728
Transportation cost/(CNY · t 1 )213.5234.6247.8
Inventory cost/(CNY · t 1 )171816
Enterprise reputation/(decimal system)778
Geographical advantages(decimal system)697
Order fulfillment/%97.899.695.1
Informatization level (decimal system)688
Quality assurance capacity/%0.60.70.4
Development potential (decimal system)787
Time flexibility/%94.687.290.5
Product flexibility/%93.190.992.1
Quantity flexibility/%93.689.790.2
Table 4. Weights of indicators.
IndicatorSubjective WeightObjective WeightCombined Weight
Technological process A10.1990.060.1583
Product qualification rate A20.1660.0540.138
Return processing capacity A30.1110.0450.939
Price cost B10.0220.0490.0296
Processing cost B20.0160.0510.0254
Transport cost B30.0250.0570.0338
Inventory cost B40.0410.0510.0434
Enterprise reputation C10.0180.1220.0486
Geographical superiority C20.0310.060.0393
Order fulfillment C30.0470.0490.0476
Information level C40.0120.0450.0212
Quality assurance capacity C50.040.0470.0406
Development potential C60.0070.1220.0357
Time flexibility D10.1380.0540.1153
Product flexibility D20.0510.050.0507
Quantity flexibility D30.0760.0830.0786
Table 5. The evaluation results of suppliers.
Alternative Supplier d + d S Sort Results
A0.2270.1820.44512
B0.1640.2470.60141
C0.2090.1220.36853
Table 6. Comparison of results of three combined weighing methods.
Combination MethodAdditive SynthesisMultiplicative SynthesisGame Theory
Results ( 0.318 ,   0.156 ,   0.3 ,   0.226 ) ( 0.352 ,   0.1 ,   0.319 ,   0.229 ) ( 0.3902 ,   0.1322 ,   0.233 ,   0.2446 )
Table 7. Comparison of fluctuations in three combined weighing methods.
Combination MethodAdditive SynthesisMultiplicative SynthesisGame Theory
Fluctuation0.000440.0005030.00018
Disclaimer/Publisher’s Note: The statements, opinions and data contained in all publications are solely those of the individual author(s) and contributor(s) and not of MDPI and/or the editor(s). MDPI and/or the editor(s) disclaim responsibility for any injury to people or property resulting from any ideas, methods, instructions or products referred to in the content.

