Abstract
Many traffic conflicts on the roads are caused by a small proportion of drivers. Currently, there are few studies exploring the time-varying patterns of driving behavior among these drivers. This paper proposes a generic time-series analytical framework and uses it to analyze the driving behavior patterns of many high-risk drivers, which provides a theoretical and targeted basis for vehicle warning systems. Specifically, the natural trajectory time-series data in the rear-end conflict process from congested highway sections were first obtained. Secondly, K-medoid clustering was utilized to obtain the quantitative driving behavior sequence from the trajectory. Thirdly, the driving behavior sequence was transformed into a graph structure by the co-occurrence matrix. Graph theory and Markov theory were used to analyze the obtained graph to achieve the goal of analyzing the time-varying patterns of driving behavior. The analysis found that the driving behavior transition graph network of high-risk drivers on congested highway sections does not exhibit the small-world property and this suggests that during the conflict process, the driver is unable to quickly transition between states. Additionally, vehicles consistently evolve into a rear-end conflict state along a fixed driving behavior transition route, which indicates that the causes of conflicts in congested road sections are similar. Finally, the state change of the conflict process follows the Markov property, proving that the state during the conflict process can be predicted and controlled.
1. Introduction
The real-world traffic environment is highly complex, presenting significant challenges for conventional traffic management. Targeted traffic management policies offer a potential solution. However, developing effective policies requires detailed classification of traffic environments or driver types, enabling in-depth exploration and characterization of patterns associated with specific scenarios or driver cohorts.
Traditional traffic safety analysis and management have predominantly relied on crash data. Yet, such data are scarce and require extensive time to collect [1,2]. Studies have demonstrated the feasibility of using traffic conflict techniques for road safety analysis [3,4,5], as a strong correlation exists between conflicts and crashes [6]. Compared to crash data, traffic conflict data are significantly more accessible [6,7,8]. Consequently, an increasing number of researchers are investigating traffic safety through traffic conflict technologies.
Extensive research utilizing traffic conflict techniques has demonstrated significant correlations between traffic states on road segments—including traffic flow, occupancy, average speed, and vehicle composition—and environmental factors such as weather, with the occurrence of traffic conflicts [9,10,11,12]. Generally, higher traffic volumes and occupancies, coupled with greater fluctuations in average speed and increased traffic flow heterogeneity, are associated with a higher incidence of conflicts and potential accidents. While conflict frequency may rise under congested conditions, only a small proportion of vehicles are typically involved in such events. This suggests that deteriorating traffic conditions predominantly impact a limited subset of drivers. Consequently, analyzing the driving behaviors of those involved in rear-end conflicts offers valuable insights. Such investigations can elucidate characteristic behavioral patterns among these drivers and inform targeted traffic safety interventions.
Previous studies have examined conflict evolution from diverse perspectives. While investigations [13,14,15] have analyzed the propagation chain of inter-vehicle conflicts, they paid limited attention to the microscopic behavior of individual vehicles. In Ref. [9], the authors segmented road sections and examined risk evolution both within and between these segments. Similarly, the authors in [16] subdivided sections into finer spatial blocks to explore spatio-temporal risk evolution across blocks. A recent work [17,18] further investigated the influence of factors like speed variance and average speed of involved vehicles on conflict likelihood. However, these studies collectively failed to characterize the entire, fine-grained conflict process. Critically, existing research has primarily focused on conflict risk evolution within specific spatio-temporal road segments, overlooking the specific drivers involved in conflicts and the time-varying patterns of driving behavior among these high-risk drivers.
To address this research gap, we conducted a comprehensive investigation into the rear-end conflict process within congested highway segments. This study explicitly considers the temporal evolution of driver behavior throughout the entire conflict sequence and accounts for the heterogeneity inherent in congested traffic flows. The primary contributions of this work are summarized as follows:
- An explainable time-series analysis framework: We propose a novel framework designed for the explainable analysis of time-varying patterns, enabling fine-grained interpretation of temporal dynamics.
- Heterogeneity-aware conflict analysis under congestion: Leveraging the proposed framework, we analyzed a substantial dataset of conflict processes occurring under heterogeneous congested traffic conditions. The resulting actionable insights provide more detailed and targeted guidance for enhancing vehicle collision warning systems.
- A transferable analytical paradigm: The developed framework establishes a methodological paradigm that can be readily adapted to support time-series analysis challenges in other research domains.
The rest of this paper is organized as follows. Section 2 reviews some related works about traffic conflict technology. In Section 3, graph theory and Markov theory are briefly introduced. The proposed explainable analysis framework for rear-end conflicts is described in detail in Section 4. Section 5 conducts experiment on a real traffic dataset and presents discussions about the results. This paper is summarized, and some future directions are discussed in Section 6.
2. Related Work
Traffic conflict techniques have gained widespread recognition as valuable tools in traffic safety research. Current investigations into these techniques primarily focus on areas such as traffic conflict prediction, safety evaluation, and conflict analysis. Common methodological approaches include statistical models, machine learning, and deep learning. These methods universally rely on extensive datasets, extracting relevant features and employing suitable algorithms to address specific research challenges. Findings derived from such studies inform the formulation of evidence-based traffic management measures.
2.1. Statistical Methods
Traditional statistical models usually receive some traffic characteristics of a specific road section or period as input to the model and then obtain a classifier that can output a conflict probability. These methods include logistic regression, linear regression, and so forth. Sensitivity analysis and feature importance are often used to identify factors that cause conflict. Their advantage is that they have good interpretability, which is why they are often used for factor analysis [19,20,21,22,23,24]. Simultaneously, these methods are often employed to deal with macroscopic traffic features, as they are unable to handle high-dimensional microscopic traffic characteristics such as vehicle trajectories. Therefore, they are difficult to use for fine-grained time-varying pattern analysis, and another reason is that they cannot handle time-series data.
2.2. Machine Learning and Deep Learning Methods
Machine learning (ML) and deep learning (DL) methodologies aim to extract latent features or approximate data distributions from large-scale traffic datasets. These approaches are frequently employed for microscopic conflict prediction and analysis. For instance, studies leverage camera image data for real-time conflict probability prediction [25,26,27,28,29,30,31], while others utilize neural networks to model the data distribution of vehicle trajectories for conflict severity assessment and prediction [32,33,34]. However, ML and DL methods face practical challenges, including insufficient generalization capability and limited interpretability [6,35]. Although adept at processing high-dimensional data like vehicle trajectories, the specific factors driving model determinations often remain obscure.
Risk field theory (RFT) is commonly applied to assess the spatiotemporal evolution of risk for traffic conflict safety evaluation [21]. While RFT quantifies risk levels within defined spatiotemporal boundaries, it typically does not account for the specific microscopic evolution process of rear-end conflicts. Regarding conflict formation, some research has investigated the macro-scale spatial and temporal evolution of conflict risk [15,36,37]. Nevertheless, due to traffic flow heterogeneity, these findings may lack applicability in congested scenarios. Furthermore, these identified spatiotemporal risk patterns are derived from statistical aggregation across numerous vehicles, potentially overlooking the specific behavioral patterns of vehicles directly involved in conflicts.
As summarized in Table 1, while numerous researchers have proposed novel methods addressing various traffic safety problems and employed technical means to infer the causative factors of conflicts, limited attention has been given to the precise microscopic details characterizing rear-end conflict processes. This includes, for example, the evolution of driver behavior patterns during the conflict event itself.

Table 1.
Summary of commonly used methods in related work and introduction.
2.3. Analysis of the Causes of Conflict
A conflict causality analysis and risk prevention and control are core intelligent transport system research areas. In line with conventional car-following conflict modeling, the Random Parameters Logit Model (RPLM) was used at a two-way-stop controlled intersection in Aachen, Germany. It highlighted the significant impact of lead vehicle dynamic variables like speed and acceleration and first spotted the “unnecessary intentional deceleration” phenomenon, offering a theoretical basis for conflict intervention strategies [38].
To address rear-end collision risks, an evaluation framework combining deep neural networks and deep reinforcement learning was proposed. By dynamically adjusting the following vehicle speed, it effectively reduced rear-end collision probability, with its effectiveness verified by both simulation and real-vehicle data [39]. Further, an analytical approach based on time-to-collision (TTC) and its derivative (TTCD) was presented. It quantified the vehicle transition mechanism from safe to dangerous states, identified three typical transition modes, and confirmed that the following vehicle acceleration, speed difference, and acceleration difference between the two vehicles are significant TTCD-influencing factors [40].
To enhance the safety-distance model’s versatility, an improved car-following safety model introduced driver heterogeneity parameters. Using fuzzy theory to dynamically correct reaction time, it achieved precise safety-distance calculation under multiple traffic and driver-type conditions, underpinning active traffic-accident early warning [41].
In autonomous driving safety research, a pre-collision scenario classification method mapped and identified 24 high-incidence scenarios (98.1% accuracy), with rear-end and intersection conflicts identified as key risk scenarios. Causal- and correlation-based key-factor mining provided targeted paths for autonomous driving system optimization [42].
Special research on advanced driving systems (ADSs/ADASs) revealed that rear-end collisions accounted for 76.1% of cases in the NHTSA accident dataset. Ego vehicle speed, collision object motion state, and road type were identified as significant influencing factors. These findings are highly instructive for system design standards and road-user training [43].
For improved mixed-traffic-flow safety, a hybrid control framework was macro-simulated. It demonstrated a positive correlation between connected and automated vehicle (CAV) penetration rate and road capacity. Under high penetration rates, the framework effectively suppressed traffic oscillations and reduced collision risks [44].
Regarding lane-changing maneuver safety early warning, a hybrid model combining Mexican Hat Wavelet (MHW) transform and genetic-algorithm-optimized XGBoost (GA-XGBoost) achieved precise failed lane-changing detection (94.55% accuracy). It revealed a strong link between high collision risks of target-lane trailing vehicles and failed lane changes [45].
3. Preliminary
3.1. The Driving Behavior Time-Varying Pattern Analysis Based on a Graph
The purpose of the paper is to explore the patterns of vehicle state changes during rear-end collision processes. Our strategy involves converting the trajectory time-series data during conflicts into a network view structure. Initially, we utilize clustering methods on trajectory data to obtain quantified behavioral states of vehicles, followed by the analysis of transitions between these quantified behavioral states. In terms of constructing the graph structure, we represent the conflict process in the entire dataset by establishing a directed weighted graph, with the vehicle behavioral states as nodes, the transitions between behavioral states as edges, and the frequency of these transitions as edge weights.
Subsequently, we must analyze the obtained network graph, which includes assessing the significance of behavioral states, identifying patterns in state transitions, and examining the overall characteristics of the graph. Specifically, we employed complex network theory and Markov theory. Next, we will delve into the underlying technical principles.
Complex networks are commonly used to model the evolution process of systems. There are some concepts related to graph and edge property analysis in complex network theory:
PageRank: The larger the PageRank value, the more important the node is. If a driving state node has a high PageRank score, it indicates that this driving state is crucial throughout the entire conflict process. Its formula is shown in (1).
where represents the set of nodes to node , and represents the number of directed edges connected by node .
Closeness centrality: Its calculation formula is shown in (2). A driving behavior state node with a high closeness centrality can more quickly influence other driving states.
where represents the average distance from node to the other node .
Small-world property: The small-world characteristics are determined by the shortest path and the aggregation coefficient of graph. The shortest path is calculated by Formula (3) and it represents the average of paths between any two nodes in the network. The aggregation coefficient is calculated by Formula (4) and it indicates whether a node is densely connected to its neighboring nodes. When the shortest path is long and the aggregation coefficient is small, it indicates that the network does not have small-world characteristics. In this paper, we utilize these two metrics to determine whether the conflict process network exhibits small-world characteristics.
where is node number and is the shortest distance between any state nodes.
where is the aggregation coefficient, represents the adjacency matrix of the network and represents the total degree of state node .
Through these analysis methods, we can obtain the critical driving states during the conflict process and the transfer relationships between these states and conduct an explainable analysis of the conflict process accordingly.
3.2. Markov Property Analysis of Behavior Sequence
To explore the stochastic process of vehicle driving behavior during rear-end collisions, we conducted a statistical analysis of the changes in driving direction and frequency, resulting in the derivation of a co-occurrence matrix for driving behavior. The co-occurrence matrix, resembling a transition matrix, requires assessment to ascertain its adherence to Markovian properties. The Markov test can be used to analyze whether a discrete sequence satisfies a stochastic process, often using chi square statistics for testing.
Based on frequency transition matrix and probability transition matrix , we can construct chi square statistics as Formula (5).
where is the number of states, and are the transition probabilities and frequencies from state to state, respectively, and is the boundary probability, which is calculated by Formula (6).
If the chi square statistic of the driving behavior sequence during the conflict process is less than the value, it indicates that the conflict process satisfies the Markov property.
4. Methodology
4.1. Problem Definition
Analyzing conflict dynamic change mechanism under temporal effects can provide a better understanding of traffic conflict. Its purpose is to analyze the time-varying relationship during the process based on the natural trajectory times series data of vehicles before the conflict occurs by using relevant technical methods, such as to analyze the quantitative time-varying relationship of driving patterns. More specifically, the fine-grained variation patterns of headway, velocity, and acceleration in the time dimension during the conflict process are explored in this paper.
4.2. The Explainable Analysis Framework of Conflict Process
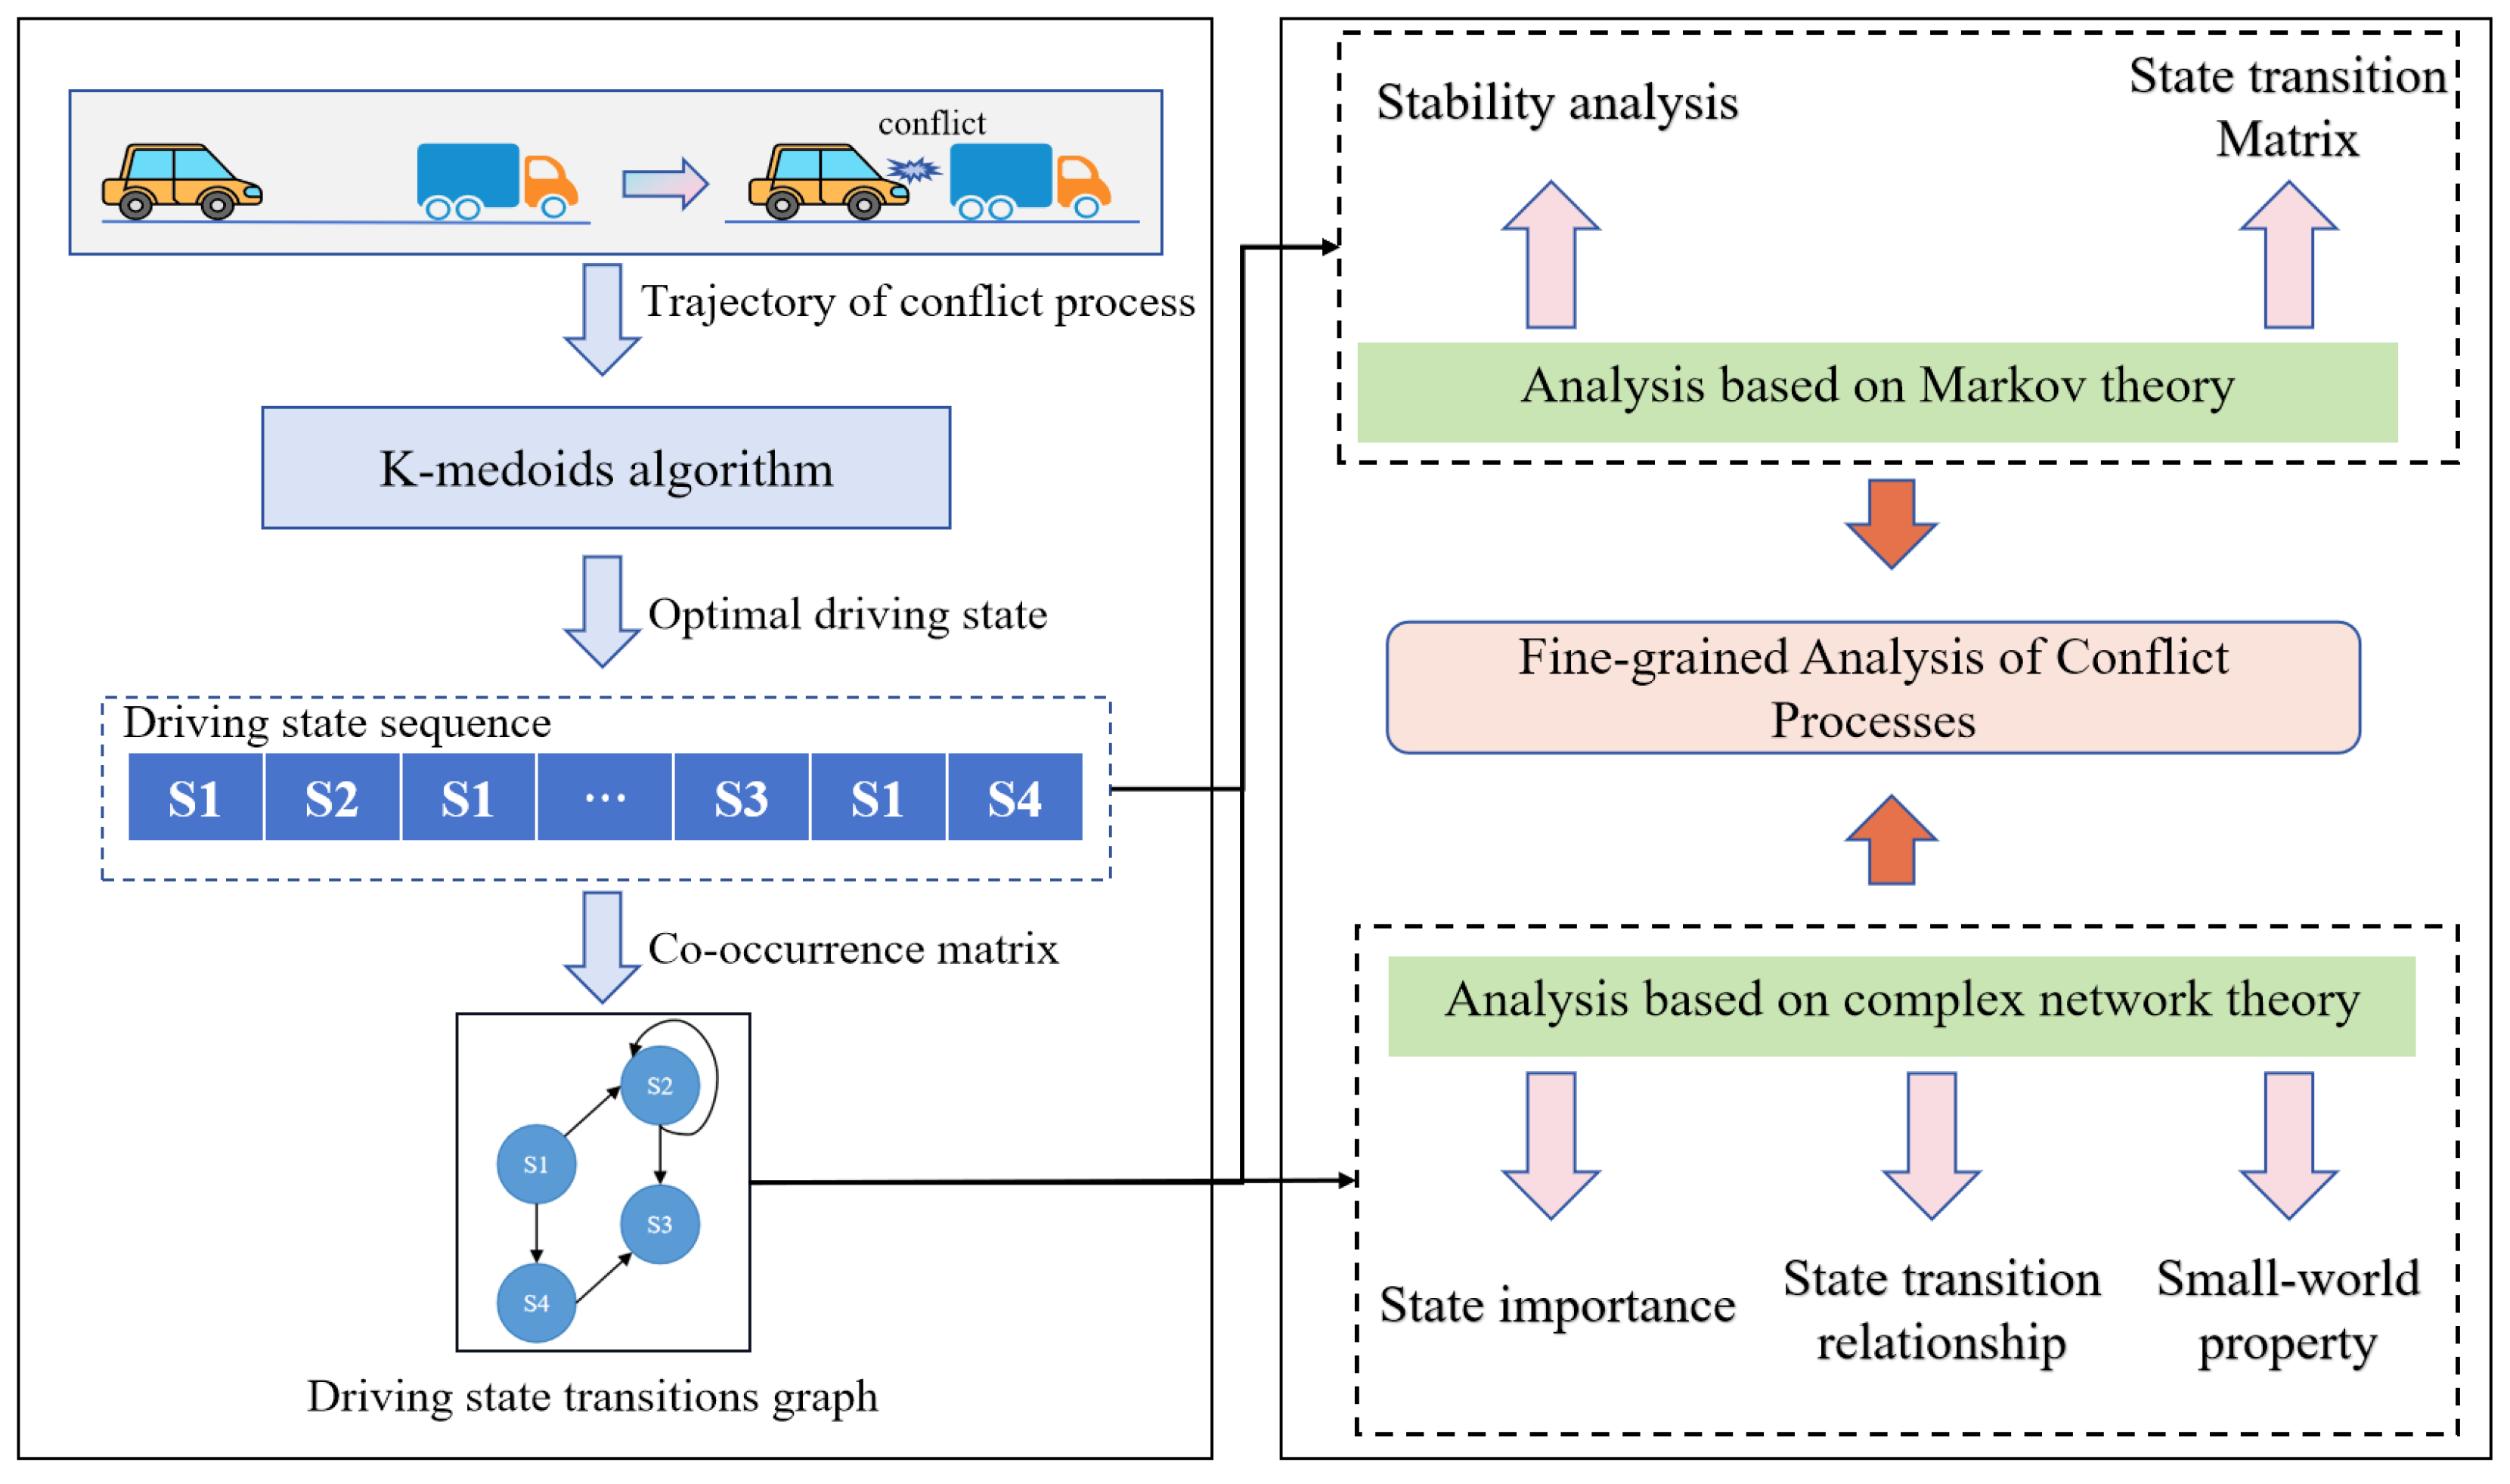
Figure 1 illustrates the conflict analysis framework proposed in this paper. The graph structure generation flowchart is shown in the left half, while the interpretability analysis of the driving state sequences and graph structure is shown in the right half.
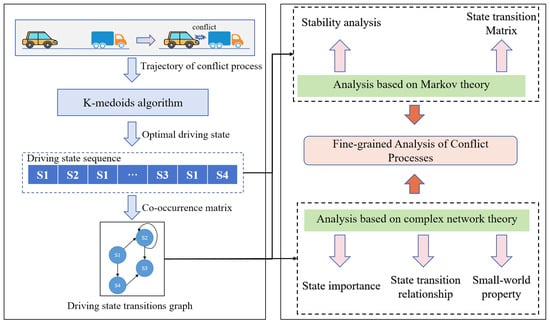
Figure 1.
The explainable analysis framework for rear-end conflicts.
Upon identifying a conflict, we preserved the trajectories leading up to the conflict and systematically traversed the entire dataset, yielding hundreds of statistically significant trajectory records. Subsequently, we clustered the mean values of three features—vehicle speed, headway distance, and acceleration—within a 0.5 s time window to obtain quantitative driving behavior states for that time frame. Furthermore, by converting trajectory data into a sequence of driving states and conducting statistical analysis on this sequence, we derived a co-occurrence matrix. This matrix allowed us to construct the network structure of the conflict process in the dataset, unveiling its intricate complexity through a network graph. To obtain driving states during conflict processes, K-medoids are employed in unsupervised clustering. The ideal number of clusters is then ascertained using the Calinski–Harabasz score. Better clustering is indicated by a higher Calinski–Harabasz score.
On the right side of the illustration, the upper section features an analysis based on Markov theory, while the lower section presents an analysis rooted in complex network theory. These analyses primarily focus on the significant driving behavior states during the conflict process, the stochastic nature of driving behavior transitions, and the overall characteristics of these transitions. On the right side of the illustration, the upper section features an analysis based on Markov theory, while the lower section presents an analysis rooted in complex network theory. These analyses primarily focus on the significant driving behavior states during the conflict process, the stochastic nature of driving behavior transitions, and the overall characteristics of these transitions.
5. Experiments and Results
5.1. Dataset Introduction
DJI’s Aerial Dataset for China Congested Highway and Expressway (AD4CHE) provides detailed natural trajectory data of vehicles on multiple highways and expressways in China [46]. Its frame rate is 30 per second and the final distance error does not exceed 10 cm. It has been used by many scholars for research in areas such as trajectory prediction and traffic safety analysis.
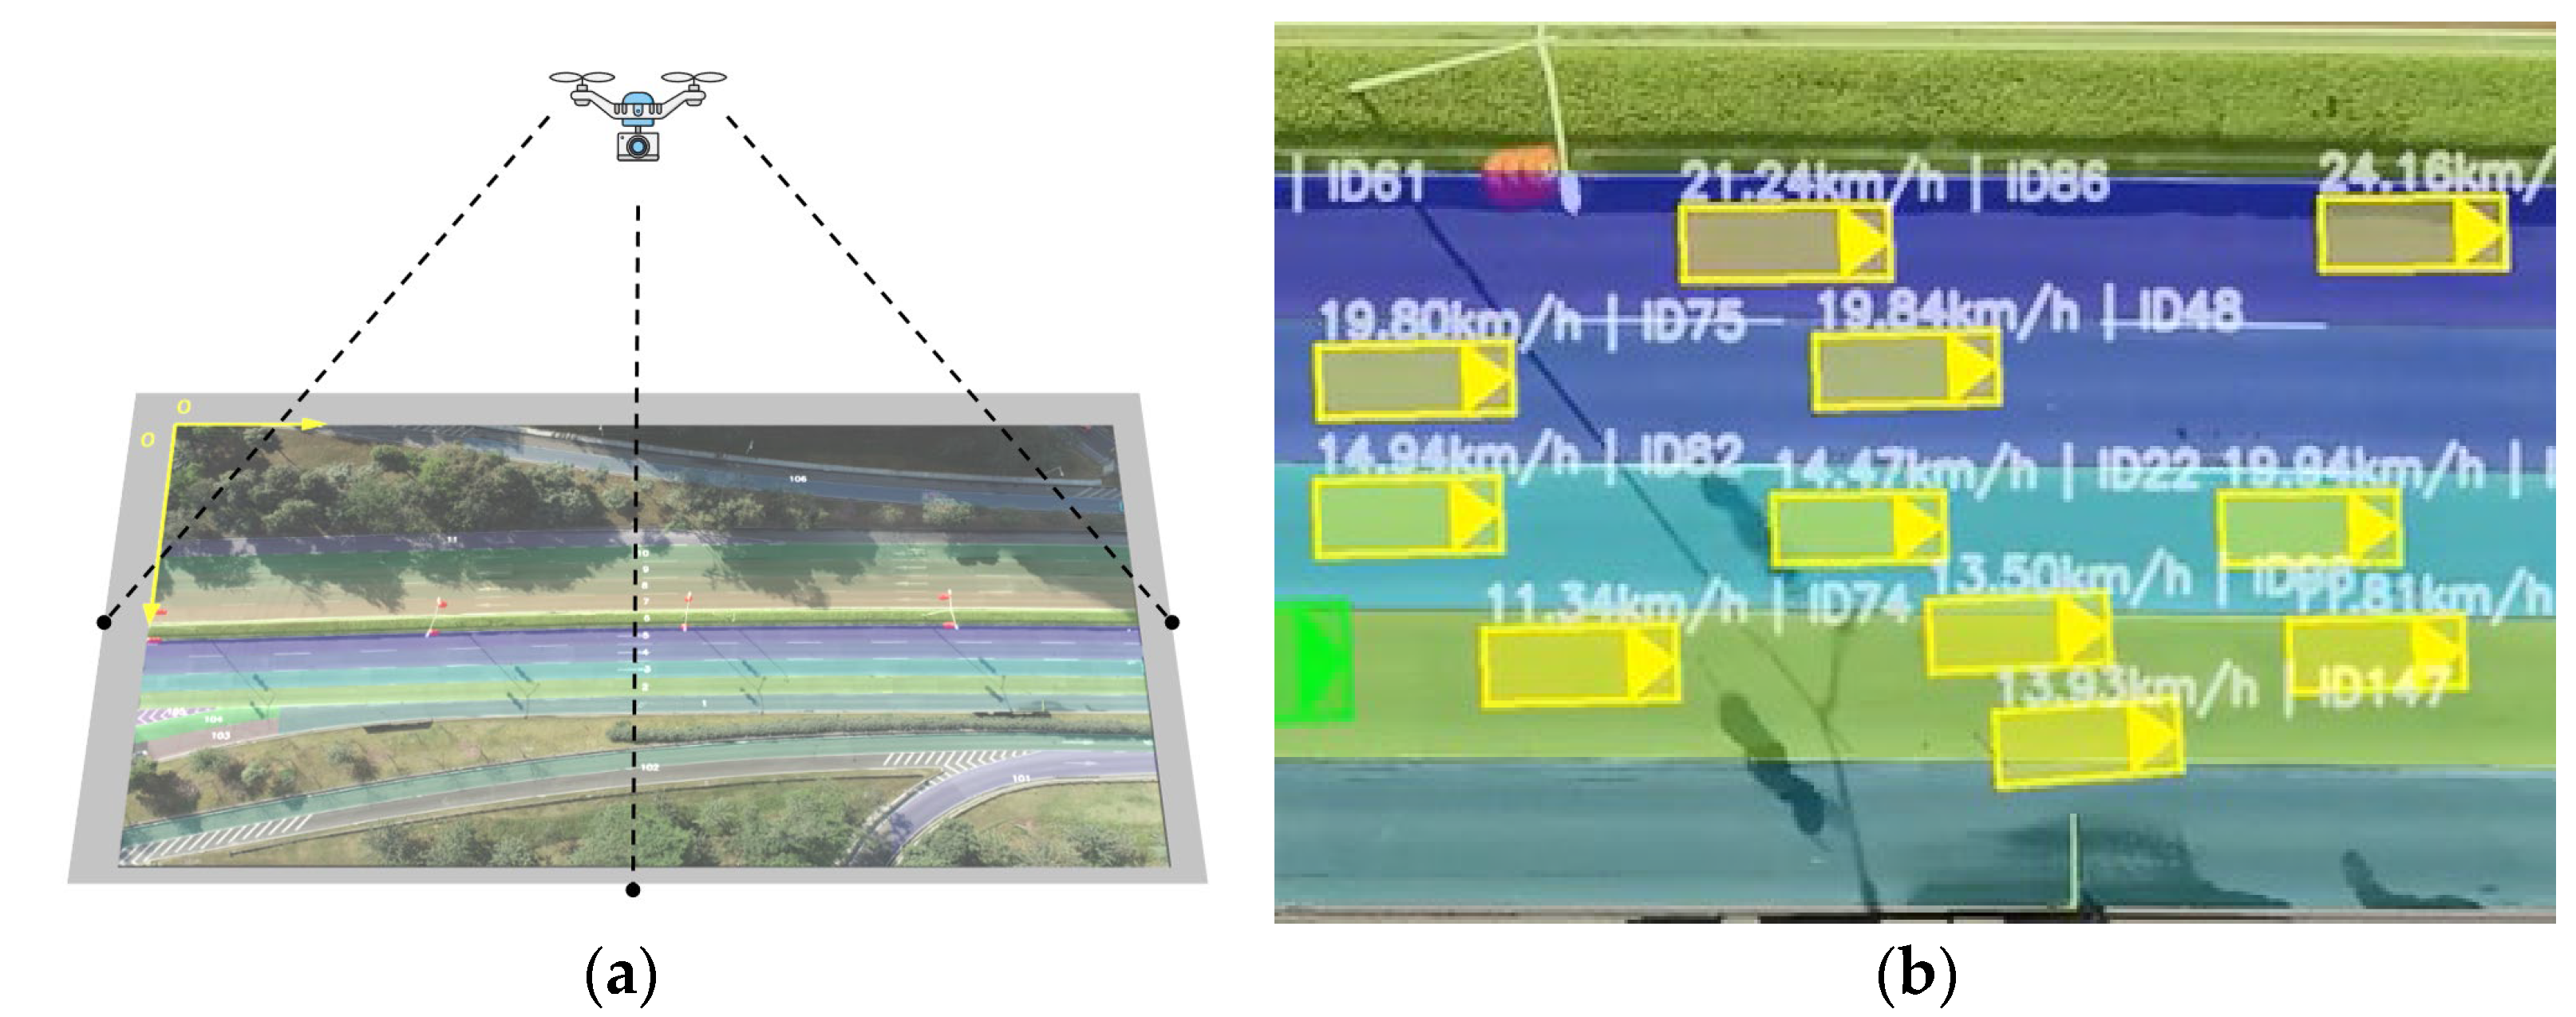
Figure 2a shows a schematic diagram of the overhead shooting of drone, in which over 60 h of videos were captured in different locations using this method. In Figure 2b, a specific road section is shown, and the vehicles obtained through YOLO target recognition show dense traffic and slow vehicle speeds, indicating congestion on the road section.

Figure 2.
AD4CHE data schematic diagram. (a) Schematic diagram of drone shooting; (b) congested traffic flow. The rectangular box here represents the vehicle target and the triangle represents the front of the vehicle.
Table 2 shows partial records of AD4CHE, which records various data of each frame of the vehicle and encompasses lateral and longitudinal velocity and acceleration (x is longitudinal and y is lateral), headway time and TTC. When TTC is less than 0, it indicates that the distance between the two vehicles is gradually widening.
Table 2.
Partial fields of AD4CHE.
For conflict identification, when TTC of vehicle is less than 1.5 s, we consider it a conflict [46]. In total, we obtained 257 rear-end conflicts from AD4CHE. We selected acceleration, headway, and lateral acceleration to describe driving behaviors of the rear vehicle. The reason is that they can fully record the following behavior during the conflict process, which was inspired by the car-following model. Finally, we take the moment of conflict occurrence as the zero-time point and then select the trajectory data within 5 s before the conflict [10].
5.2. Driving State Clustering
The optimal clustering number is determined by the Calinski–Harabasz score. Figure 3 shows the Calinski–Harabasz score of different clustering numbers. When the cluster number is 8, the Calinski–Harabasz score is the largest, which indicates that the optimal cluster number is 8. It means that the driving states during the conflict process can be roughly divided into 8 types. Therefore, we set the number of clusters for K-medoids to 8.
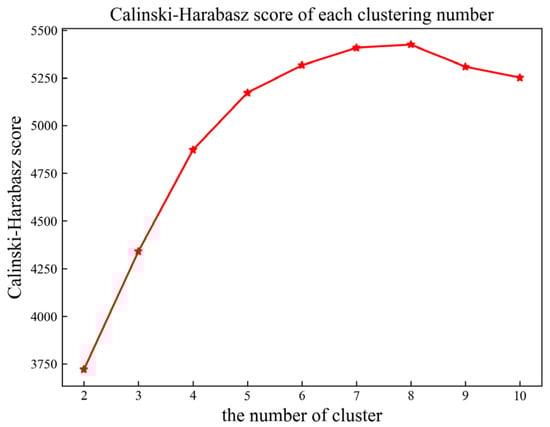
Figure 3.
The Calinski–Harabasz score of each clustering number.
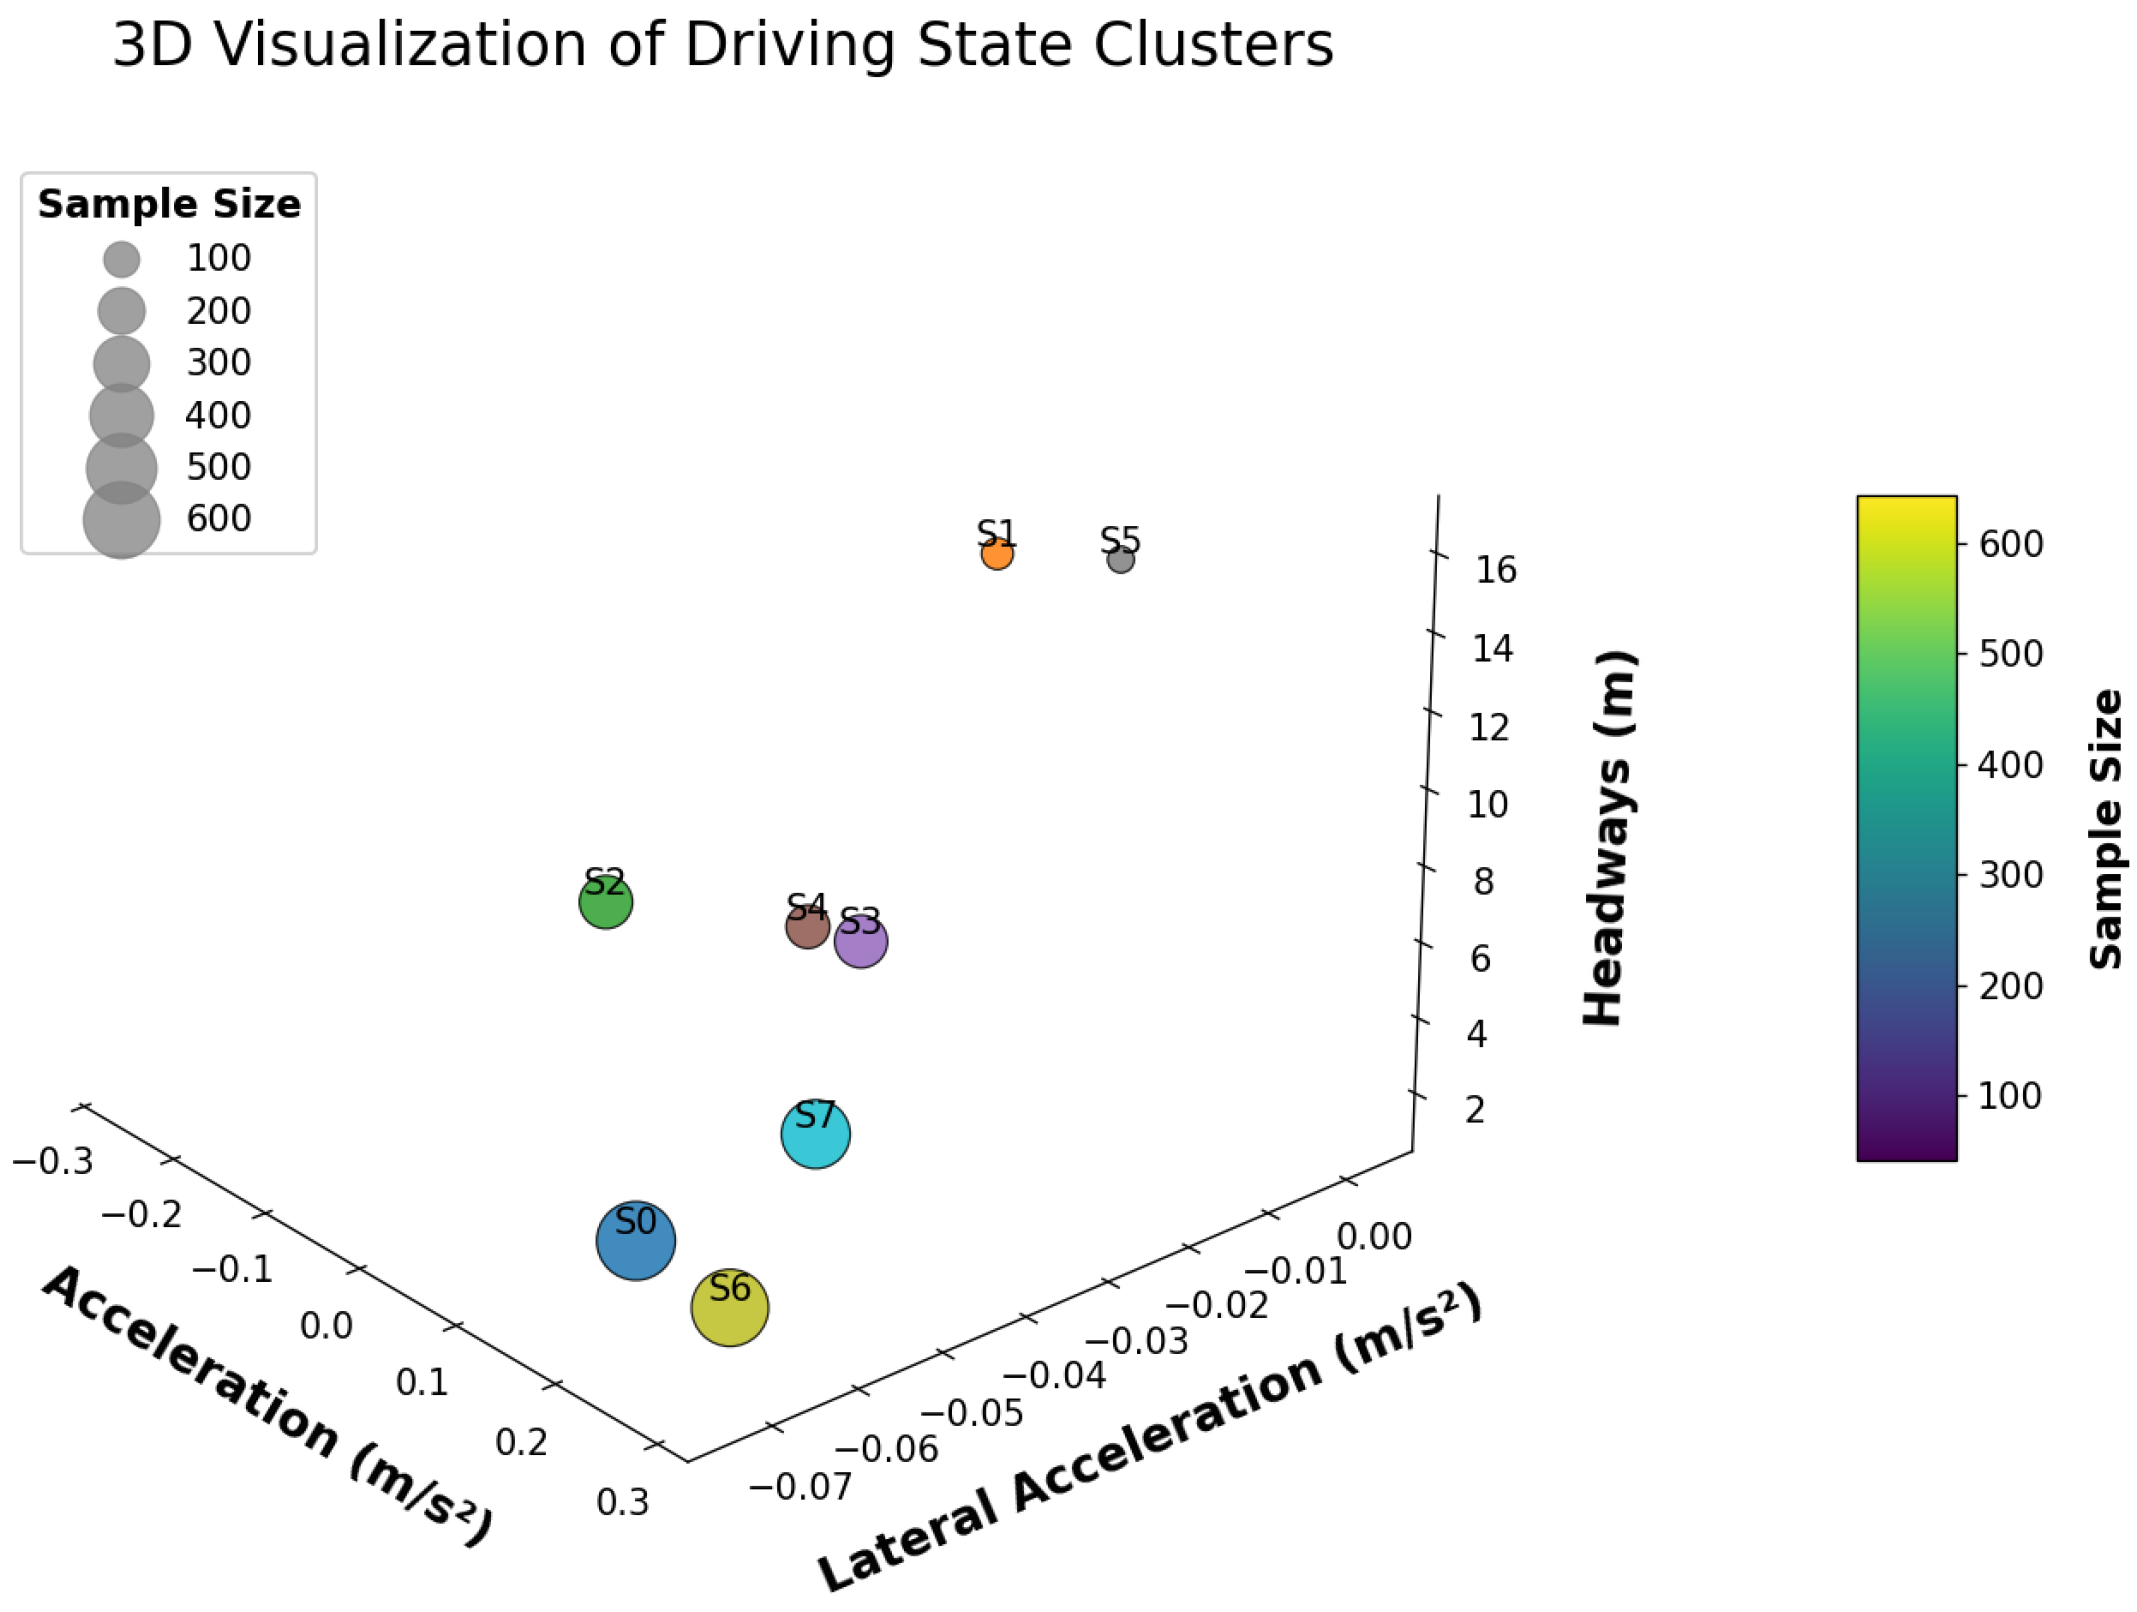
From Figure 4, it can be observed that the hierarchy between every cluster is clear, and the samples in each cluster are concentrated, proving that the clustering results are appropriate. Furthermore, the center of each cluster is shown in Table 3.
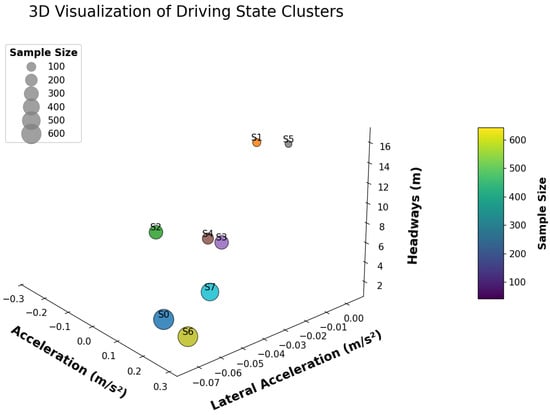
Figure 4.
The clustering results.
Table 3.
Cluster center for each driving state.
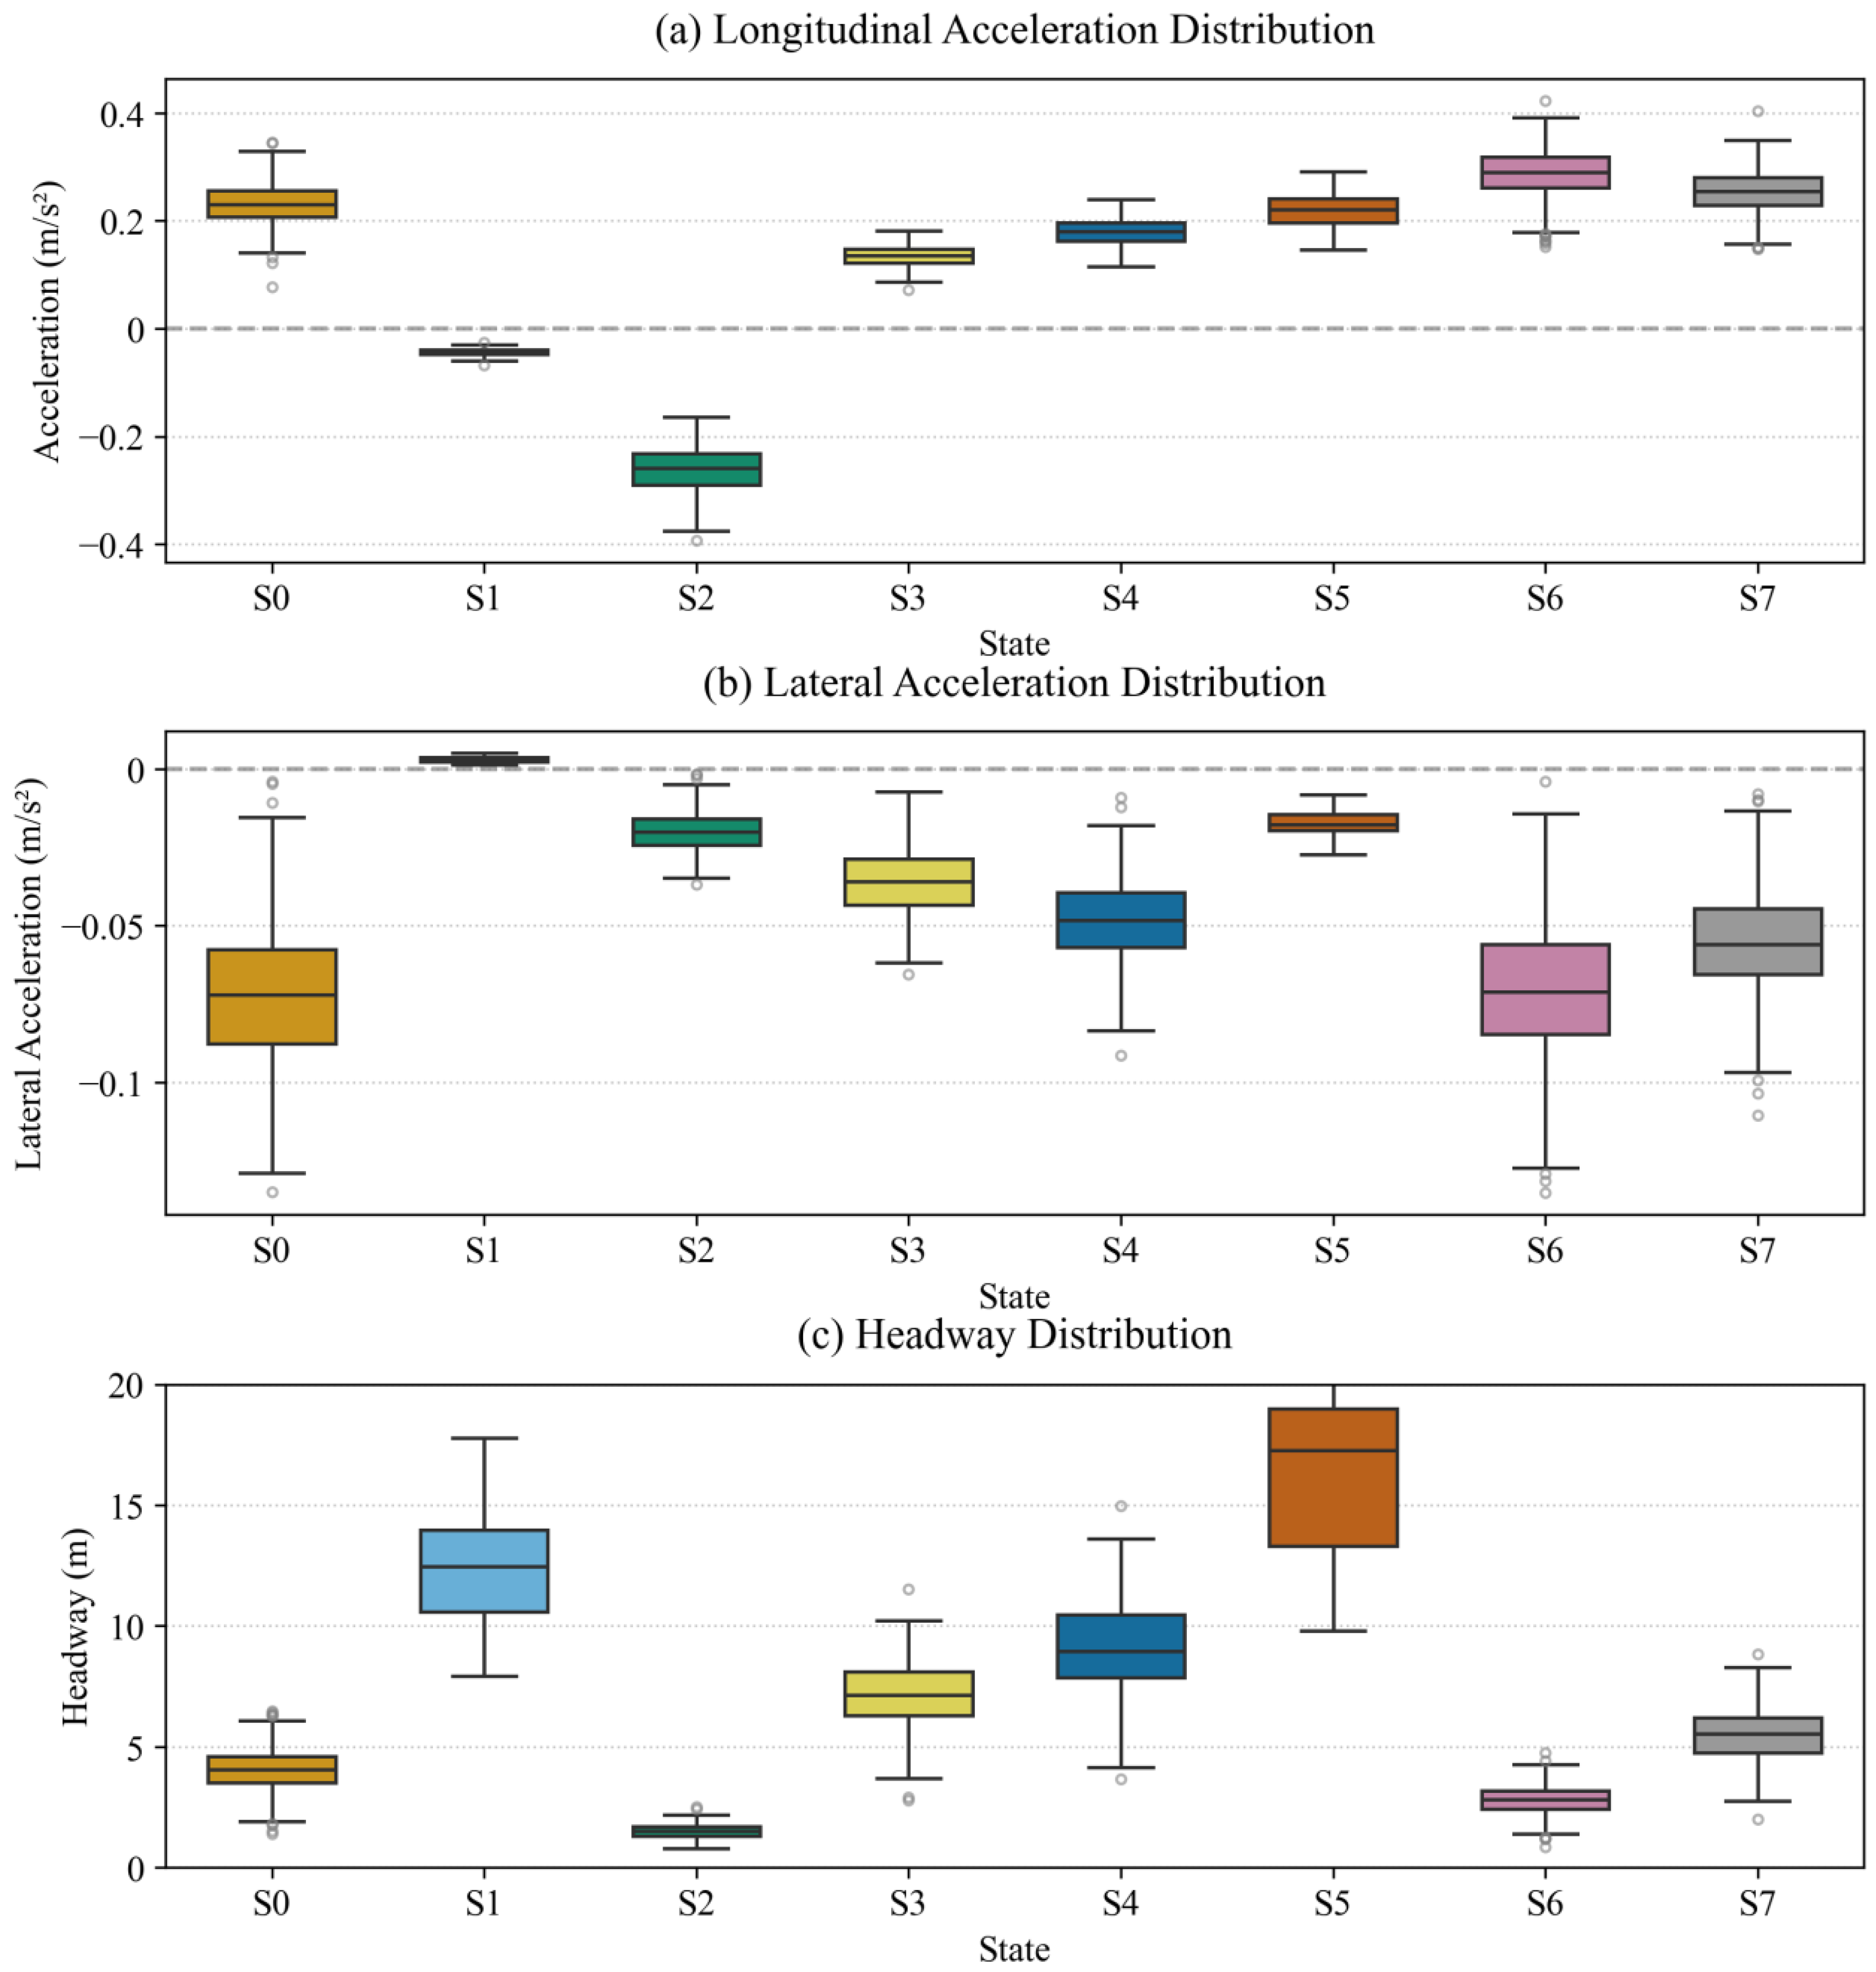
In Figure 5, the characteristics of different driving states are significantly different: S2 has the strongest deceleration (median acceleration −0.264 m/s2) and S6 has the most obvious acceleration (0.289 m/s2); S5 has the largest headway (16.35 m) and S2 has the smallest (1.52 m); lateral acceleration is mostly negative, where only S1 is slightly positive (0.003 m/s2). The sample size varies greatly (S0/S6 has more than 600 cases, S5 has only 41 cases), and the box plot distribution is consistent with the cluster center, verifying the distinguishability of the state. S1 has the smallest lateral acceleration fluctuation and the most stable lateral movement. The distribution morphology of the box plots of each state is consistent with the cluster center, verifying the physical distinguishability of the driving state. Among them, the lateral acceleration of the S1 state has the smallest range of change, indicating that its lateral movement is the most stable.
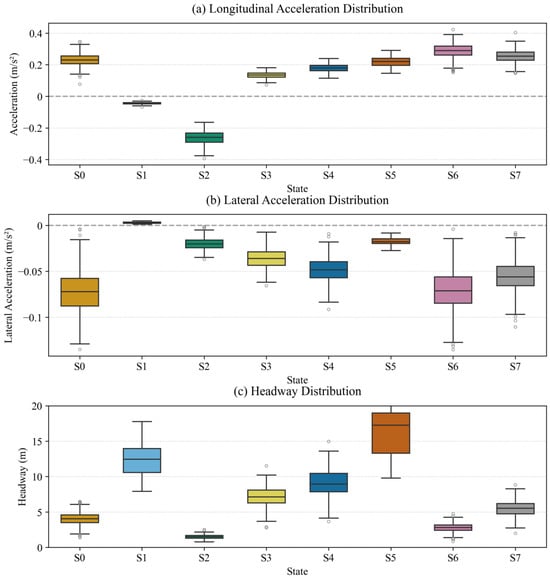
Figure 5.
Box plots of different states.
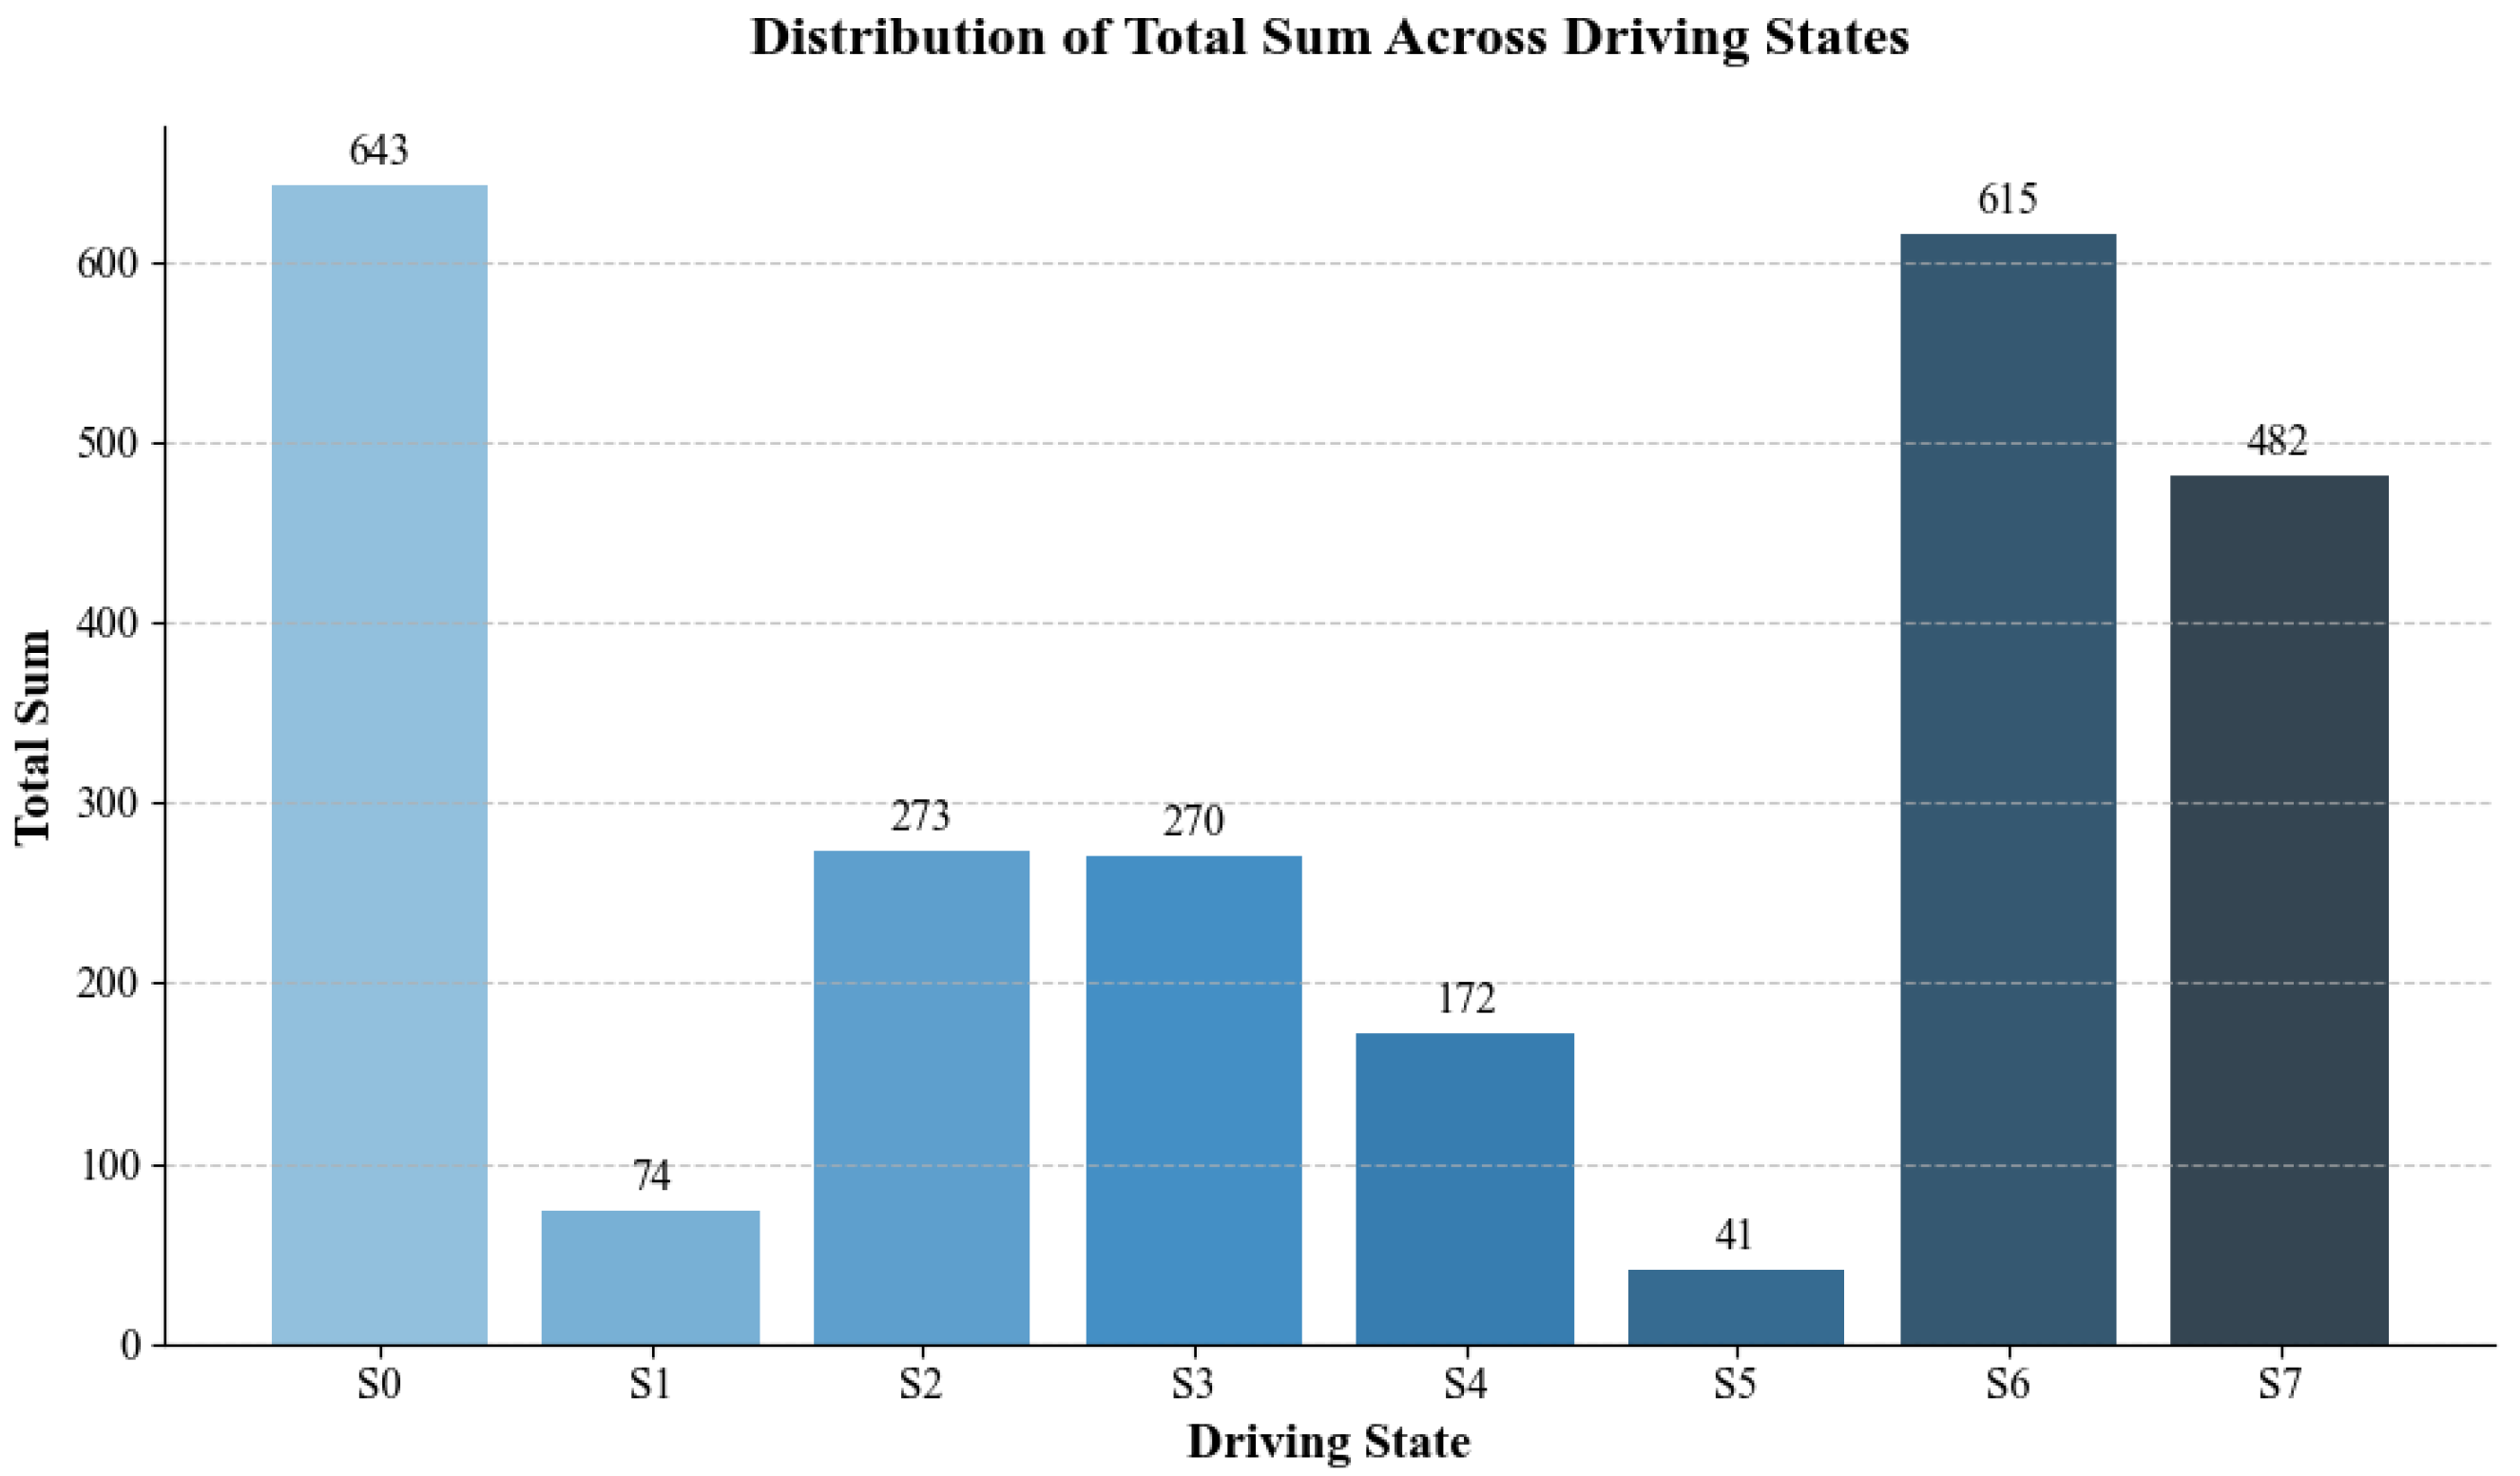
Figure 6 shows the total number of each category, with S0 and S6 having the highest number. These two states are also the closest states to conflict, indicating that most drivers will experience these two states before a conflict occurs.

Figure 6.
The sum for each driving state.
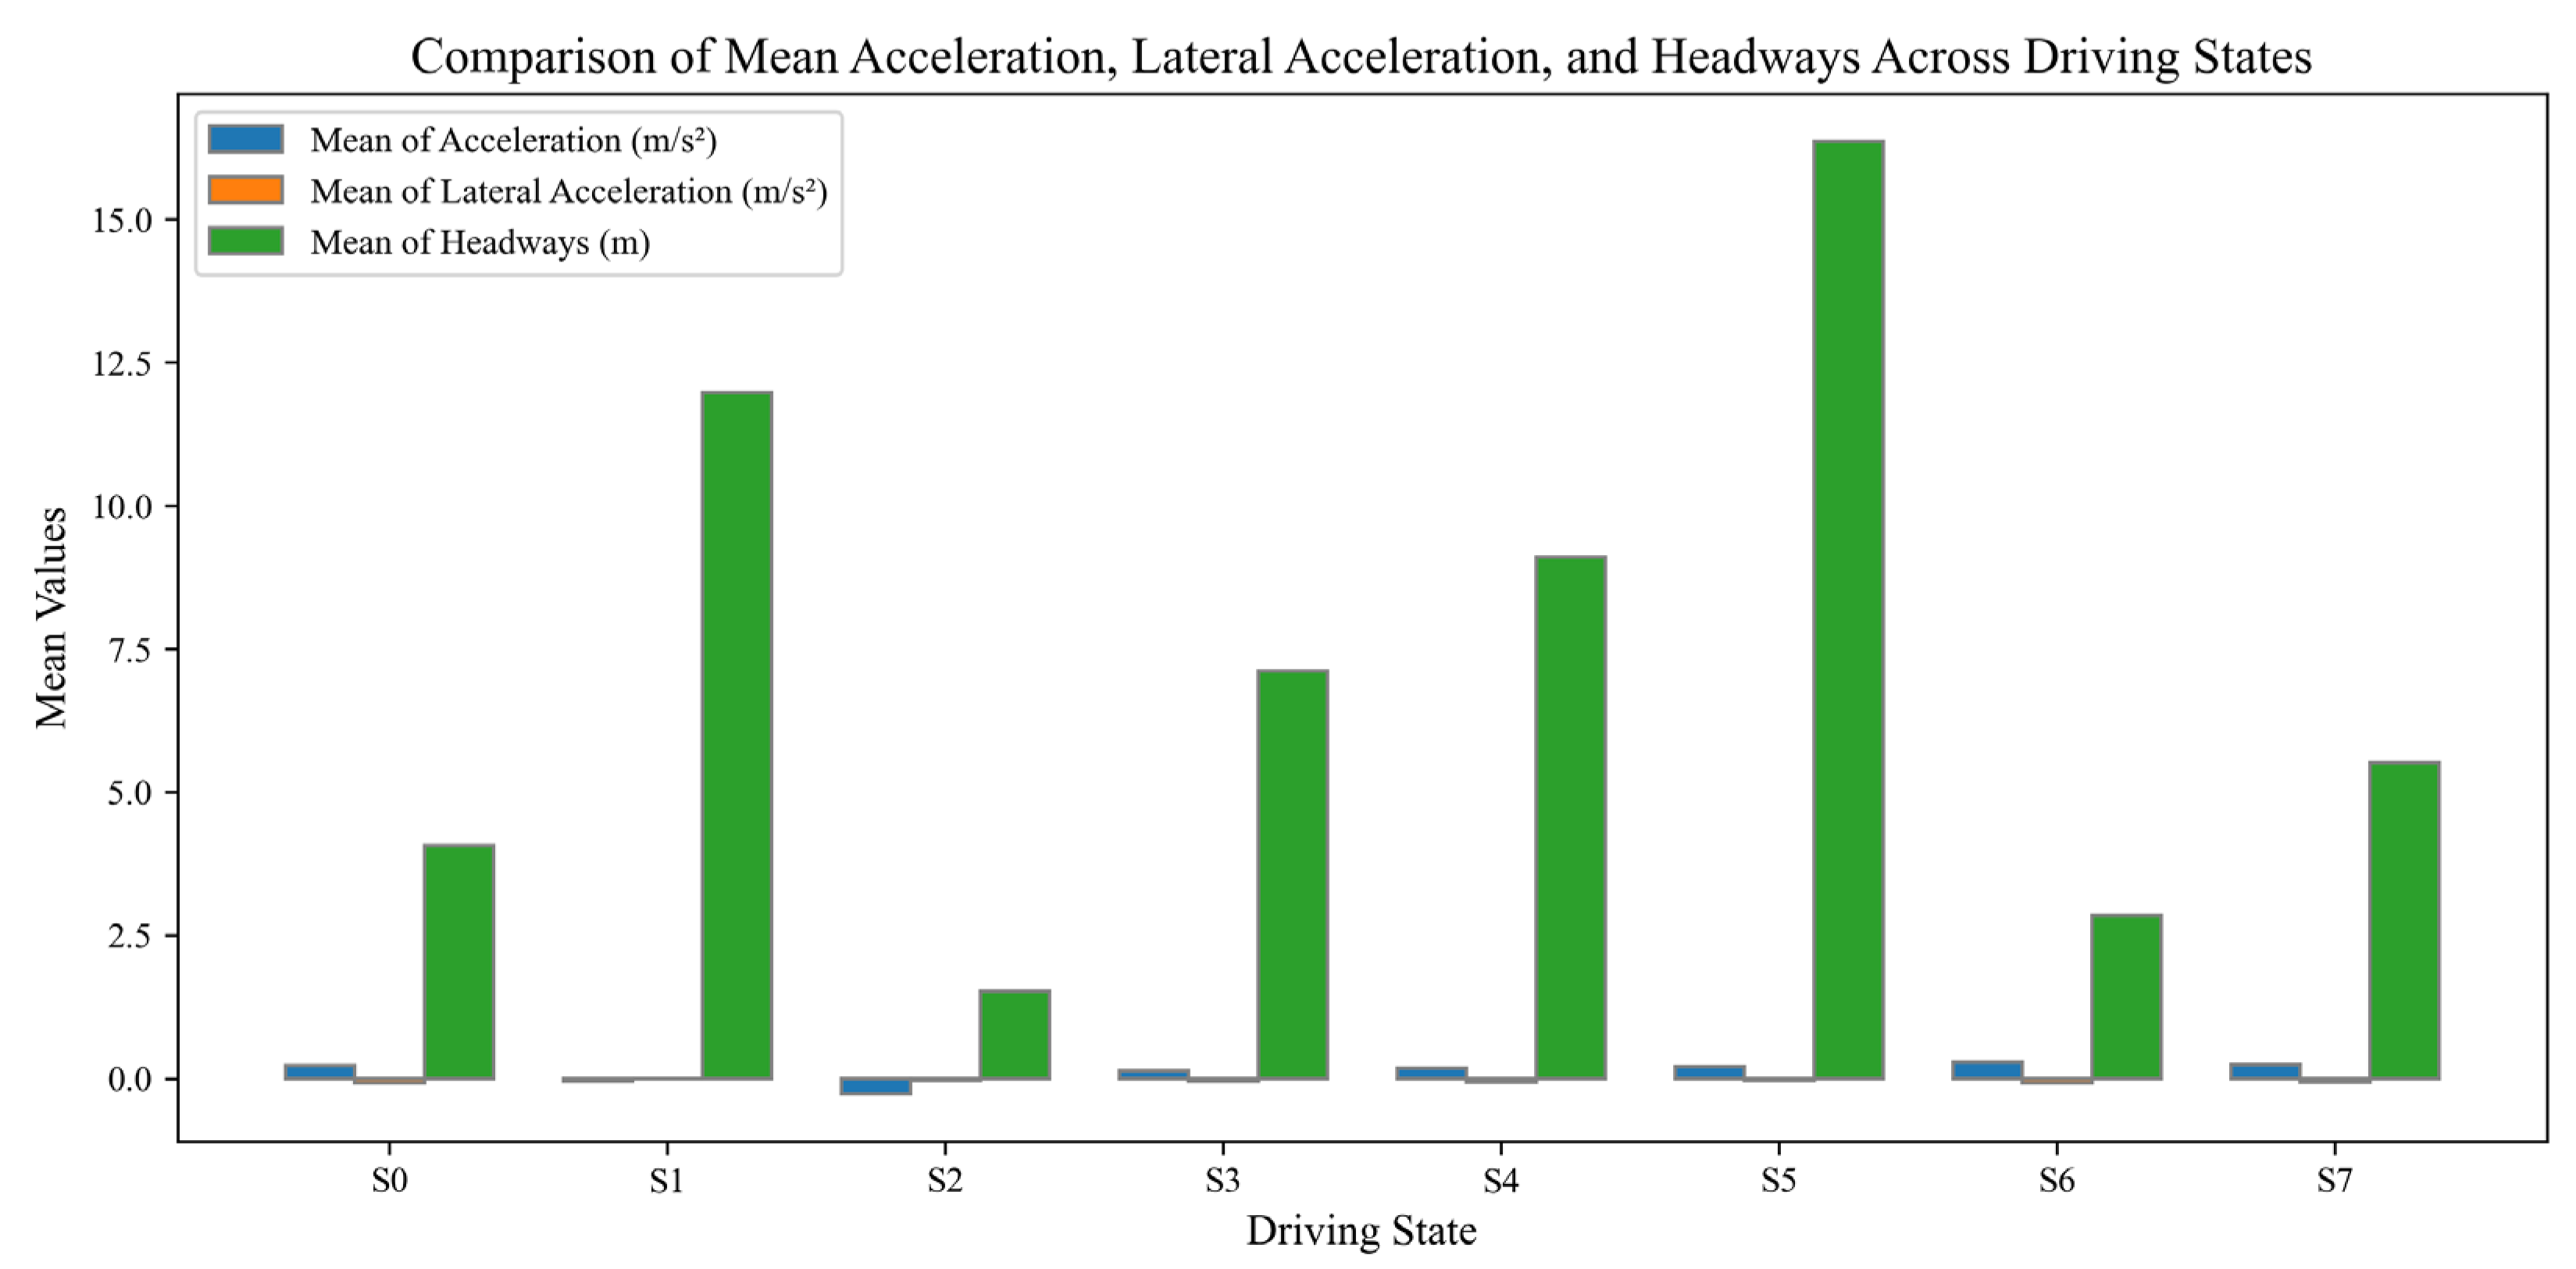
Figure 7 shows a bar chart of the average longitudinal acceleration, average lateral acceleration, and average distance between vehicles for each clustering state, which clearly shows the value size of each category. Among them, state 3 has the smallest headway and a larger deceleration, indicating that this state is closest to collision.

Figure 7.
The variable values each driving state.
5.3. Graph Analysis Results
5.3.1. Graph Construction and State Node Transition Analysis
To conduct a detailed study of the conflict process, we can explore the transfer patterns of driving states during the conflict process. Firstly, we need to count the number of transitions between driving states and construct a state transition matrix. We conducted statistics on the state transitions of each driving state sequence. For example, if a sample transitions from state S1 to state S4, add 1 to the position corresponding to the co-occurrence matrix. Then, we obtain the transition matrix between driving states by a co-occurrence matrix that is obtained through statistics, which is shown in Table 4.
Table 4.
Driving state transition co-occurrence matrix.
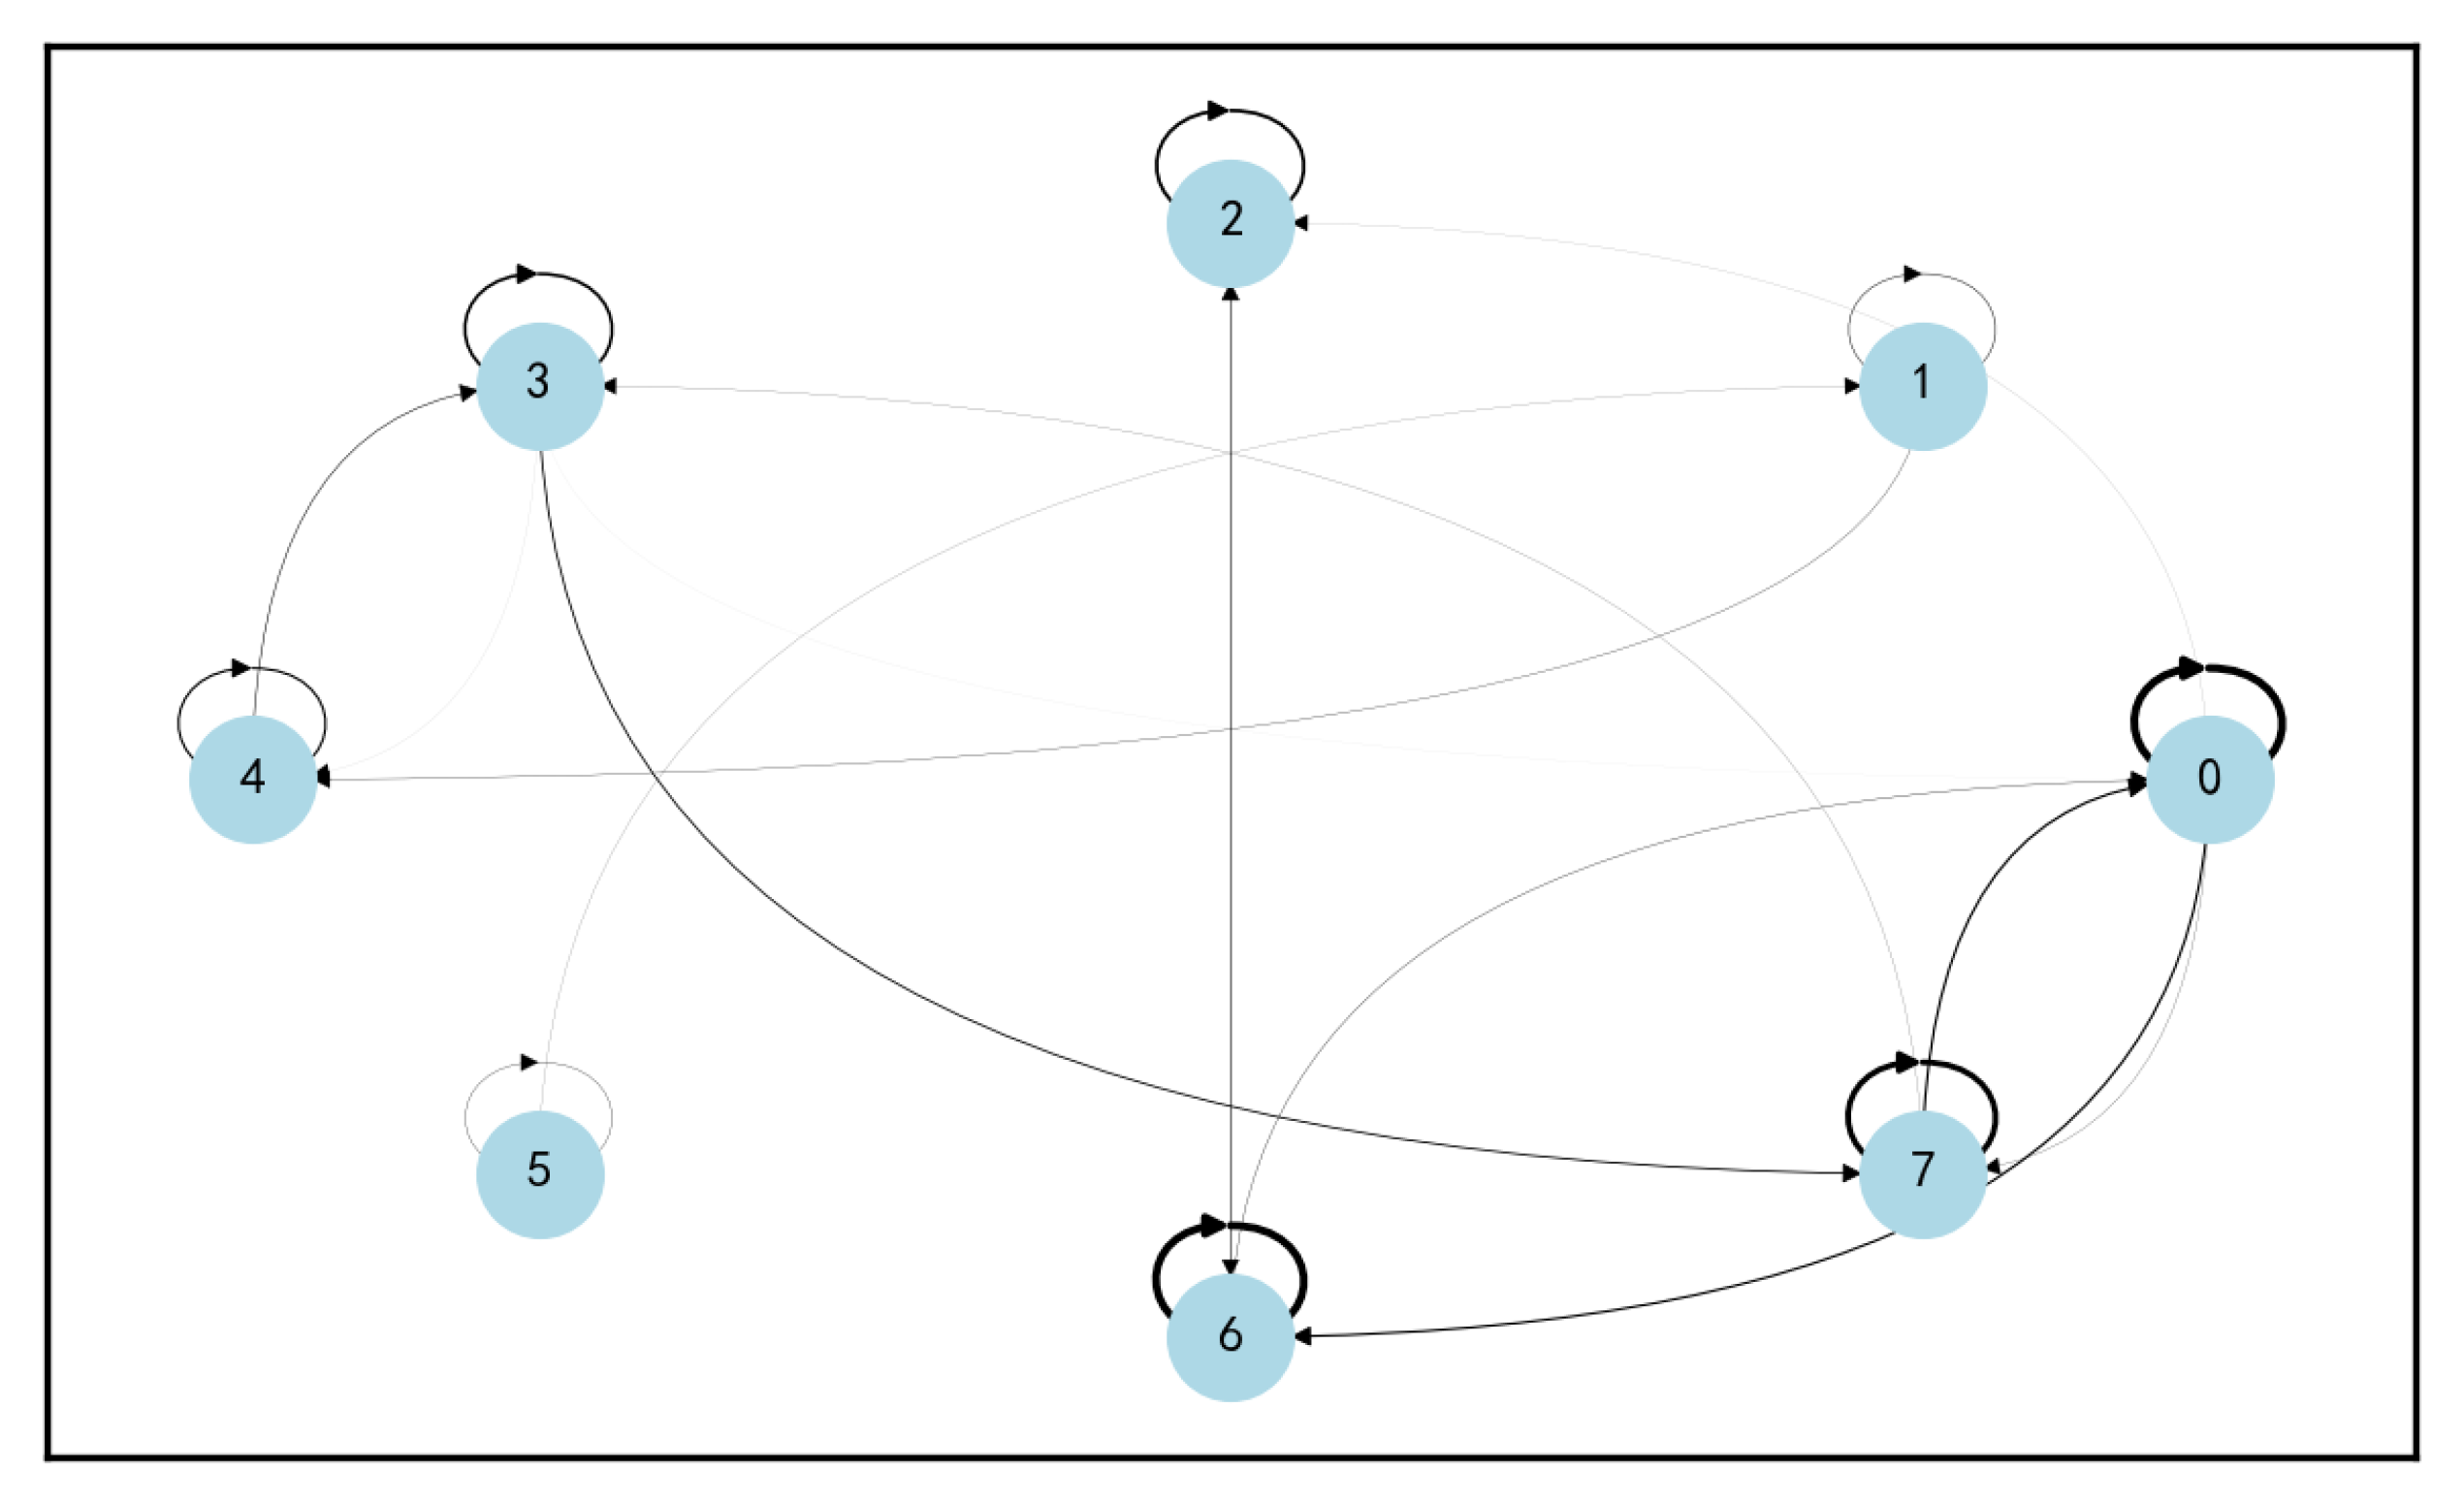
From Table 4, it can be observed that the key nodes (key driving states) are driving states 0, 2, 6, and 7. These key driving states are critical during conflict process because they have a more significant page rank and closeness centrality. During the conflict process, the driving state continues to change, and during the transformation process, it will either go through these critical key states or ultimately stay in them. Further, based on the state transition relationships in the co-occurrence matrix, we indirectly convert the conflict process into a graph structure.
In Figure 8, each node represents a driving state, and the weight of the edge is the number of transitions between two states. Next, we use complex network theory to analyze the graph structure to obtain key nodes (critical driving states) and determine whether the driving states’ transition process satisfies characteristics such as the small-world property.
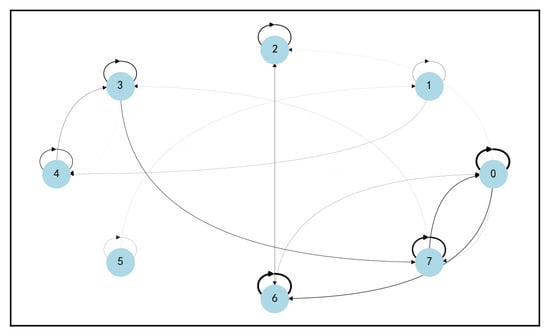
Figure 8.
Driving state transition graph structure.
In Figure 8, a thicker edge indicates more transitions, while a thinner edge indicates fewer transitions. We can also observe the patterns of state transitions. When the vehicle drives in the same state, the edge forms a self-loop. However, when the self-loop is broken and the current driving state transfers to another driving state, the driving state undergoes a sudden change. Here, “Free movement” generally refers to a vehicle moving slowly and steadily behind the vehicle ahead and “Sudden braking” refers to sudden emergency braking while following the vehicle ahead, which is often the result of congestion spreading from the lead vehicle to the rear.
From the thickness of the edges in Figure 6, S3–S7–S0–S6–S2 is the most prominent transition path. After maintaining S6 for a period, some vehicles transfer to S2, which is a state of emergency braking.
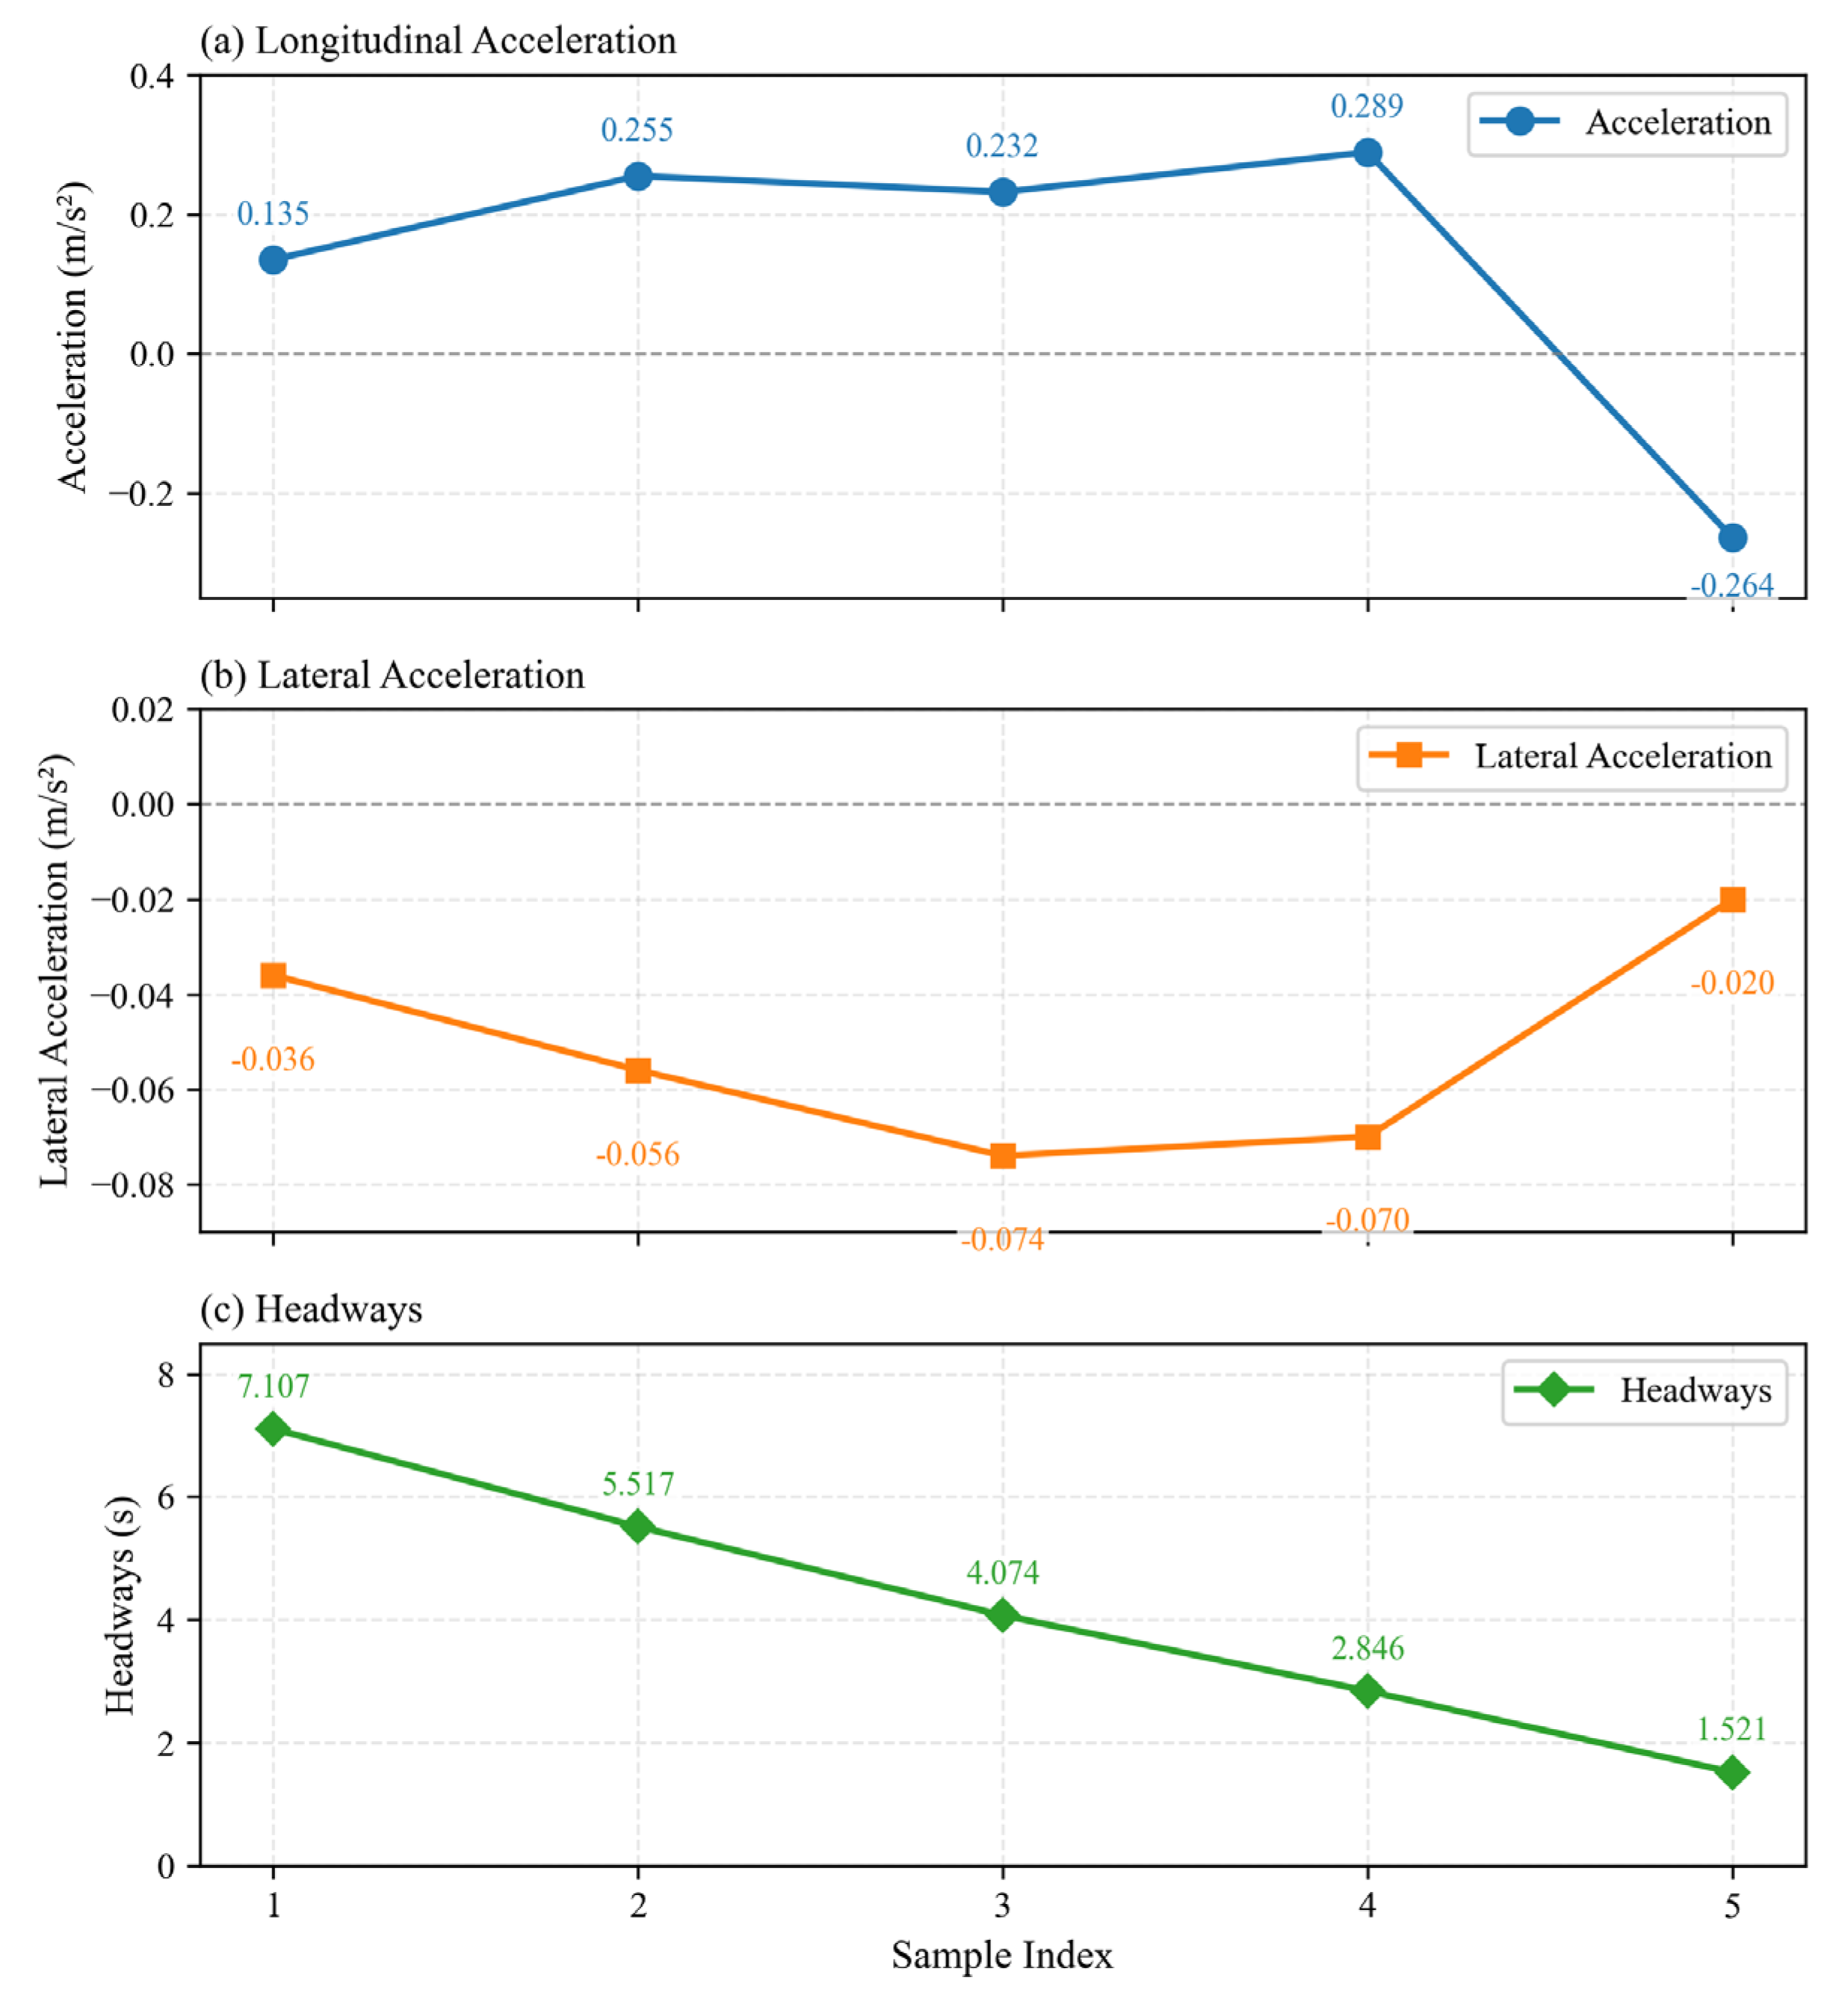
In this path, the headway continuously decreases. As the headway gradually decreases from 7 m to less than 1.5 m, it will likely transfer to a more dangerous driving state 2. This situation is often caused by incorrect acceleration behavior in the early stage (such as aggressive acceleration, cutting in, etc.), which leads to rapid deceleration in the later stage. Figure 9 shows the changing trends of the three variables in the state. It can be seen that as the front of the vehicle continues to decrease, the acceleration of the vehicle first increases and then decreases, and there is a trend of turning the steering wheel.
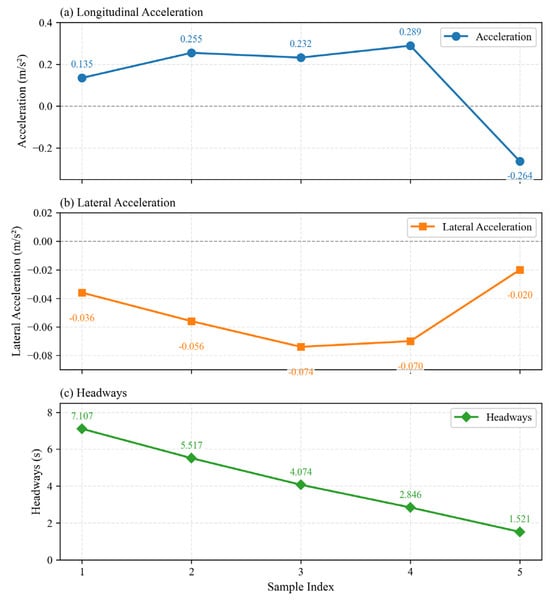
Figure 9.
The changing trends of the three variables in the state.
To prevent conflicts, this state transition path can be blocked in advance by always maintaining a headway of at least 6 m when following the front vehicle in a congested section on the highways.
5.3.2. Graph Node Importance and Small-World Characteristics
Through graph structure analysis, some key nodes (important driving states) and important state transition patterns can be obtained. Table 5 shows the graph network characteristics of each driving state node.
Table 5.
Closeness centrality and page rank of driving status nodes.
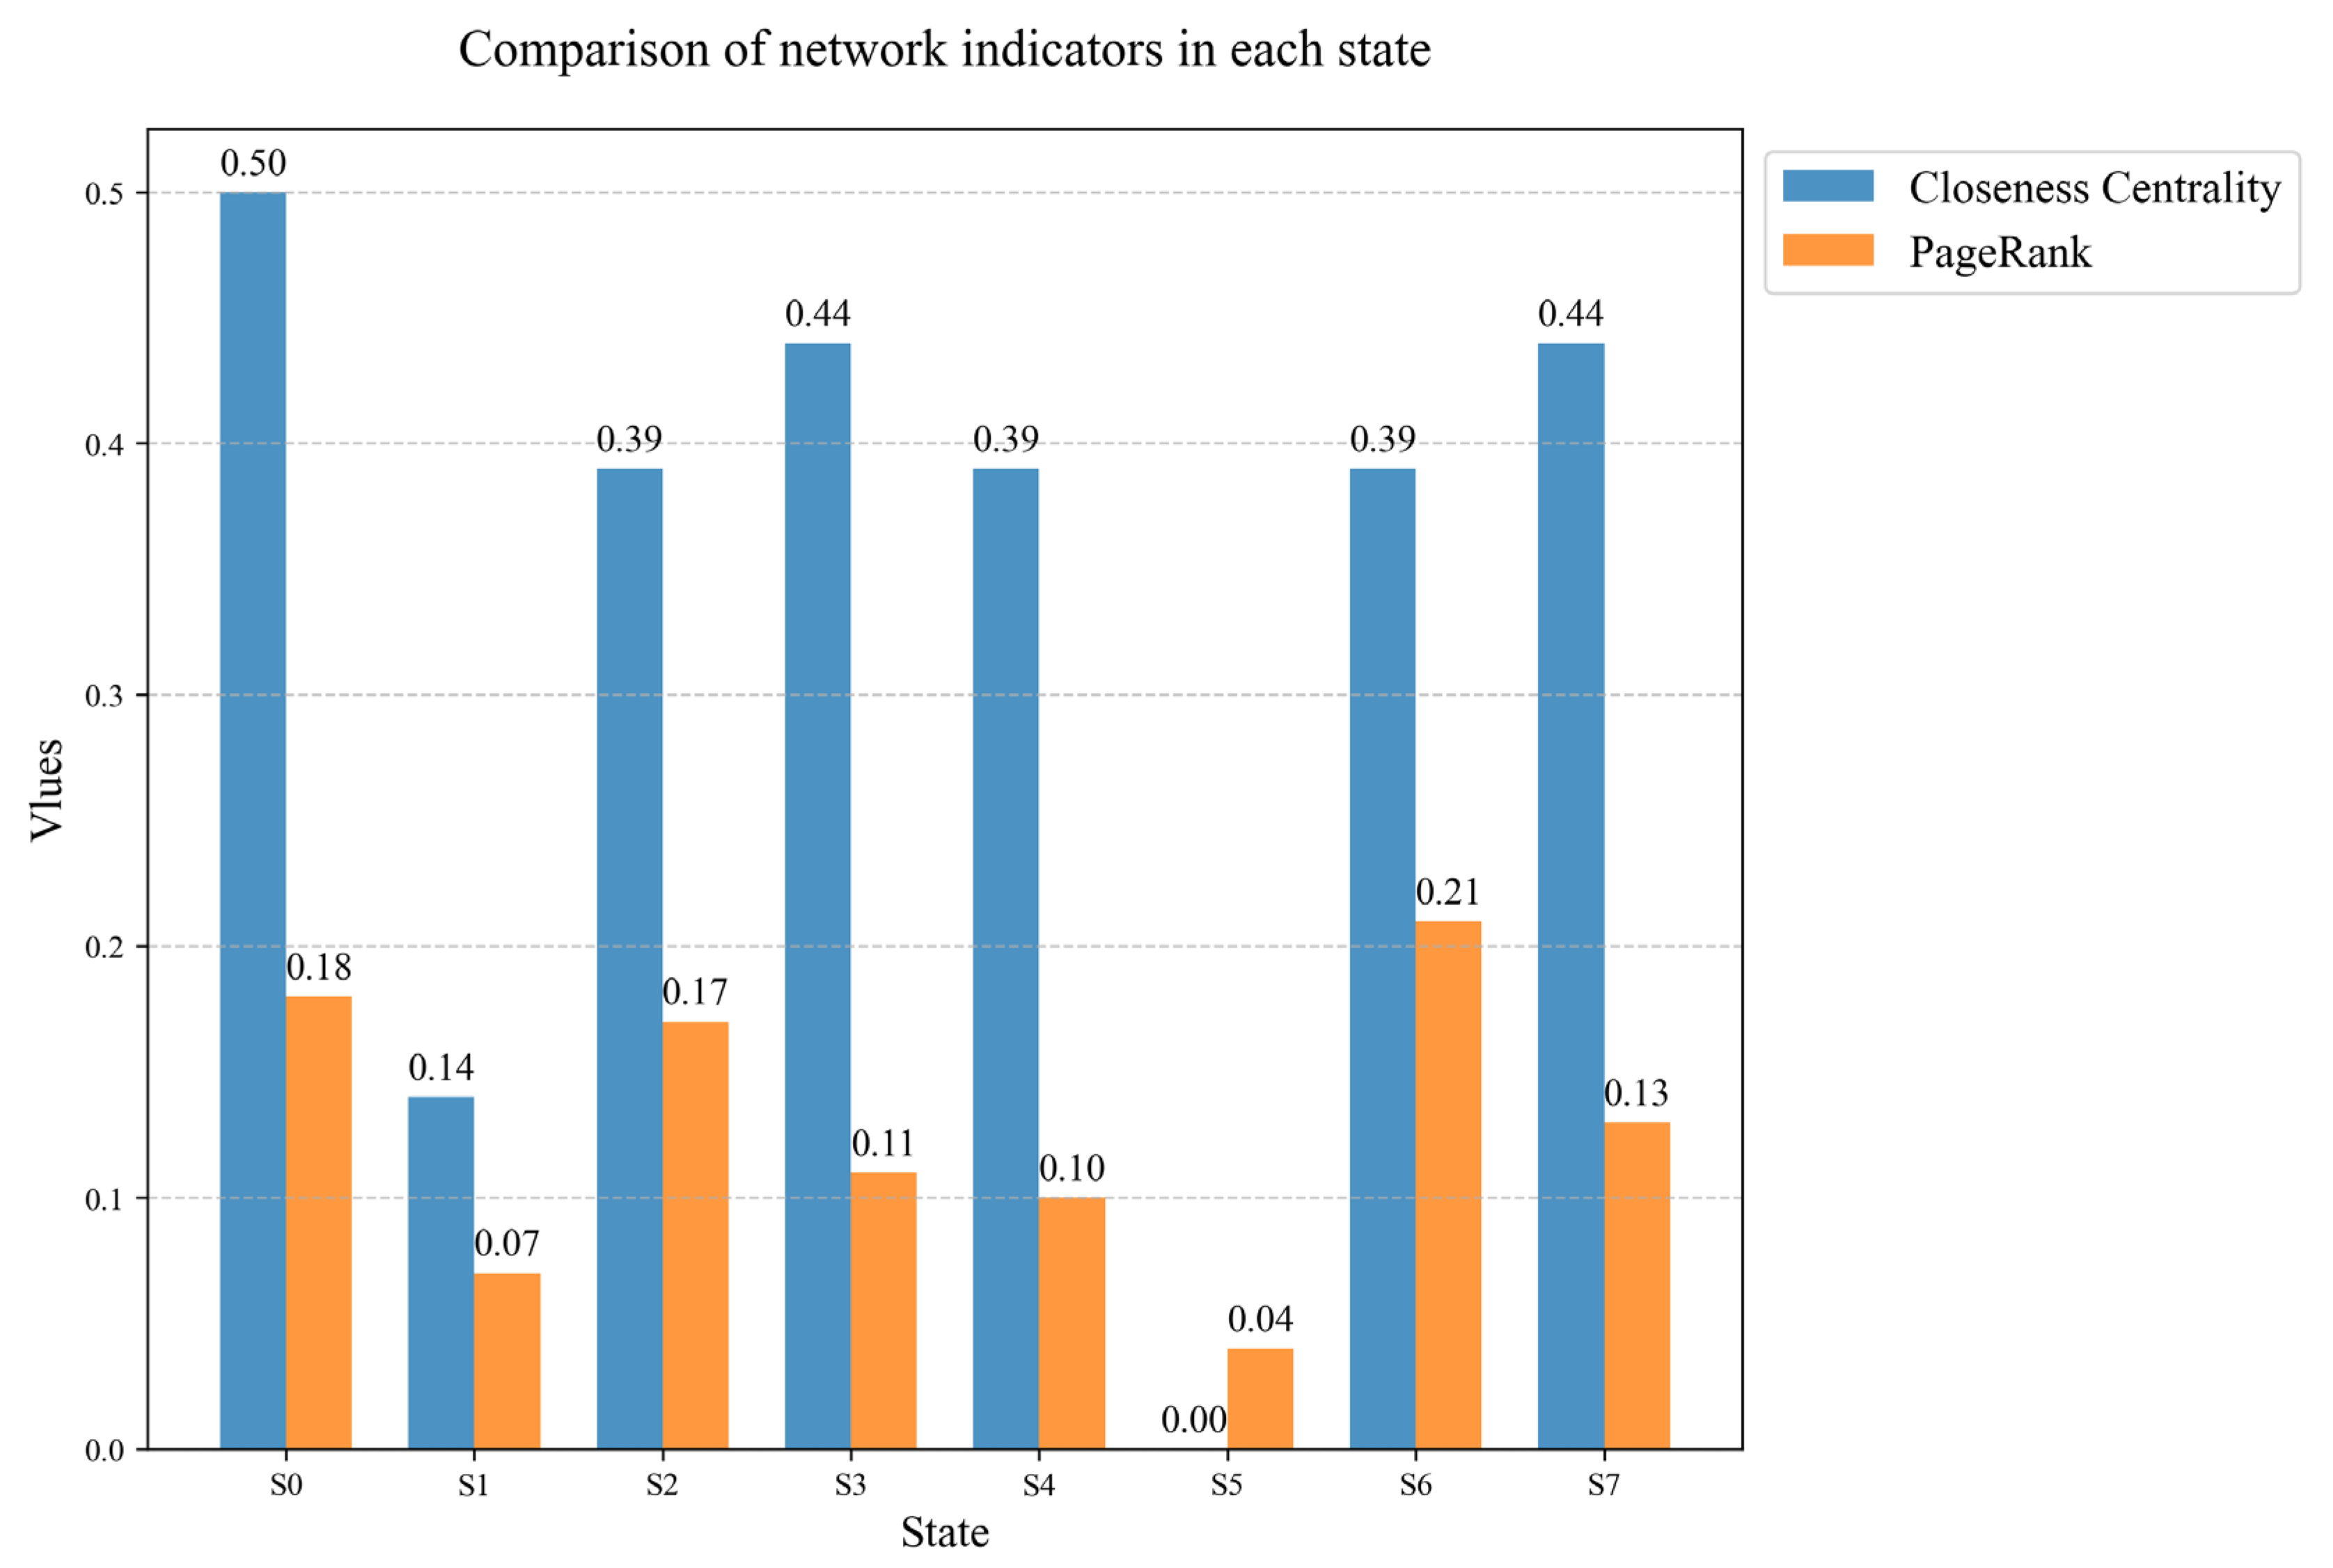
Figure 10 shows the closeness centrality and page rank of each state, where S0, S2, and S3 are the states with higher closeness centrality and page rank, indicating that these states are crucial in the conflict process.

Figure 10.
Closeness centrality and page rank comparison of each state.
In addition, the state transition graph of the conflict process does not have a small-world property. So, the following conclusions can be inferred: the path of driving state transitions is lengthy, suggesting that multiple driving states must be experienced before reaching the final conflict. This indicates a slow transition between driving states, leading drivers unable to perceive dangerous headway early enough. Prior to the final conflict, the vehicle consistently remains in a self-loop state before abruptly entering the conflict state.
5.4. Markov Characteristic Analysis Results
Furthermore, we transform the driving state transition matrix (Table 4) into a state probability transition matrix, as shown in Table 6.
Table 6.
States’ probability transition matrix.
Next, we calculate the power of this state transition matrix. After the 39th time, the matrix gradually reaches a stable state. The stable matrix is shown in Table 7.
Table 7.
Matrix under power stability.
This indicates that the driving state transition process during the conflict process corresponds to the Markov property, and the conflict process can be described using a Markov chain. Furthermore, when the power of the matrix reaches stability, it ultimately remains in the four key driving states analyzed above, i.e., 0, 2, 6, and 7, and it is most likely to stay in driving states 2 and states 6. And the calculated value of the chi square statistic is close to 0, which is much smaller than the given error probability of 0.05. We can further reject the zero hypothesis; the conflict process satisfies Markov properties. This indicates that the driving state eventually tends to stabilize during the conflict process, and the driving state is predictable.
6. Conclusions
In this paper, a framework based on graph theory was proposed to analyze the time-varying patterns of time-series variables. And a fine-grained and detailed analysis of the rear-end conflict process on the congested highway sections was conducted using this framework. Specifically, we based our analysis on the micro-trajectory time series in the conflict process and used complex network theory to analyze the driving behavior switch time-varying patterns during the conflict process. The main results are as follows:
- The transition of driving behavior states during the conflict process conforms to the Markov property, which means that the driving behavior during the conflict process is predictable and can be altered.
- The network of the driving behavior state transition graph does not conform to the small-world property. This means that before the final conflict occurs, high-risk vehicles always continuously switch states between a few states or remain in a self-looping state until they abruptly transition into the final conflict state.
- On congested highway sections, rear-end collisions often transition to a conflict state along a fixed path within the graph structure, indicating that the majority of conflicts stem from similar causes.
Based on the careful analysis of traffic conflicts under congested traffic flow, these conclusions can be used to develop targeted vehicle auxiliary warning systems. In the future, research on vehicle collision avoidance control based on this process analysis is worth further exploration.
Author Contributions
R.C. Writing—review and editing; Supervision. X.A. Writing—original draft; Methodology. W.F. Conceptualization; Validation, D.Z. Investigation; Data processing; Investigation. All authors have read and agreed to the published version of the manuscript.
Funding
This research was funded by the Program of Humanities and Social Science of Education Ministry of China (Grant No. 24YJA630013) and the APC was funded by the Ningbo Natural Science Foundation of China (Grant No. 2024J125).
Data Availability Statement
Data will be made available on request.
Conflicts of Interest
The authors report no declarations of interest.
References
- Kuang, Y.; Qu, X. A review of crash surrogate events. In Vulnerability, Uncertainty, and Risk: Quantification, Mitigation, and Management; American Society of Civil Engineers: Reston, WV, USA, 2014; pp. 2254–2264. [Google Scholar]
- Zheng, L.; Sayed, T.; Mannering, F. Modeling traffic conflicts for use in road safety analysis: A review of analytic methods and future directions. Anal. Methods Accid. Res. 2021, 29, 100142. [Google Scholar] [CrossRef]
- Guo, Y.; Liu, P.; Wu, Y.; Yang, M. Traffic conflict model based on Bayesian multivariate Poisson-lognormal normal distribution. China J. Highw. Transp. 2018, 31, 101–109. [Google Scholar]
- Sacchi, E.; Sayed, T.; Deleur, P. A comparison of collision-based and conflict-based safety evaluations: The case of right-turn smart channels. Accid. Anal. Prev. 2013, 59, 260–266. [Google Scholar] [CrossRef]
- Tarko, A.P. A unifying view on traffic conflicts and their connection with crashes. Accid. Anal. Prev. 2021, 158, 106187. [Google Scholar] [CrossRef]
- Fu, C.; Sayed, T. Bayesian dynamic extreme value modeling for conflict-based real-time safety analysis. Anal. Methods Accid. Res. 2022, 34, 100204. [Google Scholar] [CrossRef]
- Fu, C.; Sayed, T. A multivariate method for evaluating safety from conflict extremes in real time. Anal. Methods Accid. Res. 2022, 36, 100244. [Google Scholar] [CrossRef]
- Sun, Z.; Chen, Y.; Wang, P.; Fang, S.; Tang, B. Vision-based traffic conflict detection using trajectory learning and prediction. IEEE Access 2021, 9, 34558–34569. [Google Scholar] [CrossRef]
- Wang, L.; Zou, L.; Abdel-Aty, M.; Ma, W. Expressway rear-end crash risk evolution mechanism analysis under different traffic states. Transp. B Transp. Dyn. 2023, 11, 510–527. [Google Scholar] [CrossRef]
- Yu, R.; Han, L.; Zhang, H. Trajectory data based freeway high-risk events prediction and its influencing factors analyses. Accid. Anal. Prev. 2021, 154, 106085. [Google Scholar] [CrossRef]
- Yuan, C.; Li, Y.; Huang, H.; Wang, S.; Sun, Z.; Li, Y. Using traffic flow characteristics to predict real-time conflict risk: A novel method for trajectory data analysis. Anal. Methods Accid. Res. 2022, 35, 100217. [Google Scholar] [CrossRef]
- Ji, Q.; Lyu, H.; Yang, H.; Wei, Q.; Cheng, R. Bifurcation control of solid angle car-following model through a time-delay feedback method. J. Zhejiang Univ.-Sci. A 2023, 24, 828–840. [Google Scholar] [CrossRef]
- Hu, J.; Bai, J.; Yang, J.; Lee, J.J. Crash risk prediction using sparse collision data: Granger causal inference and graph convolutional network approaches. Expert Syst. Appl. 2025, 259, 125315. [Google Scholar] [CrossRef]
- Zhong, H.; Wang, L.; Su, Z.; Liu, G.; Ma, W. Characteristics identification and evolution patterns analyses of road chain conflicts. Accid. Anal. Prev. 2024, 195, 107395. [Google Scholar] [CrossRef]
- Li, L.; Lyu, H.; Wang, T.; Cheng, R. STdi4DMPC: Distributed Model Predictive Control for Connected and Automated Truck Platoon with Mixed Traffic Flow Based on Spatiotemporal Trajectory Prediction. IEEE Trans. Veh. Technol. 2024, 73, 14563–14579. [Google Scholar] [CrossRef]
- Hu, Y.; Li, Y.; Huang, H. Spatio-temporal dynamic change mechanism analysis of traffic conflict risk based on trajectory data. Accid. Anal. Prev. 2023, 191, 107203. [Google Scholar] [CrossRef] [PubMed]
- Chen, B.; Zhao, X.; Li, Y.; Liu, X. Exploring the associations of demographics and scale measures with cognitive driving behavior among older drivers in China. Accid. Anal. Prev. 2024, 200, 107542. [Google Scholar] [CrossRef]
- Xie, N.; Yu, R.; He, Y.; Li, H.; Li, S. Unveiling pre-crash driving behavior common features based upon behavior entropy. Accid. Anal. Prev. 2024, 196, 107433. [Google Scholar] [CrossRef]
- Arun, A.; Haque, M.; Bhaskar, A.; Washington, S.; Sayed, T. A bivariate extreme value model for estimating crash frequency by severity using traffic conflicts. Anal. Methods Accid. Res. 2021, 32, 100180. [Google Scholar] [CrossRef]
- Arun, A.; Haque, M.; Bhaskar, A.; Washington, S.; Sayed, T. A systematic mapping review of surrogate safety assessment using traffic conflict techniques. Accid. Anal. Prev. 2021, 153, 106016. [Google Scholar] [CrossRef]
- Arun, A.; Haque, M.; Washington, S.; Mannering, F. A physics-informed road user safety field theory for traffic safety assessments applying artificial intelligence-based video analytics. Anal. Methods Accid. Res. 2023, 37, 100252. [Google Scholar] [CrossRef]
- Cheng, R.; Ge, H.; Wang, J. An extended continuum model accounting for the driver’s timid and aggressive attributions. Phys. Lett. A 2017, 381, 1302–1312. [Google Scholar] [CrossRef]
- Arun, A.; Haque, M.; Washington, S.; Sayed, T.; Mannering, F. How many are enough?: Investigating the effectiveness of multiple conflict indicators for crash frequency-by-severity estimation by automated traffic conflict analysis. Transp. Res. Part C Emerg. Technol. 2022, 138, 103653. [Google Scholar] [CrossRef]
- Cheng, R.; Lyu, H.; Zheng, Y.; Ge, H. Modeling and stability analysis of cyberattack effects on heterogeneous intelligent traffic flow. Phys. A Stat. Mech. Appl. 2022, 604, 127941. [Google Scholar] [CrossRef]
- Cao, J.; Chen, J.; Guo, X.; Wang, L. Trajectory data-based severe conflict prediction for expressways under different traffic states. Phys. A Stat. Mech. Appl. 2023, 621, 128595. [Google Scholar] [CrossRef]
- Choi, J.G.; Kong, C.W.; Kim, G.; Lim, S. Car crash detection using ensemble deep learning and multimodal data from dashboard cameras. Expert Syst. Appl. 2021, 183, 115400. [Google Scholar] [CrossRef]
- Gu, X.; Abdel-Aty, M.; Xiang, Q.; Cai, Q.; Yuan, J. Utilizing UAV video data for in-depth analysis of drivers’ crash risk at interchange merging areas. Accid. Anal. Prev. 2019, 123, 159–169. [Google Scholar] [CrossRef]
- Li, P.; Abdel-Aty, M.; Yuan, J. Real-time crash risk prediction on arterials based on LSTM-CNN. Accid. Anal. Prev. 2020, 135, 105371. [Google Scholar] [CrossRef] [PubMed]
- Li, L.; Lin, Y.; Du, B.; Yang, F.; Ran, B. Real-time traffic incident detection based on a hybrid deep learning model. Transp. A Transp. Sci. 2022, 18, 78–98. [Google Scholar] [CrossRef]
- Li, Q.; Cheng, R.; Ge, H. Short-term vehicle speed prediction based on BiLSTM-GRU model considering driver heterogeneity. Phys. A Stat. Mech. Appl. 2023, 610, 128410. [Google Scholar] [CrossRef]
- Ye, Y.; Xiao, Y.; Zhou, Y.; Li, S.; Zang, Y.; Zhang, Y. Dynamic multi-graph neural network for traffic flow prediction incorporating traffic accidents. Expert Syst. Appl. 2023, 234, 121101. [Google Scholar] [CrossRef]
- Lu, J.; Grembek, O.; Hansen, M. Learning the representation of surrogate safety measures to identify traffic conflict. Accid. Anal. Prev. 2022, 174, 106755. [Google Scholar] [CrossRef]
- Sattar, K.; Oughali, F.C.; Assi, K.; Ratrout, N.; Jamal, A.; Rahman, S.M. Transparent deep machine learning framework for predicting traffic crash severity. Neural Comput. Appl. 2023, 35, 1535–1547. [Google Scholar] [CrossRef]
- Zhang, S.; Abdel-Aty, M.; Cai, Q.; Li, P.; Ugan, J. Prediction of pedestrian-vehicle conflicts at signalized intersections based on long short-term memory neural network. Accid. Anal. Prev. 2020, 148, 105799. [Google Scholar] [CrossRef] [PubMed]
- Wang, T.; Cheng, R.; Wu, Y. Stability analysis of heterogeneous traffic flow influenced by memory feedback control signal. Appl. Math. Model. 2022, 109, 693–708. [Google Scholar] [CrossRef]
- Cheng, Z.; Zu, Z.; Lu, J. Traffic crash evolution characteristic analysis and spatiotemporal hotspot identification of urban road intersections. Sustainability 2018, 11, 160. [Google Scholar] [CrossRef]
- Li, J.; Cheng, R. A real-time adaptive signal control method for multi-intersections in mixed connected vehicle environments. J. Zhejiang Univ.-Sci. A Appl. Phys. Eng. 2025, 1, 189. [Google Scholar]
- Nasr, H.A.; Huang, H.; Jin, J.; Zhou, H. Rear-end conflicts analysis at non-signalized intersection based on vehicles trajectory data. Eur. Transp. Res. Rev. 2025, 17, 27. [Google Scholar] [CrossRef]
- Sheikh, M.S.; Peng, Y. Assessment of Rear-end Collision Risk based on a Deep Reinforcement Learning Technique: A Break Reaction Assessment Approach. IEEE Access 2025, 13, 20171–20190. [Google Scholar] [CrossRef]
- Li, Y.; Wu, D.; Lee, J.; Yang, M.; Shi, Y. Analysis of the transition condition of rear-end collisions using time-to-collision index and vehicle trajectory data. Accid. Anal. Prev. 2020, 144, 105676. [Google Scholar] [CrossRef]
- Luo, Q.; Chen, X.; Yuan, J.; Zang, X.; Yang, J.; Chen, J. Study and Simulation Analysis of Vehicle Rear-End Collision Model considering Driver Types. J. Adv. Transp. 2020, 2020, 7878656. [Google Scholar] [CrossRef]
- Li, Y.; Wang, X.; Wang, T.; Liu, Q. Characteristics analysis of autonomous vehicle pre-crash scenarios. arXiv 2025, arXiv:2502.20789. [Google Scholar]
- Huang, C.; Wen, X.; He, D. Characteristics of rear-end collisions: A comparison between automated driving system-involved crashes and advanced driving assistance system-involved crashes. Transp. Res. Rec. 2024, 2678, 771–782. [Google Scholar] [CrossRef]
- Peng, Y.; Liu, D.; Wu, S.; Yang, X.; Wang, Y.; Zou, Y. Enhancing Mixed Traffic Flow with Platoon Control and Lane Management for Connected and Autonomous Vehicles. Sensors 2025, 25, 644. [Google Scholar] [CrossRef] [PubMed]
- Xing, Y.; Wu, Y.; Wang, H.; Wang, L.; Li, L.; Peng, Y. Failed lane-changing detection and prediction using naturalistic vehicle trajectories. Transp. Res. Part C Emerg. Technol. 2025, 170, 104939. [Google Scholar] [CrossRef]
- Zhang, Y.; Wang, C.; Yu, R.; Wang, L.; Quan, W.; Gao, Y.; Li, P. The ad4che dataset and its application in typical congestion scenarios of traffic jam pilot systems. IEEE Trans. Intell. Veh. 2023, 8, 3312–3323. [Google Scholar] [CrossRef]

Disclaimer/Publisher’s Note: The statements, opinions and data contained in all publications are solely those of the individual author(s) and contributor(s) and not of MDPI and/or the editor(s). MDPI and/or the editor(s) disclaim responsibility for any injury to people or property resulting from any ideas, methods, instructions or products referred to in the content. |
© 2025 by the authors. Licensee MDPI, Basel, Switzerland. This article is an open access article distributed under the terms and conditions of the Creative Commons Attribution (CC BY) license (https://creativecommons.org/licenses/by/4.0/).