Abstract
The efficacy of new FMECA methods can be assessed through qualitative comparisons of the failure mode rankings. This approach is suitable for a few failure modes but can become impractical or lead to misleading results for more extensive problems. This fact motivated us to introduce an alternative approach for comparing different FMECA methods based on agreement coefficients, enabling a statistical comparison between rankings generated by independent raters. Despite its relevance, the application of agreement coefficients is limited in the FMECA context. Our proposed approach utilizes Cohen’s kappa coefficient to evaluate the agreement between six FMECA configurations based on a type-2 fuzzy inference system and a reference FMECA ranking. We conducted an FMECA on power transformers to test our approach, identifying fourteen potential failure modes. Results show that, based on the agreement coefficient, our proposed approach proves effective for a statistical comparison of different FMECA methods rather than a qualitative comparison between rankings.
1. Introduction
Failure Mode, Effects, and Criticality Analysis (FMECA) is a qualitative method for risk assessment designed to detect potential failure modes, their origins, and the effects on system performance [1]. Its main objective is to identify potential failures, determine their frequency, assess the severity of their impact on the system, and identify the necessary actions to prevent them.
In recent years, the increasing complexity of systems and the development of diverse methodologies for prioritizing failure modes have necessitated the adoption of more rigorous and objective methods for comparing FMECA results. In particular, the use of statistical comparison tools, such as agreement coefficients like Cohen’s kappa, has emerged as a promising approach to evaluate the consistency and effectiveness of alternative FMECA methods, moving beyond traditional qualitative ranking comparisons [2].
The classical FMECA approach is structured around three core elements, referred to as risk factors, used to describe each failure mode [1]: the Severity (S), which indicates the qualitative impact that the failure mode may cause; the Frequency of Occurrence (O), which estimates the probability that the failure will happen; and the Detectability (D), which reflects how easily the failure can be detected before it occurs. Each risk factor is assigned to specific risk categories using a numerical scale, typically ranging from 1 to 10, as in [1], or from 1 to 5, as in [3].
Each failure mode is assessed using a Risk Priority Number (RPN), which results from the composition of the three S, O, and D through a generic operator denoted by “”, as shown in Equation (1). This operator is typically defined as the product of the three factors; however, alternative formulations may also be considered.
Because the Risk Priority Number (RPN) in the classical FMECA method is calculated as the direct product of three integer values, it introduces no significant computational complexity. However, despite its widespread application in failure analysis, this approach has notable limitations [4,5]. The most relevant drawbacks are as follows:
- The RPN calculation treats all three risk factors, S, O, and D, equally, without applying any weighting to reflect their relative importance.
- While higher RPN values are generally linked to more critical failure modes, this correlation does not consistently hold true in all cases [6,7].
- The scales used for the three risk factors are often chosen arbitrarily and may fail to accurately capture the specific risk profiles of the problem under analysis.
To address the limitations of classical FMECA, various methods based on computational intelligence and decision-making techniques have been introduced in recent years.
One of the earliest uses of fuzzy inference systems (FISs) to enhance FMECA was introduced by Bowles and Peláez [4]. Their findings demonstrated that the FIS method helped address key FMECA limitations, including the imprecise identification of risk factors. In a recent study [6], the authors carried out a literature review of FMECA approaches published from 1998 to 2018; their analysis shows that research on FMECA improvements has grown significantly, mainly involving fuzzy inference systems and grey theory. Reference [7] shows the application of multi-criteria decision-making (MCDM) techniques and uncertainty theory to handle the imprecision present in FMECA procedures. The book offers an extensive overview of scholarly works that utilize MCDM to resolve FMECA-related challenges.
In [8], the authors present a fuzzy rule-based system combined with grey relational theory to enhance the FMECA performed on an ocean-going fish vessel; the proposed approach integrates linguistic variables, which allows assigning appropriate weights to each of the risk factors. In [9], an improved failure mode prioritization method is proposed by merging the “cloud model” with a modified PROMETHEE technique; the authors also performed qualitative comparisons with other methods such as IF-TOPSIS, Fuzzy VIKOR, IVIF-MULTIMOORA, and ITL-GRA. Their method was applied to the prioritization of potential failure modes in the emergency department’s treatment process; results indicated that the proposed approach successfully overcame limitations of classical FMEA and produced more robust and reasonable risk-ranking outcomes.
In [10], the authors present an approach that combines variable precision rough set theory to capture the vagueness inherent in FMEA evaluations with the TODIM method to enhance failure mode prioritization; this methodology was applied to a real-world case involving a steam valve system and was qualitatively compared with several alternatives: classical FMEA, Fuzzy TODIM, Rough TOPSIS, and linguistic distribution assessments based on LDA-TODIM. The authors conclude that, for their case study, the prioritization results obtained using their method are more robust than those achieved through traditional FMEA, Rough TOPSIS, and Rough VIKOR.
In [11], the authors propose the application of two methods to improve failure mode prioritization in FMEA: a fuzzy rule-based (FRB) approach [12] and a grey relational theory (GRT)-based method [13]. Both methods were applied to a 500 km pipeline system, where 27 failure modes were identified and analyzed.
The FRB approach utilizes fuzzy logic to handle uncertainty and imprecision in expert evaluations, generating a relative ranking of failure modes based on qualitative input. This method is particularly suitable when the relative importance of failure modes is sufficient for decision-making. In contrast, the GRT-based method provides a more detailed analysis by quantifying the influence of each risk factor—Severity, Occurrence, and Detection—on the overall ranking. Grey theory enables the modeling of incomplete and uncertain data, which is useful when resource allocation requires an explicit understanding of individual factor contributions.
Liu et al. in [5] introduced the use of interval 2-tuple hybrid weighted distance (ITHWD) in an FMECA applied to a blood transfusion scenario; in their study, eleven failure modes with RPNs exceeding 80 were selected for evaluation using the method; their findings confirmed the method’s effectiveness in prioritizing failure modes under conditions of uncertainty and incomplete data. Similarly, in [14], the authors modeled uncertainty using interval type-2 fuzzy sets to rank failure modes, applying the method to a real-world oil spill case. Inputs from five experts were aggregated through a rule-based system, and the resulting fuzzy set was defuzzified to obtain the RPN.
Reference [15] presents the use of a type-2 fuzzy-based FMECA for conducting risk assessments in manufacturing environments within the automotive sector; this study features a fuzzy version of the ordered weighted average (OWA) operator to assign relative importance to each fuzzy risk factor; while the method is constrained to triangular membership functions, it still offers greater flexibility for expert input. This formulation improves the handling of uncertainty, capturing both intrapersonal and interpersonal variability in expert assessments more effectively.
An enhanced version of the ELECTRE method, called interval-valued ELECTRE TRI, is described in [16] for classifying failure modes while accounting for uncertainty in input data; this methodology was applied in a real-world FMECA case involving a propulsion system from a fishing vessel operating off the western coast of Sicily. The analysis included assessments from three equally weighted experts’ criteria. The authors conclude that their method effectively incorporates both the relative significance of risk factors and the uncertainty and imprecision involved in categorizing failure modes within risk levels.
In [17], the authors propose a method combining fuzzy logic with Dempster–Shafer theory, incorporating 100 fuzzy rules derived from a linear formula named the Gupta–Ghasemian equation, discovered by the same researchers. Their framework also includes the aggregation of individual rankings provided by the FMECA team members. Applied to the analysis of an industrial centrifugal pump with 20 identified failure modes, the authors assert that their methodology effectively addresses key limitations found in traditional FMECA procedures.
Another improvement of the classical FMECA is shown in [18]. The authors present a methodology that integrates fuzzy logic with Pareto chart analysis to identify process defects in the manufacturing of solar gel batteries. The proposed model uses Gaussian, Z-shaped, and S-shaped membership functions to represent the risk factors, capturing diverse uncertainty profiles. A fuzzy inference system processes these inputs to generate a fuzzy RPN. Subsequently, a Pareto chart is employed to determine the most critical failure causes. According to the authors, this hybrid approach improves diagnostic precision, thus increasing the overall safety, reliability, and quality of the manufacturing process.
Qin and Pedrycz [19] introduced a method that combines interval type-2 fuzzy sets with evidential reasoning for FMECA analysis applied to a steam valve system with eight failure modes. The approach proved more accurate than conventional methods, such as fuzzy VIKOR and fuzzy TOPSIS, reducing the likelihood of producing identical RPN values. By applying a tailored weighting scheme to the three risk factors, the method yielded more nuanced results and enhanced the representation of uncertainty, providing a clear advantage over traditional type-1 fuzzy approaches.
Although the previously described methods improve failure mode prioritization in FMECA, evaluating their effectiveness remains a challenging task.
The performance of improved FMECA methods is commonly assessed through qualitative one-to-one comparisons of the rankings, evaluating the degree of alignment between methods. This strategy may be adequate for cases involving a limited number of failure modes; however, when the number of failure modes increases, such comparisons become impractical and may result in inaccurate conclusions. In such scenarios, agreement coefficients emerge as statistically robust tools for assessing the effectiveness of new FMECA methods, providing a more objective and scalable framework for comparisons.
The agreement assessment between rankings is a well-known problem in the biological and social sciences; however, its use within FMECA remains limited, typically emphasizing consensus among team members rather than comparisons across different FMECA methods. Although originally designed to assess concordance between human evaluators, agreement metrics have also been employed over the past decade to evaluate the performance of newly developed classification algorithms.
In [20], Cohen’s kappa coefficient was employed to evaluate classifier performance within a wrapper-based feature selection framework; the authors introduced a fuzzy optimization strategy that maximized Cohen’s kappa as the objective function, improving the robustness of the feature selection by accounting for agreement beyond chance. In [21], machine learning classifiers were used to detect potential untreated sewage discharges from wastewater treatment facilities, using Cohen’s kappa to quantify the agreement between predictive models, ensuring a more reliable comparison across classifier outputs.
Reference [22] reports on the use of six supervised machine learning classifiers for detecting Android malware. In this case, Cohen’s kappa was again employed as the primary metric to evaluate each classifier’s ability to deliver accurate or inaccurate predictions. More recently, in [23], a deep learning algorithm was proposed for classifying severe acute respiratory syndrome coronavirus 2 (SARS-CoV-2) among various coronaviruses. In that study, Cohen’s kappa was used in conjunction with six additional performance metrics to assess and compare the effectiveness of the neural network-based models.
Another recent application of Cohen’s kappa coefficient for algorithm comparison is reported in [24], where machine learning classification models were applied to analyze complex experimental data in physics. The kappa statistics served as the performance measure to evaluate and contrast crisp algorithms with fuzzy-based approaches.
In this context, the present study proposes the application of agreement coefficients to compare alternative fuzzy-based FMECA methods. The core objective is to establish a statistically principled methodology for benchmarking FMECA approaches, providing a more robust and objective alternative to conventional qualitative comparison practices.
The paper is organized as follows: Section 2 explains the main concepts of the rank agreement problem. Section 3 introduces the use of the concordance coefficient in the FMECA context. Section 4 shows the FMECA case study, and Section 5 describes the implementation of fuzzy-based FMECA methods. Section 6 presents the resulting agreement between FMECA methods and provides an extensive discussion, while Section 7 concludes the paper and outlines future developments.
2. Revising the Main Concepts for Rank Agreement Problems
2.1. The Measurement of Rank Agreement
Consider a collection of n objects ranked according to a particular characteristic by m judges. The degree of agreement among the evaluators’ rankings can provide important insights. This situation, known as the problem of m rankings, was originally described by Kendall and Smith [25], who formulated it as follows: “If m persons rank n objects according to some quality of the objects, does the evidence suggest a community of judgment among them?” [25].
Agreement, also referred to as concordance, reproducibility [26], or interrater reliability [27], measures the degree of concordance between two or more sets of assessments [28]. Although agreement and correlation are sometimes mistakenly used interchangeably [26,27,29,30], they represent fundamentally different concepts: correlation measures association between variables that may represent different attributes, whereas agreement assesses the consistency of evaluations of the same attribute [26].
Cohen’s kappa coefficient was selected for the concordance assessment due to its simple mathematical formulation and well-established use as an agreement measure. The upcoming sections provide a detailed discussion of both the unweighted and weighted forms of the kappa coefficient.
2.2. Cohen’s Coefficient of Agreement
Cohen’s coefficient, commonly referred to as Cohen’s kappa and denoted by κ, is a statistical measure intended to evaluate both inter-rater and intra-rater reliability [31,32]. It quantifies the degree of agreement between evaluators by contrasting the observed proportion of matching classifications against the expected proportion under random assignment [31]. While originally formulated for comparisons involving two raters, subsequent extensions have been introduced for multiple-rater scenarios [32]. This section outlines the computation of Cohen’s kappa coefficient as a quantitative indicator of concordance among raters.
Consider a set of N objects, indexed as n = 1, 2, …, N, each independently assigned to one of k categories by two raters, A and B, as shown in Table 1. These categories may correspond to inherent attributes of the items or represent ordinal rankings from 1 to k.

Table 1.
Example of N objects ranked by two raters.
Let pij denote the proportion of objects classified into category i by Rater A and into category j by Rater B, where i = 1, 2, …, k and j = 1, 2, …, k, respectively. Table 2 is the cross-tabulation of the proportions between the two raters.
Table 2.
The proportion of classified objects.
The marginal proportions pi+ and p+j, corresponding to the cumulative classifications of Rater A and Rater B, respectively, are reported in the last column and last row of Table 1. The symbol “+” indicates summation over all categories. These marginal proportions quantify the likelihood of an object being assigned to category i by Rater A and to category j by Rater B and are formally computed according to Equations (2) and (3), respectively [27,33].
where and .
Let po be the “observed” proportion of agreement between raters [31]; it is expressed as follows (Equation (4)) [27,33]:
One limitation of the observed agreement proportion po is that it does not account for agreement occurring purely by chance [34]. To address this, the expected agreement by chance, denoted by pe, is estimated based on the marginal probabilities of each rater. Specifically, for all i = j, it is calculated as the sum over all categories of the product , as shown in Equation (5) [27].
This equation then defines Cohen’s kappa coefficient using Equation (6) as a normalized measure of agreement beyond chance [27,31,33]:
Cohen’s kappa coefficient, κ, ranges from −1 to 1, although it typically falls between 0 and 1 [34]. Positive values of κ indicate that the observed agreement po exceeds the agreement expected by chance pe, while negative values suggest that agreement is worse than the agreement expected by chance [31]. A value of κ = 1 denotes perfect agreement, i.e., both raters assign all objects to identical categories [31]. Conversely, κ = 0 occurs when the observed agreement is equal to the agreement expected by chance, as if the ratings were randomly assigned [34].
It is important to note that κ does not distinguish between disagreement caused by randomness and that caused by systematic bias [34]. Therefore, interpretations of its value should be guided by reference ranges, such as those listed in Table 3, to describe the strength of agreement [29].
Table 3.
Labels for the Cohen’s kappa coefficient in terms of the strength of agreement (adapted from Landis and Koch [32]).
In some circumstances, the original formulation of Cohen’s kappa yields unexpected results, commonly referred to in the literature as kappa paradoxes [27]. These arise from the dependence on marginal probabilities to estimate the expected agreement by chance. As noted in [27], the following two principal sources of these paradoxes can be identified:
- Overestimated expected agreement: When the marginal distributions produce a high expected agreement, even if the observed agreement po remains fixed, the resulting kappa value is artificially reduced. This effect may occur despite a seemingly high observed agreement between raters.
- Asymmetric marginal distributions: When the marginal proportions, pi+ and p+j, are highly asymmetric, kappa may yield either inflated or deflated values, depending on the nature of the imbalance.
2.3. Cohen’s Weighted Kappa
As discussed in [27], to address the limitations of Cohen’s original formulation, particularly the distortions introduced by asymmetrical marginal distributions or overestimated expected agreement, the weighted version of Cohen’s kappa was introduced by Cohen in [35]. This extension was later recognized as an effective means to mitigate the paradoxical effects described in [27].
Let wij denote the weight assigned to the agreement corresponding to the cell (i,j) in Table 2. The weighted kappa coefficient is defined by Equation (7) [36]:
where denotes the weighted observed proportion of agreement between raters, as defined by Equation (8), as stated in [36].
The term in Equation (7) represents the weighted expected proportion of agreement obtained by chance and is defined by Equation (9).
The unweighted kappa is a special case of weighted kappa where all disagreements are assigned equal weight of 1 [35,36].
Weights can be defined through various judgment procedures, often established by expert consensus [35]. For instance, six weighting schemes were outlined in [27], with the linear and quadratic weighting schemes being the most commonly adopted in applied studies [33,34,35,36,37,38,39,40].
The linear weighting scheme, denoted by , assigns weights based on the absolute difference between categories i and j, as defined in Equation (10) [37].
The quadratic weighting scheme, denoted by and defined in Equation (11), uses the squared difference between category indices to emphasize larger discrepancies [37]:
2.4. Cohen’s Weighted Kappa Test of Significance
While the weighted kappa coefficient provides a numerical estimate of agreement beyond chance, it is essential to assess whether this estimate is statistically significant. A hypothesis test determines whether the observed level of agreement could reasonably have occurred by chance, particularly when the sample size is small or the observed value of kappa is marginal.
Let H0 be the null hypothesis, “the raters’ agreement is no better than the agreement expected by chance”. Let H1 be the alternative hypothesis, “the raters’ agreement is better than the one expected by chance”. Under H0, the distribution of kappa can be approximated by a normal distribution, as suggested in [37].
The estimated variance of kappa, , assuming the null hypothesis holds, that is, assuming no association between raters, can be estimated using Equation (12) [41]:
where the term represents the weighted average of the weights in the i-th row of Table 2 and the term denotes the weighted average across the j-th column.
Assuming that follows a standard normal distribution under H0, the test statistic is computed through Equation (13):
The null hypothesis H0 is rejected in a one-tailed test if the test statistic is , where zα is the critical value corresponding to the upper tail of the standard normal distribution at a significance level α. In this study, a significance of α = 0.05 was adopted, resulting in a critical value of z0.05 = 1.645 [42]. Consequently, if ≤ 1.645, the null hypothesis is rejected, indicating that the agreement is significantly greater than expected by chance.
3. Measurement of Rank Agreement in the FMECA Context
The application of concordance measurements in FMECA remains limited, with most studies focusing on assessing agreement among human experts or FMECA team members rather than comparing different FMECA methods. For instance, reference [43] explores the use of a Bayesian Belief Network as a classifier for FMECA parameters in manufacturing and mentions the use of Kendall’s coefficient to assess agreement among team members, without reporting the agreement values. Similarly, reference [44] presents the application of Kendall’s coefficient to assess the agreement among human experts in medical risk analysis.
In [45], authors apply Cohen’s kappa coefficient to assess the agreement between two raters evaluating risk factors in a knowledge-based classical FMECA applied to vehicle component risk analysis; in this case, Cohen’s kappa was used to assess human evaluator consistency.
The authors of [46] show the application of the web-based three-round Delphi technique in FMECA for the transition from paper-based records to digital-based records in the radiotherapy department. The Wilcoxon matched-pairs signed-ranks test and Kendall’s coefficient of concordance were employed to establish consensus among the risk factor evaluations in the FMECA process.
Although these studies demonstrate the use of concordance metrics in FMECA, their scope remains focused on inter-rater agreement among human participants. In the literature consulted, no studies were found using statistical agreement coefficients, such as Cohen’s kappa, to compare the rankings produced by different FMECA methodologies. This gap highlights the main contribution of the present study: to introduce a statistical framework for evaluating the consistency among alternative ranking methods for prioritizing failure modes.
In the FMECA context, Cohen’s kappa coefficient can be applied by considering the following assumptions:
- The FMECA problem contains n failure modes to be ranked. These failure modes correspond to the n classified objects in terms of assessment of agreement.
- The FMECA methods used to prioritize the failure modes act as the m independent raters in terms of inter-rater reliability.
- Each FMECA method produces a complete ranking for the n failure modes, assigning a unique priority from 1 (highest risk) to k = n (lowest risk), where each rank k is treated as a category.
Based on these assumptions, two possible approaches can be considered to apply Cohen’s kappa to the FMECA methods comparison:
- Assess the agreement among all m FMECA methods applied to the same problem, without considering a reference method.
- Assess the one-to-one agreement between the m FMECA methods and a chosen FMECA reference ranking.
The second approach is particularly useful when testing the effectiveness of new FMECA methodologies against an established reference. However, the main challenge in this approach lies in the careful and justified selection of the reference method.
In this study, the Risk Priority Index (RPI) method, introduced by Anes et al. in [47], was selected as the reference ranking. This method combines two mathematical functions and assigns weights to the risk factors, enabling the prioritization of failure modes without requiring prior domain-specific knowledge. Its selection as the reference is based on the following well-founded considerations:
- As reported by the authors in [47], the Risk Priority Index (RPI) addresses key shortcomings of the classical Risk Priority Number (RPN) model by ensuring an injective mapping between risk factor combinations and prioritization scores. This mathematical property guarantees a unique and comprehensive ranking of failure modes, which is particularly advantageous in practical FMECA applications involving differentiated risk factor weights.
- The scenario SC5, denoted as RPI(SC5), adopts a weighting scheme of 50% for Severity, 30% for Occurrence, and 20% for Detection, a distribution that closely mirrors expert preferences in safety-critical systems, where the consequences of failure typically outweigh other risk dimensions. The authors demonstrated that this configuration produces consistent and intuitive prioritizations, reinforcing its suitability as a reference ranking for the comparison approach proposed in this paper.
- In contrast to several fuzzy or multi-criteria decision-making (MCDM) approaches that may introduce added complexity or subjectivity, the RPI method remains transparent and computationally straightforward. It leverages expert input and a clear transformation logic to generate risk rankings while allowing flexibility through adjustable weighting schemes. Among the scenarios analyzed in [47], SC5 emerged as the most balanced and statistically coherent.
These attributes position RPI(SC5) as a robust, interpretable, and practically relevant benchmark for evaluating the agreement and effectiveness of new FMECA methods.
To illustrate the application of agreement coefficients in the FMECA context, Cohen’s kappa is computed to compare two rankings obtained using the Risk Priority Index (RPI) method, as reported in the case study presented in [47]:
- RPI(SC4): RPI scenario 4 considers weights of 0.3 for S, 0.5 for O, and 0.2 for D.
- RPI(SC5): RPI scenario 5 considers weights of 0.5 for S, 0.3 for O, and 0.2 for D.
Table 4 shows the resulting rankings for the classical RPN and both RPI scenarios, as reported in [47].
Table 4.
Rankings for FMECA methods RPI(SC4) and RPI(SC5).
For this example, the Cohen’s kappa parameters are defined as N = 11 objects (failure modes), k = 11 categories (rankings), and m = 2 raters (RPI(SC4) and RPI(SC5)).
Table 5 presents the proportion of failure modes ranked in each category by the RPI(SC4) and RPI(SC5) methods, along with the marginal proportions pi+ and p+j as defined in Section 2.2.
Table 5.
The proportion of failure modes ranked by RPI(SC4) and RPI(SC5).
The quadratic weighting scheme, as described in Equation (11), is used in this example to compute the weights shown in Table 6.
Table 6.
Quadratic weights.
As an illustration, the quadratic weight between ranking positions i = 3 and j = 5 is calculated using Equation (11).
The expected proportion of weighted agreement obtained by chance, , was computed using Equation (9), based on the values and weights reported in the quadratic weighting scheme described in Equation (11) and is used in this example to compute the weights shown in Table 6 as follows:
The value for weighted kappa was computed using Equation (7).
This result indicates an agreement level of 0.8545 between the FMECA methods RPI(SC4) and RPI(SC5), which corresponds to “almost perfect” agreement according to the strength of agreement in Table 3.
4. FMECA Case Study and Reference Ranking
A case study involving a power transformer, as presented in [48], was selected to validate the proposed methodology. From the 24 failure modes originally identified by the author, 14 were selected for this analysis to facilitate comparison and interpretation. This reduced subset of failure modes enables a more intuitive assessment of how changes in risk factors influence the prioritization outcomes of different FMECA methods.
Table 7 summarizes the FMECA results for the case study, including the ranking obtained using the classical FMECA method [48]. Notably, this table reveals one of the common limitations of the classical RPN approach: the Occurrence of ties in risk prioritization. For example, failure modes FM4 and FM5 both have an RPN of 240, as do FM7 and FM8 and FM13 and FM14, each with an RPN of 168.
Table 7.
Classical FMECA and ranking for the method RPI(SC5) for the case study about risk assessment in power transformers [48].
To conduct the agreement analysis, the ranking obtained using the Risk Priority Index (RPI) method described in [47] was adopted as the reference. Specifically, scenario SC5 was selected, as it applies weights of 0.5 for Severity, 0.3 for Occurrence, and 0.2 for Detection; this RPI scenario yielded the best performance in the simulations conducted in [47] and was also shown to be suitable for electrical grid applications, as demonstrated in [49]. The last column of Table 7 shows the reference ranking produced by RPI(SC5).
The following section presents the type-2 fuzzy inference systems developed to support the comparative analysis of FMECA rankings conducted in this study.
5. Type-2 Fuzzy-Based FMECA Methods
This paper examines the application of a Mamdani type-2 fuzzy inference system to enhance the classical FMECA method by providing a more robust treatment of uncertainty. The use of Cohen’s kappa allows a direct comparison of the results with the reference ranking RPI(SC5).
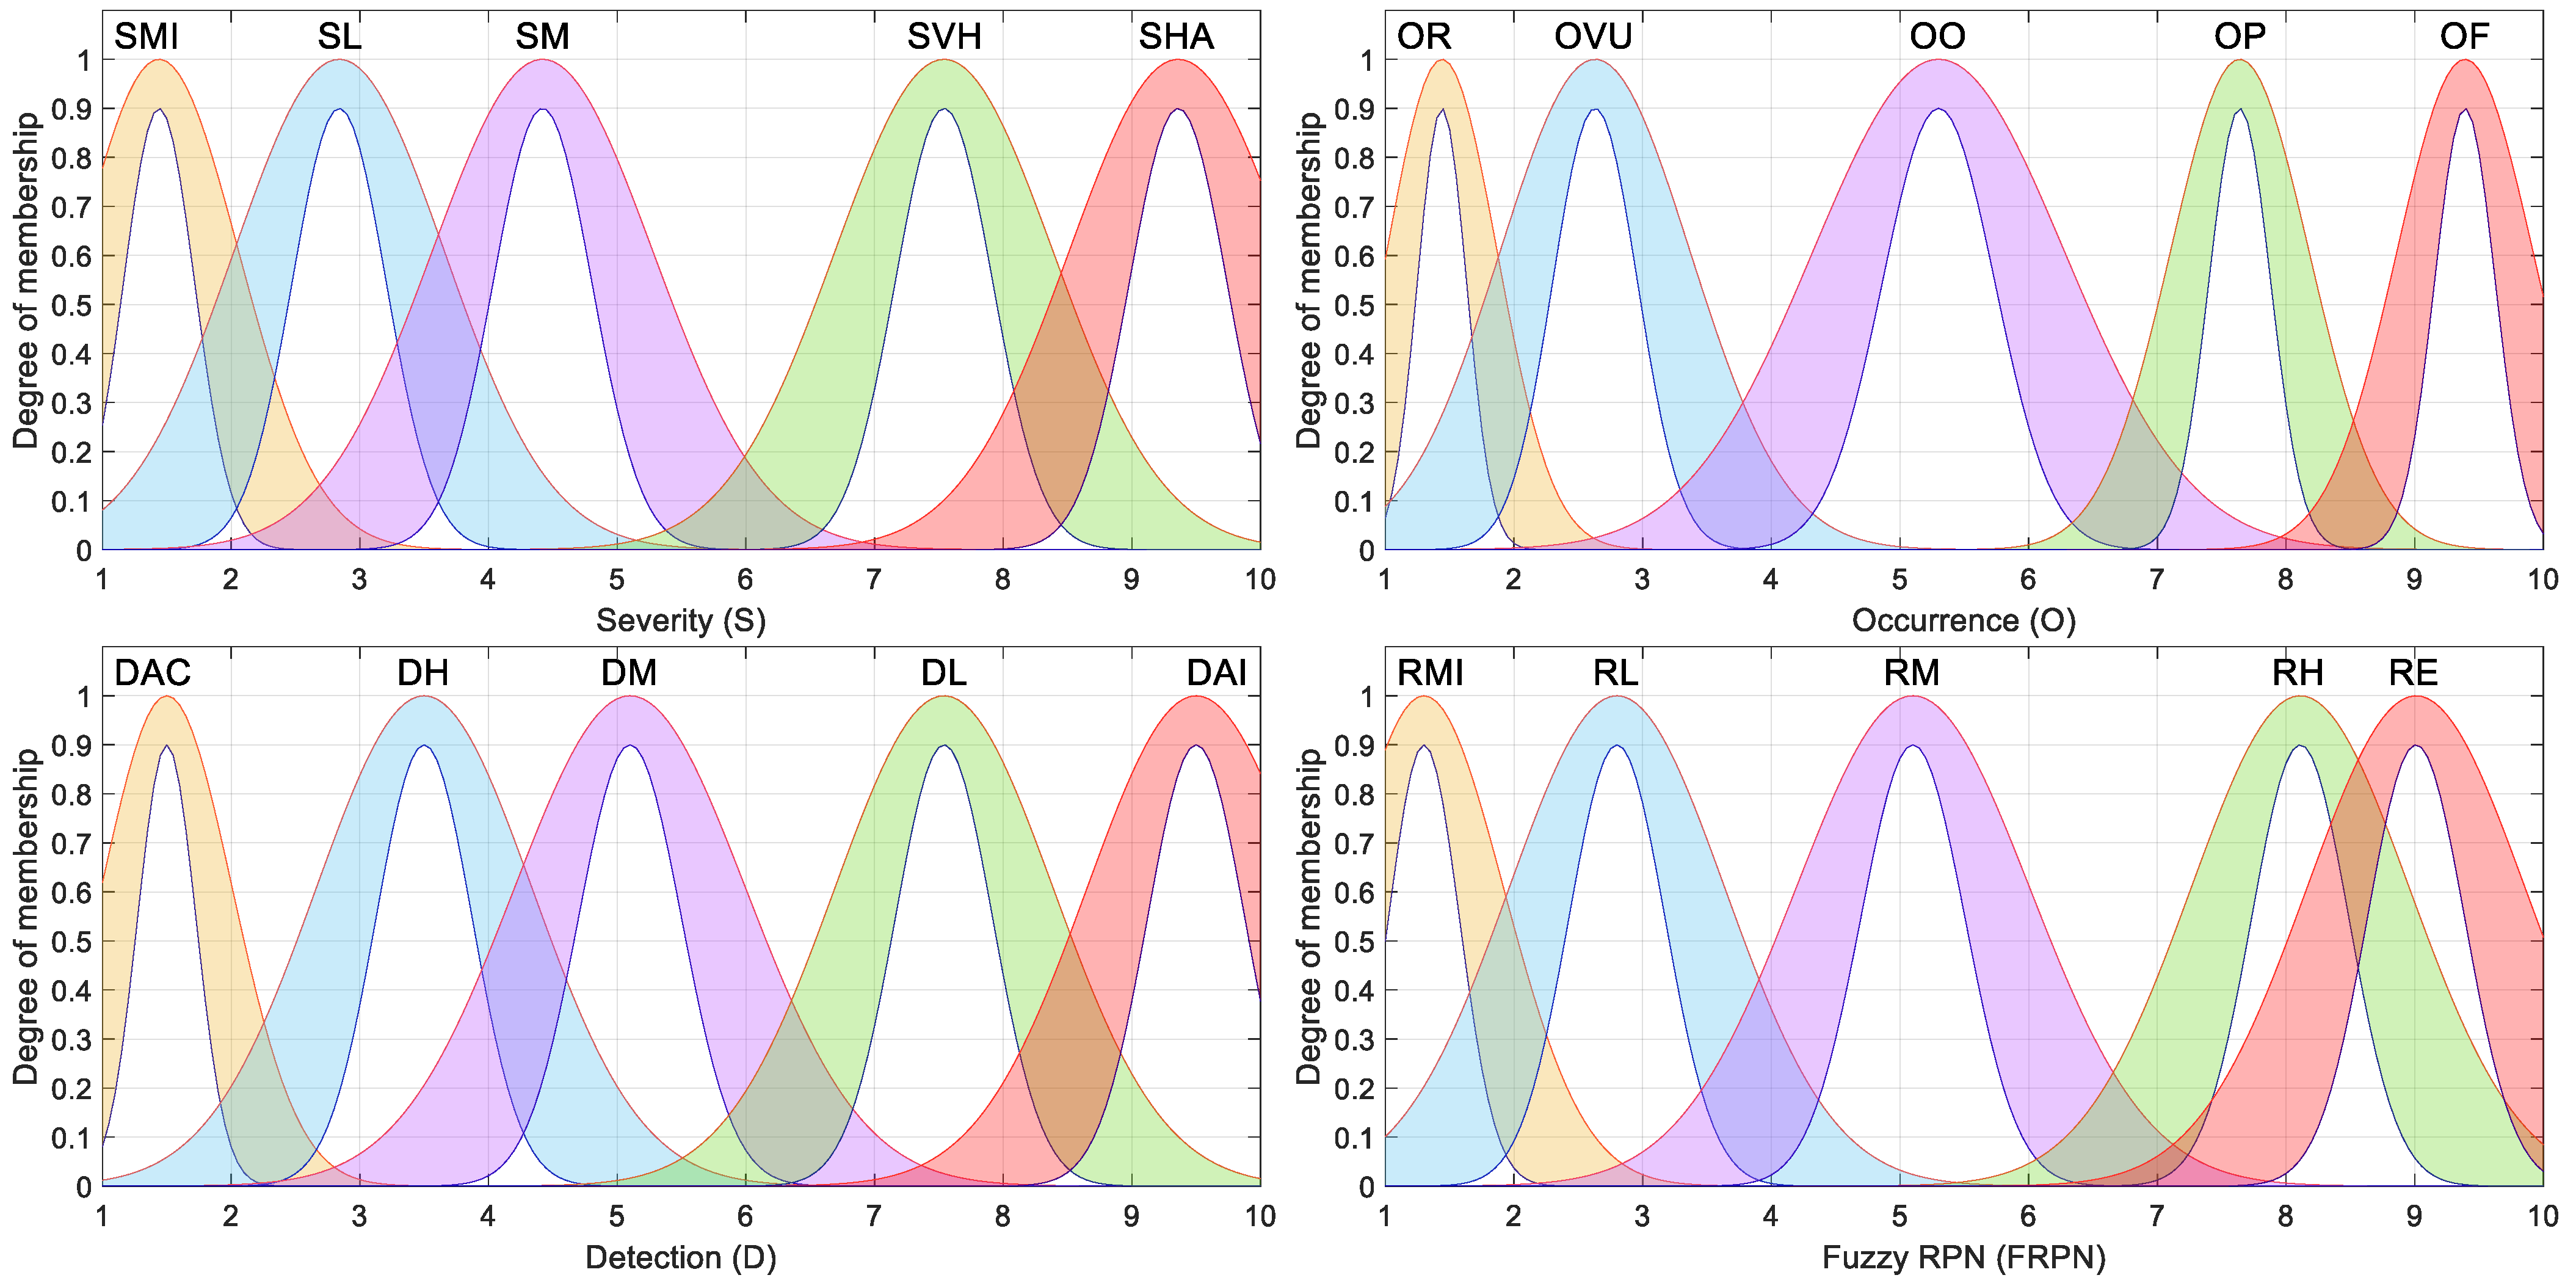
To model the three risk factors, five linguistic categories were defined for each risk factor, as shown in Table 8. These categories were converted into fuzzy sets using type-2 membership functions, which enabled a more accurate representation of ambiguity in expert judgment.
Table 8.
Categories for the risk factors in the fuzzy FMECA.
5.1. Membership Functions of Type-2 Fuzzy Inference System
In this work, four types of membership functions were considered: triangular, trapezoidal, Gaussian, and g-bell membership functions. A pair of upper and lower limits defines each membership function.
The type-2 triangular membership function is represented by its upper limit, triU, and its lower limit, triL. The upper triangular membership function is defined in terms of parameters a+, b+, and c+, as shown in Equation (14) [50]. The lower triangular membership function is defined in terms of parameters a−, b−, c−, and an additional term called scl that represents the maximum membership value, as suggested in [50] and shown in Equation (15).
The parameters for each triangular fuzzy set are listed in Table 9, while Figure 1 shows their graphical representation.
Table 9.
Triangular membership functions for the type-2 fuzzy inference system.

Figure 1.
Triangular type-2 fuzzy membership functions considered for the fuzzy-based FMECA.
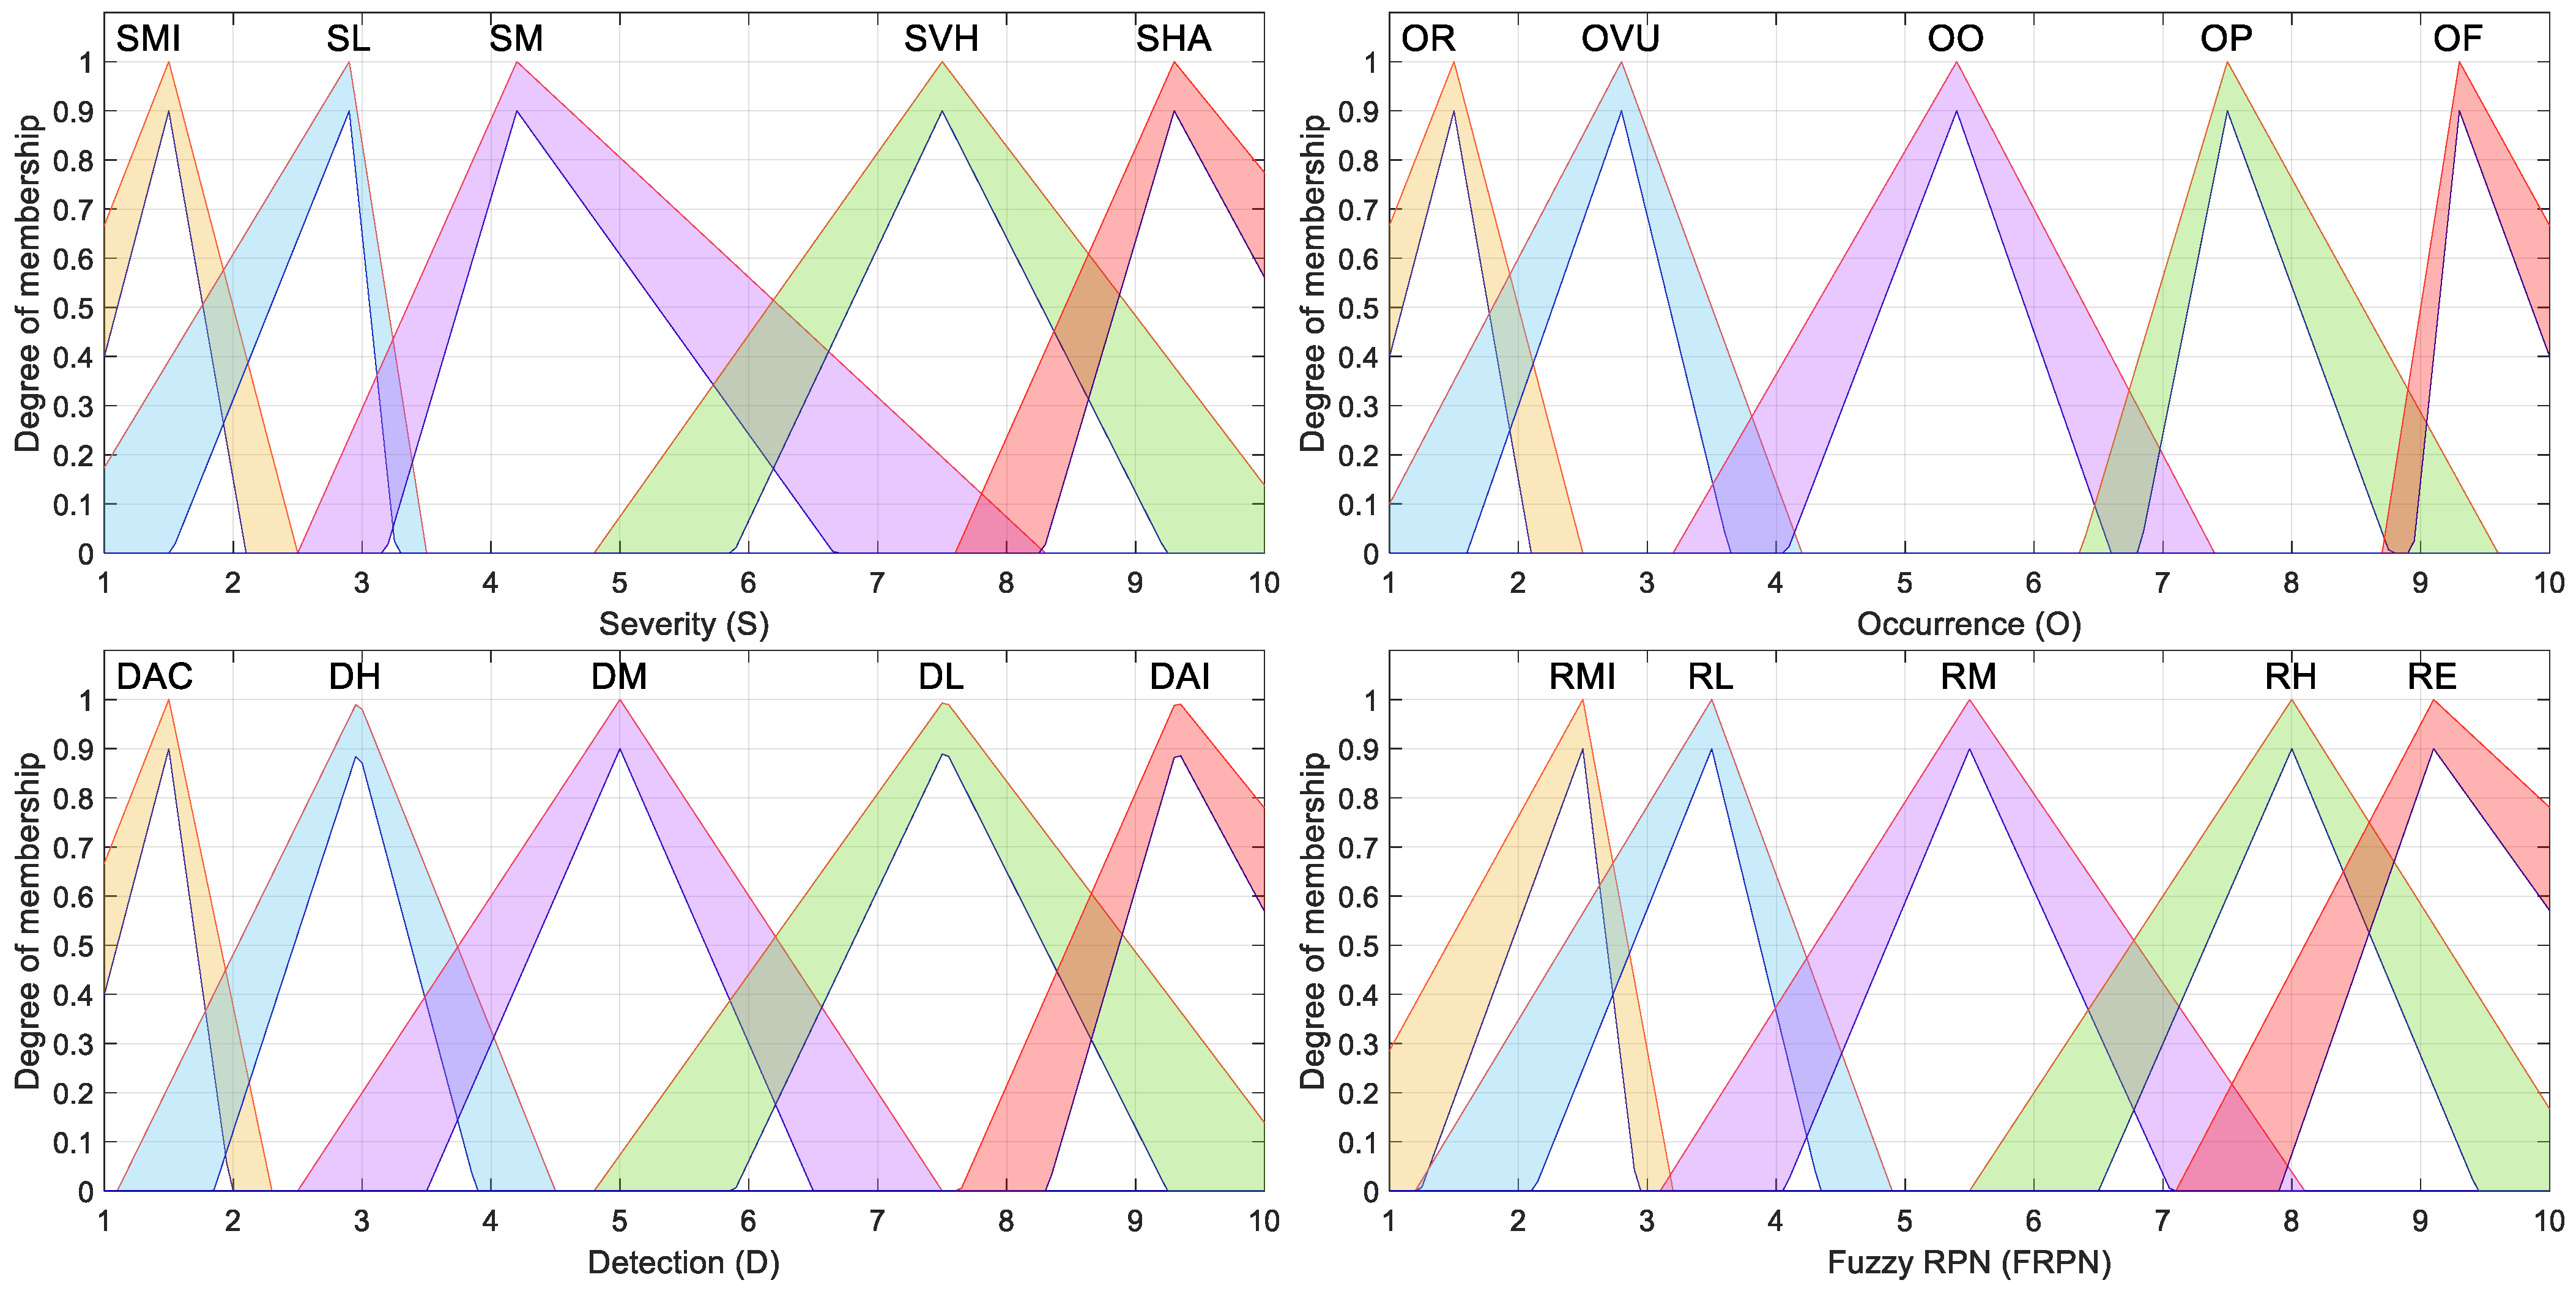
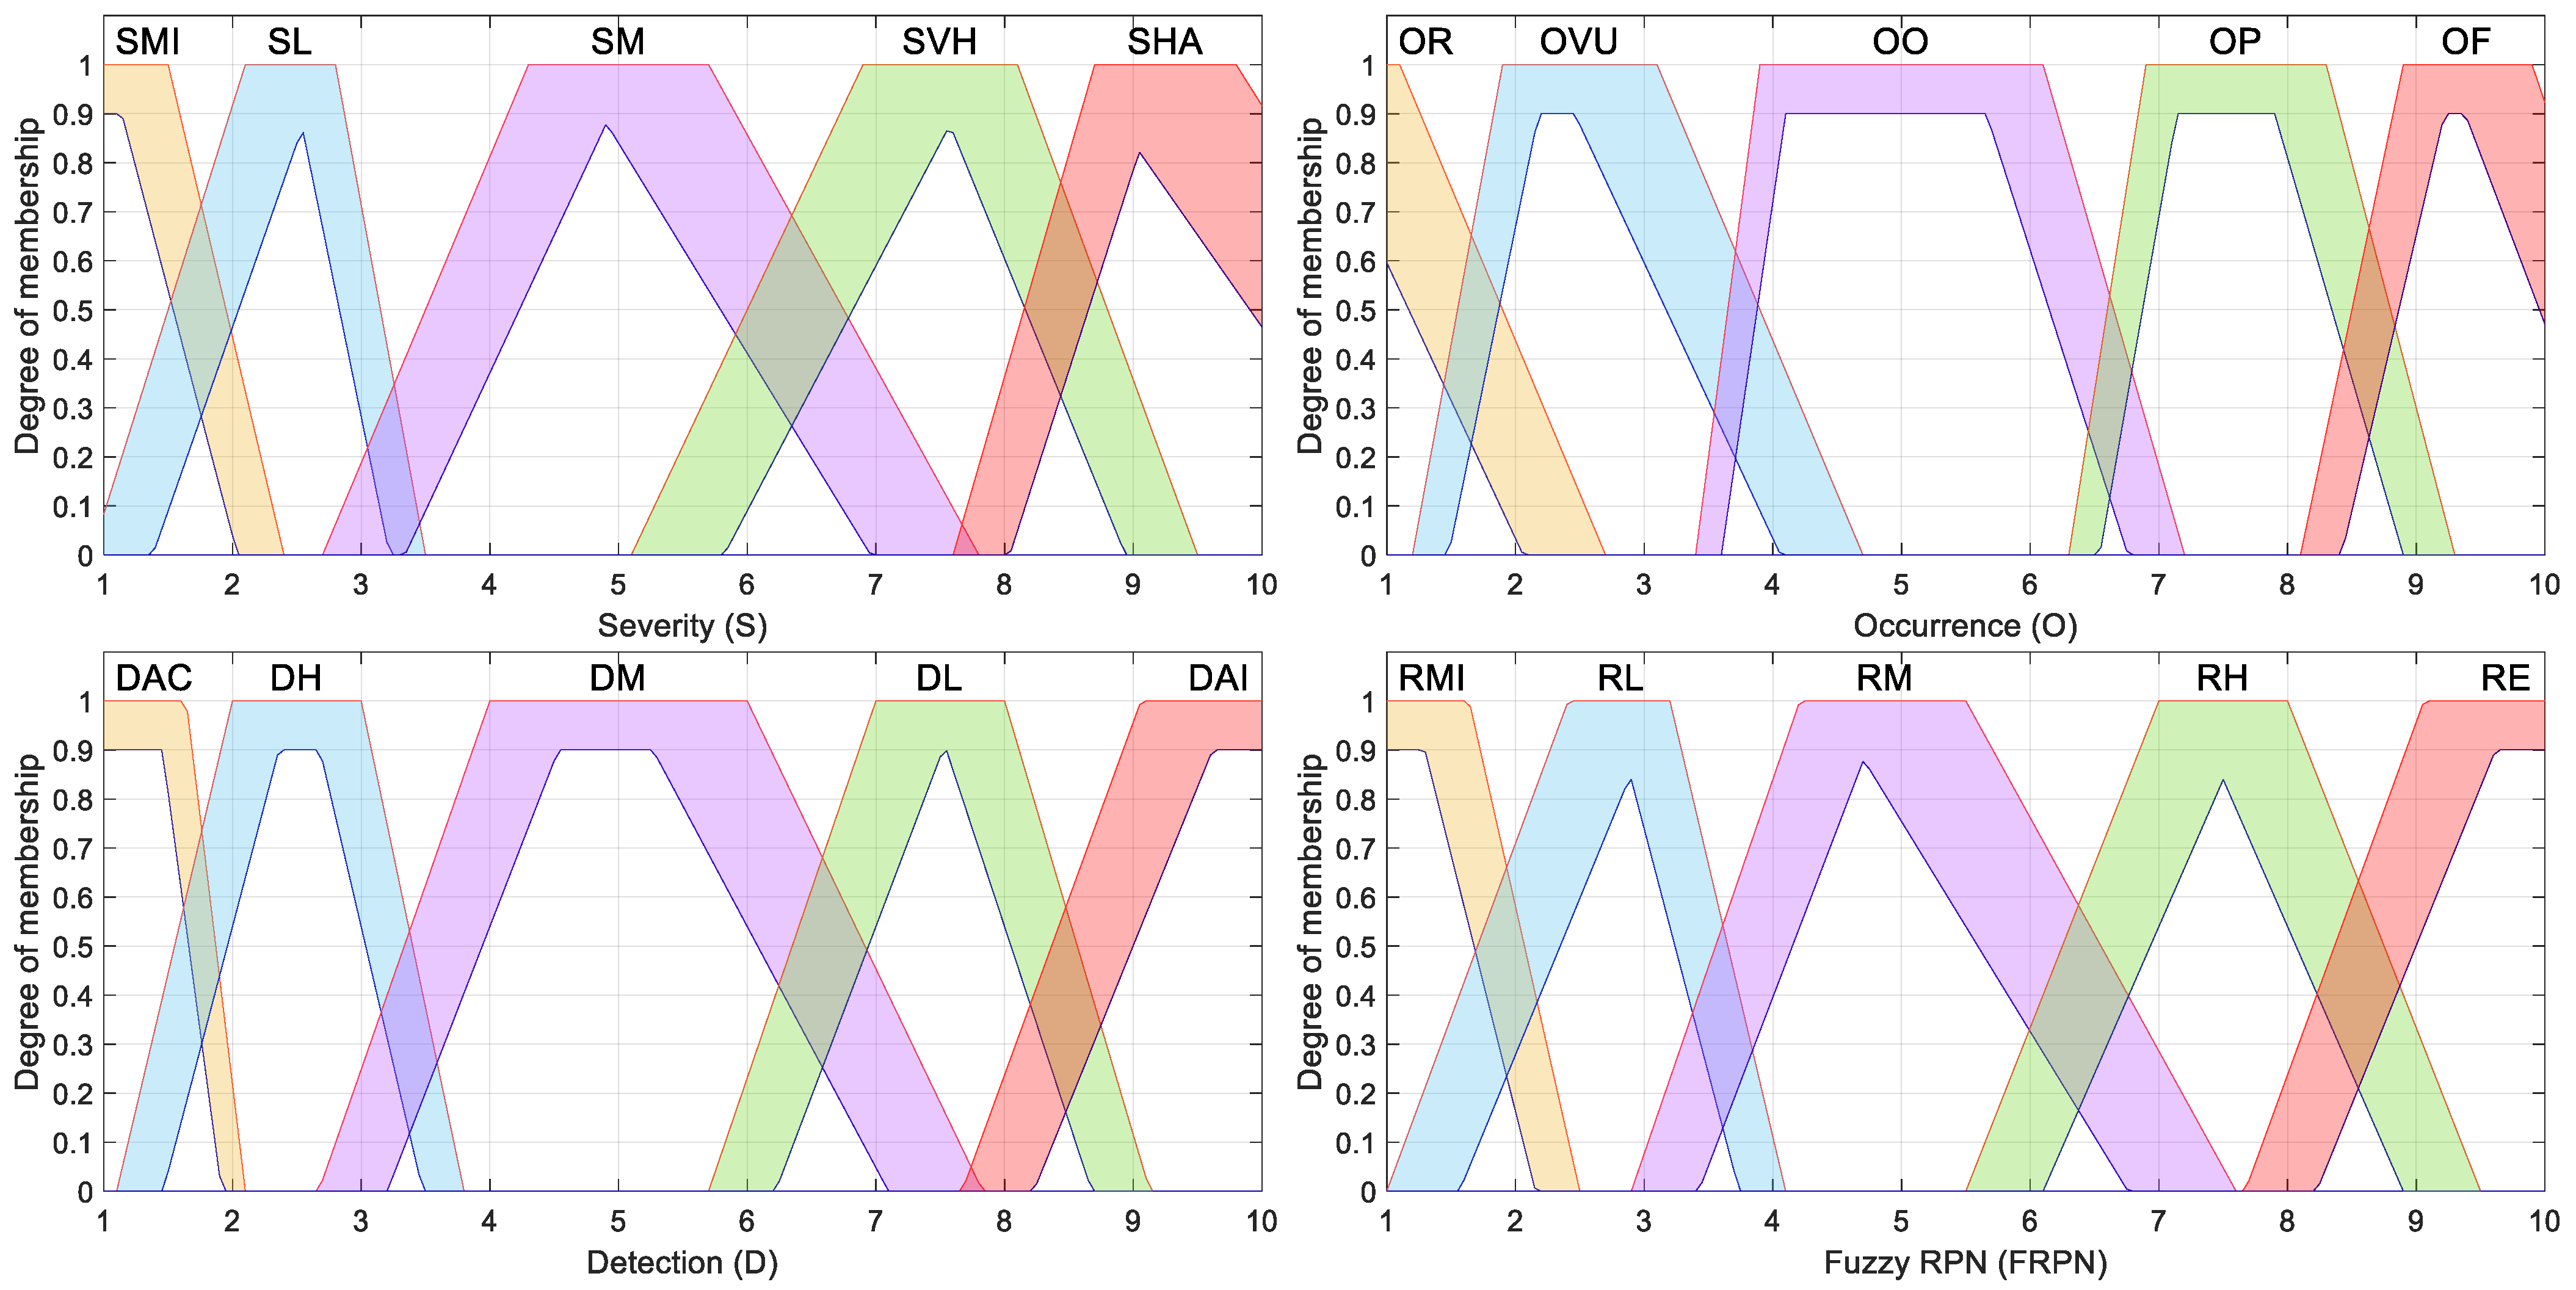
The type-2 trapezoidal membership function is represented by its upper limit, trapU, and its lower limit, denoted by trapL. The upper trapezoidal membership function is defined in terms of parameters a+, b+, c+, and d+, as shown in Equation (16) [50]. The lower trapezoidal function is defined in terms of parameters a−, b−, c−, d−, and an additional term called scl that represents the maximum membership value, as shown in Equation (17) and suggested in [50].
Table 10 contains the parameters used for the trapezoidal membership functions; Figure 2 shows their graphical representation.
Table 10.
Trapezoidal membership functions for the type-2 fuzzy inference system.
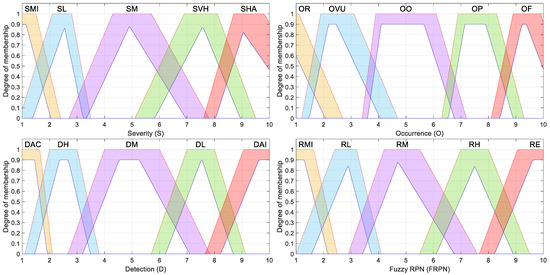
Figure 2.
Trapezoidal type-2 fuzzy membership functions considered for the fuzzy-based FMECA.
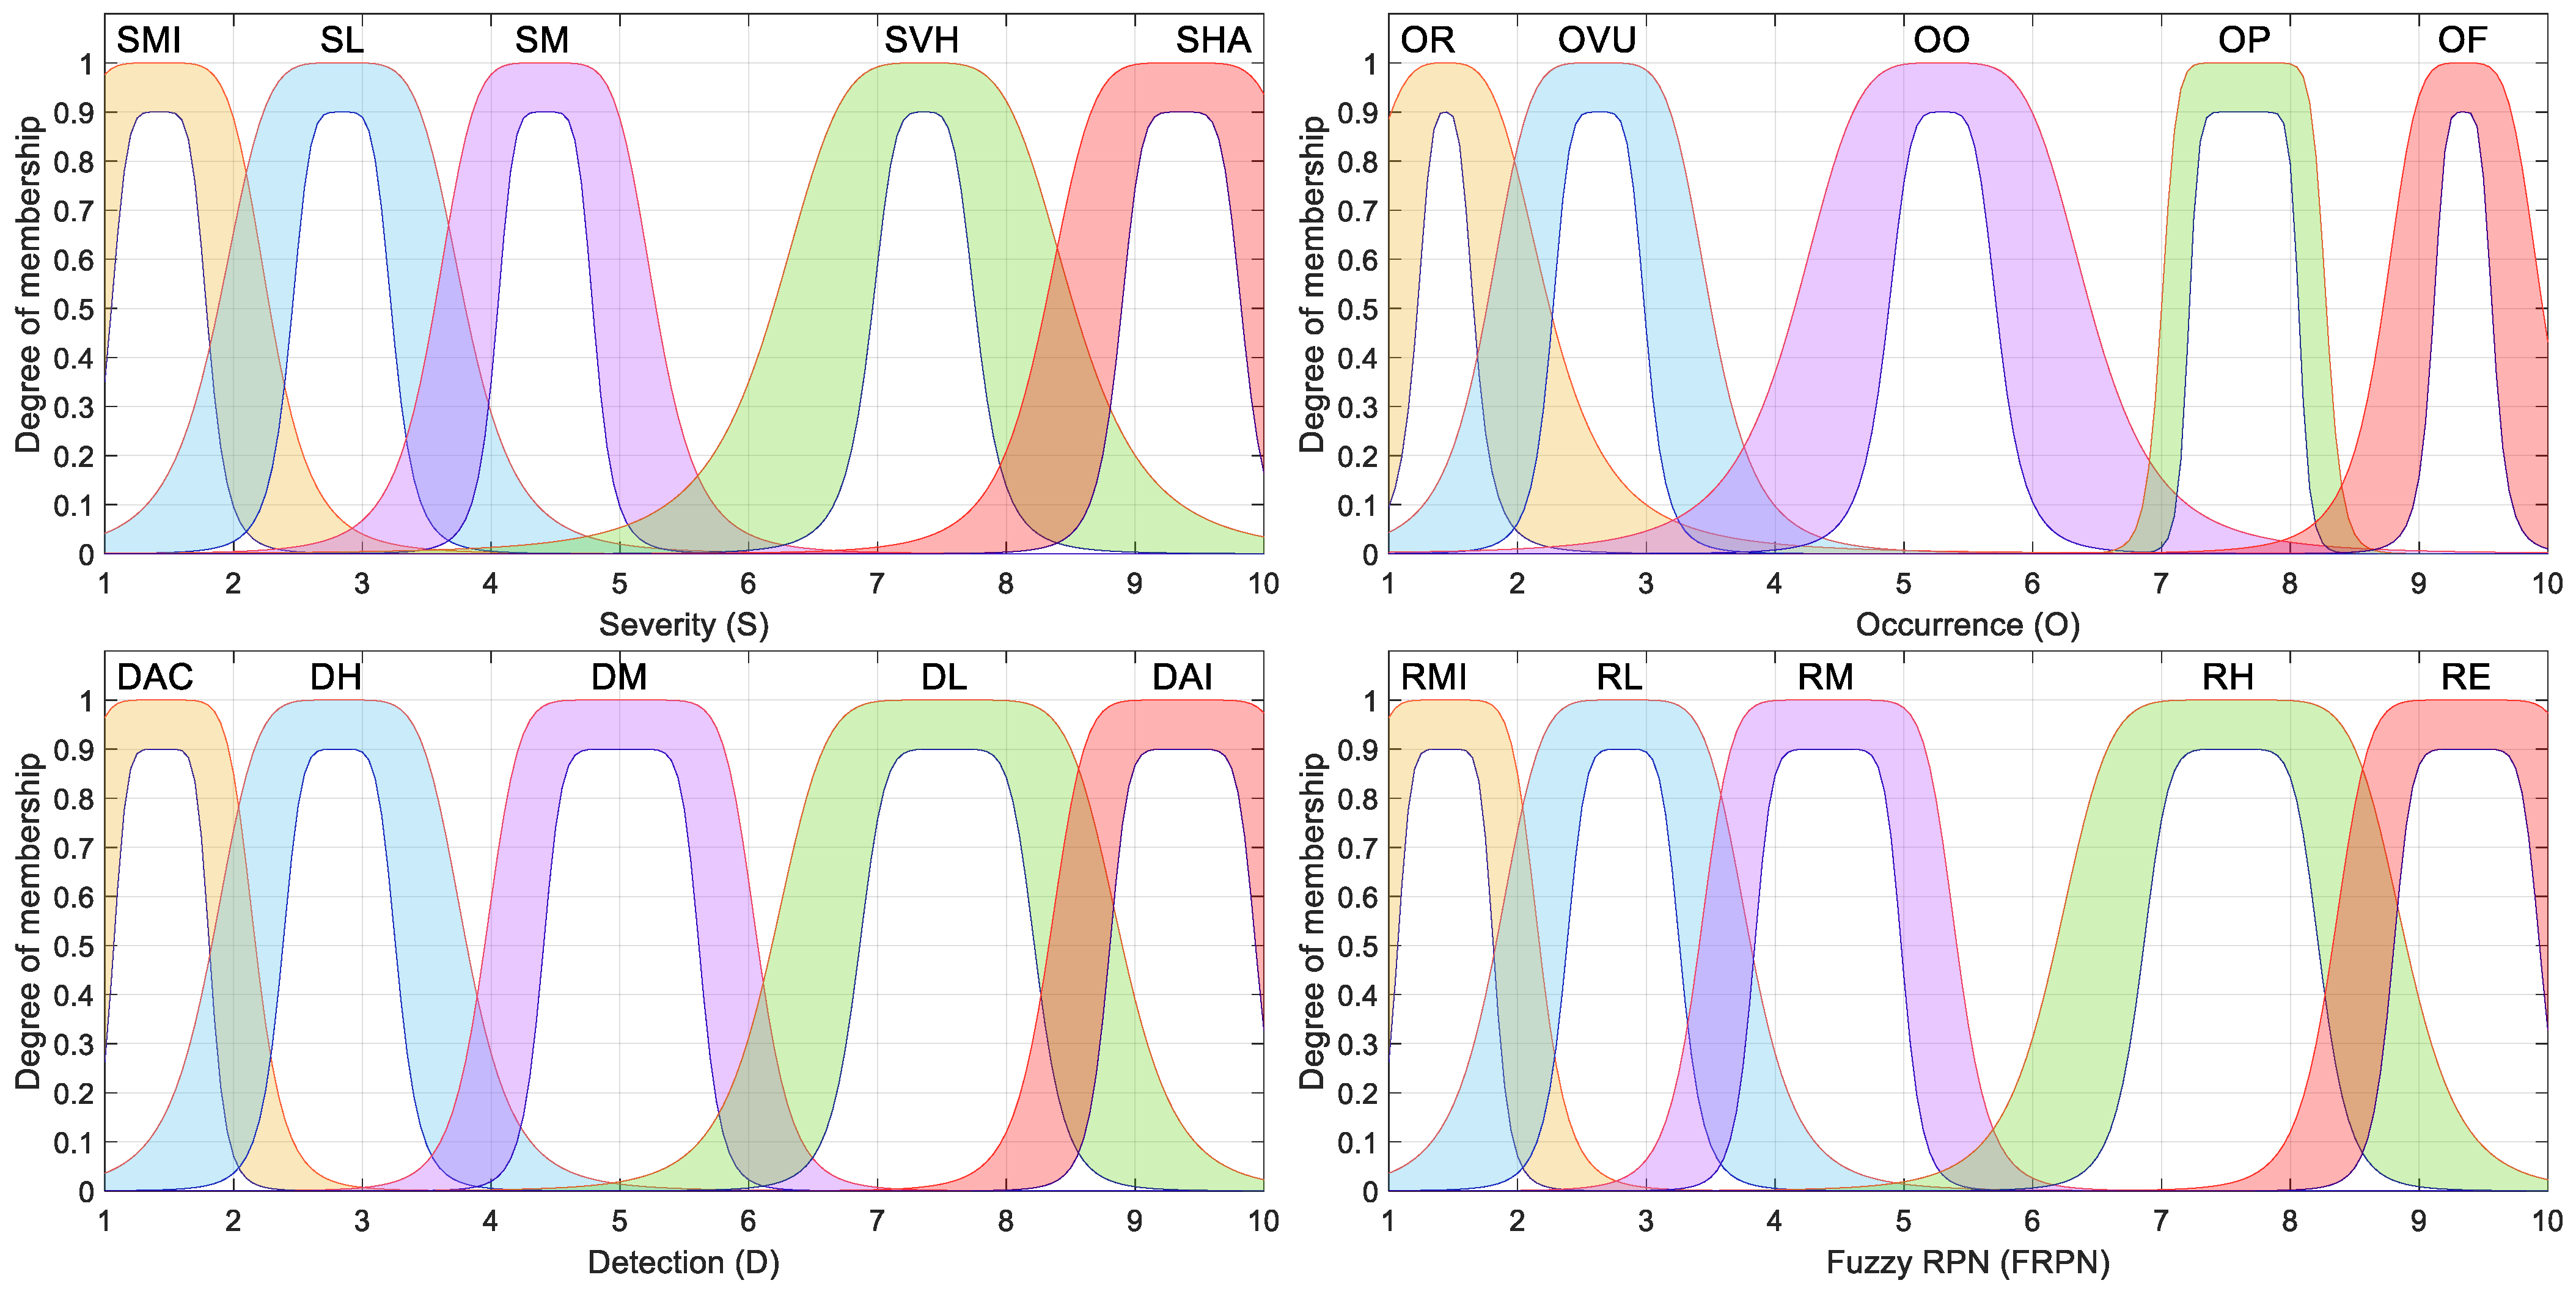
The type-2 generalized bell membership function (g-bell) is advantageous in modeling symmetric but smoother transitions between categories; it can be represented by its upper limit, denoted by gbellU, and its lower limit, denoted by gbellL. The upper g-bell membership function can be defined in terms of the parameters a+, b+, and c+, as shown in Equation (18) [50], and the lower g-bell membership function can be defined in terms of the parameters a−, b−, c−, and an additional term called scl that represents the maximum membership value, as shown in Equation (19) and suggested in [50].
Table 11.
G-bell membership functions for the type-2 fuzzy inference system.
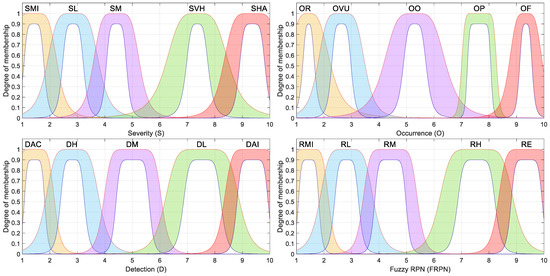
Figure 3.
G-bell type-2 fuzzy membership functions considered for the fuzzy-based FMECA.
The type-2 Gaussian membership function is widely used due to its smooth, continuous curves. It can be represented by its upper limit, denoted as gaussU, and its lower limit, denoted as gaussL. The upper Gaussian membership function can be defined using the parameters c+ and σ+, as shown in Equation (20) [50]. The lower Gaussian membership function can be defined in terms of the parameters c−, σ−, and an additional term called scl representing the maximum membership value, as shown in Equation (21) and suggested in [50].
Table 12.
Gaussian membership functions for the type-2 fuzzy inference system.
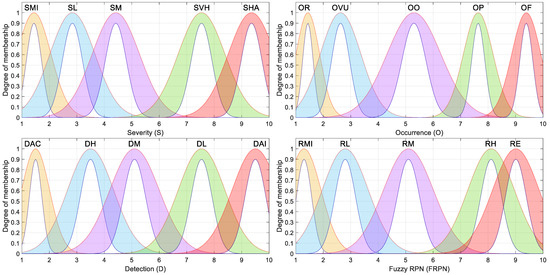
Figure 4.
Gaussian type-2 fuzzy membership functions considered for the fuzzy-based FMECA.
The membership functions described in this section are based on type-2 fuzzy sets and were proposed by the same FMECA expert team that previously collaborated on a classical FMECA for smart grids [51], as well as on a fuzzy-FMECA study applied to the same domain [49]. These functions were carefully designed to represent the expert knowledge and uncertainties typically encountered during FMECA risk evaluations in power systems. As shown in Figure 1, Figure 2, Figure 3 and Figure 4, each membership function incorporates a shaded region representing the footprint of uncertainty (FOU), which corresponds to the area bounded by the upper and lower membership functions. This FOU characterizes both the imprecision in the numerical boundaries of the categories and the vagueness inherent in linguistic terms and subjective expert assessments.
The triangular and trapezoidal membership functions used for certain risk factors (Figure 1 and Figure 2) were intentionally designed to be asymmetric and decentered from the midpoints of their respective categories. This asymmetry reflects realistic patterns in expert elicitation, where transitions between categories (e.g., from “Moderate” to “High”) are not always perceived as symmetric or linear. The decision to offset the peak of the membership functions was made to better align with empirical observations and practical judgments, recognizing that experts often interpret risk levels with biases or thresholds influenced by context-specific factors.
In contrast, the generalized bell-shaped and Gaussian membership functions (Figure 3 and Figure 4), while symmetric by definition, were intentionally not centered on the exact midpoints of their respective categories. Instead, they were slightly offset to better capture domain-specific patterns in risk perception, thereby improving the expressiveness of the fuzzy model.
By incorporating both geometric flexibility (through asymmetry and shifts) and vertical uncertainty (via the FOU), these membership functions offer a balanced trade-off between interpretability and realism. This modeling consideration improves the sensitivity and adaptability of the fuzzy-FMECA models when prioritizing failure modes under uncertain or incomplete information.
5.2. Rule Base for the Type-2 Fuzzy Inference System
In the present approach, the fuzzy inference system utilizes a complete rule base constructed from all possible combinations of the three risk factors, each of which is defined by five fuzzy linguistic categories. As a result, the fuzzy rule base comprises 5 × 5 × 5 = 125 distinct rules. Each rule maps a unique combination of input categories to a corresponding Fuzzy Risk Priority Number (FRPN) output.
The assignment of output categories in the rule consequents reflects the subjective risk perception of FMECA experts. This enables the model to integrate expert reasoning in a structured and traceable way.
The following rules exemplify how this expert-based mapping is operationalized within the fuzzy inference system:
- Fuzzy Rule 26: If (SEVERITY is SL) and (OCCURRENCE is OR) and (DETECTION is DAC), then (FRPN is MI).
- Fuzzy Rule 59: If (SEVERITY is EM) and (OCCURRENCE is OO) and (DETECTION is DL), then (FRPN is RM).
The rule base plays a central role in shaping how risk factor combinations are interpreted and mapped according to risk priority classes.
5.3. Properties of the Type-2 Fuzzy Inference System
The fuzzy inference system was implemented considering the following properties:
- FIS type: Type-2 Mandani;
- And method: Min;
- Or method: Max;
- Implication Method: Min;
- Aggregation Method: Max;
- Type reduction method: Karnik–Mendel;
- Defuzzification method: Centroid.
5.4. Type-2 Fuzzy FMECA Cases
To evaluate the influence of different membership functions on the prioritization of failure modes, four distinct type-2 fuzzy inference system configurations were developed. These configurations combine the membership functions presented in Section 5.1 (triangular, trapezoidal, g-bell, and Gaussian), the fuzzy rule base defined in Section 5.2, and the fuzzy inference properties described in Section 5.3.
Each configuration varies the choice of membership functions associated with the three risk factors, MFSEV for Severity, MFOCC for Occurrence, and MFDET for Detection, as well as with the membership function MFRPN for Fuzzy Risk Priority Number. Table 13 summarizes the specific combinations of membership functions used in each configuration.
Table 13.
Configurations of FMECA methods based on type-2 fuzzy inference system.
These configurations enable a comparative analysis of how different fuzzy modeling strategies, particularly the shape and distribution of membership functions, affect the prioritization of failure modes in FMECA. They also serve as the experimental basis for the evaluation conducted in the next section, where the level of agreement between each fuzzy-based FMECA configuration and the reference FMECA method is assessed using Cohen’s kappa coefficient.
5.5. Overview of the Proposed Evaluation Framework
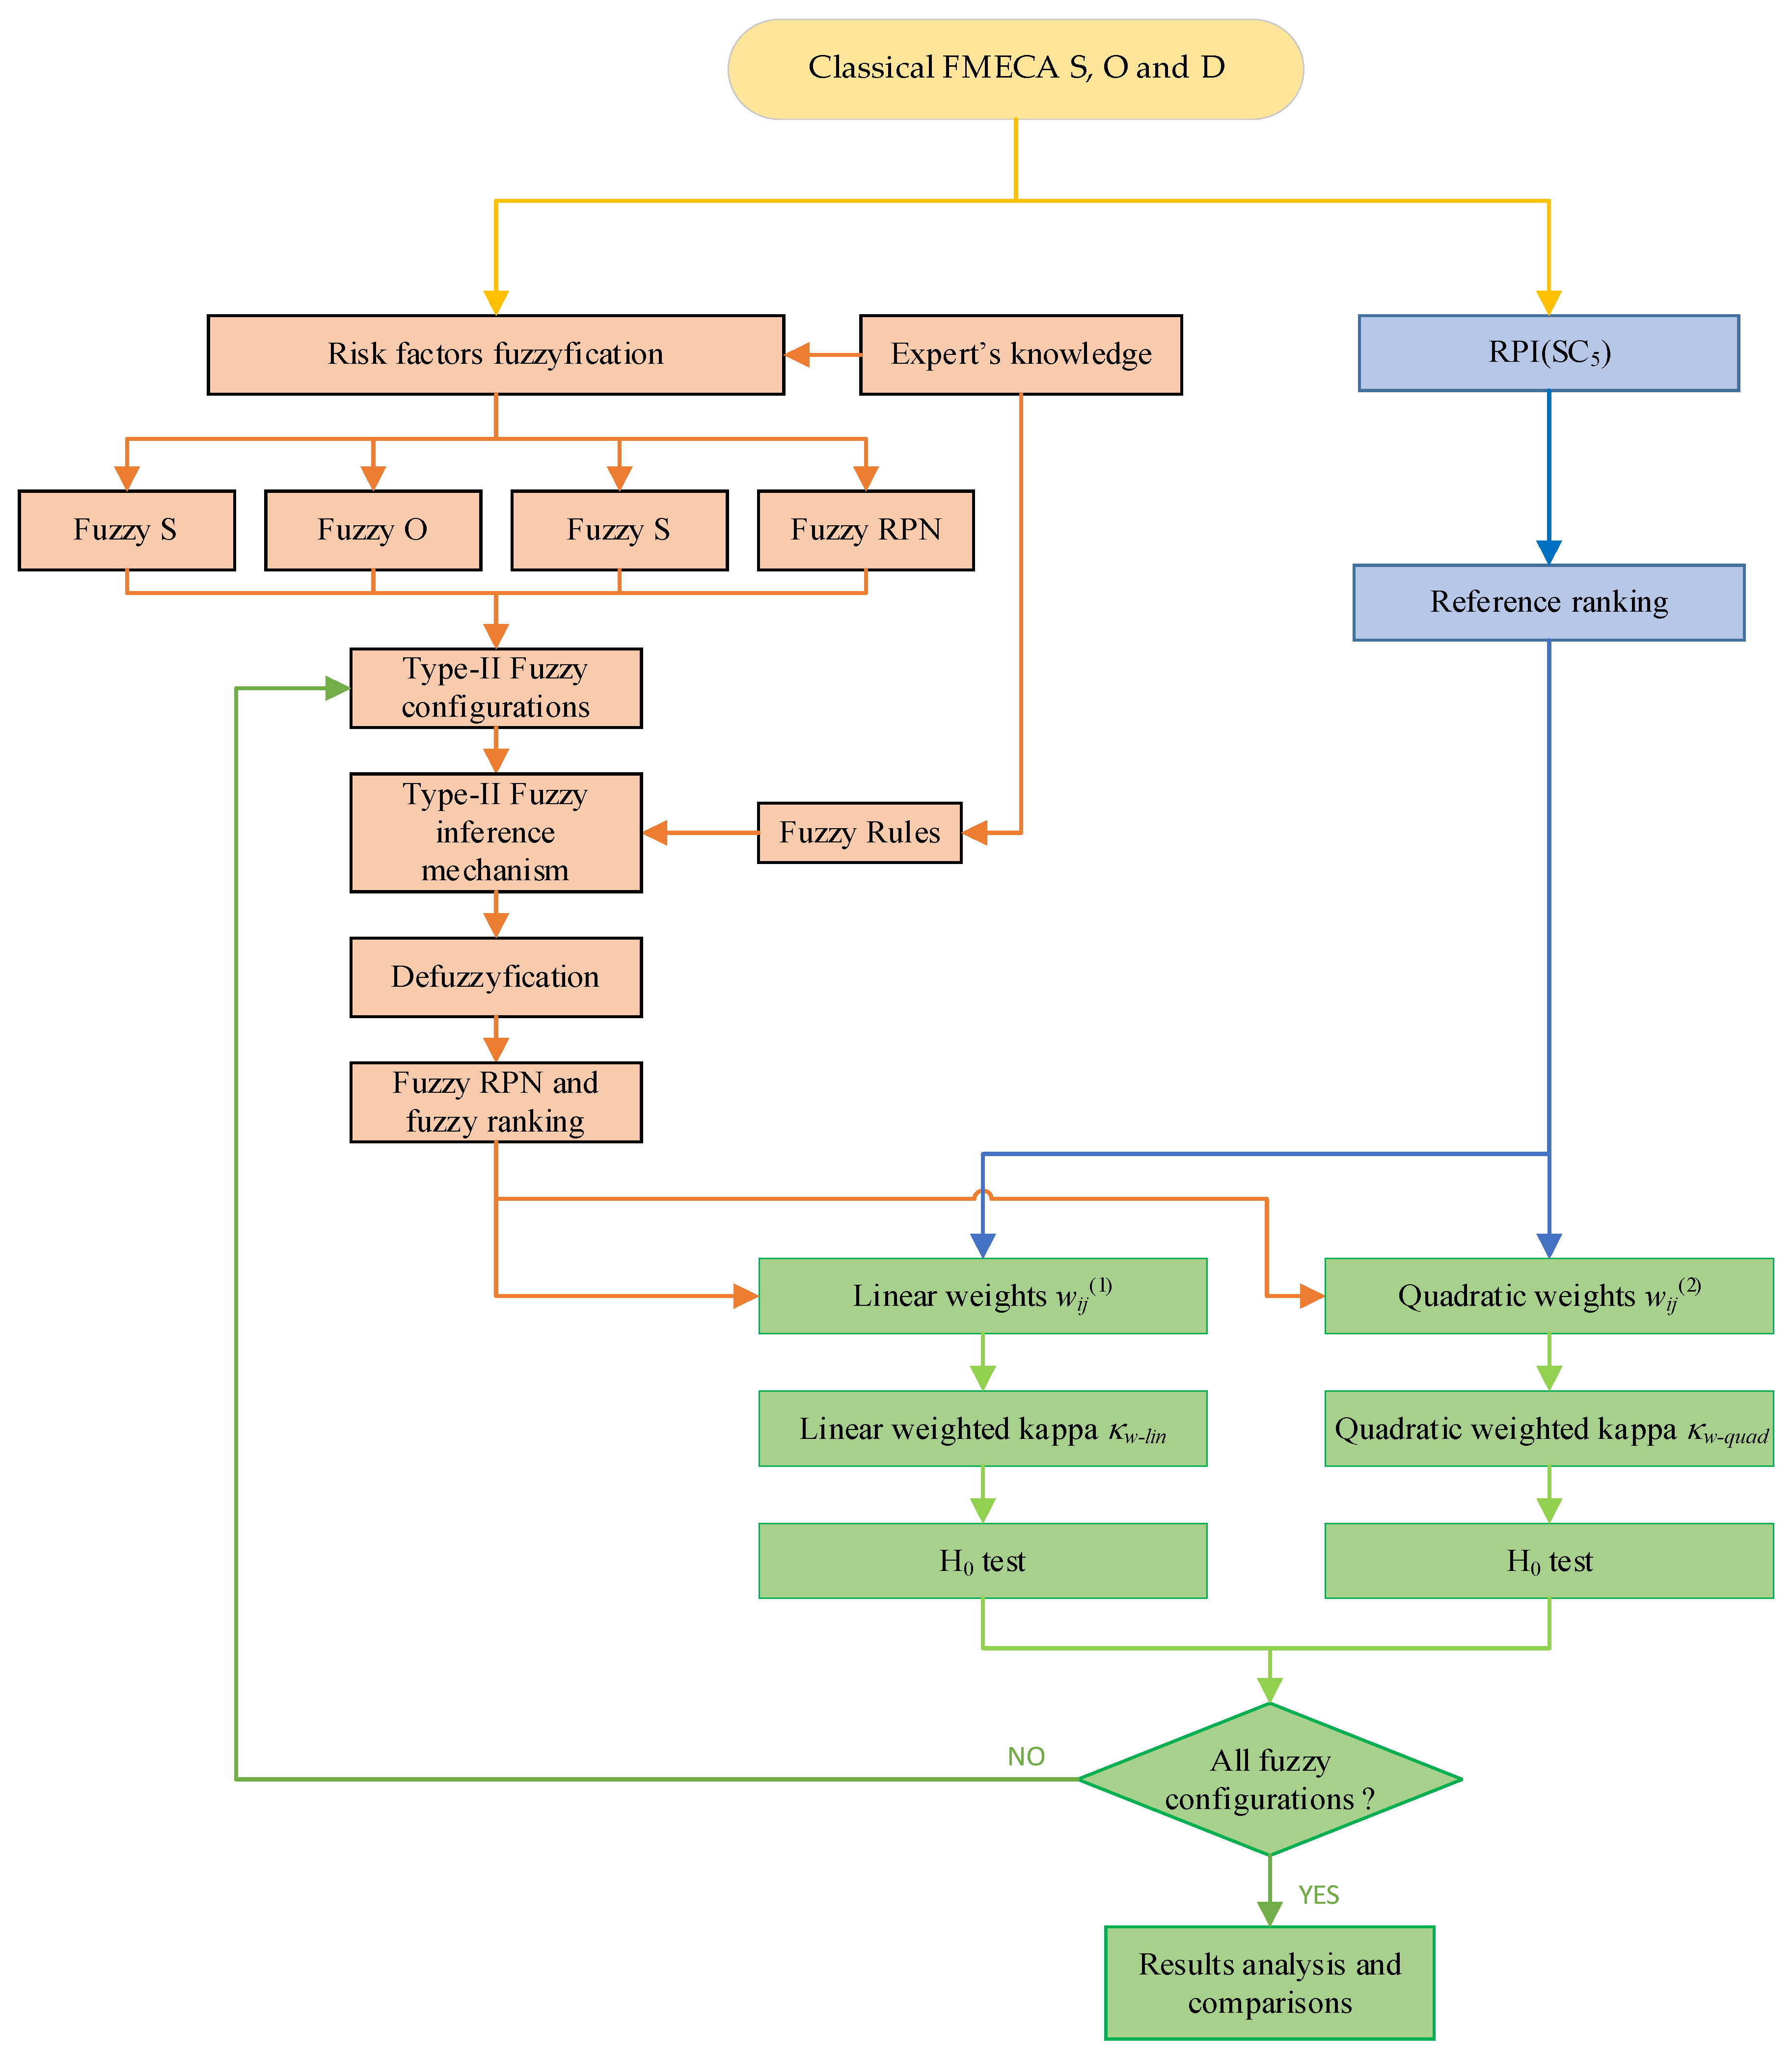
Figure 5 presents a flowchart illustrating the complete methodology adopted in this study to evaluate and compare fuzzy-based FMECA configurations.
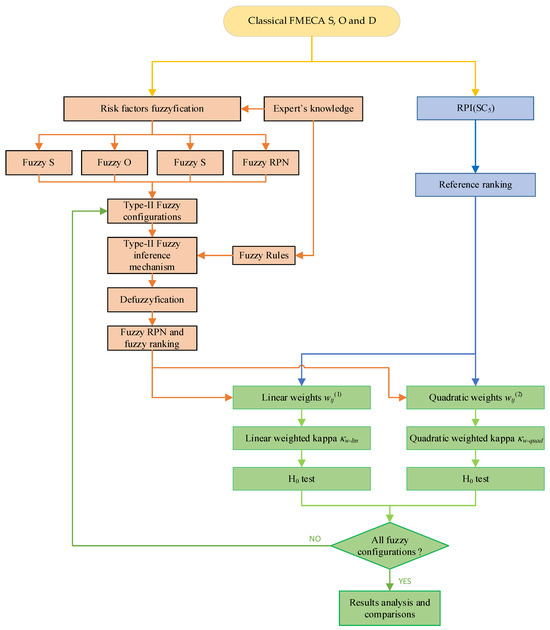
Figure 5.
Flowchart of the proposed approach. The ype-2 Mamdani-based FMECA process is depicted in orange, the RPI(SC5)-based reference ranking is illustrated in blue, and the weighted kappa evaluation procedure is presented in green.
The process is divided into three main segments, each represented by a different color in the diagram for clarity and structure: the fuzzy-FMECA modeling path (orange), the reference ranking generation via RPI(SC5) (blue), and the statistical evaluation based on weighted kappa coefficients (green).
The procedure begins with the classical FMECA input data, consisting of the risk factors Severity (S), Occurrence (O), and Detection (D). These factors are subjected to a fuzzification stage, where type-2 fuzzy membership functions are assigned. The fuzzified risk factors, combined with expert-defined fuzzy rules, are then processed by a type-2 Mamdani fuzzy inference mechanism to obtain fuzzy RPN values and corresponding risk prioritization rankings. This process is repeated for each of the six fuzzy configurations defined earlier in Section 5.4.
In parallel, a reference ranking is generated using the RPI(SC5) method proposed by Anes et al. in [47]. It is essential to note that RPI(SC5) is not the primary focus of this study; rather, it serves as a consistent and well-justified benchmark against which the fuzzy-based methods can be evaluated. Its selection was justified in Section 3.
To assess the agreement between the rankings produced by the fuzzy-based FMECA models and the reference ranking, two weighting schemes are applied: linear and quadratic. For each scheme, Cohen’s weighted kappa coefficient is computed to quantify the concordance, followed by hypothesis testing to determine statistical significance.
Once the agreement metrics are calculated for all fuzzy configurations under both weighting schemes, the final step involves comparative analysis and interpretation of the results.
6. Results and Discussion
This section presents and discusses the agreement between the rankings generated by the six fuzzy-based FMECA configurations presented in Table 13 and the reference method RPI(SC5), using Cohen’s weighted kappa coefficient. The analysis considers both linear and quadratic weighting schemes, exploring how different modeling choices, particularly the membership functions used for the three risk factors and the Fuzzy RPN, affect the consistency of prioritization results.
6.1. Results Considering the Linear Weighted Kappa
Table 14 presents the agreement results between the reference FMECA ranking RPI(SC5) and the six fuzzy-based configurations (T2-FIS 01 to T2-FIS 06), based on the linear weighted kappa coefficient κw-lin. This table presents the rankings assigned to each failure mode, the corresponding kappa values, the strength of agreement, the test statistic, and the outcomes of the hypothesis tests.
Table 14.
Linear weighted kappa κw-lin between reference ranking RPN-rank and type-2 fuzzy inference systems.
Triangular membership functions used in this work (Figure 1), although computationally simple, are not symmetric concerning their peak, nor is the maximum value located at the geometric center of each category. Nevertheless, in T2-FIS 03, their use for Severity appears effective, possibly because Severity is often rated with more consensus among experts, reducing the impact of the membership functions’ asymmetry. The trapezoidal membership functions used for FRPN in this configuration (Figure 2), while also asymmetric and not centered, providing wider support regions that may have helped in aggregating fuzzy values more smoothly.
In contrast, configuration T2-FIS 06 produced the lowest agreement (κw-lin = 0.4154), classified as “moderate agreement”. This configuration used a g-bell function for Severity, a triangular function for Occurrence, and trapezoidal functions for both Detection and FRPN. Several factors may contribute to this lower performance. First, the triangular MFs used for Occurrence are asymmetric and exhibit sharp transitions, which may limit their expressiveness in modeling uncertainty due to incomplete failure data, particularly when Occurrence is not based on robust statistics. Second, the trapezoidal MFs used for Detection and FRPN, while offering broader support, can introduce ambiguity near membership transitions, especially if the flat tops are not well aligned with the central values of their respective categories. Such ambiguity may lead to less accurate activation of fuzzy rules and less precise inference outputs.
Intermediate κw-lin values were obtained by configurations T2-FIS 05 with kappa equal to 0.6308 and T2-FIS 04 and T2-FIS 04, both equal to 0.6615. These configurations differ primarily in the combinations of trapezoidal, Gaussian, and g-bell membership functions (MFs) assigned to the input and output variables. For instance, T2-FIS 05 uses trapezoidal MFs for Severity, Gaussian for Occurrence, g-bell for Detection, and trapezoidal for FRPN. The presence of smooth, symmetric MFs (g-bell and Gaussian) in at least one of the subjective inputs (D or O) seems to improve alignment with the reference ranking, though not enough to surpass the performance of T2-FIS 03.
Interestingly, T2-FIS 02, which combines Gaussian membership functions for Severity and Occurrence, also achieved a relatively high agreement (κw-lin = 0.6615); this is the same kappa value obtained by T2-FIS 04, even though their assigned rankings differ for several failure modes. This equivalence in agreement strength despite differing rankings highlights an important feature of the weighted kappa coefficient: it accounts not only for exact matches but also for the magnitude and distribution of disagreements across the rankings. That is, two configurations can have different ranking patterns, but if their deviations from the reference are similarly distributed in distance and direction, they may result in comparable kappa values.
From a modeling perspective, T2-FIS 02 uses smooth, symmetric functions for the two more uncertain risk factors (Severity and Occurrence), which may help capture uncertainty more consistently. However, it relies on trapezoidal MFs for Detection, which, due to their asymmetry and flat tops not centered on the category midpoints, may contribute to ambiguity near the rule activation thresholds, reducing overall model precision.
In contrast, T2-FIS 04 applies trapezoidal MFs for Severity, g-bell for Occurrence, triangular for Detection, and trapezoidal for FRPN. The use of g-bell functions for Occurrence likely contributes positively due to their symmetrical and flexible shape, but the triangular and trapezoidal MFs used elsewhere may have reduced the system’s sensitivity to subtle input variations. Notably, the triangular MFs used for Detection in this configuration are not symmetric and have sharper transitions, potentially limiting their ability to reflect gradual shifts in expert assessments.
The fact that both configurations reach the same κw-lin value suggests that the kappa statistic reflects an aggregate measure of concordance, rather than rewarding specific item-wise matches. This reinforces the idea that kappa-based agreement is a more robust and statistically grounded metric than simply comparing rankings, which may overlook broader consistency patterns or disproportionately penalize near matches. Therefore, even when the rankings differ, the overall distribution and Severity of disagreements may result in statistically equivalent levels of agreement, as seen with T2-FIS 02 and T2-FIS 04.
Finally, it is worth noting that all six configurations rejected the null hypothesis of agreement occurring by chance, as indicated by z-test values exceeding the critical threshold (z > 1.645). This confirms the statistical significance of the observed agreements and supports the reliability of the weighted kappa as a comparative metric across fuzzy-based FMECA models.
6.2. Results for Quadratic Weighted Kappa
Table 15 presents the agreement results between the reference ranking RPI(SC5) and the six fuzzy-based configurations (T2-FIS 01 to T2-FIS 06), using the quadratic weighted kappa coefficient (κw-quad). As with the linear weighting case, this metric captures not only exact matches but also the degree to which each ranked item deviates from the reference. However, the quadratic scheme penalizes larger deviations more heavily, making it more sensitive to distant mismatches in the rankings.
Table 15.
Quadratic weighted kappa κw-quad between reference ranking RPI(SC5) and type-2 fuzzy inference system.
The highest agreement was again achieved by T2-FIS 03, with κw-quad = 0.9033, falling within the “almost perfect” agreement category. This configuration utilizes triangular membership functions (MFs) for Severity, a Gaussian bell curve for Occurrence, a Gaussian curve for Detection, and a trapezoidal curve for False Rejection Probability of Non-Detection (FRPN). As discussed previously, this combination benefits from the smoothness and symmetry of Gaussian and g-bell functions, attributes that improve inference quality for variables subject to uncertainty and expert variability (notably Detection and Occurrence). The trapezoidal output MFs provide broader aggregation support, enhancing the model’s resolution. Despite the triangular MFs for Severity being asymmetric and off-centered, they appear suitable given the more consistent and less subjective nature of this risk factor.
As in the previous section, T2-FIS 02 achieved the second-highest kappa value (κw-quad = 0.8901), surpassing T2-FIS 04, which had shown identical κw-lin to T2-FIS 02 in the linear weighting case. Here, however, T2-FIS 04 drops to κw-quad = 0.8374. This divergence underscores a key distinction: under quadratic weighting, not only does the number of mismatches matter, but also their magnitude. T2-FIS 02 appears to exhibit smaller average deviations from the reference ranking than T2-FIS 04, despite having a similar total number of exact matches. This suggests that T2-FIS 02 produced disagreements that were closer to the reference, perhaps rank offsets of ±1, whereas T2-FIS 04 included some more severe outliers (e.g., FM6 and FM9). In modeling terms, T2-FIS 02 utilizes g-bell and Gaussian membership functions (MFs) for Severity and Occurrence, providing symmetry and smoother transitions, which may help maintain output consistency, especially when Detection and FRPN use trapezoidal and Gaussian MFs.
T2-FIS 05 shows a slightly better performance (κw-quad = 0.8549) than both T2-FIS 01 (κw-quad = 0.8418) and T2-FIS 04 (κw-quad = 0.8374), despite having only two exact ranking matches with reference, compared to two for T2-FIS 01 and six for T2-FIS 04. This highlights once more that the quadratic weighted kappa captures the overall proximity of rankings more effectively than simply counting exact matches. T2-FIS 05 utilizes trapezoidal functions for Severity and FRPN, Gaussian functions for Occurrence, and g-bell functions for Detection, a combination that likely contributed to its performance, enabling smoother aggregation and better modeling of subjectivity.
Configuration T2-FIS 01, despite using symmetric and relatively expressive functions (Gaussian for Occurrence and g-bell for Detection), has the lowest κw-quad among the “almost perfect” group (0.8418). This suggests that some of its ranking errors may be further from the reference. This may stem from its use of triangular MFs for Severity and FRPN, which, being asymmetric and narrow, may reduce expressiveness in aggregating fuzzy scores and lead to more rigid prioritization outcomes.
Finally, T2-FIS 06 exhibits the lowest agreement (κw-quad = 0.6571, “substantial” agreement). This configuration uses a g-bell for Severity, a triangular function for Occurrence, and a trapezoidal function for both Detection and FRPN. The combination of a complex shape (g-bell) for a typically less subjective input, such as Severity, with less expressive or abrupt transitions in the remaining factors, seems to impair consistency in the prioritization process. Additionally, triangular MFs for Occurrence may not adequately represent the uncertainty typical of that input when failure data are incomplete.
The T2-FIS 03 configuration consistently achieves the highest level of agreement under both schemes, suggesting that its fuzzy membership function design is particularly effective and can serve as a strong reference for future fuzzy-based FMECA applications in power transformers.
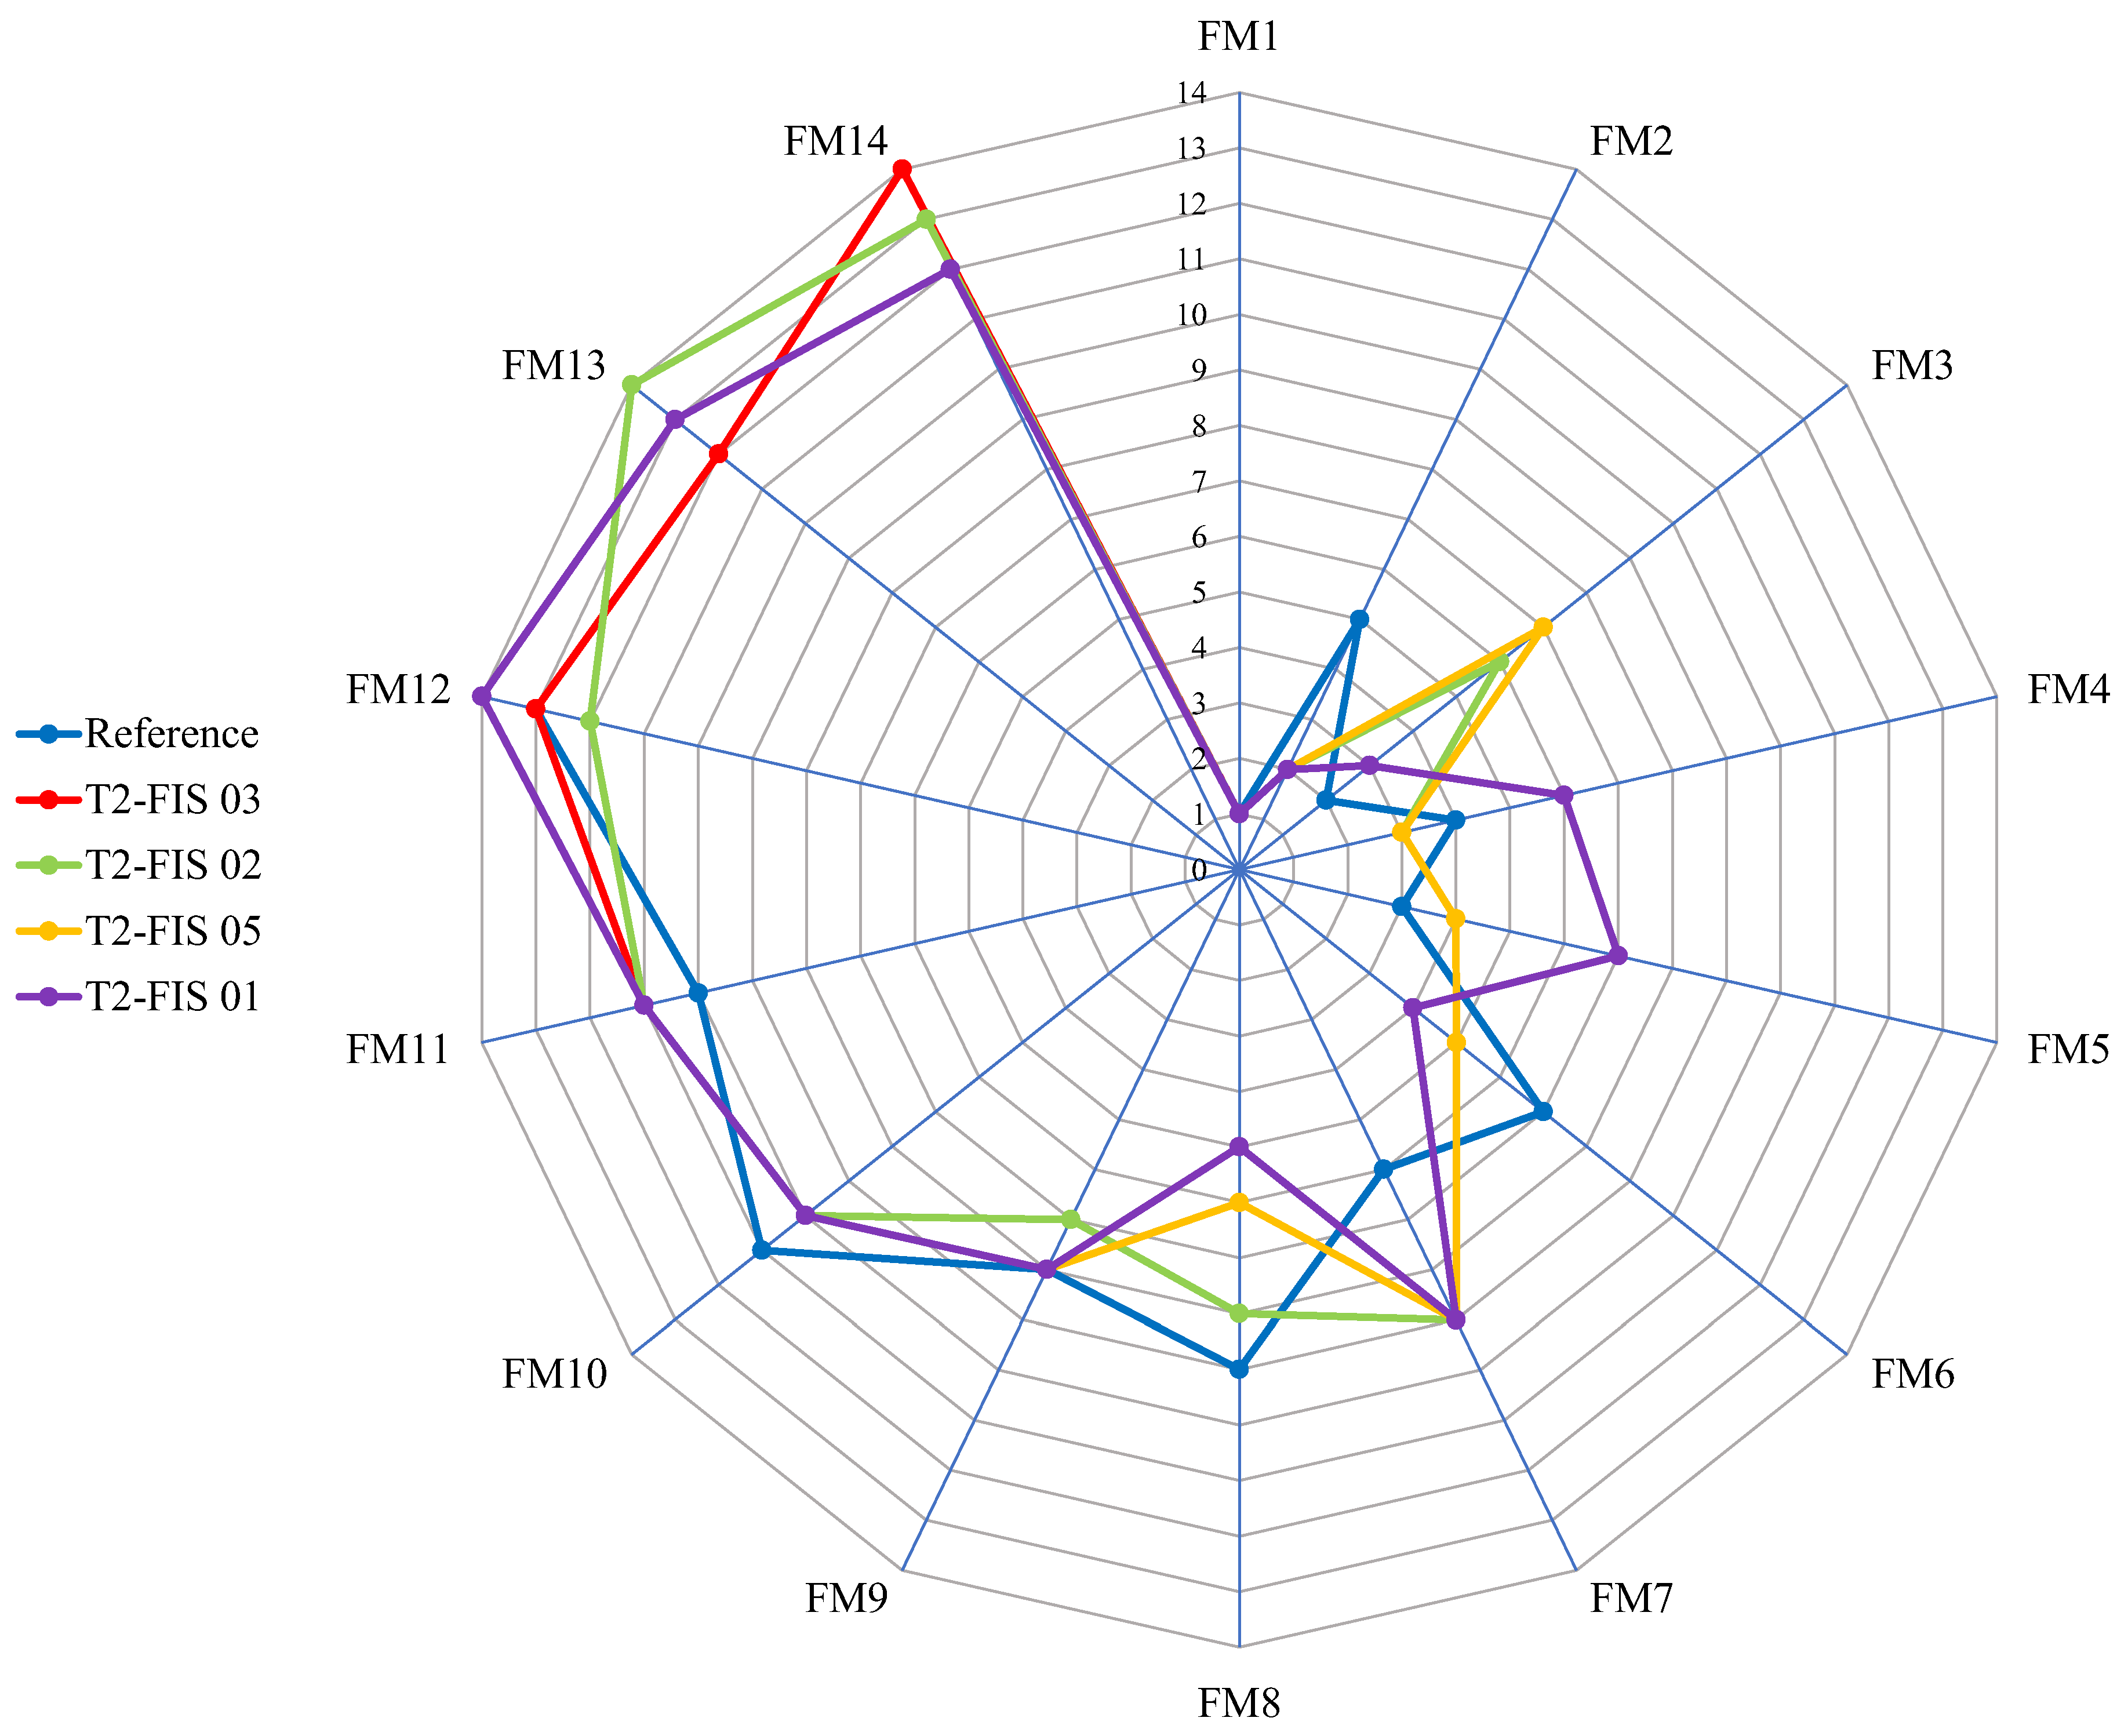
Figure 6 presents a radar chart comparing the failure mode rankings produced by the reference method RPI(SC5) and four selected fuzzy-based FMECA configurations (T2-FIS 01, 02, 03, and 05).
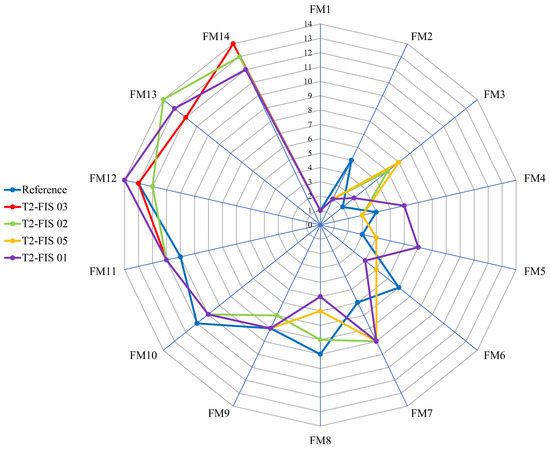
Figure 6.
Radar chart showing the reference FMECA ranking (blue line) and configurations T2-FIS 03, T2-FIS 02, T2-FIS 05, and T2-FIS 01.
While a first visual inspection reveals varying degrees of alignment with the reference, a deeper analysis shows that visual closeness or the number of exact ranking matches does not always accurately reflect the statistical agreement captured by the kappa coefficient.
To illustrate this, the number of exact matches and the corresponding quadratic weighted kappa (κw-quad) values are summarized as follows:
- T2-FIS 01: 2 exact matches, κw-quad = 0.8418
- T2-FIS 02: 1 exact match, κw-quad = 0.8901;
- T2-FIS 03: 4 exact matches, κw-quad = 0.9033;
- T2-FIS 05: 2 exact matches, κw-quad = 0.8549.
These values emphasize a crucial point: a higher number of exact matches does not necessarily imply a better overall agreement. For instance, T2-FIS 05, with only two exact matches, outperforms T2-FIS 01, which also has two matches but a lower κw-quad value. This suggests that the distance of mismatches plays a more important role in statistical concordance than the absolute number of matches. This is visually reflected in Figure 6, where T2-FIS 05 traces a line slightly more distant from the reference in some segments but overall remains close, especially for the most critical failure modes (FM1, FM2, and FM10). Conversely, T2-FIS 01, although achieving the same number of exact matches, exhibits larger divergences in several points (e.g., FM5, and FM6), resulting in a lower κw-quad score.
A particularly revealing case is T2-FIS 02, which has only one exact match but achieves κw-quad = 0.8901, outperforming both T2-FIS 01 and T2-FIS 05. This apparent contradiction is explained by the fact that T2-FIS 02 produces minimal deviations across the board, i.e., most ranks are either identical or differ by only one or two positions. Thus, the global ranking structure is better preserved, even in the absence of exact matches.
This analysis highlights a fundamental limitation in traditional FMECA evaluation practices that rely solely on comparing rankings item by item. While intuitive, this approach fails to capture near matches, such as a failure mode being ranked 6th by one method and 7th by another, differences that are negligible in practical contexts but completely ignored in coincidence counting.
The weighted kappa statistic overcomes this limitation by applying distance-sensitive penalties and adjusting for agreement expected by chance. Consequently, it offers a more holistic and statistically grounded measure of methodological alignment.
These presented results have meaningful implications for practical risk assessment in engineering systems, particularly in critical infrastructure such as power transformers. The observed sensitivity of the kappa coefficient to the type and distribution of membership functions underscores that fuzzy modeling decisions are far from trivial; they materially influence the prioritization of failure modes and, consequently, the reliability of maintenance or mitigation strategies. For instance, Gaussian membership functions may better reflect smooth transitions in uncertainty for risk factors such as Occurrence or Detection, while trapezoidal membership functions can more effectively represent hard thresholds, particularly in the aggregation stage (FRPN).
From a methodological perspective, configuration T2-FIS 03 emerged as a robust and consistent fuzzy modeling approach for FMECA applied to power transformers. Its superior agreement values under both linear and quadratic weighting schemes indicate a stable prioritization output closely aligned with the reference method. These results support the suitability of this configuration as a candidate reference for future studies involving fuzzy-based FMECA in similar industrial settings.
However, in complex practical applications, where multiple factors interact and system conditions are dynamic, the diversity and uncertainty introduced by different membership function designs can compromise the consistency and reliability of fuzzy-FMECA outputs. To address these challenges, future work should explore adaptive or data-driven strategies for tuning membership functions. For example, optimization techniques or machine learning approaches could be used to calibrate membership function parameters based on empirical failure data or expert consensus. Furthermore, incorporating robustness testing, such as sensitivity analyses across membership function types or configurations, and validating the models through cross-domain case studies will be key to ensuring generalizability and methodological resilience.
Another complementary solution involves the direct involvement of domain experts in defining and validating membership functions. Experts in FMECA can contribute valuable insights into the appropriate shape, symmetry, and distribution of the membership functions to accurately reflect real-world behavior and system thresholds. By systematically integrating expert knowledge into the fuzzy modeling process, the resulting functions can more effectively capture operational semantics and enhance model interpretability. While this introduces a degree of subjectivity, structured elicitation methods and guided parameterization tools can help standardize the process and enhance consistency across applications.
Finally, the integration of statistical validation mechanisms, such as kappa significance testing, adds rigor to the comparison between FMECA methods and elevates the evaluation beyond subjective or qualitative matching. Further research could investigate hybrid weighting schemes or the development of adaptive membership function structures that respond dynamically to the characteristics of the analyzed system, ultimately enhancing agreement with expert-based prioritization.
7. Conclusions
This paper introduced an approach based on Cohen’s kappa coefficient of agreement to compare different methods used in the FMECA context. To validate the approach, a representative case study involving a power transformer was presented and analyzed, considering fourteen failure modes. A reference ranking obtained from a previously published RPI-based method was used as the benchmark, and six fuzzy-FMECA configurations based on type-2 fuzzy inference systems (T2-FIS) were evaluated. Based on the results and discussions presented, the following key conclusions can be drawn:
- The comparison between different FMECA methods is commonly based on a qualitative comparison of rankings and sometimes considers a balance among the three risk factors. Although intuitive, this approach becomes impractical in larger systems and fails to capture differences between prioritization schemes.
- The use of agreement coefficients, particularly the proposed weighted versions of Cohen’s kappa, enables a statistically grounded comparison between FMECA methods, thereby enhancing objectivity in evaluating prioritization consistency when multiple raters are used.
- The results presented demonstrate that Cohen’s kappa coefficient of agreement provides a quantitative measure of agreement between two different rankings in the FMECA context, capturing both exact matches and proximity-based disagreements.
- For the 3. framework, the ranking based on the type-2 fuzzy inference system, which combines triangular membership for Severity, Gaussian for Occurrence and Detection, and trapezoidal for FRPN (T2-FIS 03), achieved the highest agreement with the reference. This outcome highlights the impact of membership function shape and asymmetry on modeling uncertainty and prioritization outcomes.
- The selection of the weighting scheme is another essential aspect to consider in the 3. Framework because the quadratic weighting scheme used by us allows for obtaining a better strength of agreement.
- The effectiveness of the proposed method depends significantly on the availability of a reliable reference ranking. While this may pose challenges in practice, the approach remains highly useful when validating new FMECA methods against well-established benchmarks.
8. Practical Implications of the Proposed Methodology
- (a)
- To ensure the practical applicability of the proposed approach, it is essential to establish a systematic method for selecting a reliable reference FMECA ranking. Given the challenges of identifying an appropriate reference, especially in cases with limited data or a lack of prior consensus, a pragmatic strategy involves first testing multiple FMECA methodologies on a well-documented problem with established failure mode rankings [52]. By calculating agreement coefficients, the most suitable approach can be determined. Once validated, this method can be efficiently transferred to other systems with similar characteristics, optimizing decision-making and enhancing reliability assessments in diverse applications.
- (b)
- For effective implementation, the adaptability of the proposed type-2 fuzzy method must be carefully evaluated beyond its initial application to power transformers. While the approach demonstrates strong potential in critical infrastructure, such as smart substations [53] and utility asset management, its transferability to other domains necessitates tailored adjustments, as seen in photovoltaic systems [54]. Developing statistically grounded metrics for quantifying agreement and consistency enhances the role of this approach as a complementary tool to traditional expert-driven FMECA evaluations, ultimately fostering more scalable and robust reliability assessments across diverse systems.
- (c)
- To establish a framework for effectively comparing FMECA methods, it is crucial to acknowledge that no single reference ranking can serve as a universally accurate standard. Differences in system complexity, operating environments, and expert judgment inherently limit the direct transferability of solutions across applications. To ensure practical adaptation, strategies must be integrated, enabling more flexible, context-sensitive reliability assessments tailored to the unique characteristics of each system.
- (d)
- Integrating multiple case studies across various domains and employing ensemble-based benchmarking strategies, such as averaging agreement metrics over multiple reference rankings, enhances practical impact [49,55]. These approaches improve the robustness of method evaluation, ensuring broader applicability. Additionally, incorporating sensitivity analyses and cross-validation techniques strengthens the stability of rankings against modeling assumptions and input uncertainties. By refining these methodological aspects, comparative FMECA evaluations gain greater reliability, supporting more informed and effective decision-making in complex real-world scenarios.
9. Future Work
Future research will focus on the following four key directions:
- Application of the proposed approach in the context of smart substations.
- The definition of tailor-made scales for the FMECA risk factors in the context of smart substations.
- Design of a new weighting scheme based on context-specific risk factor behaviors.
- Integration of paradox-resistant concordance coefficients for improved robustness in agreement assessment.
Author Contributions
Conceptualization, A.A.Z.; methodology, A.A.Z. and P.J.C.B.; validation, A.A.Z., J.F.P.F. and P.J.C.B.; formal analysis, A.A.Z.; investigation, A.A.Z.; writing—original draft preparation, A.A.Z.; writing—review and editing, A.A.Z., J.F.P.F. and P.J.C.B.; supervision, J.F.P.F. and P.J.C.B.; funding acquisition, J.F.P.F. and P.J.C.B. All authors have read and agreed to the published version of the manuscript.
Funding
The authors acknowledge Fundação para a Ciência e a Tecnologia (FCT) for its financial support via the project LAETA Base Funding (DOI: 10.54499/UIDB/50022/2020)., and by Secretaría Nacional de Educación Superior, Ciencia, Tecnología e Innovación (SENESCYT) of the Ecuadorian Government through fellowship CZ05-000291-2017.
Data Availability Statement
The data used in this study are available within the article.
Conflicts of Interest
The authors declare no conflict of interest.
References
- IEC 60812:2006; Analysis Techniques for System Reliability – Procedure for Failure Mode and Effects Analysis (FMEA). International Electrotechnical Comission: Geneva, Switzerland, 2018.
- Zúñiga, A.A.; Fernandes, J.F.P.; Branco, P.J.C. A New Concordance Coefficients-Based Approach to Compare Improved FMECA Methods. In Proceedings of the 1st International Conference on Challenges in Engineering, Medical, Economics & Education: Research & Solutions (CEMEERS-23), Lisbon, Portugal, 21–22 June 2023; pp. 66–75. [Google Scholar]
- Li, X.; He, M.; Wang, H. Application of Failure Mode and Effect Analysis in Managing Catheter-Related Blood Stream Infection in Inten-sive Care Unit. Medicine 2017, 96, e9339. [Google Scholar] [CrossRef] [PubMed]
- Bowles, J.B.; Peláez, C.E. Fuzzy Logic Prioritization of Failures in a System Failure Mode, Effects and Criticality Analysis. Reliab. Eng. Syst. Saf. 1995, 50, 203–213. [Google Scholar] [CrossRef]
- Liu, H.C.; You, J.X.; You, X.Y. Evaluating the Risk of Healthcare Failure Modes Using Interval 2-Tuple Hybrid Weighted Distance Measure. Comput. Ind. Eng. 2014, 78, 249–258. [Google Scholar] [CrossRef]
- Huang, J.; You, J.X.; Liu, H.C.; Song, M.S. Failure Mode and Effect Analysis Improvement: A Systematic Literature Review and Future Research Agenda. Reliab. Eng. Syst. Saf. 2020, 199, 106885. [Google Scholar] [CrossRef]
- Liu, H.C. FMEA Using Uncertainty Theories and MCDM Methods; Springer Science+Business Media Singapore: Singapore, 2016; ISBN 9789811014666. [Google Scholar]
- Pillay, A.; Wang, J. Modified Failure Mode and Effects Analysis Using Approximate Reasoning. Reliab. Eng. Syst. Saf. 2003, 79, 69–85. [Google Scholar] [CrossRef]
- Liu, H.C.; Li, Z.; Song, W.; Su, Q. Failure Mode and Effect Analysis Using Cloud Model Theory and PROMETHEE Method. IEEE Trans. Reliab. 2017, 66, 1058–1072. [Google Scholar] [CrossRef]
- Wang, Z.; Gao, J.M.; Wang, R.X.; Chen, K.; Gao, Z.Y.; Zheng, W. Failure Mode and Effects Analysis by Using the House of Reliability-Based Rough VIKOR Approach. IEEE Trans. Reliab. 2018, 67, 230–248. [Google Scholar] [CrossRef]
- Hassan, S.; Wang, J.; Kontovas, C.; Bashir, M. Modified FMEA Hazard Identification for Cross-Country Petroleum Pipeline Using Fuzzy Rule Base and Approximate Reasoning. J. Loss Prev. Process Ind. 2022, 74, 104616. [Google Scholar] [CrossRef]
- Jang, J.-S.R.; Sun, C.-T.; Mizutani, E. Neuro-Fuzzy and Soft Computing: A Computational Approach to Leraning and Machine Intelligence; Pearson College Div: Victoria, BC, Canada, 1997. [Google Scholar]
- Deng, J.L. Introduction to Grey Systems Theory. J. Grey Syst. 1989, 1, 1–24. [Google Scholar] [CrossRef]
- Akyuz, E.; Celik, E. A Quantitative Risk Analysis by Using Interval Type-2 Fuzzy FMEA Approach: The Case of Oil Spill. Marit. Policy Manag. 2018, 45, 979–994. [Google Scholar] [CrossRef]
- Bozdag, E.; Asan, U.; Soyer, A.; Serdarasan, S. Risk Prioritization in Failure Mode and Effects Analysis Using Interval Type-2 Fuzzy Sets. Expert Syst. Appl. 2015, 42, 4000–4015. [Google Scholar] [CrossRef]
- La Fata, C.M.; Giallanza, A.; Micale, R.; La Scalia, G. Improved FMECA for Effective Risk Management Decision Making by Failure Modes Classification under Uncertainty. Eng. Fail. Anal. 2022, 135, 106163. [Google Scholar] [CrossRef]
- Gupta, G.; Ghasemian, H.; Janvekar, A.A. A Novel Failure Mode Effect and Criticality Analysis (FMECA) Using Fuzzy Rule-Based Method: A Case Study of Industrial Centrifugal Pump. Eng. Fail. Anal. 2021, 123, 105305. [Google Scholar] [CrossRef]
- Yahmadi, R.; Brik, K.; ben Ammar, F. Fuzzy Risk Priority Number Assessment for Solar Gel Battery Manufacturing Defects. Eng. Fail. Anal. 2021, 124, 105327. [Google Scholar] [CrossRef]
- Qin, J.; Xi, Y.; Pedrycz, W. Failure Mode and Effects Analysis (FMEA) for Risk Assessment Based on Interval Type-2 Fuzzy Evidential Reasoning Method. Appl. Soft Comput. J. 2020, 89, 106134. [Google Scholar] [CrossRef]
- Vieira, S.M.; Kaymak, U.; Sousa, J.M.C. Cohen’s Kappa Coefficient as a Performance Measure for Feature Selection. In Proceedings of the International Conference on Fuzzy Systems, Barcelona, Spain, 18–23 July 2010. [Google Scholar] [CrossRef]
- Hammond, P.; Suttie, M.; Lewis, V.T.; Smith, A.P.; Singer, A.C. Detection of Untreated Sewage Discharges to Watercourses Using Machine Learning. npj Clean Water 2021, 4, 18. [Google Scholar] [CrossRef]
- Agrawal, P.; Trivedi, B. Evaluating Machine Learning Classifiers to Detect Android Malware. In Proceedings of the 2020 IEEE International Conference for Innovation in Technology (INOCON), Bangluru, India, 6–8 November 2020; pp. 8–13. [Google Scholar] [CrossRef]
- Whata, A.; Chimedza, C. Deep Learning for SARS COV-2 Genome Sequences. IEEE Access 2021, 9, 59597–59611. [Google Scholar] [CrossRef]
- Cherrier, N. Interpretable Machine Learning for CLAS12 Data Analysis. Ph.D. Thesis, Université Paris-Saclay, Gif-sur-Yvette, France, 2021. [Google Scholar]
- Kendall, M.G.; Smith, B.B. The Problem of m Rankings. Ann. Math. Stat. 1939, 10, 275–287. [Google Scholar] [CrossRef]
- Liu, J.; Tang, W.; Chen, G.; Lu, Y.; Feng, C.; Tu, X.M. Correlation and Agreement: Overview and Clarification of Competing Concepts and Measures. Shanghai Arch. Psychiatry 2016, 28, 115–120. [Google Scholar] [CrossRef]
- Gwet, K.L. Handbook of Inter-Rater Reliability, 4th ed.; Advanced Analytics, LLC: Gaithersburg, MD, USA, 2014; ISBN 978-0-9708062-8-4. [Google Scholar]
- Ranganathan, P.; Pramesh, C.S.; Aggarwal, R. Common Pitfalls in Statistical Analysis: Measures of Agreement. Perspect 2017, 8, 187–191. [Google Scholar] [CrossRef] [PubMed]
- Landis, J.R.; Koch, G.G. The Measurement of Observer Agreement for Categorical Data. Biometrics 1977, 33, 159. [Google Scholar] [CrossRef]
- Vetter, T.R.; Schober, P. Agreement Analysis: What He Said, She Said versus You Said. Anesth. Analg. 2018, 126, 2123–2128. [Google Scholar] [CrossRef] [PubMed]
- Cohen, J. A Coefficient of Agreement for Nominal Scales. Educ. Psychol. Meas. 1960, 20, 37–46. [Google Scholar] [CrossRef]
- McHugh, M.L. Lessons in Biostatistics Interrater Reliability: The Kappa Statistic. Biochem. Medica 2012, 22, 276–282. [Google Scholar] [CrossRef]
- Mielke, P.W.; Berry, K.J. A Note on Cohen’s Weighted Kappa Coefficient of Agreement with Linear Weights. Stat. Methodol. 2009, 6, 439–446. [Google Scholar] [CrossRef]
- Sim, J.; Wright, C.C. The Kappa Statistic in Reliability Studies: Use, Interpretation, and Sample Size Requirements. Phys. Ther. 2005, 85, 257–268. [Google Scholar] [CrossRef]
- Cohen, J. Weighted Kappa: Nominal Scale Agreement with Provision for Scaled Disagreement of Partial Credit. Psychol. Bull. 1968, 70, 213–220. [Google Scholar] [CrossRef]
- Banerjee, M.; Capozzoli, M.; McSweeney, L.; Sinha, D. Beyond Kappa: A Review of Interrater Agreement Measures. Can. J. Stat. 1999, 27, 3–23. [Google Scholar] [CrossRef]
- Ben-David, A. Comparison of Classification Accuracy Using Cohen’s Weighted Kappa. Expert Syst. Appl. 2008, 34, 825–832. [Google Scholar] [CrossRef]
- Guggenmoos-Holzmann, I. The Meaning of Kappa: Probabilistic Concepts of Reliability and Validity Revisited. J. Clin. Epidemiol. 1996, 49, 775–782. [Google Scholar] [CrossRef] [PubMed]
- Warrens, M.J. Cohen’s Kappa Is a Weighted Average. Stat. Methodol. 2011, 8, 473–484. [Google Scholar] [CrossRef]
- Warrens, M.J. Cohen’s Quadratically Weighted Kappa Is Higher than Linearly Weighted Kappa for Tridiagonal Agreement Tables. Stat. Methodol. 2012, 9, 440–444. [Google Scholar] [CrossRef]
- Fleiss, J.L.; Cohen, J.; Everitt, B.S. Large Sample Standard Errors of Kappa and Weighted Kappa. Psychol. Bull. 1969, 72, 323–327. [Google Scholar] [CrossRef]
- Ross, S.M. Introduction to Probability and Statistics for Engineers and Scientists, 6th ed.; Academic Press: London, UK, 2021; ISBN 978-0-12-824346-6. [Google Scholar]
- Karaulova, T.; Kostina, M.; Shevtshenko, E. Reliability Assessment of Manufacturing Processes. Int. J. Ind. Eng. Manag. 2012, 3, 143–151. [Google Scholar] [CrossRef]
- Okwesili, P.C., Jr. Risk Assessment Using Paired Comparison Expert Elicitation for Ranking of Compounding Outsourcing Facilities; The George Washington University: Washington, DC, USA, 2016. [Google Scholar]
- Renu, R.; Visotsky, D.; Knackstedt, S.; Mocko, G.; Summers, J.D.; Schulte, J. A Knowledge Based FMEA to Support Identification and Management of Vehicle Flexible Component Issues. Procedia CIRP 2016, 44, 157–162. [Google Scholar] [CrossRef]
- Frewen, H.; Brown, E.; Jenkins, M.; O’Donovan, A. Failure Mode and Effects Analysis in a Paperless Radiotherapy Department. J. Med. Imaging Radiat. Oncol. 2018, 62, 707–715. [Google Scholar] [CrossRef]
- Anes, V.; Henriques, E.; Freitas, M.; Reis, L. A New Risk Prioritization Model for Failure Mode and Effects Analysis. Qual. Reliab. Eng. Int. 2018, 34, 516–528. [Google Scholar] [CrossRef]
- Baleia, A.N.S. Failure Modes and Effects Analysis (FMEA) for Smart Electrical Distribution Systems. Master’s Thesis, Universidade de Lisboa, Lisboa, Portugal, 2018. [Google Scholar]
- Lemos, G.d.R. Fuzzy Logic Applied to Failure Modes, Effects and Criticality Analysis (FMECA) in Smart Grids. Master’s Thesis, Universidade de Lisboa, Lisboa, Portugal, 2022. [Google Scholar]
- Mendel, J.M. Uncertain Rule-Based Fuzzy Systems: Introduction and New Directions, 2nd ed.; Springer International Publishing: Cham, Switzerland, 2017; ISBN 9783319513690. [Google Scholar]
- Zúñiga, A.A.; Baleia, A.; Fernandes, J.; da Costa Branco, P.J. Classical Failure Modes and Effects Analysis in the Context of Smart Grid Cyber-Physical Systems. Energies 2020, 13, 1–26. [Google Scholar] [CrossRef]
- Zúñiga, A.A.; Baleia, A.; Fernandes, J.; da Costa Branco, P.J. A New Concordance Coefficients-Based Approach to Compare Improved FMECA Methods. Authorea Preprints 2023. [Google Scholar]
- Tarquínio, J.P.S.; Zúñiga, A.; Fernandes, J.; Branco, P. Reliability analysis of the control and automation systems in electrical substations. TechRxivPreprints 2023. [Google Scholar] [CrossRef]
- Sarquis, E.; Zúñiga, A.; Fernandes, J.F.P.; Branco, P.J.D.C. Failure rates in photovoltaic systems: A careful selection of quantitative data available in the literature. In Proceedings of the European Photovoltaic Energy Conference and Exhibition EUPVSEC, Online, 7–11 September 2020. [Google Scholar]
- Zúñiga, A.A.; Fernandes, J.F.P.; Branco, P.J.C. A Fuzzy-based failure modes and effects analysis (FMEA) in smart grids. In Information Technology and Systems: Proceedings of ICITS 2019; Springer International Publishing: Berlin/Heidelberg, Germany, 2019. [Google Scholar]
Disclaimer/Publisher’s Note: The statements, opinions and data contained in all publications are solely those of the individual author(s) and contributor(s) and not of MDPI and/or the editor(s). MDPI and/or the editor(s) disclaim responsibility for any injury to people or property resulting from any ideas, methods, instructions or products referred to in the content. |
© 2025 by the authors. Licensee MDPI, Basel, Switzerland. This article is an open access article distributed under the terms and conditions of the Creative Commons Attribution (CC BY) license (https://creativecommons.org/licenses/by/4.0/).