Article

Synergistic Systems of Digitalization and Urbanization in Driving Urban Green Development: A Configurational Analysis of China’s Yellow River Basin

by
Shizheng Tan
1,
Wei Li
1,*,
Xiaoguang Liu
1,
Pengfei Li
1,
Le Yan
1 and
Chen Liang
2
1
School of Economics and Management, Taiyuan University of Technology, Taiyuan 030024, China
2
School of Economics and Management, Southeast University, Nanjing 211189, China
*
Author to whom correspondence should be addressed.
Systems 2025, 13(6), 426; https://doi.org/10.3390/systems13060426
Submission received: 7 April 2025 / Revised: 11 May 2025 / Accepted: 30 May 2025 / Published: 2 June 2025
(This article belongs to the Section Systems Practice in Social Science)

Abstract

Urban green development has become a crucial approach for balancing ecological conservation and socio-economic development. The digital economy (DE) and new-type urbanization (NTU), as technological and social systems, respectively, are both driving urban green development. In this context, furthering their synergistic effects could substantially improve urban sustainability outcomes. Grounded in sociotechnical systems theory, this study applied pooled and multi-period fuzzy-set qualitative comparative analysis (fsQCA) to analyze urban green development pathways in 79 Yellow River Basin cities (2020–2022). The pooled fsQCA indicates that urban green development is driven by synergistic interaction within the NTU-DE subsystem, especially industrial digitalization–spatial urbanization. The multi-period fsQCA further demonstrates that industrial digitization has always existed as a core condition, which means that it plays a more general role. In addition, the Yellow River Basin exhibits distinct regional variations in urban green development, where the downstream region is dominantly driven by DE and spatial urbanization, the upstream region by industrial digitization, and the midstream region demonstrates diversified pathways. This study enhances understanding of complex system interactions in urban green development and provides policy-relevant insights. For policy implementation, local governments should not only prioritize effective synergies between industrial digitization and spatial urbanization but also develop differentiated strategies for the DE and NTU subsystems based on local conditions.

1. Introduction

Urbanization represents a critical global trend and a central issue in urban development studies [1,2]. The global urban population increased from 25% in 1950 to approximately 50% in 2020 and is projected to reach 58% by 2070 [3]. Since China’s economic reform and opening-up (1978), urbanization has served as a major driver of national economic growth. Data from the National Bureau of Statistics indicate that China’s urbanization rate rose from 17.9% in 1978 to 66.2% in 2023. However, rapid urbanization has placed significant pressure on urban green development, including land-use change and the reduction of green spaces [4]. Therefore, integrating green development into urbanization has become a key priority. To reduce the ecological impacts of rapid urbanization, the Chinese government launched a new-type urbanization (NTU) initiative [5]. NTU emphasizes a “people-oriented” approach, with the goal of promoting holistic human development and social cohesion.
Simultaneously, the digital economy (DE)—an emerging engine of global economic expansion—has attracted considerable attention among policymakers, academia, and civil society [6,7]. China’s DE has experienced exponential growth in recent years, emerging as the primary catalyst for national economic advancement. According to the China Digital Economy Development Research Report (2024) by the China Academy of Information and Communications Technology, China’s DE reached 53.9 trillion yuan in 2023, accounting for 42.8% of GDP and contributing 66.45% to GDP growth. Digital industrialization and industrial digitization accounted for 18.7% and 81.3% of the DE, respectively, underscoring its enabling role and integrative capacity. DE has simultaneously enhanced socio-environmental sustainability and accelerated NTU implementation [8]. The synergistic integration between the DE and NTU systems now serves as a pivotal mechanism for regional sustainable development.
Globally, the driving effects of urbanization or digitalization on green development vary significantly across regions. Urbanization’s environmental effects demonstrate context-dependency, potentially improving performance in some nations while degrading it in others, contingent upon complementary factors [9]. European nations utilize diverse digital solutions to enhance urban metabolic circularity across multiple sectors including housing, transportation, waste management, and social systems [10]. Belgium’s Walloon region launched Digital Wallonia in 2015 under its Marshall Plan, specifically targeting smart urban transformation [11]. Chinese cities exhibit size-dependent variations in digitalization’s sustainability impacts [12]. China’s DE and NTU form synergistic systems that co-evolve through mutual reinforcement, jointly propelling socio-economic advancement [13,14,15]. Both DE and NTU exert substantial and far-reaching impacts on urban green development. However, the mechanisms through which DE and NTU jointly contribute to urban green development in China remain underexplored and warrant further investigation.
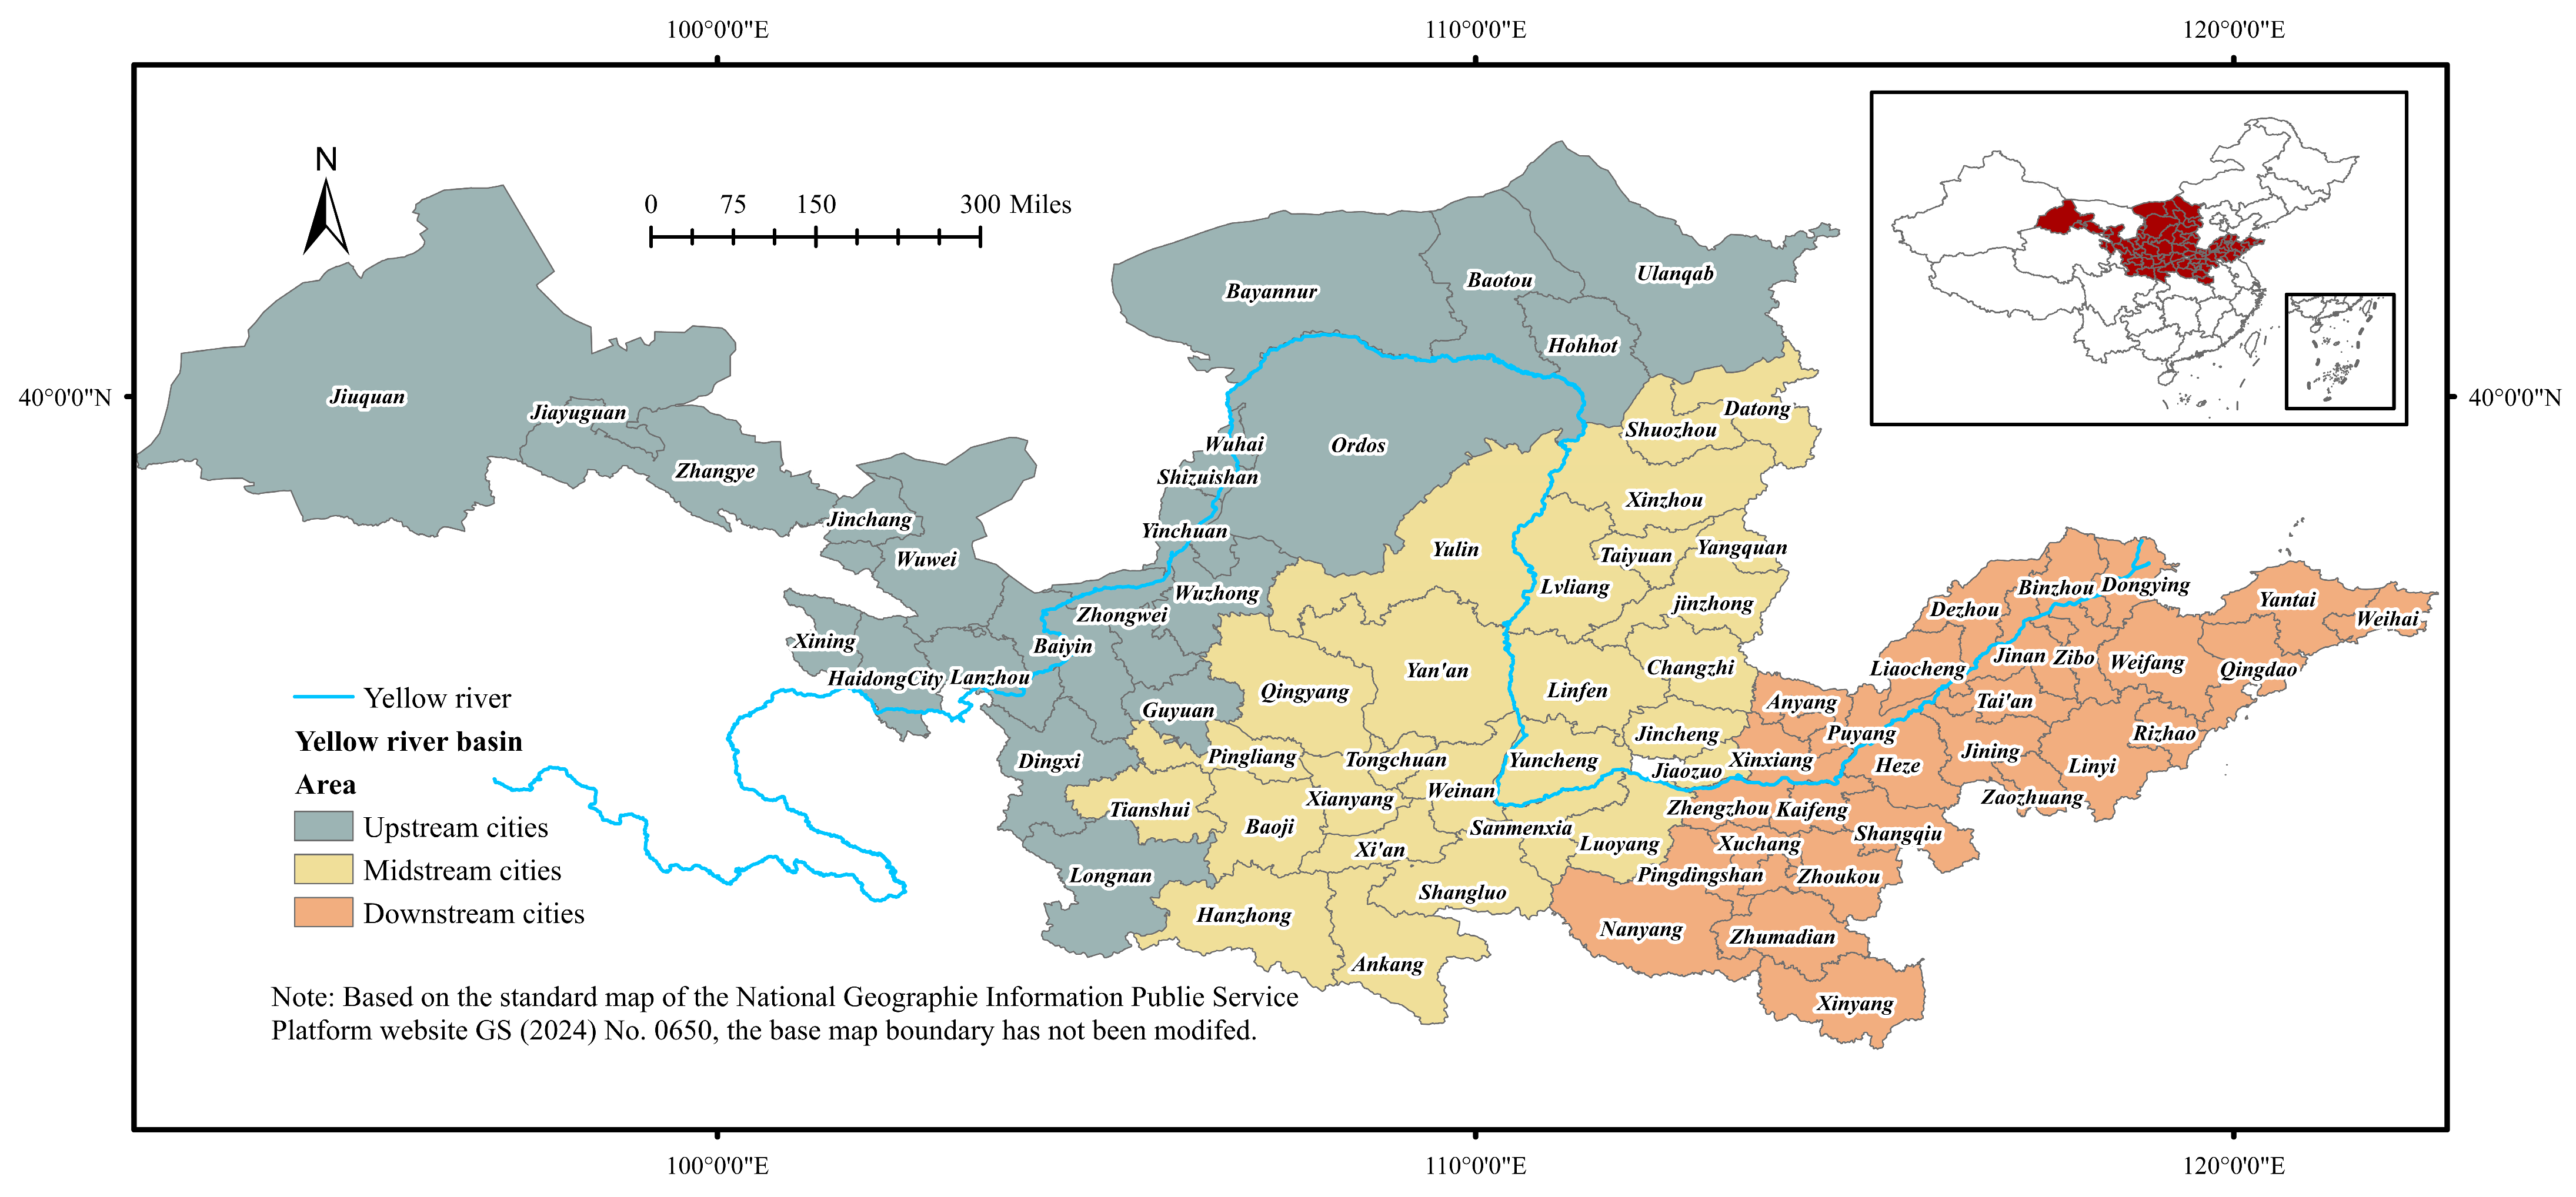
The Yellow River is the world’s fifth-largest river and a vital water source for northern China. The river sustains approximately 15% of China’s irrigated cropland and provides water for 12% of the national population [16]. As a critical ecological security barrier, the Yellow River Basin holds strategic importance for China’s sustainable development [17]. Since 2019, ecological conservation and high-quality development in the basin have been designated as national strategic priorities. However, heavy chemical industry agglomeration in the basin has intensified pollution pressures, undermining ecological resilience [18]. According to the White Paper on the Development of New Digital Economy in the Yellow River Basin, the digital new economy in the Yellow River Basin has demonstrated steady growth, with digital technologies being increasingly applied in ecological governance. In this context, research on how DE and NTU can synergize to promote urban green development in the basin is crucial for implementing ecological preservation and sustainable development strategies. Fuzzy-set qualitative comparative analysis (fsQCA) is a configurational, set-theoretic approach that effectively reveals the complex mechanisms through which various antecedent conditions impact outcomes [19]. Pooled and multi-period fsQCA address static analysis limitations by incorporating temporal dynamics [20,
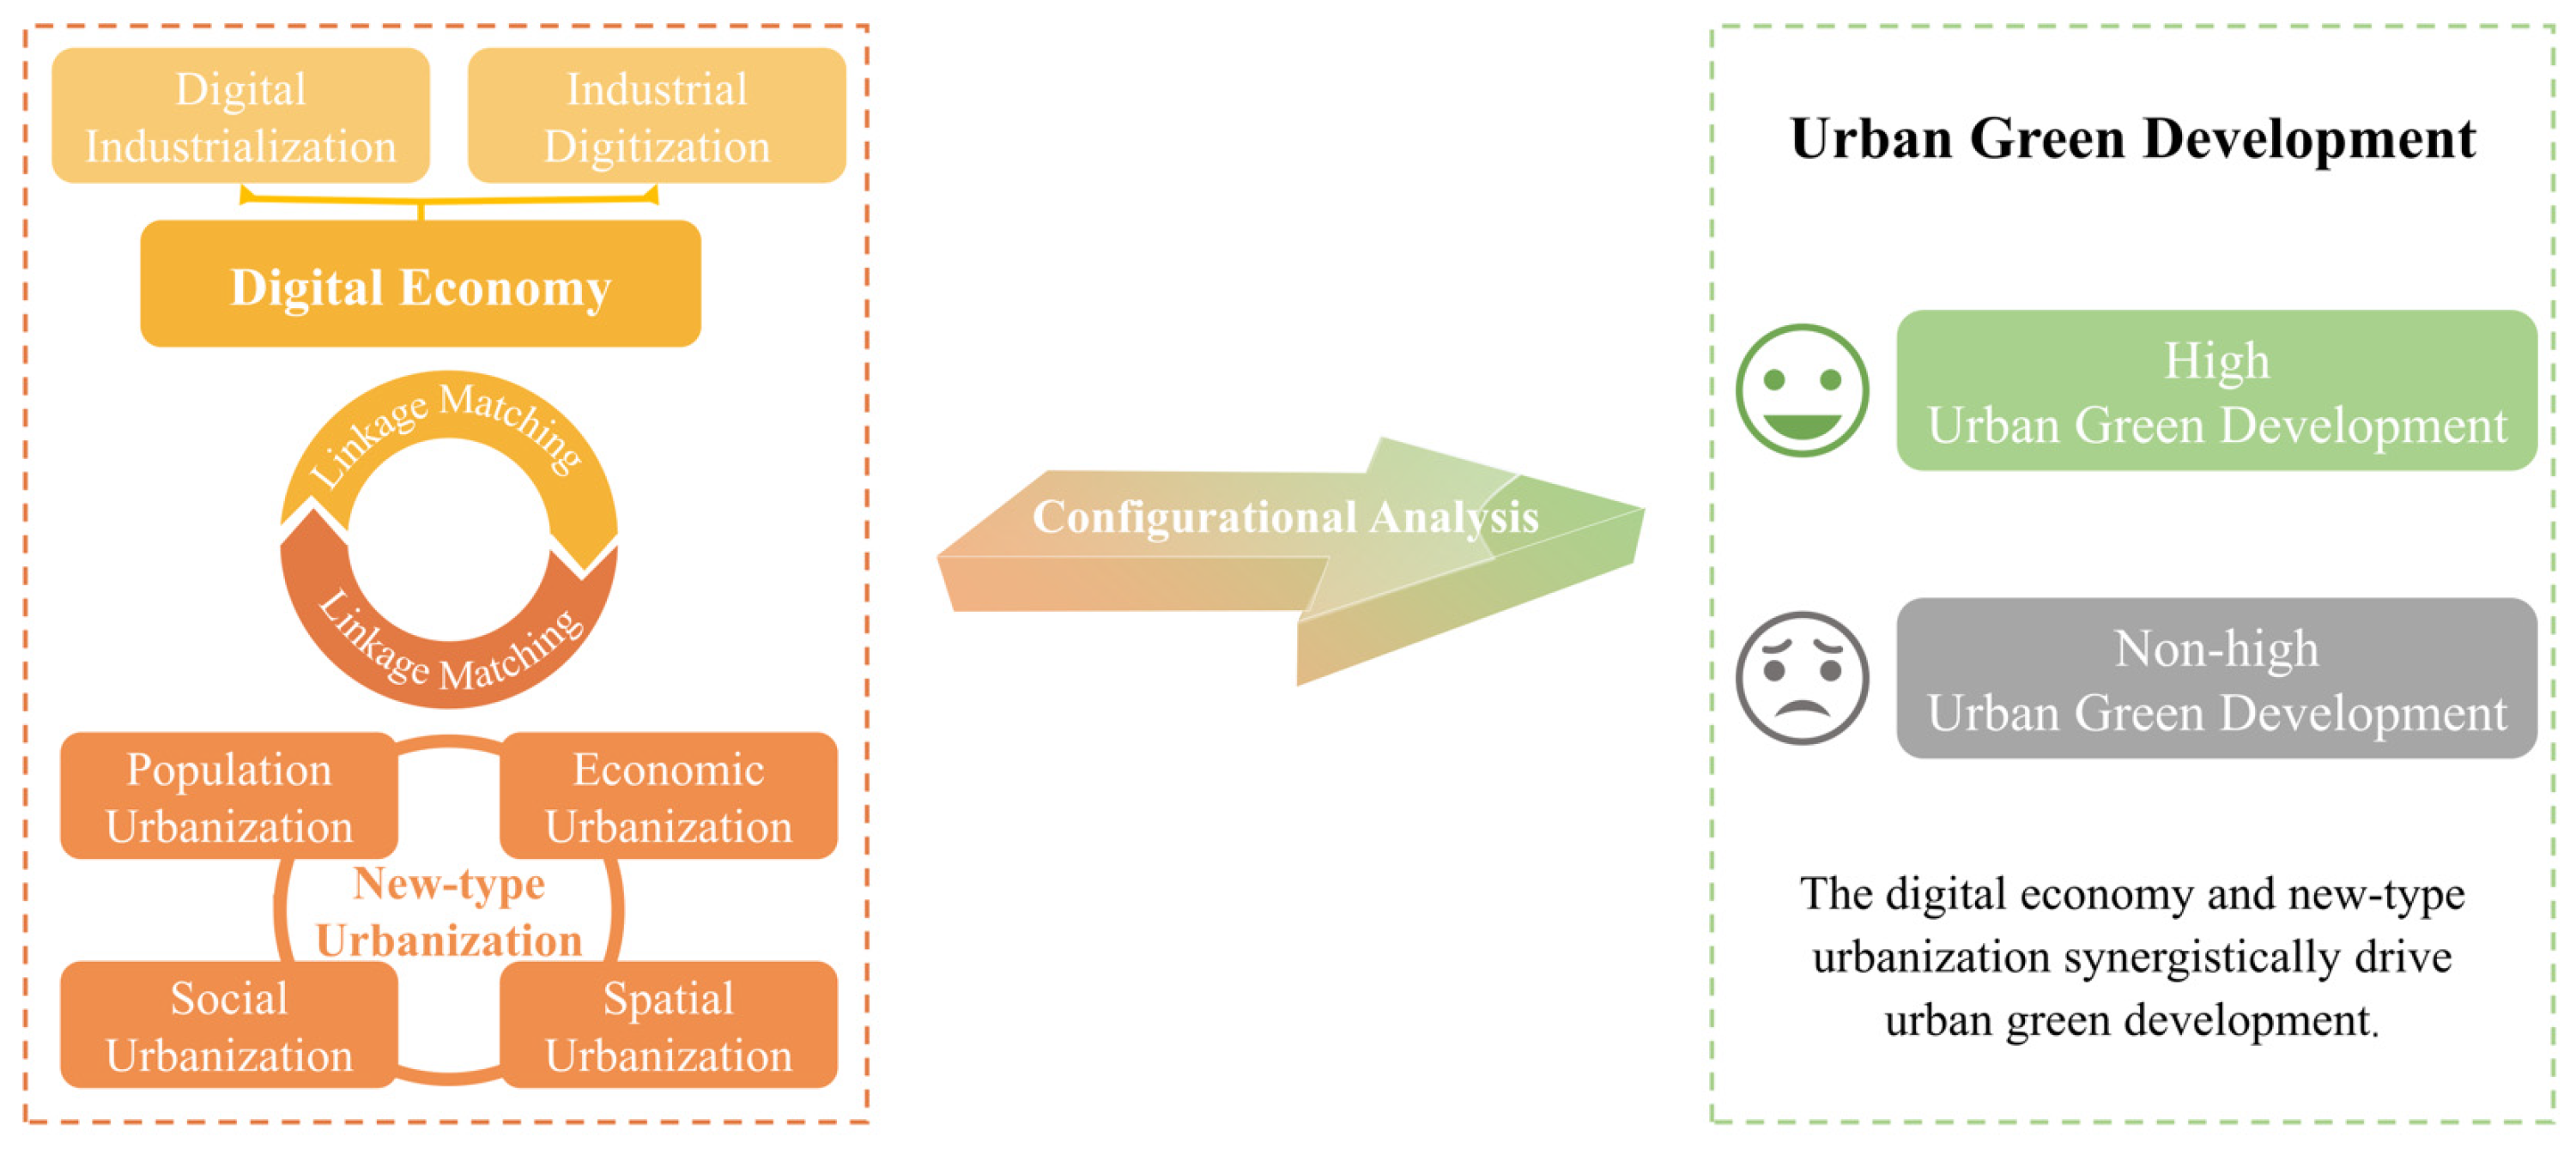
21]. Accordingly, this study examines 79 cities in the Yellow River Basin from 2020 to 2022, focusing on six antecedent conditions within the DE and NTU systems: digital industrialization, industrial digitization, population urbanization, economic urbanization, social urbanization, and spatial urbanization. Using a configurational approach, the study applies pooled and multi-period fsQCA to explore how these antecedents shape urban green development. To account for regional heterogeneity, the pooled fsQCA is further used to examine configurations across upstream, midstream, and downstream regions, identifying distinct pathways to urban green development.
This study contributes to digitalization, urbanization, and urban green development in several ways. First, prior research has examined the paradoxical relationship between DE, NTU, and urban green development, indicating that they may have positive, negative, or nonlinear effects on urban green development [5,22,23,24,25,26], making it challenging to draw reliable policy recommendations for promoting urban green development. This study constructs a configurational framework to assess urban green development driven by the synergistic interaction of DE and NTU, offering new insights into this paradox. Specifically, depending on contextual conditions, DE and NTU may either facilitate or impede urban green development. Second, most existing studies emphasize net effects at a single level, often overlooking how factors at different levels interact configurationally. Although both DE and NTU are inherently multidimensional concepts, most studies rely on single or composite indicators to measure them [5,26,27], limiting the precision and comprehensiveness of their impact assessment on urban green development. This study advances beyond traditional paradigms by identifying key drivers of urban green development within a DE–NTU synergistic framework, using fsQCA to examine configurational effects among their subsystems. Furthermore, it compares the configurational pathways of high versus non-high urban green development to validate the applicability of the DE–NTU synergy framework. Third, the study identifies multiple configurational pathways through which DE and NTU jointly drive urban green development. In-depth analysis reveals that the effects of DE and NTU on urban green development depend on their specific combinations, thereby enhancing the precision of policy design. Finally, the study employs dynamic fsQCA to capture the complexity and temporal evolution of urban green development, responding to recent calls for longitudinal research in environmental governance [9,28]. Drawing on time-series data from 79 cities in China’s Yellow River Basin (2020–2022), the study uses pooled and multi-period fsQCA to reveal how antecedent conditions evolve and to identify distinct pathways to urban green development. It also uncovers dynamic shifts in the subsystems of DE and NTU, offering practical insights for local environmental governance.
The remainder of this study is structured as follows: Section 2 reviews the literature and develops a theoretical framework for urban green development. Section 3 outlines the research methodology and data sources. Section 4 analyzes the configurational results for both high and non-high levels of urban green development, highlighting variations across temporal and regional dimensions. Section 5 discusses the findings, offers policy recommendations, and proposes avenues for future research. Section 6 summarizes the conclusions.

2. Literature Review and Research Framework

2.1. Literature Review

2.1.1. Digital Economy and Urban Green Development

DE is an emerging economic model centered on data resources. It leverages advanced information and communication technologies—such as cloud computing, big data, artificial intelligence, blockchain, and mobile internet—and is driven by data integration and holistic digital transformation [8]. Previous studies have extensively investigated the environmental benefits of DE, encompassing areas such as green innovation [7], air pollution mitigation [29], synergistic governance of pollutants and carbon emissions [30], and green total factor productivity [26].
DE consists of two main components: digital industrialization and industrial digitization [30,31,32]. Digital industrialization serves as a critical foundation for the development of the DE. It involves industries that arise from advancements in digital technologies, including digital technology research and development, production of digital products, and related services [33]. Digital industrialization promotes resource conservation and efficient utilization, thereby contributing to urban green development. Digital industrialization facilitates the intelligent transformation of traditional industries by supporting the development and clustering of emerging sectors—such as big data, cloud computing, and artificial intelligence—thereby reducing urban energy consumption [33]. Moreover, digital industrialization fosters technological exchange among industries, reduces information asymmetry, promotes the adoption of clean technologies, and enhances the efficiency of transforming green innovation into practical outcomes, thereby advancing the coordinated development of regional economic digitization and environmental sustainability [32]. Industrial digitization, characterized by the deep integration of digital technologies with traditional industries, improves resource and energy efficiency and facilitates energy conservation and emission reduction through intelligent governance [30,34]. Moreover, digital technologies enabled by industrial digitization allow governments to collect, analyze, and disseminate environmental data in real time, enhancing public access to information. The transparency and accessibility of such data enhance public participation in urban green development, thereby accelerating its progress [28].

2.1.2. New-Type Urbanization and Urban Green Development

Traditional urbanization often emphasizes scale expansion over quality, thereby hindering sustainable development. NTU follows a “people-oriented” philosophy, shifting focus from scale and speed to quality and excellence. Scholars have investigated NTU’s role in green development, for example in PM2.5 reduction [35,36], environmental pollution (encompassing air pollution, water pollution, solid pollution, and sustainable development) [37], as well as its contributions to the United Nations’ 17 Sustainable Development Goals [38].
NTU comprises four subsystems—population, economic, social, and spatial urbanization [37,39]—each exerting complex and sometimes contradictory effects on urban green development. Population urbanization refers to the continuous migration of rural residents to cities, leading to a gradual increase in the urban population share. This process promotes agglomeration and population density, which may reduce green space, exacerbate water shortages, and increase waste, particulate matter, and pollutants—ultimately harming urban green development [35,40,41]. However, agglomeration can also concentrate skilled labor, thereby fostering innovation and promoting green development [38,42]. Economic urbanization reflects economic growth, functional specialization, and industrial upgrading within cities [43]. While early-stage growth may exacerbate environmental degradation (as per the environmental Kuznets curve), surpassing a certain economic threshold can reverse this trend [44]. As urbanization advances, industrial structures upgrade, environmental productivity improves, and polluting industries are relocated—together significantly advancing urban green development [35,45]. Social urbanization reflects shifts in lifestyles and improvements in population quality. It enhances living standards and public environmental awareness, thereby driving ecological conservation efforts [38]. Increased environmental awareness among governments and citizens generates feedback mechanisms that help mitigate pollution [46,47]. Spatial urbanization—a key component of NTU—involves the physical expansion and functional upgrading of urban areas [48]. Urban expansion may either facilitate or impede green development. In high-density cities, economies of scale can lower transport-related energy consumption and reduce infrastructure inefficiencies [49,50,51]. However, excessive congestion and redundant development may offset these benefits, resulting in increased energy consumption [52].

2.2. Research Framework

The configurational perspective is widely adopted in complex management studies to reveal the causal complexity underlying specific outcomes [53]. From the configurational perspective, conditions do not function in isolation but rather interact synergistically, meaning that multiple factors work together to shape the outcome. QCA, as a suitable method for identifying condition configurations associated with particular outcomes, facilitates systematic and focused comparisons across multiple cases [54]. Current research has applied the QCA methodology to DE, NTU, and green development. For example, Zhang et al. [55] combined QCA with Necessary Condition Analysis (NCA) to examine the configurations through which DE affects carbon emission efficiency. Using data from three major urban agglomerations in the Yangtze River Economic Belt, Pan et al. [56] explored heterogeneous configurational pathways through which NTU influences carbon imbalance. Incorporating temporal dimensions, Gong [57] examined the dynamic evolution of green transition strategies in China’s resource-based cities during the years 2013, 2016, and 2019. Drawing on the technology–organization–environment (TOE) framework, Luo et al. [58] used QCA to identify configurational pathways underlying the coupling coordination between low-carbon development and the ecological environment in the Yellow River Basin. Bai and Shen [59] employed dynamic QCA to investigate how DE and related factors contribute to sustainable development in less-developed cities. Collectively, these studies underscore the applicability of QCA in research on DE, NTU, and urban green development, offering valuable references for the present study.
Similar to the configurational perspective, systems thinking emphasizes that a system is greater than the sum of its parts, as its components interact to form complex structures [60]. Sociotechnical systems theory explores the reciprocal relationship between technology and society, offering a theoretical foundation for examining their interaction [61]. The theory highlights the integration of social and technological systems, arguing that technologies do not exist or evolve in isolation, and their application requires a suitable sociocultural context [62]. In this study, DE refers to the totality of economic and commercial activities that rely on digital technologies and electronic communications [63], forming the technological system. NTU, by contrast, represents a comprehensive and multifaceted social transformation process centered on the rural–urban transition [64], constituting the social system. Both the NTU and DE systems are key drivers of socio-economic progress and exert significant influence on urban green development. The DE, as an integrated economy, permeates various market segments, fosters the synergistic development of digital industrialization and industrial digitization, enhances industrial efficiency, and drives urban green development [65]. Moreover, the impact of multi-dimensional urbanization on environmental pollution is both interrelated and complex [66]. DE and NTU are both essential pillars of Chinese modernization, and their intrinsic symbiotic relationship fosters an interactive and coordinated development model [15]. DE offers critical technological tools and fresh impetus for NTU, particularly as digital technology-driven smart city initiatives help propel NTU forward [67]. Conversely, NTU provides the material foundations and spatial platforms necessary for DE development [14]. NTU can also generate technology spillover effects that further stimulate DE growth [68]. According to sociotechnical systems theory, organizational performance hinges on the synergy between social and technological systems [28]. Therefore, the impacts of NTU and DE on urban green development should be examined as part of an interdependent system rather than in isolation.
Studies suggest that DE and NTU work together to promote urban green development [8,26,29]. Research indicates that the DE’s effect on green total factor productivity varies significantly depending on urban population size [26]. The environmental benefits of DE are more pronounced in regions with higher levels of urbanization [29]. Chen et al. [8] suggested that DE can guide urbanization toward greater sustainability. NTU and DE are strongly correlated and aligned, integrating through the new development philosophy of innovation, coordination, sustainability, openness, and sharing, thereby forming synergistic effects for high-quality development [69]. Sociotechnical systems theory posits that urban green development results from the combined effects of social and technological systems [28,61,62]. This suggests that urban green development is driven by the synergies between NTU and DE. Accordingly, the study constructs a theoretical framework for urban green development. As shown in Figure 1, DE (industrial digitization and digital industrialization) and NTU (population, economic, social, and spatial urbanization) generate configurational effects on urban green development through multidimensional linkages. By employing systems thinking and a configurational perspective, this study applies pooled and multi-period fsQCA to uncover the combinations of conditions that lead to high versus non-high urban green development.

3. Research Method and Data

3.1. Research Method

Unlike conventional regression analysis, QCA provides a holistic analytical perspective. QCA assesses the necessity and consistency of key conditions within samples rather than considering all variables. It accounts for interactions among multiple conditions [70] and is considered suitable for analyzing between four and seven antecedent conditions [54]. This study investigates six antecedent conditions, aligning with the method’s applicability. Fuzzy-set QCA (fsQCA) is more appropriate for analyzing continuous data compared to crisp-set QCA (csQCA) and multi-value QCA (mvQCA). Therefore, this study employs fsQCA to identify configurational pathways that promote urban green development. FsQCA is applicable to both large-sample studies (>100 cases) and small- to medium-sample studies (10–100 cases). In fsQCA, case representativeness does not influence all solutions [53], and the method demonstrates strong robustness to outliers [71]. The minimum case number for fsQCA should meet the threshold of 2n−1, where n represents the number of antecedent conditions [28]. With a three-year timeframe and 79 annual cases—far exceeding the minimum threshold of 32—this study fully meets the sample size requirements.
FsQCA consists of three main steps. The first step, calibration of variables, involves assigning set membership scores to cases and conditions [72]. The second step involves analyzing the necessity of individual conditions. In fsQCA, consistency and coverage are calculated based on Boolean algebra. Consistency serves as a key indicator for evaluating necessity. Coverage evaluates the empirical relevance of necessary conditions [54]. The formulas for calculating consistency and coverage are presented as follows:
Consistency   ( X i Y i ) = m i n   ( X i , Y i ) ( Y i ) ,
Coverage   ( X i Y i ) = m i n   ( X i , Y i ) ( X i ) ,
where X i denotes the calibrated score of the antecedent condition, and Y i represents the calibrated outcome score for case i .
The third step involves analyzing the sufficiency of condition configurations. It begins with constructing a truth table to assess whether specific combinations of conditions consistently lead to the outcome [54]. The truth table enumerates all logically possible combinations of causal conditions. The truth table is then refined by setting thresholds for consistency and case frequency. Finally, Boolean minimization is conducted using the Quine–McCluskey algorithm to identify optimal solutions. The formulas for calculating consistency and coverage in the sufficiency analysis are as follows:
Consistency   ( X i Y i ) = m i n   ( X i , Y i ) ( X i ) ,
Coverage   ( X i Y i ) = m i n   ( X i , Y i ) ( Y i ) ,
where X i denotes the calibrated score of the antecedent condition, and Y i represents the calibrated outcome score for case i .
A key limitation of current QCA research is the frequent neglect of the temporal dimension. To address this issue, Hino [20] introduced time-series QCA, which adapts time-series data into a format suitable for QCA, encompassing pooled QCA, fixed-effects QCA, and time-difference QCA. Pooled QCA analyzes how conditions affect outcomes by aggregating observations and aligning cases across spatial and temporal contexts. Additionally, Vis et al. [21] proposed the multi-period QCA method, which divides the study period into distinct intervals and conducts separate QCA analyses for each. By comparing configurations across time intervals, multi-period QCA reveals the evolving causal mechanisms between conditions and outcomes. Both pooled QCA and multi-period QCA mitigate the limitations of static analysis in theoretical and empirical research by incorporating temporal dynamics.

3.2. Variable Measurement

Urban green development is inherently multidimensional and complex. A single indicator is insufficient to fully capture its scope. Building on existing research and practical considerations, this study develops an urban green development evaluation index system that includes gaseous pollution, water pollution, solid pollution, and urban green space indicators [37]. The gaseous pollution indicators consist of four negative factors: industrial particulate matter emissions per unit of GDP, industrial SO2 emissions per unit of GDP, industrial NOX emissions per unit of GDP, and CO2 emissions per unit of GDP. Wastewater indicators are measured by one positive indicator: wastewater treatment rate. Solid waste indicators include one positive indicator: domestic garbage harmless treatment rate. The urban green space indicators include two positive indicators: the green coverage rate of the built district and the green space rate of the built district. Following previous studies [6,73], this study develops an evaluation framework for digital industrialization and industrial digitization. In line with existing research [39,74], this study constructs an evaluation system encompassing population, economic, spatial, and social urbanization. The specific indicators used in this study are presented in Table 1.
The entropy weight method provides objective weighting, effectively reducing errors caused by subjective judgment. This study adopts an improved entropy weight method for calculation. The improved method incorporates a time variable into the traditional approach, enabling longitudinal comparisons across periods [75]. Let there be n evaluation units, each measured by m indicators over q time periods. The calculation steps are as follows:
Step 1: Standardize the raw data.
For a positive indicator:
y i j t = x i j t m i n   x j m a x   x j m i n   x j ,
For a negative indicator:
y i j t = m a x   x j x i j t m a x   x j m i n   x j ,
where x i j t is the original data; m i n   x j and m a x   x j represent the minimum and maximum values of the j -th indicator across all evaluation units, respectively.
Step 2: Calculate the initial weight.
p i j t = y i j t / t = 1 q i = 1 n y i j t
Step 3: Compute the information entropy.
E j = l n ( q n ) 1 × i = 1 n t = 1 q p i j t × l n ( p i j t )
When the initial weight of the indicator p i j t is 0, it is defined that lim p ij t 0 p i j t × ln p i j t = 0 .
Step 4: Calculate the entropy-based weights.
W j = ( 1 E j ) / ( m j = 1 m E j )
Step 5: Compute the urban green development score.
U G D i t = j = 1 m ( W j × y i j t )
The weights of the indicators are presented in Table 1. According to the entropy weight method, weights are determined by the dispersion of indicator values. If an indicator shows high variation across samples, it contains more information, resulting in a lower entropy value and a higher weight [76]. For example, in the urban green development index system, the wastewater treatment rate has the highest weight, followed by CO2 emissions per unit of GDP, suggesting that urban sewage and carbon emissions are particularly important factors in urban green development.

3.3. Research Area

The Yellow River Basin is a key geographic region in China, spanning the eastern, central, and western parts of the country and connecting the Qinghai–Tibet Plateau, Loess Plateau, and North China Plain. It acts as a crucial ecological barrier, playing a vital role in national socio-economic development and ecological security [77]. Considering the inherent geographical and administrative coherence of the Yellow River Basin, the study area includes both the natural river course and the regions that are socio-economically linked to it [78]. The basin spans nine provinces in China. Sichuan Province was excluded from the analysis as it is fully integrated into the Yangtze River Economic Belt Strategy, and its Yellow River sections account for only 0.7% of the basin’s population and 0.3% of its GDP. Similarly, Eastern Inner Mongolia (Mengdong) was excluded due to its stronger socioeconomic alignment with Northeast China [79]. The study period spans from 2020 to 2022, based on data availability. A total of 79 cities in the Yellow River Basin were selected as the sample. These cities are categorized into three sections: upstream, midstream, and downstream (see Figure 2).

3.4. Data Sources

The majority of indicators in this study were sourced from the China City Statistical Yearbook. Specifically, urban population density, urban road surface area, road network density in built-up districts, wastewater treatment rate, and built-up district green space ratio were obtained from the China Urban Construction Statistical Yearbook. Data on the digital financial inclusion index were obtained from the China Digital Financial Inclusion Index [80]. Carbon emission data were obtained from the regional CO2 emission data provided by EDGAR (Emission Database for Global Atmospheric Research). Missing values are supplemented using city-level statistical yearbooks or interpolation methods.

3.5. Data Calibration

Calibration can be conducted using either a direct or an indirect method. In the direct approach, researchers must carefully select three anchor points that define membership levels in fuzzy sets for each condition: non-membership, crossover point, and full membership. The indirect approach involves rescaling measurements based on qualitative assessments. Pappas and Woodside [71] recommend the more widely used direct method, as it enhances replicability and validation by offering clearer justification for threshold selection. Therefore, this study adopts the direct calibration method. Following Fiss’s [53] approach, the three anchor points—non-membership, crossover point, and full membership—for the six conditions and the outcome variable are set at the 25th, 50th, and 75th percentiles of the sample cases, respectively. In cases where the calibrated antecedent condition is 0.5, a constant of 0.001 is added to the antecedent conditions with membership scores below 1 to avoid ambiguous outcomes. The calibration thresholds and descriptive statistics of all variables are presented in Table 2. This study uses fs/QCA 4.0 software for analysis.

4. Results

4.1. Level of Urban Green Development

Figure 3 shows notable spatial disparities in urban green development across the Yellow River Basin, exhibiting a stepwise pattern: upstream < midstream < downstream. Further analysis indicates that urban green development in all regions of the basin has exhibited a steady upward trend. Notably, the upstream and midstream regions experienced the most significant improvements in 2022.

4.2. Necessity Analysis

In QCA, a condition is considered necessary if it consistently appears whenever the outcome is observed. A consistency value above 0.9 indicates that the condition is necessary for the outcome [54]. Table 3 presents the test results for necessary conditions for both high and non-high levels of urban green development. All conditions exhibit a consistency value below 0.9, indicating that none are necessary for achieving either high or non-high urban green development.

4.3. Sufficiency Analysis

This study uses the truth table algorithm for sufficiency analysis, with raw consistency and frequency thresholds serving as key parameters. Schneider and Wagemann [72] recommend a minimum consistency threshold of 0.75 for sufficiency analysis. An appropriate frequency threshold is necessary to exclude rare configurations while maintaining a sufficient sample size for analysis [70]. Accordingly, a raw consistency threshold of 0.75 and a case frequency threshold of 2 are set in this study, preserving 93% of the cases. In addition, the study incorporates the proportional reduction in inconsistency (PRI) threshold to enhance result reliability. The PRI threshold helps avoid contradictory subset relationships of configurations under both the presence and absence of the outcome. A PRI consistency threshold close to the raw consistency level (e.g., 0.7) is recommended, as values below 0.5 suggest substantial inconsistency [81]. Therefore, this study adopts a PRI threshold of 0.7. The study primarily reports the intermediate solution, supplemented by the parsimonious solution, to distinguish core from peripheral conditions, ultimately identifying two configurations for high urban green development and four for non-high urban green development (Table 4).

4.3.1. Configurations of High Urban Green Development

In the configurational analysis of high urban green development, the overall solution consistency is 0.841, indicating that 84.1% of the cases explained by the two configurations exhibit high urban green development. The overall solution coverage is 0.316, suggesting that the two configurations account for 31.6% of the instances of high urban green development. Both configurations (H1 and H2) identify industrial digitalization and spatial urbanization as core conditions, highlighting their consistent synergistic role in advancing urban green development. Moreover, configurations H1 and H2 show that relying solely on DE or NTU is insufficient to drive urban green development, underscoring the need for integrated DE–NTU synergy.
Configuration H1 suggests that high urban green development can be achieved when industrial digitalization, digital industrialization, and spatial urbanization are core conditions, while economic and social urbanization are edge conditions, and population urbanization is absent. Traditional urbanization often prioritizes scale expansion over high-quality development, which hampers sustainable progress [39]. Configuration H1 emphasizes the synergistic effect of DE and NTU, focusing on the high-quality development of urbanization rather than just population expansion. Previous studies have shown that industrial digitalization, digital industrialization, economic urbanization, social urbanization, and spatial urbanization all play a role in advancing urban green development [32,33,35,45,47,82]. Additionally, lower levels of population urbanization are often associated with reduced pollutant emissions [35]. In conclusion, the combination of these conditions suggests that shifting focus from the net effect of individual conditions to their combined impact can foster high urban green development.
Precisely identifying the cases linked to each configuration enhances the understanding of the configurational results, which is a key advantage of the QCA method [83]. The cases in configuration H1 are exclusively located in the downstream region of the Yellow River Basin, including cities such as Qingdao, Yantai, Weihai, and Xuchang. For example, Qingdao, located in Shandong Province, is characterized by its developed socio-economic status, well-established urban infrastructure, and recognition as an important coastal central city and a renowned livable city in China. According to the “2022 China Digital City Competitiveness Research Report” by the China Academy of Information and Communications Technology, Qingdao ranked seventh in the 2022 Digital Top 100 Cities list. The combination of these factors has enabled Qingdao to achieve high levels of urban green development. According to the “2022 Qingdao Ecological Environment Status Bulletin”, Qingdao has made significant progress in pollution control and carbon reduction, achieving a 100% compliance rate for the quality of urban centralized drinking water sources, with air quality ranking among the best in Shandong Province.
Configuration H2 indicates that high urban green development is possible when industrial digitalization and spatial urbanization are core conditions, while economic urbanization is absent as a core condition, and digital industrialization and social urbanization are absent as edge conditions. Industrial digitalization is vital for promoting rational spatial planning and optimizing urban construction management [8], while spatial urbanization provides the material foundation and spatial support for industrial digitalization. The synergy between industrial digitalization and spatial urbanization effectively promotes urban green development. Configuration H2 also highlights low levels of economic urbanization, indicating that economic activities cause minimal disruption to the urban ecosystem. The cases in configuration H2 are located in the midstream and downstream regions of the Yellow River Basin, including cities such as Dezhou, Xinxiang, Zhumadian, and Jiaozuo. These cities have achieved green development through the systematic combination of these conditions.

4.3.2. Configurations of Non-High Urban Green Development

Table 4 presents four configurations that result in non-high urban green development. Configuration NH1 suggests that high urban green development cannot be attained without the presence of other conditions, irrespective of the level of economic urbanization. Similarly, configuration NH2 demonstrates that relying solely on a high level of economic urbanization is inadequate to attain high urban green development. Configurations NH1 and NH2 suggest that focusing exclusively on economic development while neglecting DE and other dimensions of urbanization hinders urban green development. Configuration NH3 shows that the absence of industrial digitalization and spatial urbanization is insufficient for achieving high urban green development, further supporting configuration H2. Configuration NH4 suggests that relying solely on digital industrialization, social urbanization, and spatial urbanization cannot result in high urban green development. Population, economy, and digitalization are key drivers of urban green development [8,33,84]. Configuration NH4 suggests that high urban green development may require the coordination of specific conditions from industrial digitalization, population urbanization, and economic urbanization. Compared to configurations H1 and H2, configurations NH1-NH4 highlight the absence of industrial digitalization, further emphasizing its role in promoting urban green development.
As an integrative economy, DE enhances industrial efficiency through digital industrialization and industrial digitization during market penetration, driving green economic development [8,65]. Industrial digitization is the primary driver of DE development and an effective means of transforming traditional enterprises and enhancing resource allocation efficiency [31]. Compared to digital industrialization, industrial digitization more effectively stimulates green innovation investments in enterprises [32], which may explain why it has always been a core condition. Moreover, these configurations are not mere inverses of those resulting in high urban green development, demonstrating QCA’s capacity to transcend the symmetric causality assumption inherent in linear regression [53,54]. Specifically, the condition combinations that lead to high urban green development are not mirror opposites of those that result in non-high outcomes, requiring separate analysis and comparison. The results indicate that the absence of industrial digitization frequently leads to non-high urban green development, whereas high performance necessitates both industrial digitization and complementary conditions from configurations H1 and H2.

4.4. Robustness Test

This study conducts robustness tests by adjusting the frequency threshold, raw consistency threshold, PRI consistency threshold, and calibration anchor points. If the configurations obtained after adjusting the parameters maintain a subset relationship with the original configurations, this indicates the robustness of the results [28].
The robustness tests for high urban green development configurations are summarized below (see Table 5). First, increasing the frequency threshold to 3 results in configurations that align with the original ones. The modified parameters yield identical results in terms of configuration quantity, condition combinations, solution coverage, and consistency, confirming the reliability of the previous analysis. This confirms that specific DE–NTU combinations (Configuration H1 and H2) effectively lead to high urban green development. Second, increasing the raw consistency threshold to 0.80 also produces configurations consistent with the original. Similarly, the results remain robust even when the raw consistency threshold is increased. Third, adjusting the PRI consistency threshold to 0.75 results in configurations that maintain a subset relationship with the original. The robustness test reveals that configuration R5 maintains full consistency with configuration H1. While configuration R6 incorporates population urbanization as an additional core condition, it remains a subset of the original configuration H2. Therefore, the findings demonstrate consistent robustness. Finally, setting the three calibration anchors (non-membership, crossover point, and full membership) at the 10th, 50th, and 90th percentiles of the sample cases for the configuration analysis improves overall solution coverage and consistency, with the configuration results remaining consistent with the original. Consequently, the driving pathways represented by configurations H1 and H2 provide credible explanatory power for local governance reference. This study applies the same method to conduct robustness tests on the non-high urban green development configurations. After adjusting the parameters, the resulting configurations maintain a subset relationship with the original. In conclusion, the research findings are robust and reliable.

4.5. Further Analysis

4.5.1. Multi-Period fsQCA Analysis

In accordance with the parameters of the pooled fsQCA analysis, configurations for the years 2020, 2021, and 2022 are analyzed sequentially (see Table 6). The results show that industrial digitalization and spatial urbanization consistently appear in the configurations of all three periods, indicating their continuous promotion of urban green development. In contrast to Period 1, Periods 2 and 3 emphasize the parallel existence of industrial digitalization and spatial urbanization, suggesting that over time, their collaboration effectively drives high urban green development. Industrial digitalization remains a core condition in all configurations across the periods, highlighting its universal role in urban green development. Population urbanization is typically absent either as a core condition or as an edge condition across the periods, suggesting that low levels of population urbanization are typically associated with high urban green development. Additionally, in all three periods, configurations with digital industrialization and industrial digitalization as core conditions are present. Therefore, DE plays a central role in urban green development. However, it should be noted that relying solely on DE is insufficient to achieve high urban green development. Similar to the pooled fsQCA configuration results, configurations S1–S8 demonstrate that the integration of DE and NTU enhances urban green development.

4.5.2. Analysis of Regional Differences

Significant regional differences in natural geography and economic development exist in the Yellow River Basin, with the downstream region generally surpassing the upstream region in urban green development. Analyzing green development pathways within regions allows for more accurate identification of configurations that can enhance the green development level in different geographic areas. Configurational analyses are performed for the upstream, midstream, and downstream regions based on the pooled fsQCA parameter settings for the full sample (see Table 7). The results of the configurational analysis reveal distinct pathways for urban green development across the Yellow River Basin regions.
The upstream region has a single configuration (C1), indicating that high urban green development is achieved when industrial digitalization is a core condition, with digital industrialization and social urbanization as edge conditions, and both population and spatial urbanization absent as core conditions. During social urbanization, improved infrastructure and public services help mitigate the negative impacts of external shocks and enhance the resilience of urban ecosystems. Meanwhile, DE offers innovative, efficient, and convenient social services and governance models for people’s livelihoods [8], reducing resource waste during urbanization and fostering high urban green development through the integration of DE and social urbanization.
The midstream region has three configurations. Configuration C2 highlights that combining industrial digitalization with various dimensions of NTU significantly promotes urban green development. Configuration C3 suggests that, under low levels of economic and spatial urbanization, the combination of high digital industrialization, industrial digitalization, population urbanization, and social urbanization promotes high urban green development. Configuration C4 emphasizes the key role of population urbanization, which contributes to urban green development by fostering talent aggregation and energy-efficient usage [38,44].
The downstream region has two configurations, C5 and C6, which share the same core conditions, forming second-order equivalent configurations. Both configurations emphasize the core role of digital industrialization, industrial digitalization, and spatial urbanization in promoting high urban green development. The explanatory logic of C5 contrasts with that of C4, showing that high urban green development can still be achieved with alternative condition combinations, even without relying on population urbanization. Compared to C5, C6 emphasizes the supportive role of population urbanization, rather than economic and social urbanization.

5. Discussion and Policy Recommendations

5.1. Discussion

Urban green development is a complex process influenced by the DE and NTU systems [29,84]. Previous studies have primarily examined the individual effects of DE or NTU on urban green development, but their contradictory findings limit explanatory power. Most studies suggest that DE promotes urban green development [27,29,30]. However, He et al. [22] argue that DE may negatively affect regional environmental governance. Higón [23] identified an inverted U-shaped relationship between DE and CO2 emissions. Regarding urbanization, some scholars believe it significantly enhances urban green development [24,85]. In contrast, others argue that urbanization may hinder urban green development [25,86]. Additionally, Pan et al. [5] suggest a potential nonlinear relationship between urbanization and urban green development. This study adopts a configurational approach to explore the synergistic impacts of digitalization and urbanization on urban green development. The results indicate that urban green development relies on the synergy of multiple conditions, with no single factor being sufficient or necessary on its own. Moreover, both DE and NTU are multidimensional, and their respective dimensions exert different impacts on urban green development. This study shifts from a single-dimensional to a multidimensional perspective, examining the interactions between different dimensions of DE and NTU. Zhai et al. [30] found that industrial digitization, compared to digital industrialization, provides greater advantages in the collaborative governance of pollution and carbon emissions. Similarly, this study confirms that industrial digitalization plays a more general role in promoting urban green development than digital industrialization. Empirical evidence also shows that different dimensions of urbanization have markedly different impacts on air pollution [35,36]. Among NTU dimensions, spatial urbanization plays the most consistent role in promoting urban green development.
From a configurational perspective, existing studies have explored the impacts of either DE or NTU on sustainable development [55,56,59]. However, these studies did not simultaneously consider both DE and NTU. Based on sociotechnical systems theory, this study investigates the combined effects of DE and NTU on urban green development. The results demonstrate that various coordinated combinations of DE (digital industrialization and industrial digitization) and NTU (population, economic, spatial, and social urbanization) can drive high urban green development. Richards et al. [41] identified a significant negative correlation between population density and urban green spaces in Southeast Asia. Our results show that the effect of population urbanization on urban green development—whether positive or negative—depends on its interaction with other conditions in the DE and NTU systems. Moreover, the configurational pathways driving urban green development display dynamic characteristics. This study explores the dynamic application of the QCA method through pooled fsQCA and multi-period fsQCA, overcoming the static limitations of traditional QCA methods. Longitudinal studies that track temporal changes offer a more comprehensive and reliable understanding of the factors influencing environmental performance [9]. The results indicate that industrial digitalization consistently impacts urban green development across all periods. Over time, the synergy between industrial digitalization and spatial urbanization stabilizes. This study reveals dynamic changes in the synergistic effects of different conditions on urban green development, enriching the literature on dynamic QCA.
The advancement of DE and NTU not only promotes urban green development but is also shaped by regional characteristics [5,26,87]. Cities in different geographical locations exhibit considerable differences in regional policies, resource endowments, urban competition, and industrial structures [28], all of which may affect the role of DE and NTU in urban green development. For example, urbanization in the Northern Hemisphere has a more positive impact on green development than that in the Southern Hemisphere [87]. In the Yangtze River Economic Belt, upstream cities can surpass the growth threshold with a lower level of urbanization, positively influencing urban green development [5]. This study demonstrates that regions within the Yellow River Basin follow distinct pathways to promote urban green development. Through the collaboration of digital industrialization, industrial digitalization, and social urbanization, even with lower levels of population and spatial urbanization, the upstream regions of the Yellow River Basin can still achieve a high level of urban green development. In the downstream regions of the Yellow River Basin, the synergistic effect of digital industrialization, industrial digitalization, and spatial urbanization is more pronounced, and their combination with other conditions significantly enhances urban green development. The findings suggest that cities at different stages of development and in various geographical regions should implement tailored policies to promote urban green development according to local conditions.

5.2. Policy Recommendations

First, local governments should actively promote the development of DE, focusing particularly on industrial digitization. Local governments should make public data resources accessible and support enterprises, research institutions, and other societal actors in data development and application. By advancing the digitalization, networking, and intelligent transformation of traditional industries such as manufacturing, agriculture, and services, smart manufacturing, green manufacturing, and service-oriented manufacturing can be promoted. Second, local governments should adopt a digitalization–urbanization synergy approach to enhance urban green development. For example, local governments should actively promote the synergistic development of industrial digitalization and spatial urbanization. This can be achieved by optimizing urban spatial planning to improve land use efficiency and providing spatial platforms for industrial digitalization and urbanization. Additionally, urban planning should integrate green and low-carbon concepts, promoting applications such as smart transportation, smart energy, and smart buildings to enhance urban sustainability. Third, the differences in urban green development pathways suggest that it is challenging for different regions to simultaneously develop all factors. For example, upstream regions should prioritize investments in digital infrastructure (e.g., 5G base station construction and ICT workforce development) to address spatial urbanization constraints, while downstream regions should focus on integrating smart technologies (e.g., smart transportation and smart building systems) into existing urban planning frameworks. In summary, local governments can establish mechanisms to enhance urban green development based on the governance characteristics of different periods.

5.3. Limitations and Future Research Directions

This study has several limitations that call for future research. First, this study focuses exclusively on urban green development in the Yellow River Basin of China, and the generalizability of its conclusions requires further verification due to geographic, cultural, and political differences. Future research should conduct comparative studies with other countries or other regions of China (e.g., the Yangtze River Delta region). Second, this study focused solely on the synergistic effects of DE and NTU on urban green development. The conditions and configurations that lead to high urban green development are varied. Future research could investigate the driving pathways of urban green development by incorporating additional key variables relevant to the research context. Third, the analysis was limited to a three-year period (2020–2022). Future studies could extend the timeframe to examine the dynamic evolution of urban green development pathways.

6. Conclusions

Promoting urban green development is essential for preserving the ecological environment and advancing high-quality development. This study systematically examines how DE and NTU jointly drive urban green development in China’s Yellow River Basin. The main findings are as follows:
(1) The pooled fsQCA results reveal that urban green development is achieved through synergistic configurations of DE and NTU subsystems. Specifically, the combination of industrial digitization and spatial urbanization constitutes the most effective pathway, while no single condition alone is sufficient to drive high urban green development. Additionally, the configuration results of non-high urban green development further demonstrate that low industrial digitalization is often associated with low urban green development.
(2) Similar to the pooled fsQCA results, the multi-period fsQCA analysis demonstrates that industrial digitization persists as a core condition across all periods. This further substantiates the universal role of industrial digitization in urban green development. The configuration analyses of different periods consistently highlight that the synergistic effect of industrial digitization and spatial urbanization can jointly promote a high level of urban green development.
(3) Regional analysis identifies distinct development pathways. Downstream regions benefit most from the DE–spatial urbanization synergy. Upstream regions can achieve high urban green development by leveraging the core role of industrial digitization, supplemented by the auxiliary effects of digital industrialization and social urbanization. Midstream regions exhibit diversified configuration patterns.
These findings advance urban sustainability research by establishing a configurational framework to analyze DE–NTU synergies. The study provides empirical evidence for developing tailored strategies that account for both regional characteristics and temporal dynamics in urban green development.

Author Contributions

Conceptualization, S.T., W.L., X.L., L.Y., and C.L.; formal analysis, S.T. and L.Y.; software, S.T.; writing—original draft, S.T.; writing—review and editing, S.T.; funding acquisition, W.L. and X.L.; resources, W.L.; investigation, P.L.; validation, P.L. and C.L. All authors have read and agreed to the published version of the manuscript.

Funding

This research was supported by the National Natural Science Foundation of China (Grant No. 72174137; Funding recipient: W.L.), Shanxi Province Basic Research Program (Industrial Development Category) Joint Funding Project (Grant No. 202303011222001; Funding recipient: W.L.), and the Humanities and Social Sciences Foundation Project of the Ministry of Education of China (Grant No. 21YJA630060; Funding recipient: X.L.).

Data Availability Statement

The raw data supporting the conclusions of this article will be made available by the authors upon request.

Conflicts of Interest

The authors declare no conflicts of interest.

Abbreviations

The following abbreviations are used in this manuscript:
fsQCAfuzzy-set qualitative comparative analysis
NTUnew-type urbanization
DEdigital economy

References

  1. McPhearson, T.; Cook, E.M.; Berbés-Blázquez, M.; Cheng, C.; Grimm, N.B.; Andersson, E.; Barbosa, O.; Chandler, D.G.; Chang, H.; Chester, M.V.; et al. A social-ecological-technological systems framework for urban ecosystem services. One Earth 2022, 5, 505–518. [Google Scholar] [CrossRef]
  2. Keith, M.; Birch, E.; Buchoud, N.J.A.; Cardama, M.; Cobbett, W.; Cohen, M.; Elmqvist, T.; Espey, J.; Hajer, M.; Hartmann, G.; et al. A new urban narrative for sustainable development. Nat. Sustain. 2023, 6, 115–117. [Google Scholar] [CrossRef]
  3. UN-HABITAT. World Cities Report 2022: Envisaging the Future of Cities; UN-Habitat: Nairobi, Kenya, 2022; Available online: https://unhabitat.org/sites/default/files/2022/06/wcr_2022.pdf (accessed on 10 May 2025).
  4. Wang, L.; Cheng, R.; Wang, X.; Song, W.; Zhang, S.; Huang, S. A Dynamic Assessment for Greenness Exposure and Socioeconomic Drivers: Evidence from 314 Chinese Cities (2000–2020). Urban For. Urban Green. 2025, 105, 128717. [Google Scholar] [CrossRef]
  5. Pan, Y.; Teng, T.; Wang, S.; Wang, T. Impact and mechanism of urbanization on urban green development in the Yangtze River Economic Belt. Ecol. Indic. 2024, 158, 111612. [Google Scholar] [CrossRef]
  6. Shen, C.; Wu, X.; Shi, L.; Wan, Y.; Hao, Z.; Ding, J.; Wen, Q. How does the digital economy affect the urban-rural income gap? Evidence from Chinese cities. Habitat Int. 2025, 157, 103327. [Google Scholar] [CrossRef]
  7. Zhou, C.; Wei, X.; Dai, X.; Zhang, G. Research on the Spatio-Temporal Evolution and Impact of China’s Digital Economy and Green Innovation. Land 2025, 14, 633. [Google Scholar] [CrossRef]
  8. Chen, R.; Wang, Y.; Wang, Q.; Zhang, L.; Xiong, R. Unleashing the digital dividend: Exploring how the digital economy promotes the construction of new urbanization in China’s 284 prefecture-level cities? Econ. Anal. Policy 2025, 85, 818–834. [Google Scholar] [CrossRef]
  9. Silva, N.; Fuinhas, J.A.; Koengkan, M.; Kazemzadeh, E. What are the causal conditions that lead to high or low environmental performance? A worldwide assessment. Environ. Impact Assess. Rev. 2024, 104, 107342. [Google Scholar] [CrossRef]
  10. D’Amico, G.; Arbolino, R.; Shi, L.; Yigitcanlar, T.; Ioppolo, G. Digitalisation driven urban metabolism circularity: A review and analysis of circular city initiatives. Land Use Policy 2022, 112, 105819. [Google Scholar] [CrossRef]
  11. Esposito, G.; Clement, J.; Mora, L.; Crutzen, N. One size does not fit all: Framing smart city policy narratives within regional socio-economic contexts in Brussels and Wallonia. Cities 2021, 118, 103329. [Google Scholar] [CrossRef]
  12. Yang, Y.; Shen, L.; Sang, M.; Ding, X. The impact of digitalization on urban sustainable development–An economic perspective. Technol. Forecast. Soc. Change 2025, 212, 124005. [Google Scholar] [CrossRef]
  13. Zhang, Y.; Zhu, Y.; Wei, T.; Guo, D. Assessment of coupling coordination between China’s digital economy and new-type urbanization and identification of driving factors. Econ. Change Restruct. 2024, 57, 122. [Google Scholar] [CrossRef]
  14. Wang, J.; Wang, Q.; Lu, D. Spatio-temporal coupling pattern and its influencing factors of digital economy, tourism economy and new urbanization: A case study of Yangtze River Delta region. Geogr. Res. 2024, 43, 3301–3326. [Google Scholar]
  15. Yang, P.; Bai, Y. Study on the Coupling Coordination and Driving Mechanism of Digital Economy and New-type Urbanization in the Yellow River Basin. J. Northwest AF Univ. 2024, 24, 114–126. Available online: https://link.cnki.net/doi/10.13968/j.cnki.1009-9107.2024.04.12 (accessed on 10 May 2025).
  16. Chen, Y.-P.; Fu, B.-J.; Zhao, Y.; Wang, K.-B.; Zhao, M.M.; Ma, J.-F.; Wu, J.-H.; Xu, C.; Liu, W.-G.; Wang, H. Sustainable development in the Yellow River Basin: Issues and strategies. J. Clean. Prod. 2020, 263, 121223. [Google Scholar] [CrossRef]
  17. Liu, C.; Zhang, X.; Wang, T.; Chen, G.; Zhu, K.; Wang, Q.; Wang, J. Detection of vegetation coverage changes in the Yellow River Basin from 2003 to 2020. Ecol. Indic. 2022, 138, 108818. [Google Scholar] [CrossRef]
  18. Pang, B.; Li, X.; Fu, Y. Coupling coordination analysis and obstacle factors of water-energy-environment-economy in the Yellow River Basin. J. Clean. Prod. 2024, 468, 143108. [Google Scholar] [CrossRef]
  19. Furnari, S.; Crilly, D.; Misangyi, V.F.; Greckhamer, T.; Fiss, P.C.; Aguilera, R.V. Capturing causal complexity: Heuristics for configurational theorizing. Acad. Manag. Rev. 2021, 46, 778–799. [Google Scholar] [CrossRef]
  20. Hino, A. Time-series QCA: Studying temporal change through Boolean analysis. Sociol. Theory Methods 2009, 24, 247–265. [Google Scholar]
  21. Vis, B.; Woldendorp, J.; Keman, H. Examining variation in economic performance using fuzzy-sets. Qual. Quant. 2013, 47, 1971–1989. [Google Scholar] [CrossRef]
  22. He, G.; Jiang, H.; Zhu, Y. The effect of digital technology development on the improvement of environmental governance capacity: A case study of China. Ecol. Indic. 2024, 165, 112162. [Google Scholar] [CrossRef]
  23. Higón, D.A.; Gholami, R.; Shirazi, F. ICT and environmental sustainability: A global perspective. Telemat. Inform. 2017, 34, 85–95. [Google Scholar] [CrossRef]
  24. Balsalobre-Lorente, D.; Driha, O.M.; Halkos, G.; Mishra, S. Influence of growth and urbanization on CO2 emissions: The moderating effect of foreign direct investment on energy use in BRICS. Sustain. Dev. 2022, 30, 227–240. [Google Scholar] [CrossRef]
  25. Liu, L.; Yang, Y.; Liu, S.; Gong, X.; Zhao, Y.; Jin, R.; Duan, H.; Jiang, P. A comparative study of green growth efficiency in Yangtze River Economic Belt and Yellow River Basin between 2010 and 2020. Ecol. Indic. 2023, 150, 110214. [Google Scholar] [CrossRef]
  26. Cui, X.; Li, P. Digital economy, environmental expenditure, and green total factor productivity. Financ. Res. Lett. 2025, 73, 106624. [Google Scholar] [CrossRef]
  27. Zhang, X.; Chen, Y.; Wang, T. Digital economy, CO2 emissions and China’s environmental sustainable development—An analysis based on TVP-VAR model. Econ. Anal. Policy 2024, 84, 1945–1957. [Google Scholar] [CrossRef]
  28. Tan, S.; Li, W.; Liu, X.; Wang, Y.; Wang, M. Exploring paths underpinning the implementation of municipal waste sorting: Evidence from China. Environ. Impact Assess. Rev. 2024, 106, 107510. [Google Scholar] [CrossRef]
  29. Liang, B.; He, G.; Wang, Y. The digital economy, market integration and environmental gains. Glob. Financ. J. 2024, 60, 100956. [Google Scholar] [CrossRef]
  30. Zhai, Z.; Zhang, T.; Yi, M.; Guan, Y.; Zhou, Y. Digital economy and the synergistic governance of pollutants and carbon emissions: Facilitation or obstruction? Environ. Res. 2024, 258, 119470. [Google Scholar] [CrossRef]
  31. Hao, X.; Liang, Y.; Yang, C.; Wu, H.; Hao, Y. Can industrial digitalization promote regional green technology innovation? J. Innov. Knowl. 2024, 9, 100463. [Google Scholar] [CrossRef]
  32. Liu, B.; Wang, Y.; Jiang, N.; Zhang, X. The impact of digital industrialization and industrial digitalization on regional green innovation efficiency in China -From the perspective of the innovation value chain. J. Clean. Prod. 2024, 478, 144015. [Google Scholar] [CrossRef]
  33. Shen, X.; Wang, Z. Can digital industrialization promote energy conservation development in China? Empirical evidence based on national big data comprehensive pilot zone policy. J. Environ. Manag. 2024, 368, 122125. [Google Scholar] [CrossRef] [PubMed]
  34. Khatami, F.; Vilamová, Š.; Cagno, E.; De Bernardi, P.; Neri, A.; Cantino, V. Efficiency of consumer behaviour and digital ecosystem in the generation of the plastic waste toward the circular economy. J. Environ. Manag. 2023, 325, 116555. [Google Scholar] [CrossRef] [PubMed]
  35. Liu, H.; Cui, W.; Zhang, M. Exploring the causal relationship between urbanization and air pollution: Evidence from China. Sustain. Cities Soc. 2022, 80, 103783. [Google Scholar] [CrossRef]
  36. Zhu, W.; Wang, M.; Zhang, B. The effects of urbanization on PM2.5 concentrations in China’s Yangtze River Economic Belt: New evidence from spatial econometric analysis. J. Clean. Prod. 2019, 239, 118065. [Google Scholar] [CrossRef]
  37. Liang, L.; Wang, Z.; Li, J. The effect of urbanization on environmental pollution in rapidly developing urban agglomerations. J. Clean. Prod. 2019, 237, 117649. [Google Scholar] [CrossRef]
  38. Li, X.; Song, W.; Cao, S.; Mo, Y.; Du, M.; He, Z. The impact of multidimensional urbanization on sustainable development goals (SDGs): A long-term analysis of the 31 provinces in China. Ecol. Indic. 2024, 169, 112822. [Google Scholar] [CrossRef]
  39. Cai, J.; Li, X.; Liu, L.; Chen, Y.; Wang, X.; Lu, S. Coupling and coordinated development of new urbanization and agro-ecological environment in China. Sci. Total Environ. 2021, 776, 145837. [Google Scholar] [CrossRef]
  40. Zhong, Z.; Chen, Z. Urbanization, green development and residents’ happiness: The moderating role of environmental regulation. Environ. Impact Assess. Rev. 2022, 97, 106900. [Google Scholar] [CrossRef]
  41. Richards, D.R.; Passy, P.; Oh, R.R. Impacts of population density and wealth on the quantity and structure of urban green space in tropical Southeast Asia. Landsc. Urban Plan. 2017, 157, 553–560. [Google Scholar] [CrossRef]
  42. Shen, H.; Tao, S.; Chen, Y.; Ciais, P.; Güneralp, B.; Ru, M.; Zhong, Q.; Yun, X.; Zhu, X.; Huang, T.; et al. Urbanization-induced population migration has reduced ambient PM2.5 concentrations in China. Sci. Adv. 2017, 3, e1700300. [Google Scholar] [CrossRef] [PubMed]
  43. Liu, Z.; Xin, Z.; Guo, C.; Zhao, Y. An Analysis Method of System Coupling and Spatio-Temporal Evolution of County New Urbanization and Logistics Industry. Systems 2024, 12, 185. [Google Scholar] [CrossRef]
  44. Ozcan, B. The nexus between carbon emissions, energy consumption and economic growth in Middle East countries: A panel data analysis. Energy Policy 2013, 62, 1138–1147. [Google Scholar] [CrossRef]
  45. Zhang, Z.; Ye, J. Decomposition of environmental total factor productivity growth using hyperbolic distance functions: A panel data analysis for China. Energy Econ. 2015, 47, 87–97. [Google Scholar] [CrossRef]
  46. Aguiar, A.P.D.; Collste, D.; Harmáčková, Z.V.; Pereira, L.; Selomane, O.; Galafassi, D.; Van Vuuren, D.; Van Der Leeuw, S. Co-designing global target-seeking scenarios: A cross-scale participatory process for capturing multiple perspectives on pathways to sustainability. Glob. Environ. Change 2020, 65, 102198. [Google Scholar] [CrossRef]
  47. Liu, Z.; Tang, Y.; Wilson, J.; Tao, X.; Lv, B.; Wang, Z.; Xu, Y.; Zhang, Z.; Zhang, Y.; Zhao, W. Influence of government attention on environmental quality: An analysis of 30 provinces in China. Environ. Impact Assess. Rev. 2023, 100, 107084. [Google Scholar] [CrossRef]
  48. Jia, H.; Li, W.; Tian, R. Spatio-Temporal Influencing Factors of the Coupling Coordination Degree Between China’s New-Type Urbanization and Transportation Carbon Emission Efficiency. Land 2025, 14, 623. [Google Scholar] [CrossRef]
  49. Chang, X.; Ma, T.; Wu, R. Impact of urban development on residents’ public transportation travel energy consumption in China: An analysis of hydrogen fuel cell vehicles alternatives. Int. J. Hydrogen Energy 2019, 44, 16015–16027. [Google Scholar] [CrossRef]
  50. Burton, E. The Compact City: Just or Just Compact? A Preliminary Analysis. Urban Stud. 2000, 37, 1969–2006. [Google Scholar] [CrossRef]
  51. Leibowicz, B.D. Urban land use and transportation planning for climate change mitigation: A theoretical framework. European J. Oper. Res. 2020, 284, 604–616. [Google Scholar] [CrossRef]
  52. Yan, X.; Xin, B.; Cheng, C.; Han, Z. Unpacking energy consumption in China’s urbanization: Industry development, population growth, and spatial expansion. Res. Int. Bus. Financ. 2024, 70, 102342. [Google Scholar] [CrossRef]
  53. Fiss, P.C. Building better causal theories: A fuzzy set approach to typologies in organization research. Acad. Manag. J. 2011, 54, 393–420. [Google Scholar] [CrossRef]
  54. Ragin, C.C. Redesigning Social Inquiry: Fuzzy Sets and Beyond; University of Chicago Press: Chicago, IL, USA, 2008. [Google Scholar] [CrossRef]
  55. Zhang, Y.; Liu, C.; Wang, T.; Zhang, X. Do all roads lead to Rome? Conditions and configurations of digital economy on carbon emission efficiency. J. Environ. Manag. 2024, 371, 123154. [Google Scholar] [CrossRef]
  56. Pan, S.; Liang, J.; Chen, W.; Guo, J.; Ou, M. How Does New-type Urbanization Induce Carbon Imbalance? Based on Configuration Analysis of the Three Major Urban Agglomerations in the Yangtze River Economic Belt. China Land Sci. 2024, 38, 116–128. [Google Scholar]
  57. Gong, Q. Green transformation paths of resource-based cities in China from the configuration perspective. Reg. Sustain. 2024, 5, 100158. [Google Scholar] [CrossRef]
  58. Luo, L.; Wang, Y.; Liu, Y.; Zhang, X.; Fang, X. Where is the pathway to sustainable urban development? Coupling coordination evaluation and configuration analysis between low-carbon development and eco-environment: A case study of the Yellow River Basin, China. Ecol. Indic. 2022, 144, 109473. [Google Scholar] [CrossRef]
  59. Bai, X.; Shen, Q. Exploring impact of digital economy on sustainable urban development by panel data of 30 underdeveloped cities in China. Sci. Rep. 2025, 15, 13325. [Google Scholar] [CrossRef]
  60. Savaget, P.; Geissdoerfer, M.; Kharrazi, A.; Evans, S. The theoretical foundations of sociotechnical systems change for sustainability: A systematic literature review. J. Clean. Prod. 2019, 206, 878–892. [Google Scholar] [CrossRef]
  61. Trist, E.L.; Bamforth, K.W. Some social and psychological consequences of the longwall method of coal-getting: An examination of the psychological situation and defences of a work group in relation to the social structure and technological content of the work system. Hum. Relat. 1951, 4, 3–38. [Google Scholar] [CrossRef]
  62. Leung, K.; Wang, J. Social processes and team creativity in multicultural teams: A socio-technical framework. J. Organ. Behav. 2015, 36, 1008–1025. [Google Scholar] [CrossRef]
  63. Xia, L.; Baghaie, S.; Sajadi, S.M. The digital economy: Challenges and opportunities in the new era of technology and electronic communications. Ain Shams Eng. J. 2024, 15, 102411. [Google Scholar] [CrossRef]
  64. Feng, H.; Fu, J.; Li, H.; Liang, Y. Urbanization or “Townization”? Measuring the evolution of Urban Systems in modern China. China Econ. Rev. 2025, 90, 102368. [Google Scholar] [CrossRef]
  65. Yu, L.; Liang, Z.; Gao, Y. Research on the mechanism of collaborative empowerment of regional green development by green finance and digital economy. J. Stat. Inf. 2024, 39, 56–71. Available online: https://link.cnki.net/doi/10.20207/j.cnki.1007-3116.2024.0001 (accessed on 10 May 2025).
  66. Wei, L.; Cheng, Y.; Wang, Z.; Pan, Z.; Qi, G. Does Multidimensional Urbanization Help Reduce Environmental Pollution?—Evidence from Three Major Urban Agglomerations in the Yangtze River Economic Belt. Sustainability 2025, 17, 1202. [Google Scholar] [CrossRef]
  67. Li, L.; Guo, D.; Qiao, L. How Does the Digital Economy Affect New Urbanization: Mechanisms and Tests. Inq. Into Econ. Issues 2024, 3, 17–36. [Google Scholar]
  68. Ma, W. New Urbanization, Technology Spillover and Digital Economy Development. Stud. Sci. Sci. 2025, 1–13. Available online: https://link.cnki.net/doi/10.16192/j.cnki.1003-2053.20241115.002 (accessed on 10 May 2025).
  69. Yang, P. Study on New-style Urbanization Enabled by Digital Economy at the Threshold of Chinese Modernization Field. J. Northwest Univ. 2023, 53, 168–182. Available online: https://link.cnki.net/doi/10.16152/j.cnki.xdxbsk.2023-04-015 (accessed on 10 May 2025).
  70. Tan, S.; Li, W.; Liu, X.; Liang, C.; Wang, Y.; Sackey, N.A. Social trust, past behavior, and willingness to pay for environmental protection: Evidence from China. Environ. Dev. Sustain. 2024, 1–29. [Google Scholar] [CrossRef]
  71. Pappas, I.O.; Woodside, A.G. Fuzzy-set Qualitative Comparative Analysis (fsQCA): Guidelines for research practice in Information Systems and marketing. Int. J. Inf. Manag. 2021, 58, 102310. [Google Scholar] [CrossRef]
  72. Schneider, C.Q.; Wagemann, C. Set-Theoretic Methods for the Social Sciences: A Guide to Qualitative Comparative Analysis; Cambridge University Press: Cambridge, UK, 2012. [Google Scholar]
  73. Zhang, Q.; Wu, P.; Li, R.; Chen, A. Digital transformation and economic growth Efficiency improvement in the Digital media era: Digitalization of industry or Digital industrialization? Int. Rev. Econ. Financ. 2024, 92, 667–677. [Google Scholar] [CrossRef]
  74. Lei, Y.; Xiao, Y.; Wang, F.; Wang, R.; Huang, H. Investigation on the complex relationship between urbanization and eco-efficiency in urban agglomeration of China: The case study of Chengdu-Chongqing urban agglomeration. Ecol. Indic. 2024, 159, 111704. [Google Scholar] [CrossRef]
  75. Li, M.; Huang, K.; Xie, X.; Chen, Y. Dynamic evolution, regional differences and influencing factors of high-quality development of China’s logistics industry. Ecol. Indic. 2024, 159, 111728. [Google Scholar] [CrossRef]
  76. Zhe, W.; Xigang, X.; Feng, Y. An abnormal phenomenon in entropy weight method in the dynamic evaluation of water quality index. Ecol. Indic. 2021, 131, 108137. [Google Scholar] [CrossRef]
  77. Xu, Y.; Liu, X.; Zhao, L.; Li, H.; Zhu, P.; Liu, R.; Wang, C.; Wang, B. Spatial and Temporal Analysis of Habitat Quality in the Yellow River Basin Based on Land-Use Transition and Its Driving Forces. Land 2025, 14, 759. [Google Scholar] [CrossRef]
  78. Zhao, Z.; Ru, S.; Xue, F. Spatio-temporal pattern and dynamic evolution of ecological resilience in the Yellow River Basin: Based on the analysis of emergy ecological footprint model. China Popul. Resour. Environ. 2024, 34, 136–147. [Google Scholar]
  79. Lv, D.; Wang, J.; Cheng, Z. Spatio-Temporal Coupling and Driving Factors of Digital Economy, Ecological Protection and High-quality Development in the Yellow River Basin. Inq. Into Econ. Issues 2022, 8, 135–148. [Google Scholar]
  80. Guo, F.; Wang, J.; Wang, F.; Kong, T.; Zhang, X.; Cheng, Z. Measuring China’s Digital Financial Inclusion: Index Compilation and Spatial Characteristics. China Econ. Q. 2020, 19, 1401–1418. Available online: https://link.cnki.net/doi/10.13821/j.cnki.ceq.2020.03.12 (accessed on 10 May 2025).
  81. Greckhamer, T.; Furnari, S.; Fiss, P.C.; Aguilera, R.V. Studying configurations with qualitative comparative analysis: Best practices in strategy and organization research. Strateg. Organ. 2018, 16, 482–495. [Google Scholar] [CrossRef]
  82. Lin, B.; Du, Z. Can urban rail transit curb automobile energy consumption? Energy Policy 2017, 105, 120–127. [Google Scholar] [CrossRef]
  83. Li, W.; Tan, S.; Liu, X.; Wang, Z.; Li, G. Identifying the effective and ineffective configurations of the mandatory waste management policy in China: A qualitative comparative analysis. J. Environ. Plan. Manag. 2023, 67, 3003–3025. [Google Scholar] [CrossRef]
  84. Wang, K.; Fang, C. Revealing the synergy between carbon reduction and pollution control in the process of new-type urbanization: Evidence from China’s five major urban agglomerations. Sustain. Cities Soc. 2025, 120, 106154. [Google Scholar] [CrossRef]
  85. Li, T.; Han, D.; Ding, Y.; Shi, Z. How does the development of the internet affect green total factor productivity? Evidence from China. IEEE Access 2020, 8, 216477–216490. [Google Scholar] [CrossRef]
  86. Lin, M.; Lin, T.; Sun, C.; Jones, L.; Sui, J.; Zhao, Y.; Liu, J.; Xing, L.; Ye, H.; Zhang, G.; et al. Using the Eco-Erosion Index to assess regional ecological stress due to urbanization–A case study in the Yangtze River Delta urban agglomeration. Ecol. Indic. 2020, 111, 106028. [Google Scholar] [CrossRef]
  87. Chen, J.; Qiu, B.; Chakraborty, T.; Miao, X.; Cao, Y.; Li, L.; Zhao, S.; Ni, Y.; Tian, X.; Qian, Y.; et al. Contrasting effects of urbanization on vegetation between the Global South and Global North. Nat. Sustain. 2025, 8, 373–384. [Google Scholar] [CrossRef]
Figure 1. Theoretical framework for the collaborative driving of urban green development by DE and NTU.
Systems 13 00426 g001
Figure 2. Overview of the study area.
Systems 13 00426 g002
Figure 3. Level of urban green development in the Yellow River Basin.
Systems 13 00426 g003
Table 1. Evaluation indicator system and weights.
DimensionQuantitative IndicatorAttributeEntropyWeight
Urban green developmentWastewater treatment rate+0.9890.317
The green space rate of the built district+0.9960.120
The green coverage rate of the built district+0.9960.115
Domestic garbage harmless treatment rate+0.9980.051
CO2 emissions per unit of GDP-0.9940.176
Industrial particulate matter emissions per unit of GDP-0.9970.093
Industrial SO2 emissions per unit of GDP-0.9970.092
Industrial NOx emissions per unit of GDP-0.9990.036
Digital industrializationPer capita income from telecommunication services+0.8890.477
The proportion of employees in the information transmission, computer services, and software industry in total employment+0.9230.332
The Internet broadband access subscribers in the total population+0.9680.140
The proportion of mobile phone subscribers in the total population+0.9880.051
Industrial digitizationPer capita income from postal services+0.9580.785
Digital financial inclusion index+0.9890.215
Population urbanizationUrban population density+0.9540.564
Urbanization rate+0.9750.304
Natural population growth rate+0.9890.132
Economic urbanizationPer capita GDP+0.9650.437
Per capita disposable annual income of urban households+0.9690.378
The proportion of the tertiary industry in GDP+0.9850.185
Social urbanizationCollections of public libraries per 10,000 population+0.9610.442
Total retail sales of consumer goods per capita+0.9700.344
The number of health technicians per 10,000 population+0.9810.214
Spatial urbanizationThe proportion of built districts in the total area+0.8930.702
Urban road surface area per capita+0.9760.161
The density of the road network in the built district+0.9790.138
Table 2. Calibration and descriptive statistics of variables.
Conditions and OutcomeNon-MembershipCutoffFull-MembershipMeanS.D.MinMax
Urban green development0.6680.7280.7780.7160.0850.4270.949
Digital industrialization0.0690.0920.1260.1190.0890.0240.631
Industrial digitization0.1990.2640.3670.3070.1700.0001.000
Population urbanization0.2600.3730.4710.3940.1620.1330.853
Economic urbanization0.2280.2830.3730.3220.1330.1380.777
Social urbanization0.2170.2940.4010.3270.1550.0810.943
Spatial urbanization0.1190.1700.2300.1900.1070.0360.729
Table 3. Analysis of necessary conditions.
Antecedent ConditionHigh Urban Green DevelopmentNon-High Urban Green Development
ConsistencyCoverageConsistencyCoverage
Digital industrialization0.5510.5600.5430.539
~Digital industrialization0.5470.5510.5570.547
Industrial digitization0.6870.6870.4170.406
~Industrial digitization0.4060.4160.6790.679
Population urbanization0.5220.5340.5470.546
~Population urbanization0.5570.5570.5340.521
Economic urbanization0.5930.6120.4820.485
~Economic urbanization0.5000.4970.6140.596
Social urbanization0.5870.6010.5090.509
~Social urbanization0.5200.5210.6000.586
Spatial urbanization0.6450.6510.4550.448
~Spatial urbanization0.4530.4600.6450.639
Note: “~” = Negation (NOT).
Table 4. Configurational results of urban green development.
ConditionHigh Urban Green DevelopmentNon-High Urban Green Development
H1H2NH1NH2NH3NH4
Digital industrialization
Industrial digitization
Population urbanization
Economic urbanization
Social urbanization
Spatial urbanization
Raw coverage0.1780.1700.2400.0940.1000.058
Unique coverage0.1460.1390.1520.0080.0620.020
Consistency0.8400.8430.7870.8500.8340.844
Overall solution coverage0.3160.337
Overall solution consistency0.8410.797
Note: ⬤ denotes the presence of the core condition, ◯ denotes the absence of the core condition, • denotes the presence of the edge condition, and ◦ denotes the absence of the edge condition. The same symbols apply to all later tables.
Table 5. Robustness test for high urban green development.
ConditionFrequency Threshold = 3Raw Consistency Threshold = 0.80PRI Consistency Threshold = 0.75Changing the Anchor Points
R1R2R3R4R5R6R7R8
Digital industrialization
Industrial digitization
Population urbanization
Economic urbanization
Social urbanization
Spatial urbanization
Raw coverage0.1780.1700.1780.1700.1780.0990.2630.294
Unique coverage0.1460.1390.1460.1390.1520.0730.1280.159
Consistency0.8400.8430.8400.8430.8400.8640.8760.894
Overall solution coverage0.3160.3160.2510.422
Overall solution consistency0.8410.8410.8520.879
Table 6. Configurational results for multi-periods.
ConditionPeriod 1 (Year 2020)Period 2 (Year 2021)Period 3 (Year 2022)
S1S2S3S4S5S6S7S8
Digital industrialization
Industrial digitization
Population urbanization
Economic urbanization
Social urbanization
Spatial urbanization
Raw coverage0.2140.1220.0650.1600.1780.1780.1830.202
Unique coverage0.1610.0670.0390.1260.1440.1440.0230.049
Consistency0.8470.8810.9110.8440.8490.8370.8700.910
Overall solution coverage0.3230.3040.376
Overall solution consistency0.8510.8470.870
Table 7. Configurational results for different geographic regions.
ConditionUpstream RegionMidstream RegionDownstream Region
C1C2C3C4C5C6
Digital industrialization
Industrial digitization
Population urbanization
Economic urbanization
Social urbanization
Spatial urbanization
Raw coverage0.1380.3630.0930.1500.3470.075
Unique coverage0.1380.3320.0560.1220.3040.032
Consistency0.8630.8240.9480.8560.7970.914
Overall solution coverage0.1380.5480.379
Overall solution consistency0.8630.8430.810
Disclaimer/Publisher’s Note: The statements, opinions and data contained in all publications are solely those of the individual author(s) and contributor(s) and not of MDPI and/or the editor(s). MDPI and/or the editor(s) disclaim responsibility for any injury to people or property resulting from any ideas, methods, instructions or products referred to in the content.

