Article

Assessing Digital Performance of Public Services in the EU: E-Governance and Technology Integration

by
Oana Ramona Lobonț
1,*,
Cristina Criste
2,
Alexandra Ioana Vintilă
3,
Andreea Florentina Crăciun
1 and
Nicoleta Claudia Moldovan
1
1
Department of Finance, Business Information Systems and Modelling, Faculty of Economics and Business Administration, West University of Timișoara, 300223 Timișoara, Romania
2
Doctoral School of Economics and Business Administration, Faculty of Economics and Business Administration, West University of Timișoara, 300223 Timișoara, Romania
3
Doctoral School of Finance, Faculty of Finance and Banking, Bucharest University of Economic Studies, 010374 Bucharest, Romania
*
Author to whom correspondence should be addressed.
Systems 2025, 13(6), 425; https://doi.org/10.3390/systems13060425
Submission received: 18 April 2025 / Revised: 18 May 2025 / Accepted: 30 May 2025 / Published: 2 June 2025

Abstract

This research aims to rank the regions of the European Union based on their digital performance in public services, offering a new perspective on the digitalization process and its effects on the European public system. Therefore, the study examines the evolution of intensity and the impact of digitalization through the e-government framework, specifically from the perspective of the 27 member states of the European Union. Thus, the research analyzes the interplay between digital intensity, institutional quality, and adoptingadopting e-government services to understand the challenges and disparities across different regions. To evaluate the digital performance of the European Union regions, the analysis employs the following methods: (i) Principal Component Analysis to construct a composite Institutional Quality Index based on governance indicators, (ii) Gaussian graphical models to assess the relationships between digital intensity, institutional quality, and e-government highlighting the interconnections between variables, (iii) Data Envelopment Analysis to measure the relative efficiency of public service delivery, and (iv) cluster dendrograms to identify the clusters of countries with similar performance levels and challenges. The findings reveal disparities among nations and the contemporary challenges facing EU member states in implementing and adopting e-government initiatives. While Denmark and Finland often excel in digital service efficiency, countries like Bulgaria, Greece, and Romania may lag due to citizens’ limited digital infrastructure and digital literacy. However, it is to note that the quality of regulations, as reflected in the Institutional Quality Index, plays a significant role in successfully integrating digitalization. The study underscores the crucial role of digital adoption in enhancing the public sector’s performance, particularly when coupled with strong institutional frameworks.

1. Introduction

The primary objective of this research is to evaluate and rank the regions of the European Union based on their digital performance in terms of public service delivery. In addition, the research investigates the digital performance of the public sector in the countries of the European Union, incorporating different dimensions of digital efficiency and public service delivery and governance: digital infrastructure, digital economy, digital skills, e-government, and the Institutional Quality Index within a complex methodological framework.
Member states of the European Union have emphasized the importance of digital solutions and highlighted how digital innovations contribute to the optimal allocation of resources, obtaining a competitive advantage, and stimulating the digital performance of the public sector. However, it is necessary to evaluate the effects of digitalization because not all forms of digitalization can improve the performance of the public sector. The imperative of monitoring the efficiency of the public sector has led to the exploration of new methods and approaches for performance evaluation. Therefore, the increasing share of public services determines the intensification of the performance measurement process.
The complexity of these challenges, amplified by the current macroeconomic events: economic and political uncertainties, the COVID-19 pandemic, and conflicts that have affected economies globally, underscores the need for advanced methodologies to capture the multilateral nature of public sector performance. All these events have influenced citizens’ perceptions of the efficiency of the state in organizing and carrying out its main characteristics. Therefore, measuring the sector’s performance, which has led to a simplified perspective of its complexity, drives the evaluation of the state of the public sector. However, this endeavor requires a comprehensive conceptual framework as well as the use of robust evaluation methods. Due to the complexity of the public sector, there are also various instruments for determining its performance. Furthermore, the importance of developing precise performance measurement models supported by solid empirical evidence to refine policies and strategies in the public sector also arises.
Although the existing literature often constructs performance indices associated with the public sector, our research suggests that measuring the public sector’s performance through composite indicators faces significant obstacles due to insufficient data input. This can lead to unrealistic results and potentially flawed public policies. Furthermore, identifying the research hypotheses behind developing composite performance measurement indicators represents an entirely different challenge and can lead to measurement errors.
Our study is structured around the following research questions:
(i)
What are the key challenges in implementing e-government and achieving efficient digitization of public services in the member states of the European Union?
(ii)
How does the level of public sector digitization influence the efficiency of public service delivery in EU member states, and what policies can be implemented to maximize its positive impact on the public sector’s performance?
To address these questions, our research highlights the potential of comprehensive evaluations and the application of innovative econometric models, such as Principal Component Analysis (PCA), Gaussian graphical models, cluster dendrogram analysis, and Data Envelopment Analysis, as well as introducing the RTS Region calculation method, to assess the efficiency of the public sector at the EU-27 level and identify the best practice models and provide policy recommendations aimed at improving the public sector’s performance.
Our study addresses the existing gaps in the scientific literature, highlighting the importance of integrating multiple dimensions within a coherent framework for evaluating the performance of the public sector in numerous European Union member states. It goes beyond traditional one-dimensional assessments to provide a more holistic understanding of the factors determining performance.
This study offers a new analytical framework for evaluating the efficiency of the public sector in a multilateral EU context. The research distinguishes itself from other studies in the field by utilizing advanced methodological approaches that provide a comprehensive overview of measuring the public sector’s performance. Specifically, we focus on identifying significant variations in the digitalization of public services across EU member states, with a focus on advanced digital skills.
The innovative aspect of this study stems from the opportunity to examine new methodologies and perspectives that can contribute to the conceptualization and perspectives of innovations related to the progress of the public sector. By combining different methodological approaches, the research provides a more robust and nuanced analysis than would be possible with a single research method.
This research is not limited to the simple application of various methodologies to construct a relevant methodological framework. It also explores, tests, and provides various proxy indicators for measuring the public sector’s performance while formulating possible policy implications. However, there remain gaps in understanding how various country-specific factors interact with the implementation of e-government technology and digital technology to provide actionable insights. This methodological approach facilitated the measurement of the efficiency of organizational/individual decision-making units, with the member states of the European Union being divided into efficient and inefficient regions, with a focus on determining the digital performance. This approach highlights the specific positions of each country and the regional differences within the EU, thus contributing to tailored policy recommendations for improving performance. Therefore, the contribution of our study is the detailed examination of performance levels in the public sector of European Union countries. It has incorporated a composite indicator of institutional quality while calculating the efficiency using the RTS region calculation method introduced through the application of Data Envelopment Analysis.
Our empirical findings are aligned with the model developed by Androniceanu et al. [1], Yera et al. [2], and Doran et al. [3], highlighting the performance dynamics of the public sector in the European Union countries. Thus, our main findings highlight significant variations in the level of digitization of services among the EU-27 member states. These results also highlight the need to establish a stable yet flexible framework for regulating digital policies tailored to the specific level of digitalization of each member state.
Our findings support the hypothesis that the digitalization of the public sector has a positive impact on the provision of public services. However, our analysis shows significant national differences that need to be addressed in order to increase the digital efficiency and thus the generation of public services. Highlighting these disparities, we emphasize the importance of developing strategies to improve performance in specific contexts, thus promoting more significant equity in the provision of public services across the EU. A one-size-fits-all approach is unlikely to be effective given the diversity of digital landscapes across the EU. Instead, customized strategies are needed to address the unique challenges and opportunities facing each member state.
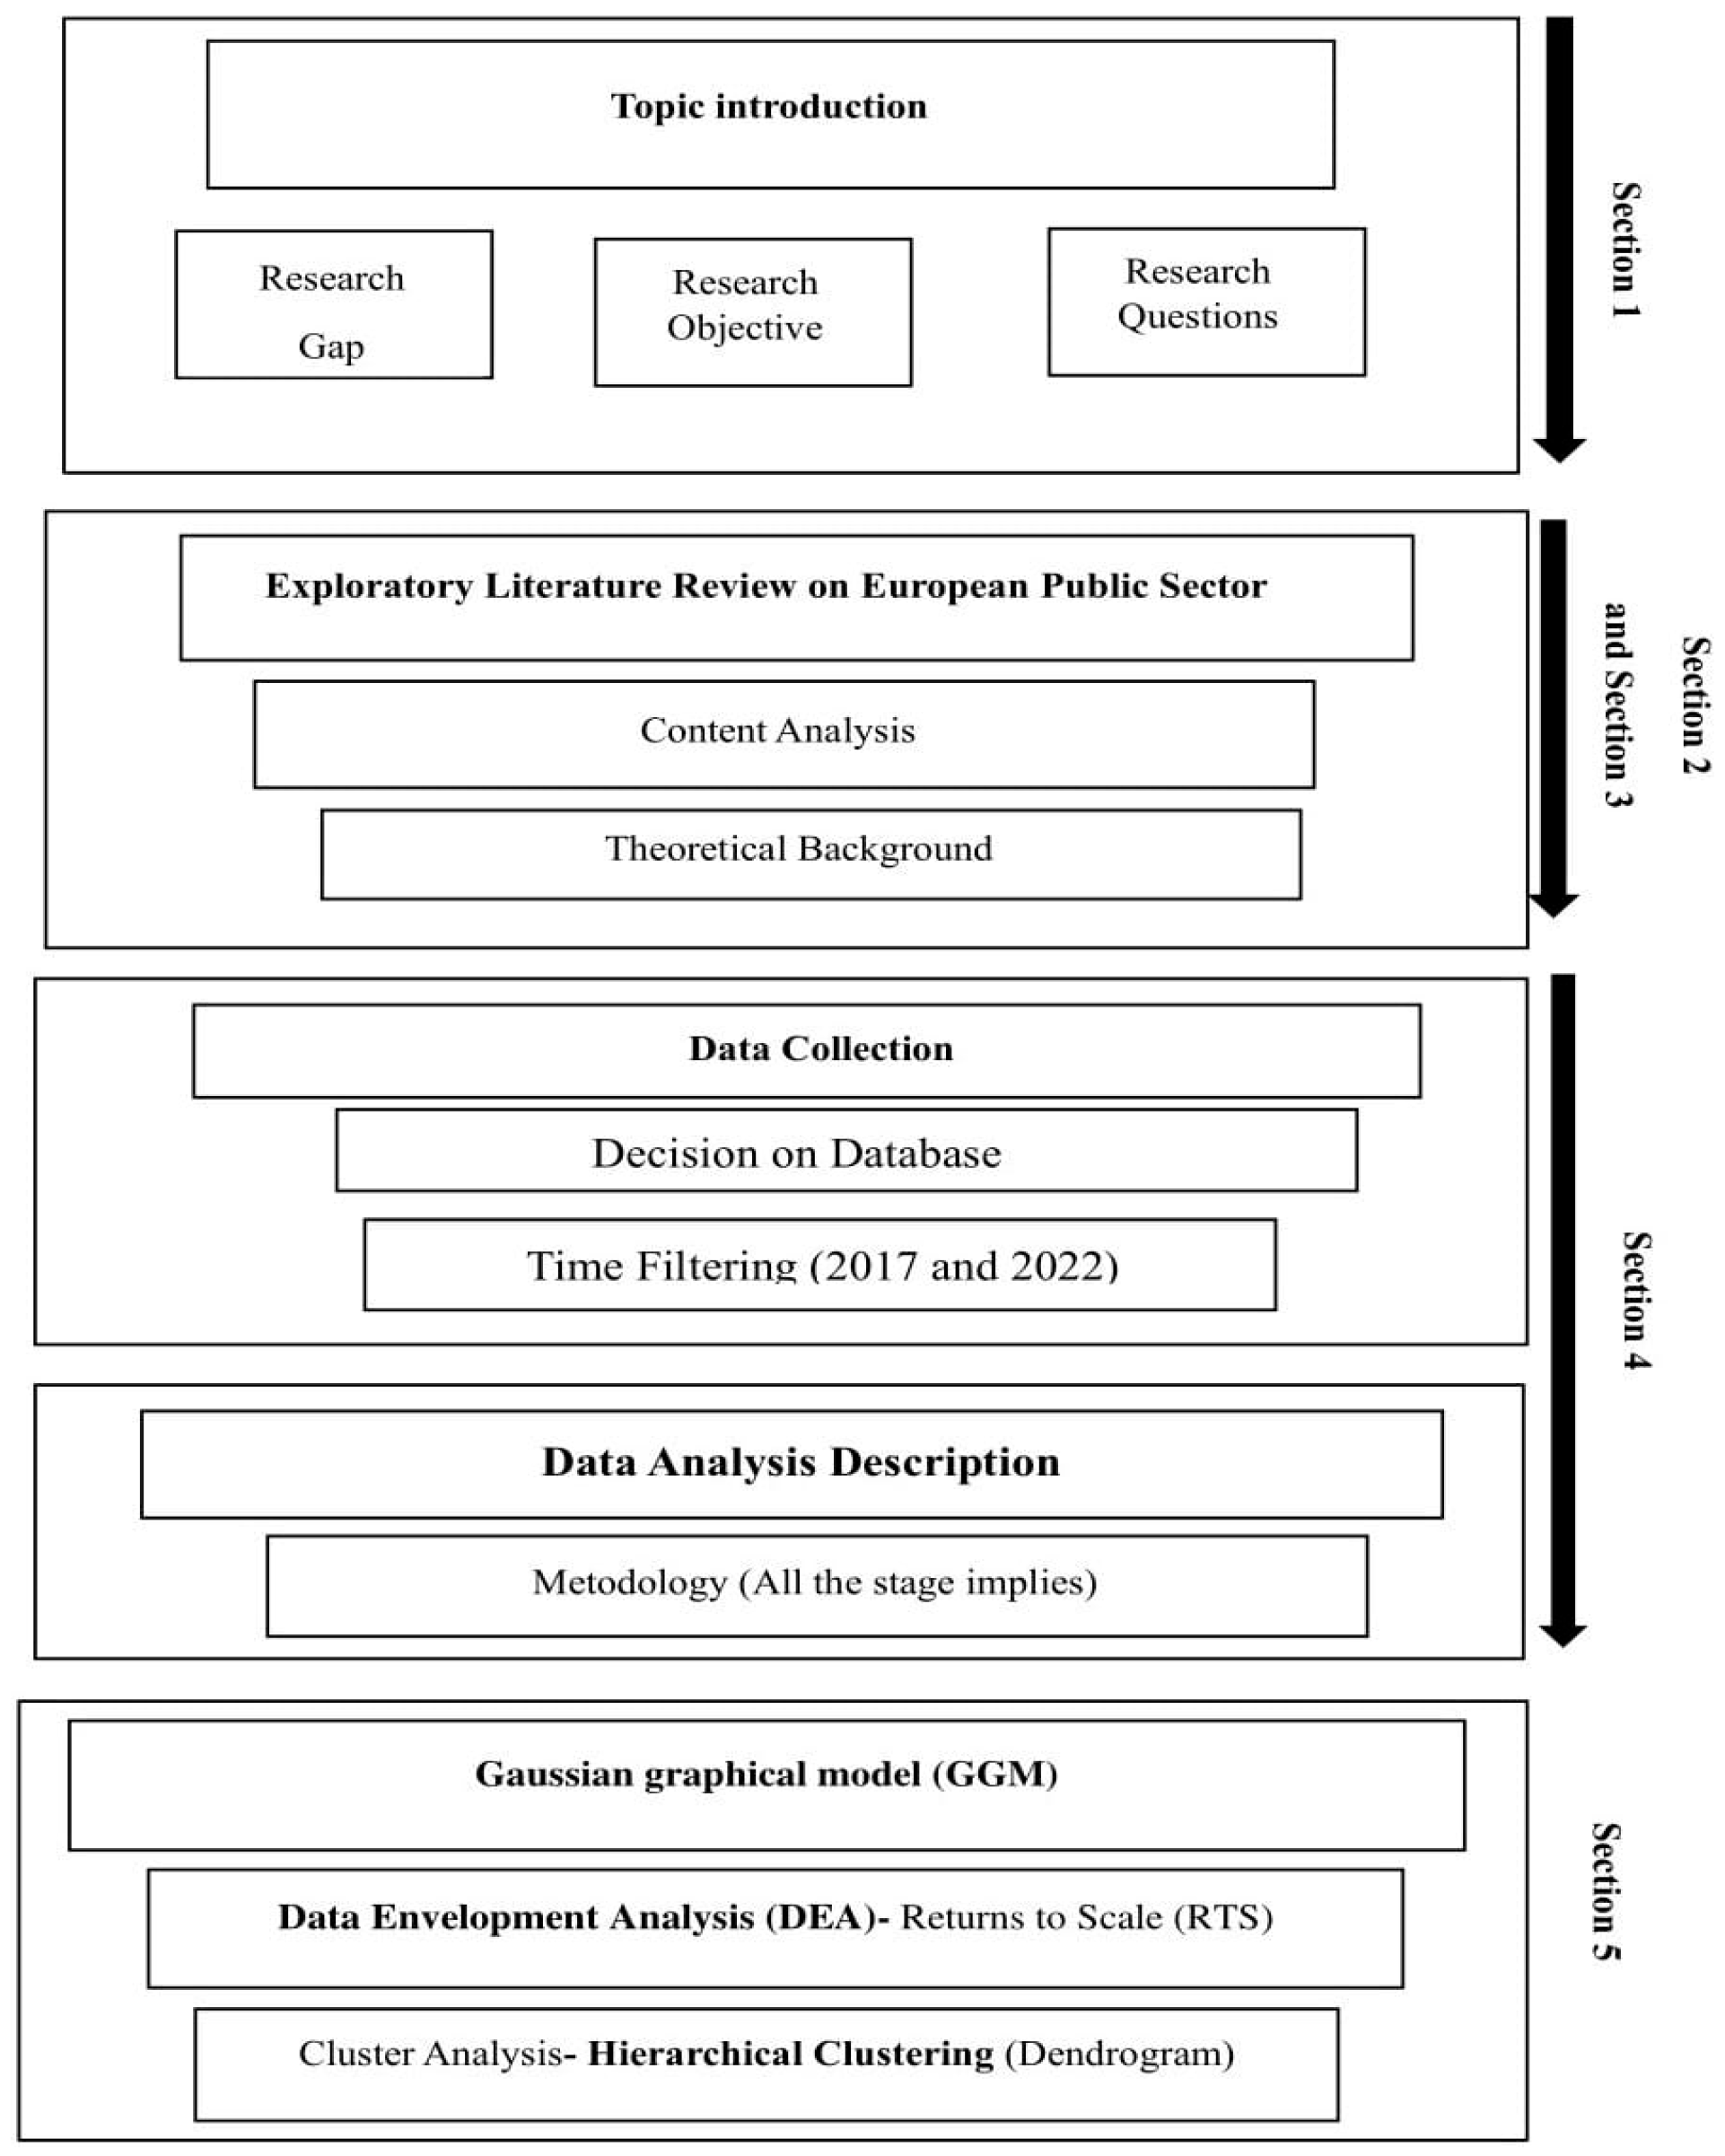
The presentation of the structure of the paper is shown in Figure 1. Thus, after an introduction that establishes the research context, highlighting the main tools for studying performance in the public sector, the second section presents the methods and techniques for measuring the public sector’s performance identified in the literature, ranging from non-parametric to parametric analyses. This review synthesizes key theoretical frameworks and empirical studies relevant to the subject, emphasizing the progress in understanding the analytical framework of the public sector’s performance in terms of efficiency and effectiveness. Section 4 describes the source of the data used for analysis and also details the econometric methods used to analyze data, such as Gaussian graphical models, Data Envelopment Analysis and clustering techniques, as well as other statistical tools that facilitate a thorough examination of the relationships between digitalization and e-government variables. Section 5 systematically reports the results in tabular and graphical form to illustrate key trends and relationships. The main findings provide empirical evidence of the implications of using digital technology on the performance of the public sector, documenting new perspectives on how various factors interact in the context of e-government. This approach allows for a deeper understanding of the regional disparities among EU member states. The final section concludes with the study’s findings, highlighting the main insights derived from the analysis.

2. Literature Review

2.1. Conceptual Delimitations Regarding Performance of Public Sector

Nowadays there is an increased interest in evaluating and measuring the performance of the public sector, both at the academic level and among international institutions. This trend results from many macroeconomic events, namely economic recessions, financial crises, and conflicts that have affected economies globally. These events have thus influenced citizens’ attitudes towards the state’s efficiency in the organization and conduct of its main characteristics. Therefore, the measurement of the performance of the public sector is based on the incorporation of methods borrowed from the private sector for the evaluation and improvement of performance, including the use of performance indicators [1].
There are a variety of forms for measuring performance in the public sector, and according to Djellal and Gallouj [2], these are represented by: effectiveness (the ratio between results and inputs), economic effectiveness (the ratio between results and costs), and technical/productive efficiency (related to outputs and inputs), as well as allocation efficiency (the ratio between results and costs). On the one hand, effectiveness refers to the degree of achievement of the proposed objectives. We are talking about economic efficiency when considering the costs involved in this process. On the other hand, efficiency highlights the capacity to achieve these objectives while minimizing the use of available resources. Consequently, efficiency is an indicator obtained by relating the effects of the results to the efforts expended. At the same time, effectiveness is the indicator given by the ratio between the result obtained and the one planned to be achieved. Additionally, Drucker [3] considers that there is no efficiency without effectiveness. Hence, the relationship between efficiency and effectiveness is that of a part to the whole, with effectiveness becoming necessary for achieving efficiency. Thus, efficiency is determined by the ratio between inputs and outputs. Therefore, effectiveness illustrates the success with which resources were used to achieve objectives, so effectiveness is more complex than efficiency [4]. However, a distinction appears between technical efficiency and allocation efficiency. Technical efficiency implies a relationship between inputs and outputs on the production frontier curve. However, not every form of technical efficiency is economically significant—this deficiency is captured by allocation efficiency, which requires a cost/benefit ratio. Furthermore, Profiroiu and Profiroiu [5] consider that the performance measures are represented by evaluating resource efficiency, evaluating costs, measuring efficiency, determining effectiveness, evaluating service quality, examining financial performance, and measuring overall performance.
According to the scientific literature, there are three general ways to determine the efficiency of the public sector, as a measure of performance in the public sector, namely: the use of composite indicators [6,7], the use of non-parametric methods, such as Data Envelopment Analysis (DEA), to obtain efficiency-based scores and thus identify best practices [8], and the use of stochastic frontier analysis for evaluating the performance of the public system [9]. Since performance measurement is a complex process, it requires appropriately considering many associated subdomains when calculating composite indicators. According to van Thiel and Leeuw [10], the decline in performance indicators is attributed to four processes. The first process is named positive learning. As performance improves, the indicators lose their sensitivity in detecting poor performance, suggesting that everyone has become so good at what they do that the indicator becomes outdated. The second process is represented by perverse learning, which occurs when organizations or individuals have learned what aspects of performance are measured and can use this knowledge to manipulate their evaluations. They can focus all efforts on what is measured, leading to increased performance. However, overall improvement may not materialize, and other aspects of performance may even deteriorate. The third process, called selection, assumes replacing the weakest performers with the best performers, reducing performance differences. As a result, only the best performers remain, and the indicator loses its discriminatory power, almost resembling a consequence of the survival of the fittest mechanism. The fourth process is represented by a suppression that arises when performance differences are ignored.
As a result of the complexity of the public sector, various instruments emerged for studying performance in the public sector, which are differentiated at two levels: management and performance measurement instruments at the organizational level and instruments for measuring the overall performance of the public sector. Thus, in the international specialized literature, there are a variety of approaches regarding the analysis of the public sector’s performance. Afonso et al. [6] focus on assessing the public sector’s performance in the new EU member states and emerging markets, using econometric techniques to measure the efficiency of public spending. They also propose economic and institutional factors as key explanations for performance differences between these emerging economies. Moreover, Afonso and Fernandes [11] measure the efficiency of local government spending in the Lisbon region, using Data Envelopment Analysis to compare the efficiency of different administrative units and to identify the variables that influence local government performance and how public spending can better align with community needs. Data Envelopment Analysis is also used by Afonso et al. [12], who use the public sector efficiency in Latin American regions and highlight the importance of regional context and institutional factors in assessing public sector performance, offering insights into the diversity of public sector performance across emerging countries. Furthermore, Rouag and Stejskal [13] analyze the public sector performance in North African and Middle Eastern countries, using quantitative approaches to evaluate the efficiency of governmental institutions. The study identifies key factors such as political stability, public administration efficiency, and economic development as essential in evaluating the public sector’s performance in these regions. Lobonț et al. [14] have another interesting approach, conducting a factor analysis to assess the public sector’s performance in EU member states and identifying significant differences between older and newer EU members. The study focuses on economic and institutional variables that influence government performance, highlighting the challenges faced by new member states in achieving optimal performance. Moreover, Muștea et al. [15] highlight multiple approaches to measuring performance at all levels of the public sector.
Therefore, determining performance is a complex process, particularly in the public sector, as public services present a wide range of activities and services provided to citizens and enterprises, and these services are difficult to evaluate using traditional measures based on productivity and efficiency. Moreover, public services are not sold on the market, and the prices of these services are not available, making their production challenging to quantify. Although the inputs for public services can be measured in physical units or financial resources, the issue arises when defining the output, which can face difficulties due to the varied perspectives of the consumers. Thus, being a complex process, academic literature presents the undesirable consequences associated with measuring the performance of the public sector. In this regard, the notion of the “Performance Paradox” emerges. The performance paradox is a theory presented by Meyer and Gupta [16], which suggests that organizations can maintain control by not having exact knowledge about the nature of performance. It is also important to have a basic understanding of performance evaluations and certifications (the reasons for it, the measures taken, responsiveness and efficiency). The performance paradox describes the limited relationship between performance values and performance [10]. This is due to fluctuations over time, as performance values tend to decrease as a precise measure of actual performance, making it difficult to distinguish between good and poor performers. Consequently, the link between reported performance and actual performance diminishes. It is also important to note that the paradox does not refer to performance but rather performance reporting. Having fewer performance indicators makes obtaining an accurate performance report more challenging. Another factor leading to unintended performance paradoxes is the elusive nature of policy objectives [17]. The emphasis on organizational monitoring and efficiency increases the likelihood of an unintended performance paradox. The extensive use of performance indicators can lead to employees understanding which aspects of their work are significant for management, with Smith [18] labelling this measure as “fixation”.
Measuring the performance of the public sector also faces a significant obstacle due to there being insufficient input data, which leads to unrealistic results and potentially flawed public policies. Additionally, identifying the research hypotheses behind developing performance measurement indicators is an entirely different challenge and can lead to measurement errors. This approach allows for a global understanding of public sector performance across dimensions. Thus, considering the variety of approaches to measuring the public sector’s performance, the theoretical framework for this study is primarily rooted in Efficiency Theory and Institutional Theory, focusing on Digital Governance and e-government. The overall theoretical model for this research combines the Efficiency Analysis (DEA) to assess performance metrics, the Institutional Theory to understand the institutional and regulatory factors that influence digital implementation, and the Digital Governance and e-government model to frame the role of technology in public sector service delivery.

2.2. Framework for Analyzing the Performance of the Public Sector in Terms of Efficiency

Numerous studies have highlighted the importance of the performance of the public sector and the need to measure it in many EU member states. They did not just focus on the different methodologies applied to build composite indicators by exploring, testing, and providing various proxies to measure the performance in terms of the efficiency of the public sector, but also on the possible implications. However, a traditional technical approach has evaluated the performance in public services based on the concept of efficiency [7,19,20,21].
According to the scientific literature, there are three general methods for determining the efficiency of the public sector. One of the methods involves using composite indicators [22,23]. These indicators facilitate the identification of a common trend in a set of separate indicators, providing a more straightforward interpretation of the results. As a result, they are becoming increasingly recognized as valuable tools in policy-making and the public communication of countries’ performance in various areas, such as the environment, economy, society, and technological development.
Principal Component Analysis is a multivariate statistical method that involves an orthogonal linear transformation of the data into a coordinate system. The projection of the data with the greatest variance becomes the first coordinate, called the first principal component. The second greatest variance becomes the second principal component, and the subsequent principal components follow.
W ( k ) = ( W 1 ,   ,   W p ) ( k ) ( t 1 ,   ,   t m ) ( i )
t k ( i ) = x ( i )   ·   w ( k )
s u b v e r t i c a l w 1 = { Σ i w = 1 a r g   m a x t i i 2 } = { Σ i | | w | | = 1 a r g   m a x ( x i   · w ) 2 }
The equivalent matrix is:
w ( 1 ) = { | X w | 2 | | w | | = 1 a r g   m a x } = { w T X T X w | | w | | = 1 a r g   m a x }
w 1 is defined as a vector, relating to the equation:
w ( 1 ) = a r g   m a x   { w T X T X w w T w }
The principal component k is determined by removing k 1 the principal component X :
X ^ k = X s = 1 k 1 X w ( s ) w s   T
Then, the vector that removes the maximum variation of the new matrix is defined:
w ( k ) = { | X w | 2 | | w | | = 1 a r g   m a x } = arg max   { w T X ^ k T X k ^ w w T w }
Then, the principal components X T X are proportional to the covariance matrix X of the dataset, and the covariance Q between the two principal components:
Q   P C j ,   P C k ( X w j ) T · ( X w k ) = w ( j ) T X T X w ( k ) = w j T λ k w k
The covariance matrix of the initial values can be written as follows:
Q     X T X = W W T
The covariance matrix of the two principal components can be written as follows:
W T   Q W = W T W T W =
X T X   a n d   λ k = t k ( i ) 2 = ( x i   ·   w k ) 2
Therefore, evaluating the public sector’s performance involves considering the state’s key areas and main activities.
Additionally, the study by Afonso et al. [23] determines the performance of the public sector in general terms, the Public Sector Performance indicator can be determined using the following formula:
P S P i   = j = 1 n P S P i j
P S E i   = P S P i P X P i = j = 1 n P S P i j P X P i j
Afonso et al. [23] mention using specific indicators, such as economic performance, income distribution, economic stability, quality of governance, and health and education systems. Each indicator is calculated by averaging the standardized values of the sub-indicators that contribute to its definition.
Summarizing the entire spectrum of the public sector’s performance measurement through composite indicators, Lobonț et al. [14] document the importance of differentiating between parameters and indices. These performance measurement indices result from aggregating multiple weighted average parameters, allocating reciprocally relevant weights in constructing the indices. This approach allows for a comprehensive understanding of the public sector’s performance across dimensions. However, it should be noted that if these composite indicators are constructed improperly or misinterpreted, they can lead to misleading political messages or simplistic public or political decisions, or can be used abusively, for example, to support a desired policy, if the construction process is not transparent or lacks understanding of statistical or conceptual principles. Therefore, selecting indicators and weights could be the subject of political disputes or tensions. Moreover, they can hide gaps in some dimensions and can lead to a reduction in the process of identifying appropriate remedial measures if the construction process is not transparent and understood. Tracing inappropriate policies in cases where performance dimensions that are difficult to measure is ignored or not included.
Smith and Street [24] discuss the limitations of analysis in measuring public service efficiency, reminding us that qualitative assessments and contextual understanding should complement quantitative measures. The measurement of public service productivity is in a pre-paradigmatic phase. This implies testing different approaches based on the distinction between inputs, outputs, and outcomes of public services (outcome). Pestieau [25] argues for the necessity of introducing performance measurement of public services, in addition to input and output measures, which reflect both quantity and quality, and it is equally important to introduce information on the institutional environment. Therefore, the performance of public services depends not only on inputs and outcomes but also on institutional and regulatory aspects. Non-parametric methods are often preferred, as they can be applied to ordinal, nominal, or interval data. In contrast, parametric methods, such as Stochastic Frontier Analysis (SFA), Distribution-Free Analysis (DFA), and the Thick Frontier Approach (TFA), are applied to interval data with a normal Gaussian distribution, making them suitable for specific analyses and evaluations in this field.
Additionally, non-parametric methods, such as Data Envelopment Analysis (DEA) and Free Disposal Hull (FDH), are used to obtain efficiency-based scores and thus identify best practices [8]. Furthermore, Stochastic Frontier Analysis is noteworthy for evaluating the performance of the public sector [26]. Therefore, numerous parametric and non-parametric research techniques are employed to determine the level of performance in the public sector.
Frontier analysis methods are among the most sophisticated performance measurement tools that enable the investigation of complex multidimensional production processes. Frontier analysis methods can be divided into two groups: Stochastic Frontier Analysis (SFA), Distribution-Free Analysis (DFA), and the Thick Frontier Approach (TFA), and the non-parametric Data Envelopment Analysis (DEA) and Free Disposal Hull (FDH). Retaining the proposals of Mihiț et al. [27], non-parametric tests are more suitable for measuring the performance and efficiency of the public sector, given that the analyzed data will not follow a specific distribution.
Additionally, non-parametric frontier estimation methods, such as DEA, are used to measure the efficiency of a production unit in comparison to an estimated non-parametric frontier. This involves avoiding assumptions about the analytical structure of the production function and the use of production units. The model equations can be expressed as follows:
E 0 = Σ r u r y r j 0 Σ j v i x i j 0 m a x
E 0 = Σ r u r y r j 0 Σ j v i x i j 0 1
u r   0
v i   0
The variables u r   and v i   are used to indicate the significance attributed to each input and output. It is difficult, if not impossible, to establish a universal set of weights for evaluating all variables. Moreover, determining the significance for each unit involves subjectivity, as different units perceive the importance of inputs and outputs differently. Nevertheless, this method also has some disadvantages, such as subjectivity, which could lead to inaccurate efficiency assessments for some units. In contrast, when inefficiency is identified to some degree, it provides certainty about the result within the framework in which indicators favoring efficiency have been selected.
The DEA model is a multivariate non-parametric technique that constructs a frontier function through a linear approach by comparing ratios based on multiple inputs and outputs of similar units in the observed dataset [28]. At the same time, DEA benefits from the advantages similar to a production function but avoids the errors related to the specification of the form. Within the DEA model, the productivity score of any unit is calculated as the maximum ratio between weighted outputs and inputs. Thus, the condition is imposed that, for all other units in the dataset, the similar ratios must be less than or equal to one. Productivity can be obtained through the following model [29]:
M a x   h 0 = r = 1 t U r Y r j 0 i = 1 m V i X i j 0
r = 1 t U r Y r j i = 1 m V i X i j   1 ;   j = 1 ,   ,   n U r V i 0 ;   r = 1 ,   , s ; i = 1 , , m
Y r and X i j represent the quantity of outputs and inputs, while the weights are to be estimated based on all the data in the model. The model includes output variables, input variables m and n, and the total number of units. If the DMU is on the efficiency frontier (that is, it is part of the reference set), its productivity score will indicate maximum efficiency compared to the other units analyzed. Other less efficient properties selected from these data will be oriented below the efficiency frontier, and their scores will be less than 100%.
The BCC model, named after the authors Banker, Charnes, and Cooper, considers returns to scale and also includes the dimension of deviation from constant returns to scale, q q   0 . The range of variables included in this method allows for a more in-depth evaluation of performance.
The concept of returns to scale is related to the production function. Thus, if the output increases in the same proportion as all the inputs increase, we identify a constant return to scale, and an evolution of different proportions implies a variable return to scale. Input or output orientation refers to measures to improve the efficiency of units through solutions of increasing or decreasing inputs or outputs.
M a x   E K = n = 1 N U n Y j n u 0
s . t .     m = 1 n M V m X i m u 0 = 1
n = 1 N U n Y r n m = 1 M V m X r m u 0 0 U n , V m 0 ; n = 1 , , N ; m = 1 , , M ; r = 1 , , R U 0   c a n   t a k e   b o t h   n e g a t i v e   a n d   p o s i t i v e   v a l u e s e λ
Returns to scale are related to the production function. If outputs increase in the same proportion as inputs, input or output orientation implies improving the efficiency of the unit through solutions that increase or decrease the total number of inputs and/or outputs.
However, the FDH model allows for free availability to construct the production possibility set. Consequently, the frontier line for the FDH model is developed from the observed inputs and outputs that allow for free disposal. Thus, two constraints are added in the FDH model: e λ = 1 and λ j 0,1 . Performance must have zero or unit values, so that, together with e λ = 1 , only one of the actually observed performances will be chosen. Consequently, Equation (23) must be solved, followed by Equation (24).
min θ k   s . t .   θ x k X λ 0   Y λ     y k   e λ = 1 ,   λ j 0,1
max s + + s   s . t .   θ x k X λ 0   Y λ     y k   e λ = 1 ,   λ j 0,1
For the analysis of costs, revenues, and profits, we use a stochastic frontier analysis model. The Stochastic Frontier Analysis method starts from a production frontier model without the random component [30,31], as follows:
Y i t = f ( X i t ;   β ) exp v i t u i t ; i = 1 , , N ;   t = 1 , , T
Y i t is the form of production associated with time t, where X i t denotes a vector of inputs, and β represents a vector coefficient of inputs for the independent variables. v i t represents random variations in the production function. These variations can result from measurement errors, specification effects, or exogenous shocks. Another element within the disturbance term, u i t ( X 0 ) , reflects the productive inefficiency specific to a particular economic unit compared to the stochastic production function.
At the same time, the non-negative character of the disturbance term u i t indicates that production is above or below its maximum capacity. Any deterministic deviation in the stochastic production function can be attributed to factors as follows: (i) symmetric random variation f ( X i t ; β ), represented by the component v i t , and (ii) asymmetric variation or productive inefficiency. The term u i t quantifies productive inefficiency, as it measures the production deficit Y i t compared to what is suggested by its maximum frontier determined by f ( X i t exp v i t ).
Moreover, there are numerous parametric and non-parametric research methods used in the construction of performance indicators in the public sector. Since non-parametric methods apply to ordinal, nominal, or interval data, they are considered more suitable for the social sciences, while parametric methods generally apply to interval data, with a Gaussian normal distribution [32]. Furthermore, there are numerous parametric and non-parametric research methods used in the construction of performance indicators in the public sector. Since non-parametric methods apply to ordinal, nominal or interval data, they are considered more suitable for social sciences, while parametric methods generally apply to interval data, with a normal Gaussian distribution [14]. Current approaches to measuring performance in the public sector take into account the multidimensional nature of public sector performance and have abandoned the supremacy of financial indicators. However, performance measurement systems as a whole are still confusing, but because they are necessary, their construction can give rise to unintended effects, contrary to expectations, being subject to the risk that negative effects may result from the beneficial effects [33]. Unintended effects of performance measurement in the public sector can take various forms, and knowledge of these is useful in building an optimal system for managing and measuring performance.
Speklé and Verbeeten [34] emphasize the existence of multiple approaches to measuring performance at all levels of the public sector. Therefore, determining performance is a complex process, particularly in the public sector, as public services present a wide range of activities and services, provided to both citizens and enterprises, and these services are difficult to evaluate using traditional measures based on productivity and efficiency.
Considering the proposals of Mihiț et al. [27] and Muștea et al. [15], non-parametric tests are considered more suitable for measuring the performance and effectiveness of the public sector, especially when the analyzed data do not follow a specific distribution. The decision to use non-parametric tests should focus on various factors: small sample sizes; analysis of ordinal data or their performance, data classification, or higher values; using the median as an appropriate measure of central tendency instead of the mean; and variables and attributes. Therefore, the need for a robust framework for comparing countries is recognized, in terms of the quality of public policies, institutions, and decision making.

3. Data and Methodology

The main objective of this research is to identify the most efficient European region in terms of public sector digital performance by calculating the efficiency of organizational units within each region relative to best practices observed within the same group. Therefore, this study provides an overview of ways to determine the digital performance while also identifying the issues that can arise in implementing e-government. The empirical analysis involved several complementary research stages. First, to simplify the complex indicators of Worldwide Governance Indicators (Regulatory Quality, Government Effectiveness, Political Stability and Absence of Violence, and Rule of Law), the Institutional Quality Composite Index (IQI) was built.
After that, we demonstrated the relationship between five key dimensions, digital infrastructure, digital economy, digital skills, e-government, and institutional quality, using the Gaussian graphical model. This was followed by a non-parametric approach employing Data Envelopment Analysis. The final stage represented the digital performance of the public sector by applying vector quantization through hierarchical clustering. This allowed for the grouping of EU regions based on the efficiency of implementing digital technology in public service delivery. Consequently, three different research methods were used to classify EU member states in terms of their digital efficiency, as follows:
(a) Principal Component Analysis (PCA) is a statistical technique used to reduce the dimensionality of a large dataset, transforming a set of correlated variables into a smaller number of uncorrelated variables, called principal components. PCA identifies the directions in which the data variation is maximized. Composite indicators of institutional quality for European countries between 2017 and 2022 reflect their performance and evolution in terms of governance and stability. Positive values above 1 suggest stronger and more efficient institutional quality, while negative values around −1 indicate challenges and deficiencies. A composite indicator is constituted based on a set of relative indicators, grouped by domains, capable of providing a relative, comparative view of the performance level of research units. Thus, the following steps can be individualized [35]: (i) defining the phenomenon to be measured; (ii) selecting a group of individual indicators; (iii) normalizing the individual indicators; and (iv) aggregating the normalized indicators. The use of composite indicators facilitates the identification of a common trend in a set of separate indicators, providing an easier interpretation of the results. As a result, they are becoming increasingly recognized as useful tools in policy-making and in the public communication of countries’ performance in various fields.
(b) Gaussian Graphical Models evaluate the global interconnections between various factors that influence digital performance in the EU. To capture the complex interplay between digital infrastructure, digital economy, digital skills, and the institutional quality index affecting digital performance (e-government), we employ two complementary graphical modelling approaches: Gaussian graphical models. GGMs are efficient at revealing conditional dependencies among continuous variables.
(c) Data Envelopment Analysis (DEA)—to identify the most efficient European region in terms of the digital performance of the public sector, we calculated the efficiency of an organizational unit within a group, in relation to the best practices observed within the same group, through Data Envelopment Analysis (DEA). Additionally, the DEA method assesses the efficiency of similar entities that use multiple resources to produce multiple results on a production frontier that represents the optimal level of performance or efficiency. It should be noted that this methodology has some limitations, as DEA does not refer to a universally accepted set of best practices when determining efficient units and efficiency measures. Additionally, it presents large differences in results depending on the assignment of the quality of the input/output variables.
Within this analysis based on the DEA method, eleven indicators were selected (11 input indicators and 3 output indicators) that can highlight the disparities among the member states of the European Union from the perspective of digital progress. To initiate this DEA-based analysis, the following steps are necessary: selection of input and output variables, and efficiency analysis. It is also important that the inputs and outputs are correlated with the number of decision-making units. A generally valid rule assumes that the sum of the number of inputs and outputs should be less than or equal to 1/3 or 1/11 of the total number of DMUs. The correct selection of input and output units is essential in using the DEA method. We will further apply the DEA method at the level of the European Union. In order to obtain an optimal predictive model, we have reduced the total number of inputs to 11 and 3 outputs. The 3 units related to the e-governance dimension represent the output units. Selecting input and output variables for Data Envelopment Analysis (DEA) models involves a complex approach. Based on the literature, Data Envelopment Analysis is used in e-government research to assess efficiency and performance. Studies employ DEA to: evaluate the technical efficiency of public libraries using technology-based outputs [36]; and assess the levels of digital society and e-government in different countries [37]. Krejnus et al. [38] reveal that DEA has been used in the context of digital transformation to evaluate the levels of digital society and e-government in different countries. Hsieh et al. [39] evaluate the performance of government web portals, considering factors like information, interaction, and transaction capabilities as outputs, and organizational and institutional factors as inputs.
The selection of indicators along with the application of models oriented towards either inputs or outputs also enables the grouping of countries into distinct subregions. Furthermore, the analysis based on the DEA method allows for the evaluation of the level of digitalization for each country, as well as the division of countries into efficient regions to compare efficiency scores. The application of the CRS and VRS models allows for the evaluation of e-governance performance in the EU. The fundamental purpose of this analysis is to evaluate the efficiency of decision-making units (DMUs) by analyzing the inputs to generate one or more outputs. The formula for calculating the efficiency of decision-making units with a single input and a single output is defined by the following relationship (26) and (27):
E f f i c i e n c y = o u t p u t i n p u t
For multiple inputs and outputs, the following relationship will be used:
R e l a t i v e   e f f i c i e n c y   s c o r e = w e i g h t e d   s u m   o f   o u t p u t s w e i g h t e d   s u m   o f   i n p u t s
The BCC model is:
E 0 = r u r y r j 0 + q 0 m a x i v i x i j 0 = 1 i v i x i j 0 + r u r y r j 0 + q 0 0
Scale returns are associated with each type of data envelopment surface determined by each DMU, decision-making unit, which corresponds to the efficiency frontier. Units that are on this surface are considered efficient, while those that do not fit within this surface are considered inefficient. The following steps are considered to transform inefficient decision-making units into efficient units: reducing inputs while at the same time keeping outputs constant (input-oriented analysis), increasing outputs while inputs remain constant (output-oriented analysis), or increasing outputs while reducing inputs (the dual version). It is important to note that input-oriented measurement is equivalent to output-oriented measurement of technical efficiency (TE) only in the case of constant returns to scale (CRS). For a more comprehensive analysis of efficiency, multiple DEA methods are recommended. In this context, the CRS and VRS models oriented towards maximizing outputs will be used to determine the efficiency of the e-governance process in the European Union member states, considered homogeneous decision-making units.
(d) The statistical analysis focused on disparities, using the R software, will apply the cluster and hierarchical clustering techniques to partition the EU-27 countries into homogeneous groups. Group analysis is a statistical data processing method, a quantitative form of grouping data into categories based on their specific differences and similarities. It includes many different algorithms and methods for clustering data and creating data groups. Thus, the cluster dendrogram was applied to determine the impact of digital technology integration on e-government and to measure the efficiency of public services by the effects of various digitalization and e-government indicators in the European Union member states.
Consistent with the methodologies utilized in prior studies by Noja et al. [40], Bartolacci et al. [41], and Bánhidi and Dobos [42], the present investigation incorporated comparable metrics and associated methodological specifications. To achieve our overarching objective and in alignment with the established methodological procedures, we have formulated the following two hypotheses (H) for testing:
H1: 
There is a positive association between the level of public sector digitization and the efficiency of public service delivery in the member states of the European Union.
H2: 
EU member states with a higher level of digital technology adoption and digital skills among the population achieve superior performance in implementing and utilizing e-government services.
E-governance is a multifaceted phenomenon that encompasses various interconnected dimensions that influence the entire governance process. This research evaluates the efficiency of the European Union regions in terms of the progress of the digitalization of public services. Therefore, rather than attributing e-governance to a single dimension, viewing it as a multifaceted process where these dimensions are interconnected and influence each other is more accurate.
To achieve the study’s overall objective, we compiled a dataset based on the relevant literature. For the methodological operationalization, the variables retained for analysis were grouped into dimensions. Data were extracted for the years 2017 and 2022 for all European Union member states (EU-27), from established databases such as Eurostat, the European Commission, and the World Bank. Consequently, the analysis is not limited only to digitalization indicators: we also included the institutional quality component to capture the multifaceted aspects of public sector performance, as shown in Table 1.
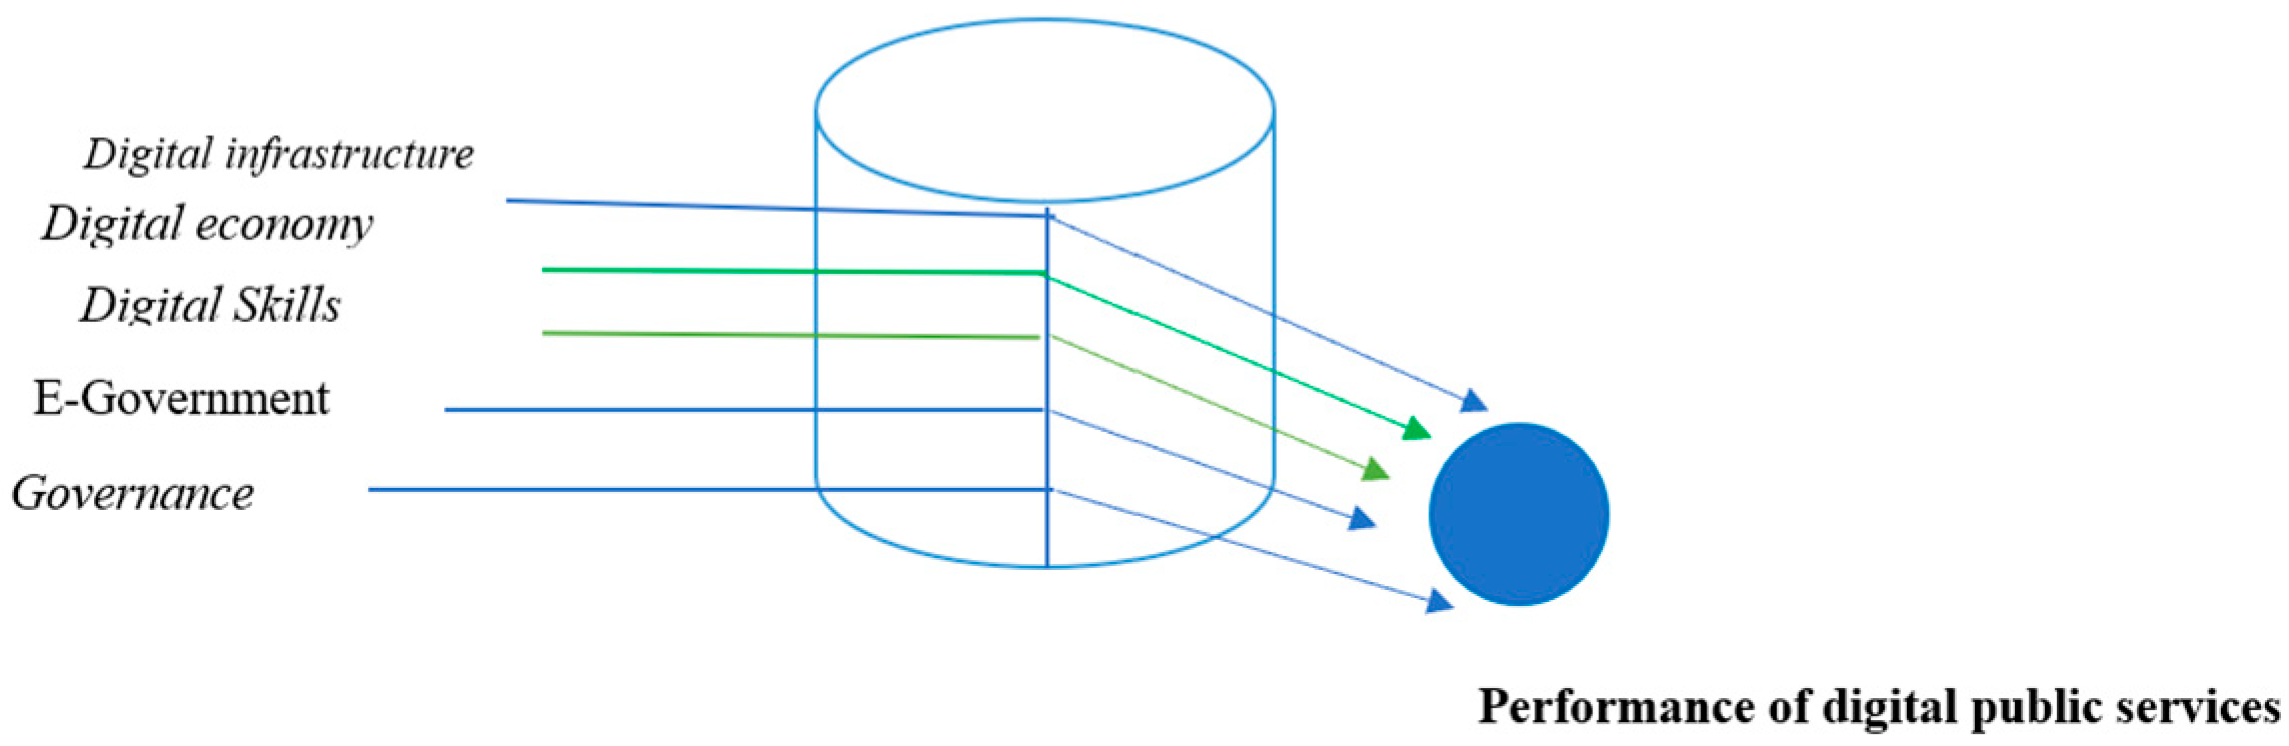
The indicators in our dataset reflect various aspects of the relationship between two main dimensions: digital efficiency and public service delivery and governance in the EU. The digital efficiency and public service delivery dimension has been divided into four sub-dimensions: Digital Infrastructure, Digital Economy, Digital Skills, and e-government. Additionally, the governance dimension has been incorporated as a related sub-dimension based on a composite Institutional Quality Index, as illustrated in Figure 2.
The first dimension, A. Digital Efficiency and Public Service Delivery, is grouped into these following sub-dimensions: I. Digital infrastructure: (i) Infrastructure and Access: World Bank—Fixed broadband subscriptions; Eurostat—Level of Internet Access (% of households); (ii) Usage and Adoption: World Bank—Individuals using the Internet (% of population); (iii) Integration of Technology: Digital Economy and Society Index—Integration of Digital Technology (weighted score: 0 to 100); Connectivity (weighted score: 0 to 100); World Bank—Communication (% of service imports); II. Digital Economy: World Bank—High-tech Exports (% of manufactured exports); Eurostat—ICT Service Exports (current USD); III. Digital Skills (Social Digital): i) Skills and Education: Digital Economy and Society Index—Human Capital (weighted score: 0 to 100), Advanced Skills and Development (weighted score: 0 to 100); IV. e-government: Digital Economy and Society Index- e-Government Users-Open Data (% of people who have used the Internet in the last 12 months), Digital Public Services—e-Government (weighted score: 0 to 100), Index of the Digital Economy and Society—e-Government Users (weighted score: 0 to 100). The second dimension, B. Governance, is grouped into the sub-dimension V. Institutional quality: World Bank—Regulatory Quality (score); Government Effectiveness (score); Political Stability and Absence of Violence; Rule of Law (score).

4. Results

In the empirical analysis, we have focused on the segmentation of the European Union regions based on digital performance, providing a new perspective on the role of digitization and its effects on the operationalization of public services.
To test hypothesis H1, we first constructed our own composite indicators of institutional quality for European countries, using Principal Component Analysis for two separate time periods, 2017 and 2022, based on four governance indicators (Regulatory Quality, Government Effectiveness, Political Stability and Absence of Violence, Rule of Law). These new indicators reflect the country’s performance and evolution in terms of institutional quality. Positive values above 1 suggest stronger and more efficient institutional quality, while negative values around −1 indicate challenges and deficiencies.
After that, we constructed Gaussian graphical models (GGMs). The Gaussian graphical models were analyzed based on partial correlation, extended Bayesian information criteria/contraction operator, and absolute minimal contraction selection for 2017 and 2022. Each indicator in the configured network represents an interconnected node linked to other nodes, reflecting their interdependence. The estimates were performed using partial correlation estimation and the Bayesian EBIC information criterion-based method.
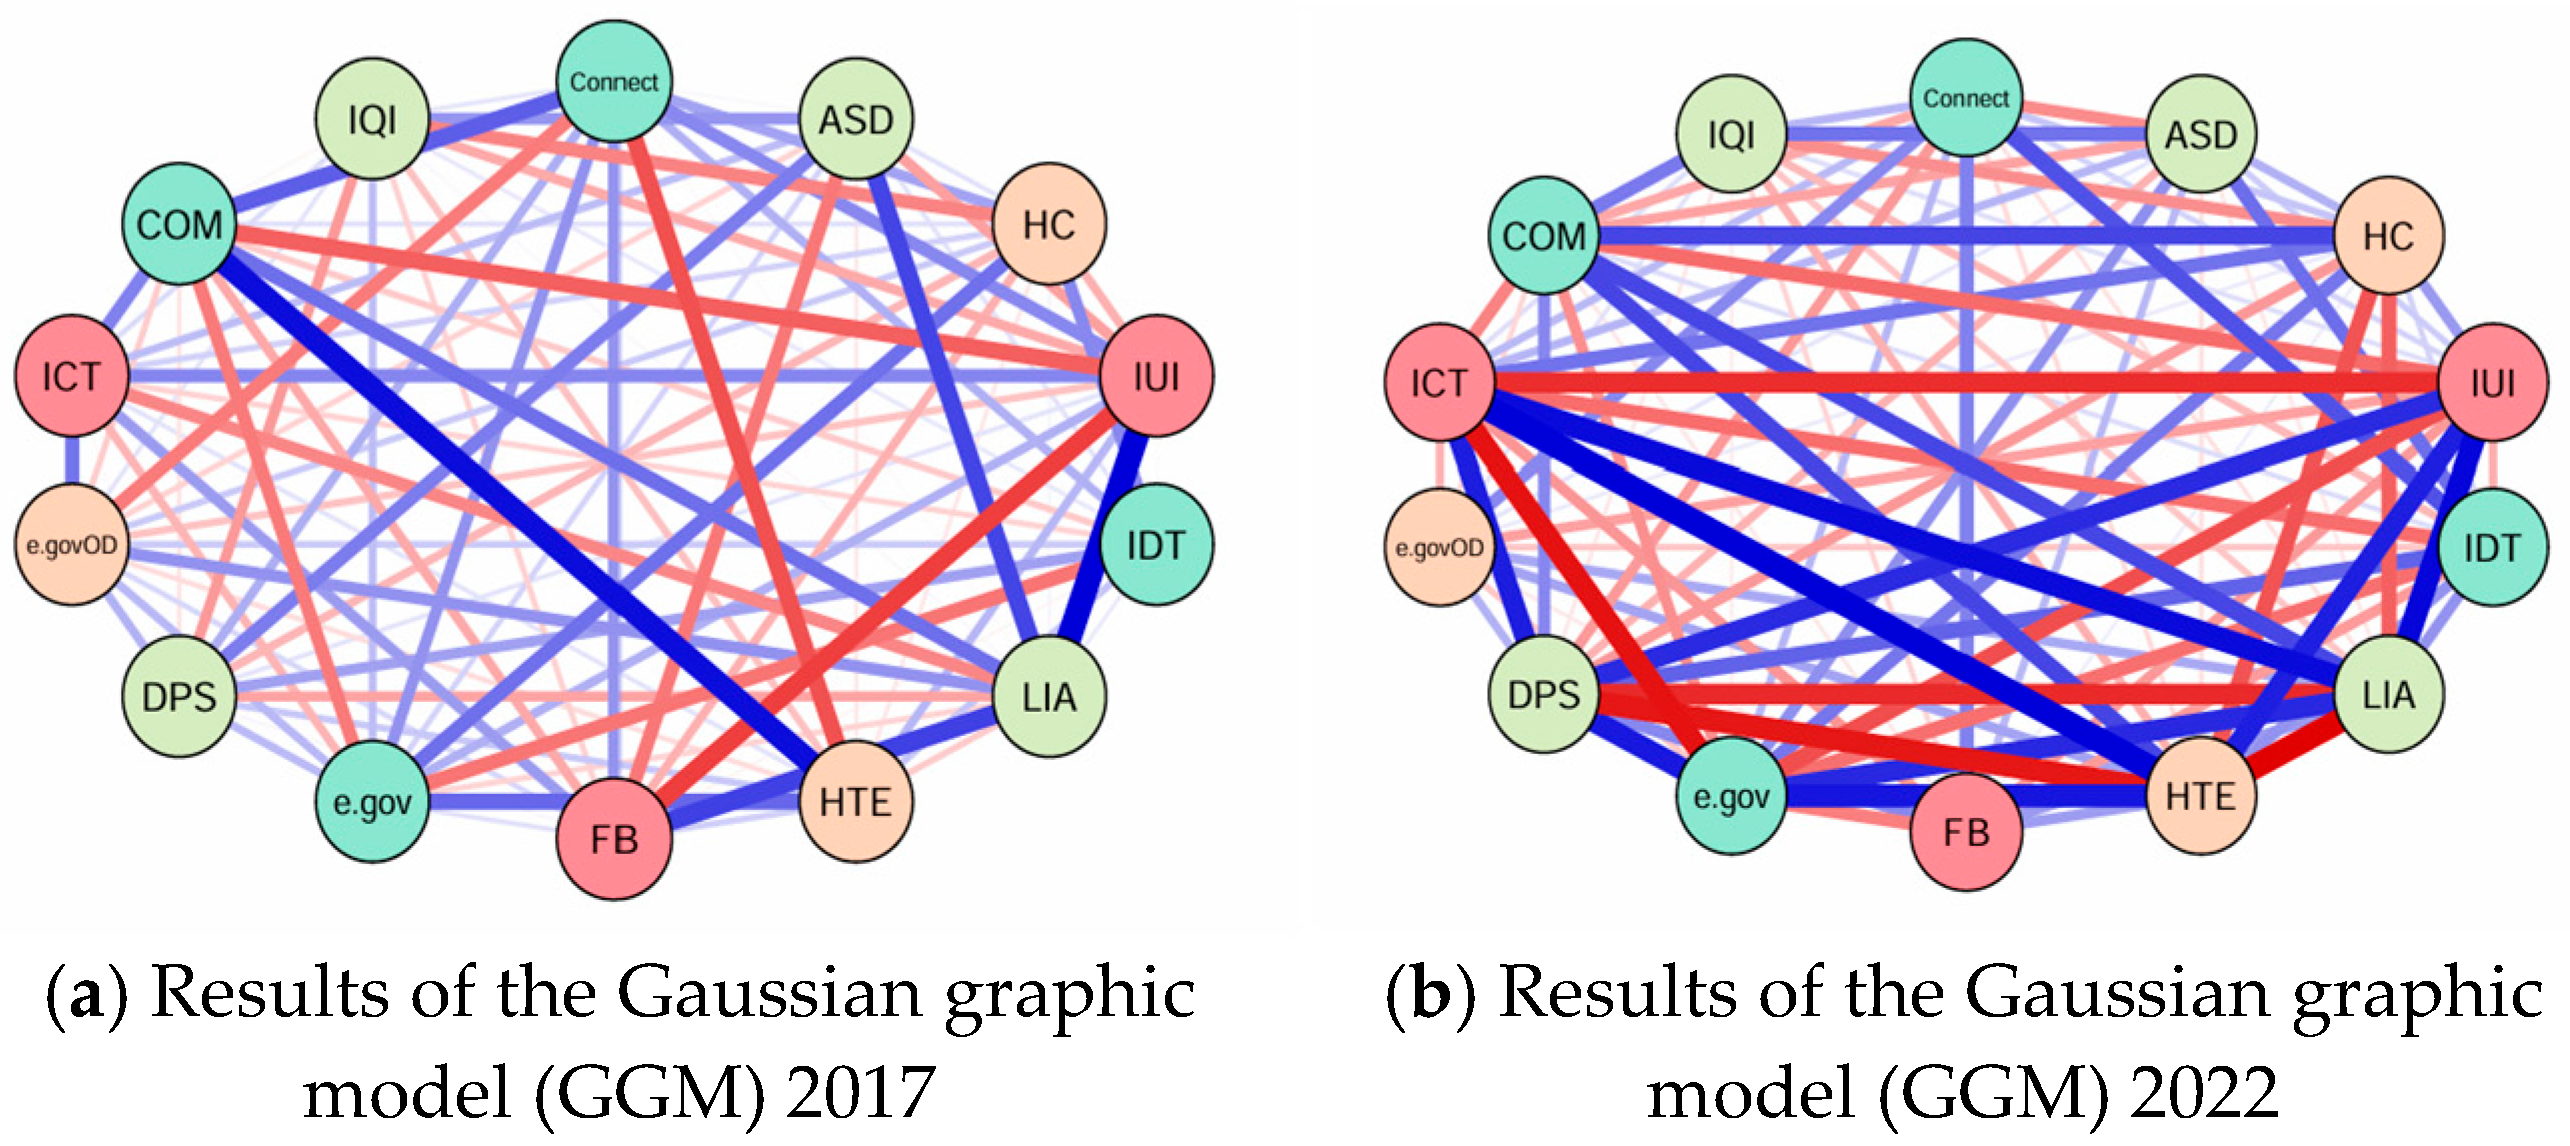
In the 2017 Gaussian graphic model (Table 2), shown in Figure 3a, stronger links capture various associations related to digital infrastructure, digital economy, digital skills, and e-government and governance. The GGM network includes 14 variables/nodes and links or edges between each pair, thus distinguished, differentiated nodes: ASD, COM, Connect, IQI, DPS, e.gov, FB, HTE, IUI, IDT, LIA, HC, ICT, e.govOD. And the connection between the edges for each pair of vertices is determined by a connection. The blue color indicates positive associations, while the red color indicates negative associations, and the thickness of the edge reflects the strength of the bond.
The strongest positive associations are as follows (intense blue): communication (COM) and Fixed Broadband Subscription (FB); communication (COM) and Institutional Quality Index (IQI); Connectivity (Connect) and Digital Public Services (DPS); Digital Public Services (DPS) and e-Government Users (e.gov); and Human Capital (HC) and ICT service exports (ICT). The strongest negative associations are as follows (intense red): Individuals using the Internet (IUI) and Level of Internet Access (LIA); Integration of Digital Technology (IDT) and High-Technology Exports (THE); Fixed Broadband Subscription (FB) and High-Technology Exports (THE); e-Government Users-Open Data (e.govOD) and ICT service exports (ICT); and Individuals using the Internet (IUI) and Communication (COM).
The Gaussian graphical model for 2022 (Table 3), shown in Figure 3b, highlights the significant interconnections between all variables, with 14 nodes connected to each other (ASD, COM, Connect, DPS, FB, HTE, HC, ICT, IDT, IUI, IQI, LIA, e.gov and e.govOD), Each node has exactly 13 connections, indicating a symmetric distribution of the links. The Gaussian graphical model implies very strong interconnections between the variables/nodes considered in this research, as reflected by the width/thickness of the links. The maximum interdependence between the variables is 1, measured by the average distance between two variables. Advanced Skills and Development (ASD) is negatively associated with COM (communication). It also has a partially positive correlation with fixed broadband (FB) and people who use the internet (IUI). Communication (COM) shows relatively negative associations with connectivity (Connect) but a positive relation with the Institutional Quality Index (IQI). Meanwhile, connectivity (Connect) is positively related to high-technology exports HTE). ICT specialists are negatively associated with e-government (e.gov), but human capital (HC) along with e-government and e-government online delivery (e.govOD) present a positive relationship. Information and Communications Technology (IDT) and Level of Internet Access (LIA) are positive associations. There are significant overall implications of the dimensions of digitalization and innovation on e-governance in the EU-27 countries. There are significant overall implications of the dimensions of digital efficiency and public service delivery and governance: digital infrastructure, digital economy, digital skills, e-government, and governance: institutional quality in the EU-27 countries.
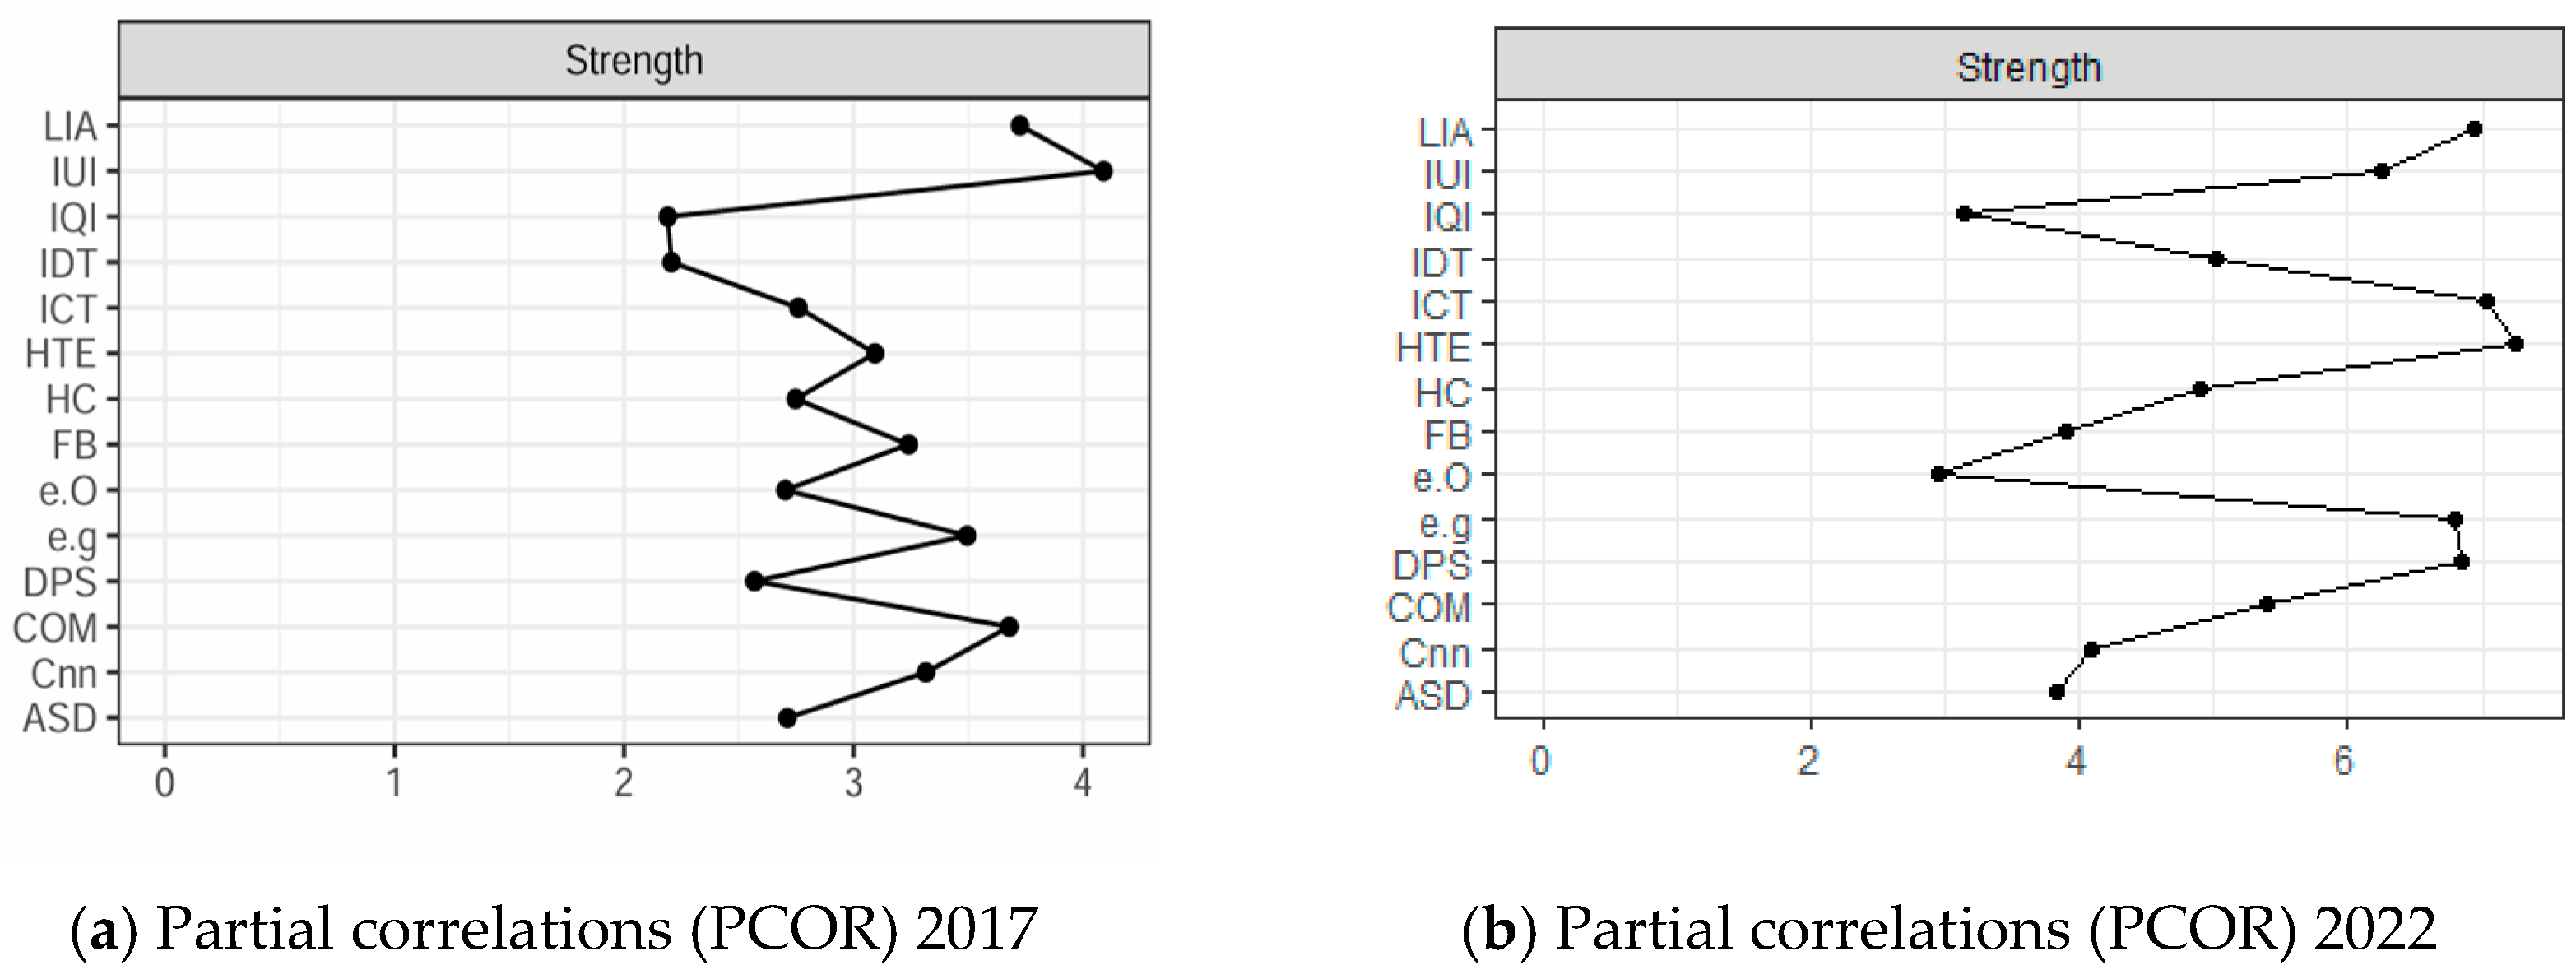
Furthermore, we investigated centrality indicators to better understand how the variables influence the behavior of the estimated networks. Additionally, we explored and compared the resulting models to understand their differences and similarities, thus providing a deeper perspective on the structure and relationships within the GGM networks.
According to the analysis of the centrality index, Figure 4, digital intensity (IDT) and our composite Institutional Quality Index (IQI) are the central powers in the network of interactions between the analyzed variables. This suggests that the quality of regulation plays a crucial role within the integration of digitalization. Additionally, the results indicate that advanced skill development has a lesser influence in this network. These findings highlight the significant implications of the diverse aspects of digitalization and innovation within the e-government landscape across the EU-27 member states. Such insights suggest that enhancing digital capabilities and fostering innovative practices can improve public service delivery and economic performance. Based on these results, hypothesis H1 is validated, namely “There is a positive association between the level of digitalization in the public sector and the efficiency of public service delivery in the European Union member states”.
The findings align with those of Criste et al. [43] and Crăciun et al. [44], highlighting that digital technology is generally considered a relative, but not definitive, solution for reducing pressure and improving the performance of the public sector. While digitalization involves a series of advantages, such as streamlining processes and improving the delivery of public services, some limitations must be considered to ensure the efficiency of public service delivery among taxpayers.
For the second research hypothesis (H2), the EU member states with a higher level of digitalization will achieve superior performance in the implementation and use of e-government services; we used DEA, which performs a relative efficiency assessment by relating inputs to outputs for each decision-making unit (DMU), to measure their efficiency compared to the other decision-making units. To select the most relevant input and output variables, we first applied correlation analysis (Appendix A). This allowed us to detect multicollinearity and provided a statistical basis for using DEA. By detailing the relationships between variables, we ensured the robustness of the DEA model, an analysis that validated its applicability.
The basic models of the DEA methodology are the CRR input-oriented and output-oriented model, the input-oriented and output-oriented BCC model, and the SBM model. However, the present research focuses on constant (CRS) and variable returns to scale (VRS) for minimizing inputs and maximizing outputs. DEA models are based on the set of admissible possibilities, represented by all possible combinations of inputs and outputs, and are also limited by the efficiency frontier. Efficient units are those units that have input and output combinations located on the efficiency frontier. These efficiency frontiers are characteristic of both the CRS and VRS models.
Table 4 and Table 5 present the results of the CRS and VRS models. The efficiency of the EU regions was calculated using the DEAFrontier software program.
Therefore, based on the DEA analysis, the efficiency value for 2022 was also calculated (Table 4), and the European Union countries were grouped into two regions based on efficiency: increasing, constant, decreasing. No country is integrated into the first efficiency region (increasing). The analysis conducted for 2022 does not reveal any countries exhibiting increasing returns to scale. While the Data Envelopment Analysis method assesses relative efficiency based on the input and output variables considered, the overall socio-economic landscape of the European Union during this period must be taken into account. Region II (with constant returns) includes Austria, Belgium, Bulgaria, Croatia, Cyprus, the Czech Republic, Denmark, Estonia, Finland, France, Greece, Hungary, Ireland, Italy, Lithuania, Latvia, Luxembourg, Malta, Poland, Portugal, Romania, Slovenia, Slovakia, and Spain. Region III includes three countries Germany, the Netherlands, and Sweden (decreasing). The DEA analysis revealed efficiency differences in the provision of digital public services among EU member states. Many countries have maintained their efficiency, while others have room for improvement. Developed nations demonstrate higher efficiency in digital public service delivery than less developed European Union member states.
In 2017 (Table 5), the member states of the European Union were divided into four distinct regions based on efficiency. The efficient states belong to Region I (increasing) include Germany and the Czech Republic, Region II (constant) includes Austria, Bulgaria, Croatia, Cyprus, Denmark, Estonia, Finland, France, Greece, Ireland, Italy, Latvia, Lithuania, Luxembourg, Malta, Netherlands, Poland, Portugal, Romania, Slovakia, Slovenia, and Spain, Region III (decreasing) includes Sweden, and the last region, Region IV, includes the most sub-efficient countries, Belgium and Hungary. Following the analysis, at the 2017 level there are four regions, so the analysis showed the difference between growing, steady, and decreasing profitability at scale, as well as a region with the most sub-efficient countries, so this analysis offers a new way of understanding digital efficiency across the EU.
Many countries, especially those in Region II, exhibit consistent efficiency scores in input-oriented and output-oriented models and VRS and CRS assumptions. This suggests that these countries achieved optimal performance in providing digital public services in 2022. Regarding the potential for improvement through scale expansion, Germany, the Netherlands, and Sweden recorded efficiency scores of less than 1, indicating the potential for improvement through scale adjustments. At the same time, a significant number of countries positioned in Region II maintained their efficiency scores, suggesting a high level of performance in the provision of digital public services.
In 2017, most countries demonstrated efficiency in both Constant Returns to Scale and Variable Returns to Scale, regardless of whether the orientation was input- or output-oriented. This suggests a generally high-efficiency level across the entire EU in 2017. While many countries have maintained efficiency for 2022 as well, there has been a decline in the number of countries considered efficient, particularly at the CRS level. Several countries exhibit a different RTS, indicating potential inefficiencies related to the scale of operations. Therefore, many countries have recorded significant changes in RTS between 2017 and 2022. For example, Germany, the Netherlands, and Sweden have transitioned from CRS in 2017 to Decreasing Returns to Scale in 2022. This implies that these countries may have exceeded the optimal scale for digital public services. On the other hand, Hungary and Belgium have optimized their Increasing Returns to Scale, suggesting efficiency in the operationalization of their digitalization initiatives.
Region II consistently encompasses the most significant number of efficient countries in both 2017 and 2022. However, the observed changes in efficiency and RTS in this region highlight the importance of examining each country’s performance individually rather than relying solely on regional classifications. Countries such as France, Bulgaria, Croatia, Cyprus, Estonia, Finland, France, Greece, Hungary, Ireland, Italy, Latvia, Lithuania, Luxembourg, Malta, the Netherlands, Poland, Portugal, Romania, and Slovenia maintained constant returns to scale and optimal efficiency in both years. At the same time, the Czech Republic, Germany, and Sweden present potential for improvement through the expansion of their digitalization efforts.
In the context of the COVID-19 pandemic, the public system has recorded new discrepancies at the level of European countries. These were caused, on the one hand, by the dynamic changes in digital technology, its adoption and integration, and the various software required to provide digital public services [45]. On the other hand, these discrepancies between EU countries were contributed to by the limited digital skills of professionals and the population, as well as the lack of knowledge, the low credibility of the information transmitted, and the low level of digital literacy [46,47]. In this situation, the role of the European Union has become even more crucial in providing policies, strategies, and financial support to address the gaps between the member states, ensuring the uniform development of the digital public administration sector [
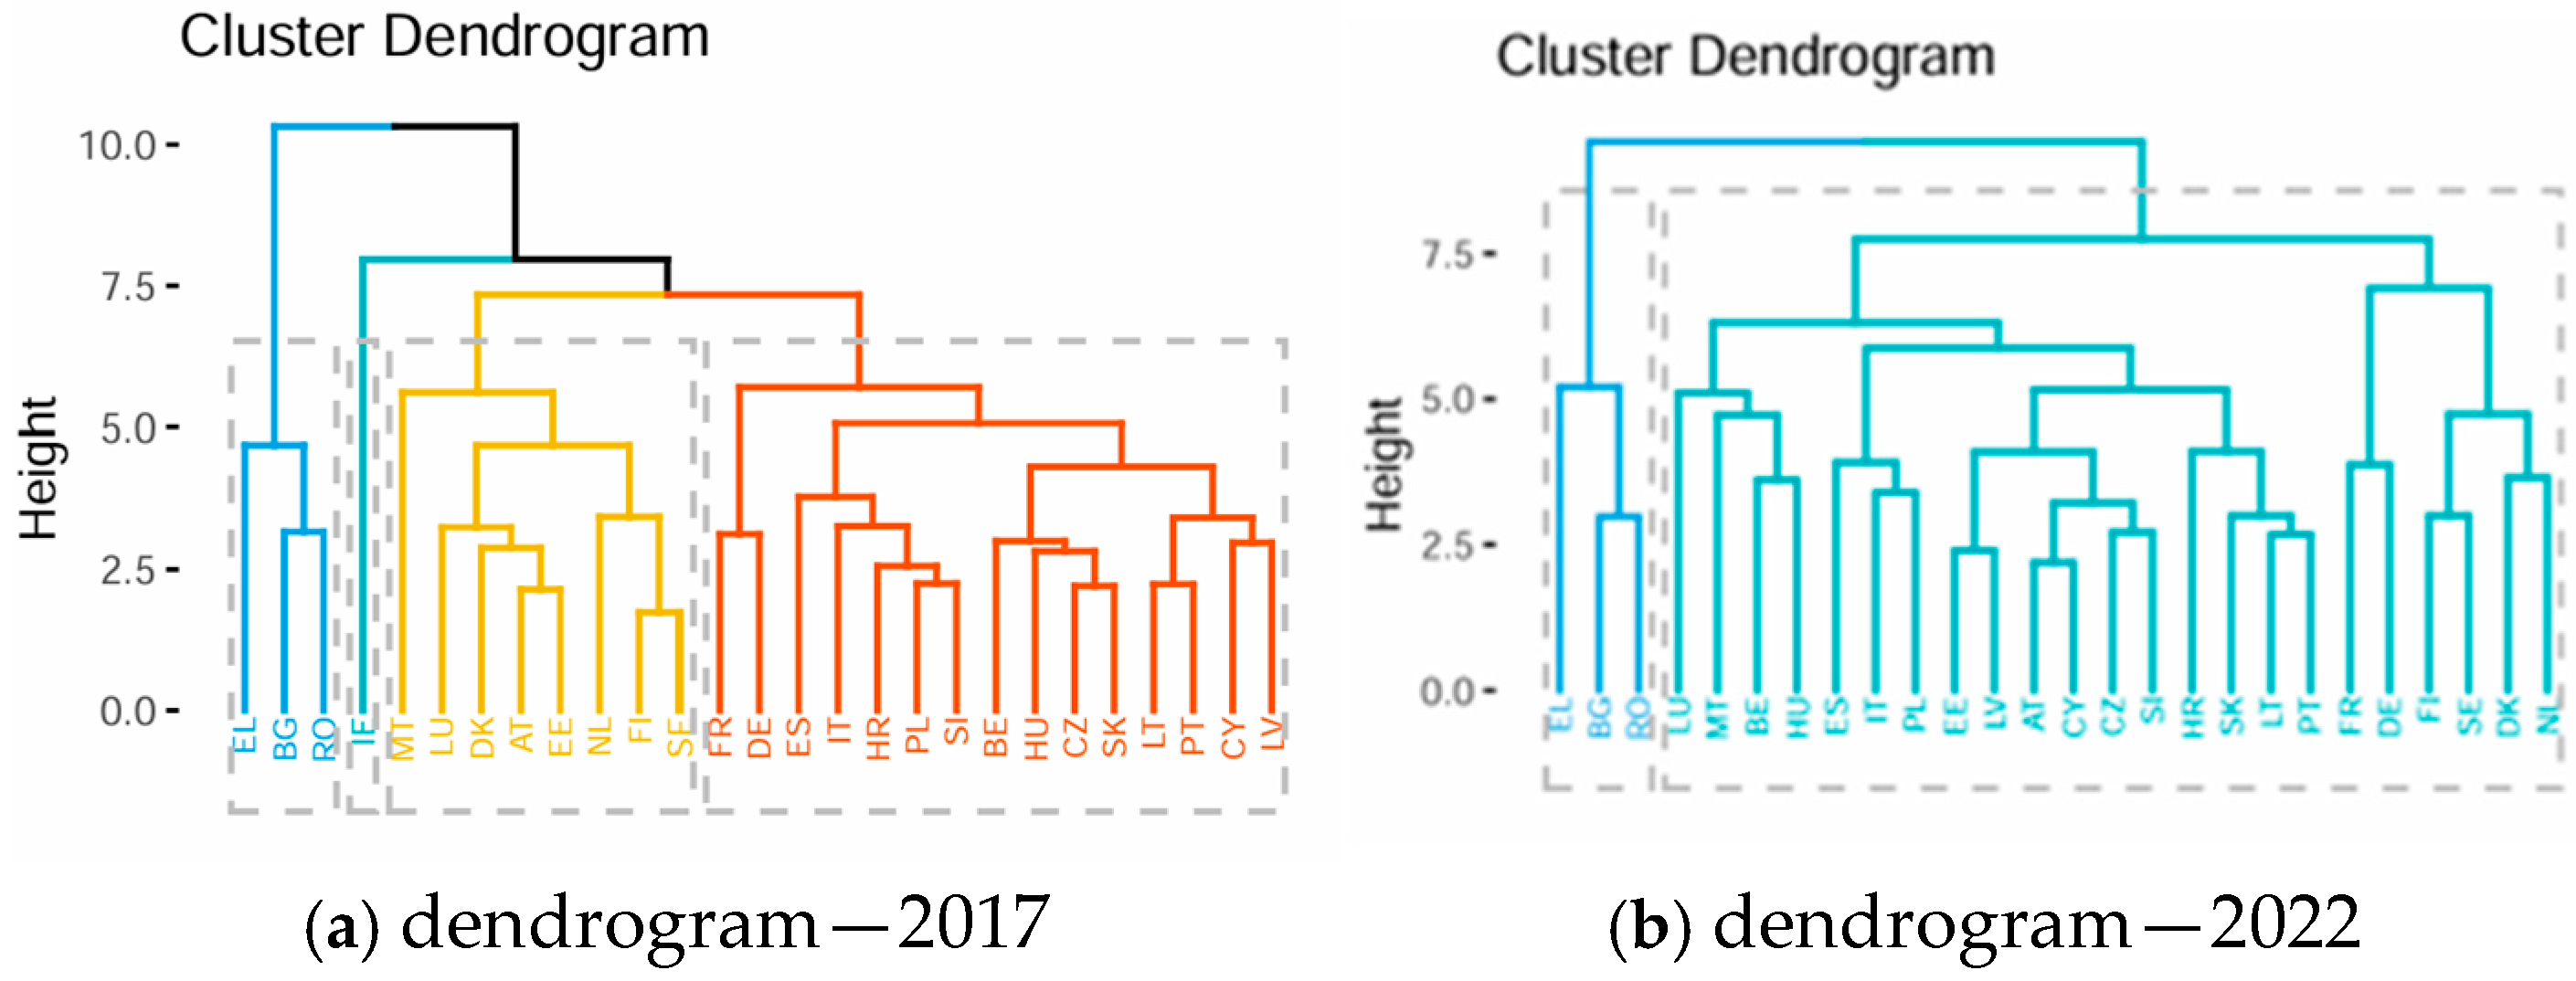
48]. Continuing the analysis, the final part includes the dendrogram along with the results of the estimates. These new research settings have allowed us to observe the impact of digital integration on e-government and measure public service efficiency by illustrating how different digitalization and e-government indicators affect EU member states and re-evaluating our final hypothesis (H2). This method groups similar countries based on their digital performance indicators, creating a tree-like structure where the proximity of branches reflects the similarity between countries.
A dendrogram is used to determine the hierarchical relationships between countries and clusters. The height indicates the order in which the clusters were merged. The lowest height indicates the strongest link, i.e., the closest similarity between countries, while the highest height indicates the most distinct values. The dendrograms in Figure 5 use a scale from 0 to 8 to establish the link height. We can observe the most similar countries in terms of public sector performance level in the 2017 (Figure 5a) dendrogram. The blue cluster includes Romania, Bulgaria, and Greece. The yellow cluster exhibits a medium level of similarity and intermediate performance, encompassing countries such as Malta, Luxembourg, Denmark, Austria, Estonia, the Netherlands, Finland, and Sweden; the red cluster includes France, Germany, Spain, Italy, Hungary, Poland, Slovenia, Belgium, Croatia, Czechia, Slovakia, Latvia, Portugal, and Cyprus. The most performant countries in 2017 are those in the red cluster, while the least performant countries are included in the blue cluster.
Regarding the countries with similar levels of public sector performance for 2022 (Figure 5b), we identify two clusters: in the green cluster—France, Germany, Austria, Cyprus, Czechia, Slovenia, and Italy, Estonia and Malta, Cyprus and Greece, Poland and Hungary, Spain, Denmark, Netherlands, Finland, Sweden, Belgium, Hungary, Slovakia, Estonia, Latvia, Luxembourg, Malta, Greece, Hungary, Lithuania, and Portugal; and in the blue cluster—Greece, Bulgaria, and Romania.
The analysis reveals the highest performance levels are in developed countries with stable public administration [49,50,51]. In contrast, the lowest values are observed in developing countries characterized by instability in their state institutions. Therefore, the result underscores the importance of stable governance and robust public administration, which decision makers should firmly consider when evaluating and implementing policy measures that impact citizens [52,53].
The present country’s clustering analysis using the dendrogram reveals significant differences in the digital performance of the public sector. The trends in digitizing public services in recent years show a steady improvement, which can be attributed to the strategies and measures imposed by the European Union, such as the digital governance framework, structural reforms, and technical support [54]. These initiatives can contribute to efficiently allocating public funds and improving services offered to citizens [55]. At the same time, the European Union continuously encourages and supports member states in their efforts to strengthen this critical sector, which is essential for the proper functioning of society [56,57]. Thus, the recently EU-acceded countries such as Romania, Bulgaria, Croatia, and Slovakia have a public sector performance level that is close but far from the performance level of countries such as Denmark, Sweden, and Finland, which are included in the cluster considered the most performant [58,59]. The most performant countries at the level of 2022 are those in the red cluster, while the least performant countries are included in the blue cluster.
According to the objective of the group analysis, the countries included in the same group have similar levels of digital performance. The countries included on the same line of the dendrogram are the countries closest in the value of the indicators. Based on these results, our hypothesis 2, H2, is validated. Comparing the hierarchical clustering results for both years would provide additional insights into how countries are grouped based on digital performance and how these groupings evolve. This can help identify best practice benchmarks and inform policy recommendations.
Based on the dendrogram, we can assert that there is significant diversity in the digital performance of the public sector among EU member states. However, recent trends suggest a steady improvement in digital technology. This can be attributed to measures imposed by the EU, such as the economic governance framework, administrative reform, promotion of transparency and accountability, and social initiatives like the development of digital skills and literacy programs, as well as the exchange of best practices among member states [60]. These initiatives have contributed to increased efficiency and accountability in managing public funds and enhancing public services offered to citizens. The EU continues to encourage and support member states in their efforts to improve this vital sector for the proper functioning of society, aligning these efforts with the Sustainable Development Goals (SDGs), particularly Goal 9 (Industry, Innovation and Infrastructure) and Goal 16 (Peace, Justice and Strong Institutions). By promoting robust digital public services and strengthening institutional capacities, the EU directly contributes to the development of a resilient and inclusive infrastructure, each of which are considered essential aspects for sustainable development. The exchange of best practices between EU member states supports international collaboration and mutual exchange of knowledge, necessary for implementing SDGs on a large scale. This collaboration is necessary to identify best practice models required for disseminating effective strategies and specifically contributes significantly to accelerating progress towards sustainable development while reinforcing the digital and institutional pillars emphasized by Goals 9 and 16.
This study also highlights the transformative potential of digitalization in improving the performance of the public sector in the European Union by examining the interaction between e-government, digital infrastructure, the digital skills of the population, and various factors influencing the efficiency of public service delivery. Therefore, the research provides a comprehensive understanding of the challenges and opportunities associated with this complex process.
Although the findings prioritize the importance of multiple approaches to e-governance, which could integrate through the prism of its complex processes a wide range of determinants to reflect the current reality of the issue of public service delivery, the emphasis on digitalization in the provision of public services also directly contributes to the achievement of the Sustainable Development Goals. The correlation between the digital performance of the public sector in the EU and the SDGs, especially those related to innovation, governance, and quality public services, collectively favor stronger institutions and better governance. Moreover, the digitalization of processes can enhance the efficiency of the public sector, contributing to a stable economic environment through optimizing resource allocation and reducing administrative burden.

5. Conclusions

This study examined the digital performance of European Union regions, offering a perspective on the digitalization process and its effects on the European public system, with emphasis on opportunities and challenges in adopting digital technologies in public service delivery. Unlike studies focusing on specific aspects of public sector performance, this research integrates a broader range of determinants, providing a nuanced understanding of the multifaceted nature of e-governance.
The theoretical foundation of the current knowledge in this field has facilitated the identification of key instruments for analyzing public sector performance. Furthermore, the most significant methods and techniques for measuring public sector performance have been identified. Relevant studies highlight non-parametric and parametric analysis methods. Consequently, various indices for measuring performance and efficiency are based on opportunity indicators. Composite indicators are among the most widely used instruments in these types of analyses. The preference for composite indicators can be attributed to their multi-complex nature, which allows for a comprehensive analysis of public sector performance that extends beyond traditional economic, social, and financial indicators. Therefore, the need to improve the methods of measuring the performance of the public sector by incorporating new sub-sectors, such as digitalization and innovation, is evident.
Initially, this study analyzed the relationship between the public sector and digitalization within the European Union, employing Gaussian graphical models to evaluate the connections between these domains. The empirical results indicate that digitalization has both positive and negative effects on public services in the European Union. These findings provide valuable insights into the complex relationship between digitalization and e-government across the EU-27, enhancing the understanding of its multifaceted impact on public sector. The Gaussian graphical analyses effectively visualize the intricate connections between variables, indicating that recent improvements in digital infrastructure have facilitated a broader integration of digital networks within public administration. A comparison of the GGM results for EU member countries over the period 2017–2022 reveals that digitalization and e-government have directly influenced economic performance and that digitalization has a significant impact on e-government. As the centrality index analysis suggests the quality of regulations plays a crucial role in the integration of digitalization, a relationship highlighted by the strong interconnections between variables in the GGM.
In order to assess the level of digital performance of the EU regions, a Data Envelopment Analysis was performed. Ultimately, the member states of the European Union were classified based on their digital performance. The DEA results indicate that several countries, with constant efficiency, including Portugal, Lithuania, Croatia, Slovenia, the Czech Republic, Poland, Cyprus, Latvia, Slovakia, Hungary, Greece, Bulgaria, Italy, and Romania, demonstrate a need for improvements in digitalization. Furthermore, some of these nations exhibit lower investment in digital infrastructure and technology, thereby registering moderate digital efficiency. The expenditures related to digital technology are viewed as additional costs rather than a sustainable investment for the future, and these nations struggle to attract sources of funding. Conversely, countries such as Austria, Belgium, Germany, Sweden, and France could emulate best practices from highly digitalized nations to optimize their digitalization levels. The Netherlands, Finland, and Denmark emerge as the most digitally advanced within the analyzed group.
The cluster analysis, employing the K-means algorithm and Hierarchical K-means dendrogram, reveals significant diversity in public sector performance among EU regions. These trends suggest a general improvement in digital performance in recent years. While a potential factor in the increased use of digital technology may have been the COVID-19 pandemic, which prompted the integration of digital technologies, disparities remain. Specifically, Romania and Bulgaria continue to exhibit lower levels of digitization. This may relate to a perception of digital infrastructure development as a cost rather than a long-term investment.
The European Union’s policy has highlighted the importance of digital solutions. It has emphasized how digital innovations contribute to the optimal allocation of resources, obtaining a competitive advantage, and stimulating the public sector’s digital performance. However, it is necessary to evaluate the effects of digitalization, considering that not all forms of digitalization can lead to improved performance in the public sector.
This research highlights the critical role of digital infrastructure and citizens’ digital skills in the digitalization of public services. It emphasizes the need for effective analytical methods and further investigation into the unexpected negative relationships between e-government and digitalization variables in the European context.

Author Contributions

Conceptualization, O.R.L., C.C., A.I.V., A.F.C. and N.C.M.; methodology, O.R.L., C.C., A.I.V., A.F.C. and N.C.M.; software, O.R.L., C.C., A.I.V., A.F.C. and N.C.M.; validation, O.R.L., C.C., A.I.V., A.F.C. and N.C.M.; formal analysis, O.R.L., C.C., A.I.V., A.F.C. and N.C.M.; investigation, O.R.L., C.C., A.I.V., A.F.C. and N.C.M.; resources, O.R.L., C.C., A.I.V., A.F.C. and N.C.M.; data curation, O.R.L., C.C., A.I.V., A.F.C. and N.C.M.; writing—original draft preparation, O.R.L., C.C., A.I.V., A.F.C. and N.C.M.; writing—review and editing, O.R.L., C.C., A.I.V., A.F.C. and N.C.M.; visualization, O.R.L., C.C., A.I.V., A.F.C. and N.C.M.; supervision, O.R.L., C.C., A.I.V., A.F.C. and N.C.M.; project administration, O.R.L., C.C., A.I.V., A.F.C. and N.C.M.; funding acquisition, O.R.L., C.C., A.I.V., A.F.C. and N.C.M. All authors have read and agreed to the published version of the manuscript.

Funding

This work was supported by a grant from the Romanian Ministry of Research, Innovation and Digitalization, the project with the title „Economics and Policy Options for Climate Change Risk and Global Environmental Governance” (CF 193/28.11.2022, Funding Contract no. 760078/23.05.2023), within Romania’s National Recovery and Resilience Plan (PNRR/III//2022/C9/MCID/I8)—Pillar III, Component C9, Investment I8 (PNRR/2022/C9/MCID/I8)—Development of a program to attract highly specialized human resources from abroad in research, development and innovation activities.

Data Availability Statement

The dataset is available from the corresponding author upon reasonable request.

Conflicts of Interest

The authors declare no conflicts of interest.

Appendix A

Table A1. Correlations matrix for the year 2017.
ASDCOMCONNECTDPSE_GOVE_GOVODFB
ASD10.4487960.8090040.7149930.6388990.128191−0.081872
COM0.44879610.460320.2313880.070946−0.0477590.152614
CONNECT0.8090040.4603210.7590050.7478860.0038320.055129
DPS0.7149930.2313880.75900510.7724470.199099−0.03831
E_GOV0.6388990.0709460.7478860.77244710.178542−0.044608
E_GOVOD0.128191−0.0477590.0038320.1990990.17854210.297134
FB−0.0818720.1526140.055129−0.03831−0.0446080.2971341
HC0.7369890.4388490.829432−0.6993030.7298960.165904−0.025292
HTE0.203560.6309070.2151420.3138790.2478980.0573720.100163
ICT0.3062430.6283550.2801850.2190850.0821820.3079370.26262
IDT0.7353560.3780120.7760030.7208650.5570560.1721860.003035
IQI0.24942910.2494290.2494290.3780120.7353560.249429
IUI−0.229808−0.27821−0.452974−0.50301−0.421864−0.01471−0.081644
LIA0.7376890.2761820.866440.7443090.7881650.067863−0.05639
LIA0.83150.5049260.8626850.6405810.6330860.170280.16755
Table A2. Correlations matrix for the year 2017 continuation.
HCHTEICTIDTIQIIUILIA
ASD0.7369890.203560.3062430.735356−0.2298080.7376890.8315
COM0.4388490.6309070.6283550.378012−0.278210.2761820.504926
CONNECT0.8294320.215142−0.27821−0.452974−0.192606−0.278210.862685
DPS0.6993030.3138790.2761820.866440.2192850.7443090.640581
E_GOV0.7298960.2478980.5049260.862685−0.4218640.6405810.633086
E_GOVOD−0.0252920.0573720.0821820.633086−0.4218640.170280.17028
FB0.1001630.1659040.3079370.17028−0.014710.0678630.248367
HC10.3055090.26262−0.05639−0.081644−0.056390.16755
HTE0.30550910.3242990.723909−0.5065250.715730.723909
ICT0.3242990.4944260.4944260.230293−0.4420470.2483670.256583
IDT0.764410.23029310.249429−0.1926060.2192850.32732
IQI0.764410.2302930.2494291−0.3976690.6891460.724379
IUI−0.506525−0.442047−0.192606−0.3976691−0.51872−0.401963
LIA0.715730.2483670.8722370.219285−0.5187210.872237
LIA0.7239090.25658310.32732−0.4019630.8722371
Table A3. Correlations matrix for the year 2022.
ASDCOMCONNECTDPSE_GOVE_GOVODFBHCHTE
ASD10.1897220.2519190.4745480.6815840.125036−0.055440.6040440.164213
COM0.1897221−0.06110.3982450.34357−0.02087−0.023210.4411840.244437
CONNECT0.251919−0.06111−0.016720.1970970.564920.4134680.2899940.17736
DPS0.4745480.398245−0.0167210.650884−0.08919−0.120350.531865−0.09792
E_GOV0.6815840.343570.1970970.65088410.13092−0.153950.623060.39462
E_GOVOD0.125036−0.020870.56492−0.089190.1309210.316430.0602170.267813
FB−0.05544−0.023210.413468−0.12035−0.153950.316431−0.090390.186266
HC0.6040440.4411840.2899940.5318650.623060.060217−0.0903910.051193
HTE0.1642130.2444370.17736−0.097920.394620.2678130.1862660.0511931
ICT0.3111960.2994120.4139260.030540.0912340.3326260.7754560.1326170.426446
IDT0.6296770.5150810.4441950.6341570.6077730.155184−0.003480.6404990.181623
IQI−0.15624−0.11819−0.12794−0.33331−0.53318−0.02976−0.0384−0.3661−0.40957
IUI0.5538140.3493430.1568030.6478080.630537−0.00749−0.084530.3671330.190698
LIA0.5392550.5265980.2564820.5250450.5545070.1526420.0124130.3913540.176957
Table A4. Correlations matrix for the year 2022 continuation.
ICTIDTIQIIUILIA
ASD0.3111960.629677−0.156240.5538140.539255
COM0.2994120.515081−0.118190.3493430.526598
CONNECT0.4139260.444195−0.127940.1568030.256482
DPS0.030540.634157−0.333310.6478080.525045
E_GOV0.0912340.607773−0.533180.6305370.554507
E_GOVOD0.3326260.155184−0.02976−0.007490.152642
FB0.775456−0.00348−0.0384−0.084530.012413
HC0.1326170.640499−0.36610.3671330.391354
HTE0.4264460.181623−0.409570.1906980.176957
ICT10.324549−0.109440.2789640.395969
IDT0.3245491−0.379350.6436230.632706
IQI−0.10944−0.379351−0.35096−0.25538
IUI0.2789640.643623−0.3509610.810109
LIA0.3959690.632706−0.255380.8101091

References

  1. Greiling, D. Performance measurement: A remedy for increasing the efficiency of public services? Int. J. Product. Perform. Manag. 2006, 55, 448–465. [Google Scholar] [CrossRef]
  2. Djellal, F.; Gallouj, F. A model for analysing the innovation dynamic in services: The case of ‘assembled’ services. Int. J. Serv. Technol. Manag. 2008, 9, 285–304. [Google Scholar] [CrossRef]
  3. Drucker, P.F. Eficiența Factorului Decizional; Editura Destin: București, Romania, 2001. [Google Scholar]
  4. Mandl, U.; Dierx, A.; Ilzkovitz, F. The effectiveness and efficiency of public spending. Dir. Gen. Econ. Monet. Aff. Eur. Comm. Eur. Econ.-Econ. Pap. 2008, 301. [Google Scholar] [CrossRef]
  5. Profiroiu, A.; Profiroiu, M. Analysis of Public Sector Performances. Theor. Appl. Econ. 2007, 1, 41–50. [Google Scholar]
  6. Afonso, A.; Jalles, J.T.; Venâncio, A. Government spending efficiency, measurement and applications: A cross-country efficiency dataset. In Handbook on Public Sector Efficiency; Afonso, A., Jalles, J.T., Venâncio, A., Eds.; Edward Elgar Publishing Limited: Cheltenham, UK, 2023; pp. 44–71. [Google Scholar]
  7. Afonso, A.; Schuknecht, L.; Tanzi, V. Income distribution determinants and public spending efficiency. J. Econ. Inequal. 2010, 8, 367–389. [Google Scholar] [CrossRef]
  8. Carlin, J.B.; Doyle, L.W. 8: Non-parametric methods for continuous or ordered data. J. Paediatr. Child Health 2003, 39, 309–311. [Google Scholar] [CrossRef]
  9. Adam, A.; Delis, M.; Kammas, P. Public sector efficiency: Leveling the playing field between OECD countries. Public Choice 2011, 146, 163–183. [Google Scholar] [CrossRef]
  10. van Thiel, S.; Leeuw, F.L. The Performance Paradox in the Public Sector. Public Perform. Manag. Rev. 2002, 25, 267–281. [Google Scholar] [CrossRef]
  11. Afonso, A.; Fernandes, S. Measuring local government spending efficiency: Evidence for the Lisbon region. Reg. Stud. 2006, 40, 39–53. [Google Scholar] [CrossRef]
  12. Afonso, A.; Romero-Barrutieta, A.; Monsalve, E. Public Sector Efficiency: Evidence for Latin America. ISEG Econ. Work. Pap. 2013, 20. [Google Scholar] [CrossRef]
  13. Rouag, A.; Stejskal, J. Assessing the performance of the public sector in North African and Middle East countries. Int. J. Public Sect. Perform. Manag. 2017, 3, 279–296. [Google Scholar] [CrossRef]
  14. Lobonț, O.R.; Moldovan, N.C.; Bociu, A.; Chiș, C.; Brîndescu Olariu, D. A Factor Analysis of the Public Sector Performance. Significant Differences between Old and New EU Countries. Econ. Computat. Econ. Cybern. Stud. Res. 2018, 52, 139–156. [Google Scholar] [CrossRef]
  15. Muștea, L.; Mihiţ, L.D.; Lobonţ, O.R. How Should we Measure Public Sector Performance? Postmod. Open. 2021, 12, 71–89. [Google Scholar] [CrossRef] [PubMed]
  16. Meyer, M.W.; Gupta, V. The performance paradox. In Research in Organizational Behavior; Straw, B.M., Cummings, L.L., Eds.; JAI Press: Greenwich, UK, 1994; Volume 16, pp. 309–369. [Google Scholar]
  17. van Thiel, S. Trends in the Public Sector: Why Politicians Prefer Quasi-Autonomous Organizations. J. Theor. Politics 2004, 16, 175–201. [Google Scholar] [CrossRef]
  18. Smith, M. Performance Measurement & Management: A Strategic Approach to Management Accounting; SAGE Publications: London, UK, 2005. [Google Scholar]
  19. Afonso, A.; Aubyn, M.S. Non-Parametric Approaches to Education and Health Efficiency in OECD Countries. J. Appl. Econ. 2005, 8, 227–246. [Google Scholar] [CrossRef]
  20. Angelopoulos, V. The THEMIS Mission. In The THEMIS Mission; Burch, J.L., Angelopoulos, V., Eds.; Springer: New York, NY, USA, 2009; pp. 5–34. [Google Scholar]
  21. Clements, B.; Faircloth, C.; Verhoeven, M. Public Expenditure in Latin America: Trends and Key Policy Issues. IMF Work. Pap. 2007, 21. [Google Scholar] [CrossRef]
  22. Afonso, A.; Schuknecht, L.; Tanzi, V. Public sector efficiency: An international comparison. Public Choice 2005, 123, 321–347. [Google Scholar] [CrossRef]
  23. Afonso, A.; Schuknecht, L.; Tanzi, V. Public sector efficiency: Evidence for new EU member states and emerging markets. Appl. Econ. 2010, 42, 2147–2164. [Google Scholar] [CrossRef]
  24. Smith, P.C.; Street, A. Measuring the efficiency of public services: The limits of analysis. J. R. Stat. Soc. Ser. A (Stat. Soc.) 2005, 168, 401–417. [Google Scholar] [CrossRef]
  25. Pestieau, P. Assessing the Performance of the Public Sector. Ann. Public Coop. Econ. 2009, 80, 133–161. [Google Scholar] [CrossRef]
  26. Titus, M.; Vamosiu, A.; McClure, K. Are Public Master’s Institutions Cost Efficient? A Stochastic Frontier and Spatial Analysis. Res. High. Educ. 2017, 58, 469–496. [Google Scholar] [CrossRef]
  27. Mihiț, L.; Dudaș, L.; Mircea, G.; Costea, F. An Overview on Parametric and Non-Parametric Methods to Measure Performance. In Proceedings of the 6th SWS International Scientific Conferences on Social Sciences, Albena, Bulgaria, 26 August–1 September 2019; pp. 245–252. [Google Scholar]
  28. Charnes, A.; Cooper, W.W. Preface to topics in data envelopment analysis. Ann. Oper. Res. 1984, 2, 59–94. [Google Scholar] [CrossRef]
  29. Charnes, A.; Cooper, W.W.; Rhodes, E. Measuring the efficiency of decision making units. Eur. J. Oper. Res. 1978, 2, 429–444. [Google Scholar] [CrossRef]
  30. Schmidt, P.; Sickles, R.C. Production Frontiers and Panel Data. J. Bus. Econ. Stat. 1984, 2, 367–374. [Google Scholar] [CrossRef]
  31. Meeusen, W.; van den Broeck, J. Technical efficiency and dimension of the firm: Some results on the use of frontier production functions. Empir. Econ. 1977, 2, 109–122. [Google Scholar] [CrossRef]
  32. Bland, J.M.; Altman, D.G. Analysis of continuous data from small samples. BMJ 2009, 338, a3166. [Google Scholar] [CrossRef]
  33. De Bruijn, H.; Leijten, M. Megaprojects and Contested Information. Transp. Plan. Technol. 2007, 30, 49–69. [Google Scholar] [CrossRef]
  34. Speklé, R.F.; Verbeeten, F.H.M. The use of performance measurement systems in the public sector: Effects on performance. Manag. Account. Res. 2014, 25, 131–146. [Google Scholar] [CrossRef]
  35. Mazziotta, M.; Pareto, A. A Non-compensatory Approach for the Measurement of the Quality of Life. In Quality of Life in Italy: Research and Reflections; Springer: Dordrecht, The Netherlands, 2012; Volume 48, pp. 27–40. [Google Scholar]
  36. Gorenšek, T.; Kohont, A. Conceptualization of the Digitalization: Opportunities and Challenges for Organizations in the Euro-Mediterranean Area. Int. J. Euro-Mediterr. Stud. 2018, 11, 93–116. [Google Scholar]
  37. Luna, D.E.; Gil-Garcia, J.R.; Luna-Reyes, L.F.; Sandoval-Almazan, R.; Duarte-Valle, A. Improving the performance assessment of government web portals: A proposal using data envelopment analysis (DEA). Inf. Polity 2013, 18, 169–187. [Google Scholar] [CrossRef]
  38. Krejnus, M.; Stofkova, J.; Stofkova, K.R.; Binasova, V. The Use of the DEA Method for Measuring the Efficiency of Electronic Public Administration as Part of the Digitization of the Economy and Society. Appl. Sci. 2023, 13, 3672. [Google Scholar] [CrossRef]
  39. Hsieh, P.H.; Huang, C.S.; Yen, D.C. Assessing web services of emerging economies in an Eastern country—Taiwan’s e-government. Gov. Inf. Q. 2013, 30, 267–276. [Google Scholar] [CrossRef]
  40. Noja, G.G.; Cristea, M.; Sirghi, N.; Hategan, C.D.; D’Anselmi, P. Promoting Good Public Governance and Environmental Support for Sustainable Economic Development. Int. J. Environ. Res. Public Health 2019, 16, 4940. [Google Scholar] [CrossRef]
  41. Bartolacci, F.; Del Gobbo, R.; Soverchia, M. Improving public services’ performance measurement systems: Applying data envelopment analysis in the big and open data context. Int. J. Public Sect. Manag. 2024, 38, 313–331. [Google Scholar] [CrossRef]
  42. Bánhidi, Z.; Dobos, I. Measurement of digital development with partial orders, Tiered DEA, and cluster analysis for the European Union. Int. Rev. Appl. Sci. Eng. 2023, 14, 392–401. [Google Scholar] [CrossRef]
  43. Criste, C.; Bovary (Man), C.; Lobonț, O.R. Portraying the Level of Digital Performance and Innovation of the European Public Sector: Contextualising the Relationship Between E-government and Digital Innovation. In Proceedings of the 29th International Scientific Conference Strategic Management and Decision Support Systems in Strategic Management, Subotica, Serbia, 17–18 May 2024; pp. 363–372. [Google Scholar]
  44. Crăciun, A.F.; Țăran, A.M.; Noja, G.G.; Pirtea, M.G.; Răcătăian, R.I. Advanced Modelling of the Interplay between Public Governance and Digital Transformation: New Empirical Evidence from Structural Equation Modelling and Gaussian and Mixed-Markov Graphical Models. Mathematics 2023, 11, 1168. [Google Scholar] [CrossRef]
  45. Hubregtse, S. The digital divide within the European Union. New Libr. World 2005, 106, 164–172. [Google Scholar] [CrossRef]
  46. West, M.; Kraut, R.; Chew, H.E. I’d Blush If I Could: Closing Gender Divides in Digital Skills Through Education; UNESCO: Paris, France, 2019; pp. 1–145. [Google Scholar]
  47. Lynn, T.; Rosati, P.; Conway, E.; Curran, D.; Fox, G.; O’Gorman, C. Digital Public Services. In Digital Towns: Accelerating and Measuring the Digital Transformation of Rural Societies and Economies; Lynn, T., Rosati, P., Conway, E., Curran, D., Fox, G., O’Gorman, C., Eds.; Springer International Publishing: Cham, Switzerland, 2022; pp. 49–68. [Google Scholar]
  48. Charalabidis, Y.; Lachana, Z. Towards a Science Base for Digital Governance. In Proceedings of the 21st Annual International Conference on Digital Government Research, Seoul, Republic of Korea, 15–19 June 2020; pp. 383–389. [Google Scholar]
  49. Seri, P.; Zanfei, A. The co-evolution of ICT, skills and organization in public administrations: Evidence from new European country-level data. Struct. Change Econ. Dynam. 2013, 27, 160–176. [Google Scholar] [CrossRef]
  50. Sidorenko, E.L.; Khisamova, Z.I. Private Partnership as a Global Trend of Digital Government. SHS Web Conf. 2019, 71, 01004. [Google Scholar]
  51. Androniceanu, A.; Kinnunen, J.; Georgescu, I. E-Government Clusters in the EU Based on the Gaussian Mixture Models. Adm. Manag. Public 2020, 35, 6–20. [Google Scholar] [CrossRef]
  52. Santiso, C. Trust with integrity: Harnessing the integrity dividends of digital government for reducing corruption in developing countries. DESA Work. Pap. 2022, 176, 1–19. [Google Scholar]
  53. Rubino-Hallman, S.; Hanna, N.K. New Technologies for Public Sector Transformation: A Critical Analysis of E-Government Initiatives in Latin America and the Caribbean. J. E-Gov. 2007, 3, 3–39. [Google Scholar] [CrossRef]
  54. Acco Tives Leão, H.; Canedo, E.D. Best Practices and Methodologies to Promote the Digitization of Public Services Citizen-Driven: A Systematic Literature Review. Information 2018, 9, 197. [Google Scholar] [CrossRef]
  55. Bachtler, J.; Ferry, M. Cohesion Policy in Central and Eastern Europe: Is it fit for purpose? In Social and Economic Development in Central and Eastern Europe: Stability and Change After 1990; Gorzelak, G., Ed.; Routledge: London, UK, 2019; pp. 313–344. [Google Scholar]
  56. Radulescu, M.; Fedajev, A.; Sinisi, C.I.; Popescu, C.; Iacob, S.E. Europe 2020 Implementation as Driver of Economic Performance and Competitiveness. Panel Analysis of CEE Countries. Sustainability 2018, 10, 566. [Google Scholar] [CrossRef]
  57. Archambault, E. The third sector in Europe: Does it exhibit a converging movement? In Civil Society in Comparative Perspective; Enjolras, B., Henrik Sivesind, K., Eds.; Comparative Social Research; Emerald Group Publishing Limited: Bradford, UK, 2009; Volume 26, pp. 3–24. [Google Scholar]
  58. Bakacsi, G.; Sándor, T.; András, K.; Viktor, I. Eastern european cluster: Tradition and transition. J. World Bus. 2002, 37, 69–80. [Google Scholar] [CrossRef]
  59. Negri, C.; Dincă, G. Public sector’s efficiency as a reflection of governance quality, an European Union study. PLoS ONE 2023, 18, e0291048. [Google Scholar] [CrossRef]
  60. Milošević, N.; Dobrota, M.; Barjaktarovic Rakocevic, S. Digital economy in Europe: Evaluation of countries’ performances. Zb. Rad. Ekon. Fak. u Rijeka 2018, 36, 861–880. [Google Scholar] [CrossRef]
Figure 1. Summary of paper structure. Source: authors’ own processing.
Systems 13 00425 g001
Figure 2. European public sector performance. Source: authors’ own processing.
Systems 13 00425 g002
Figure 3. Results of the Gaussian graphic model (GGM). Source: authors’ own processing in RStudio software (2024.04.2+764.pro1).
Systems 13 00425 g003
Figure 4. Centrality diagram, method of partial correlations (PCOR), the Gaussian graphic model (GGM). Source: authors’ own processing in RStudio software.
Systems 13 00425 g004
Figure 5. Dendrogram results. Source: authors’ own processing in RStudio software.
Systems 13 00425 g005
Table 1. Description of digitalization and e-government indicators.
IndexCodeSourceAttribution
A. Digital Efficiency and Public Service Delivery
I. Digital Infrastructure
(i) Infrastructure and Access
Level of Internet AccessLIAEurostatInput
Fixed Broadband SubscriptionFBThe World BankInput
(ii) Usage and Adoption
Individuals using the InternetIUIThe World BankInput
(iii) Integration of Technology
Integration of Digital TechnologyIDTDigital Economy and Society IndexInput
ConnectivityConnectDigital Economy and Society IndexInput
CommunicationCOMDigital Economy and Society IndexInput
II. Digital Economy
High-Technology ExportsHTEThe World BankInput
ICT Service Exports ICTEurostatInput
III. Digital Skills (Social Digital)
(i) Skills and Education
Human CapitalHCDigital Economy and Society IndexInput
Advanced Skills and DevelopmentASDDigital Economy and Society IndexInput
IV. e-Government
(i) Digital Service Delivery
Digital Public Services by e-governmentDPSDigital Economy and Society IndexOutput
(ii) Open Data and Citizen Engagement
e-Government Users-Open DataGUODDigital Economy and Society IndexOutput
(iii) Overall e-Government Usage
e-Government Userse-govDigital Economy and Society IndexOutput
B. Governance
V. Institutional Quality
Regulatory QualityRQThe World BankInput
Government Effectiveness GEThe World BankInput
Political Stability and Absence of ViolencePSAVThe World BankInput
Rule of Law RLThe World BankInput
Source: authors’ own processing.
Table 2. GGM 2017 key variable relationships.
Node_ANode_BLink_TypeColorIntensity
COMFBpositivebluevery strong
COMIQIpositivebluevery strong
ConnectDPSpositivebluevery strong
DPSe.govpositivebluevery strong
HCICTpositivebluevery strong
IUILIAnegativeredvery strong
IDTHTEnegativeredvery strong
FBHTEnegativeredvery strong
e.govODICTnegativeredvery strong
IUICOMnegativeredvery strong
COM: Communication; Connect: Connectivity; IQI: Institutional Quality Index; DPS: Digital Public Services; e.gov: E-government users; FB: Fixed Broadband Subscription; HTE: High-Technology Exports; IUI: Individuals Using the Internet; IDT: Integration of Digital Technology; LIA: Level of Internet Access; HC: Human Capital; ICT: ICT Service Exports; e.govOD: E-government Users-Open Data. Source: authors’ own processing.
Table 3. GGM 2022 key variable relationships.
Node_ANode_BLink_TypeColorIntensity
ASDCOMnegativeredvery strong
ASDFBpositivebluevery strong
ASDIUIpositivebluevery strong
COMConnectnegativeredvery strong
COMIQIpositivebluevery strong
ConnectHTEpositivebluevery strong
ICTe.govnegativeredvery strong
HCe.govpositivebluevery strong
HCe.govODpositivebluevery strong
IDTLIApositivebluevery strong
ASD: Advanced Skills and Development; COM: Communication; Connect: Connectivity; IQI: Institutional Quality Index; DPS: Digital Public Services; e.gov: E-government users; FB: Fixed Broadband Subscription; HTE: High-Technology Exports; IUI: Individuals Using the Internet; IDT: Integration of Digital Technology; LIA: Level of Internet Access; HC: Human Capital; ICT: ICT Service Exports; e.govOD: E-government Users-Open Data. Source: authors’ own processing.
Table 4. DEA Analysis Results for the year 2022.
Input-OrientedInput-Oriented Output-OrientedOutput-Oriented
VRSCRS Input-OrientedVRSCRS Output-Oriented
DMU No.DMU NameRTS RegionEfficiencyEfficiencySlRTSEfficiencyEfficiencySlRTS
1AustriaRegion II1.000001.000001.00000Constant1.000001.000001.00000Constant
2BelgiumRegion II1.000001.000001.00000Constant1.000001.000001.00000Constant
3BulgariaRegion II1.000001.000001.00000Constant1.000001.000001.00000Constant
4CroatiaRegion II1.000001.000001.00000Constant1.000001.000001.00000Constant
5CyprusRegion II1.000001.000001.00000Constant1.000001.000001.00000Constant
6CzechiaRegion II1.000001.000001.00000Constant1.000001.000001.00000Constant
7DenmarkRegion II1.000001.000001.00000Constant1.000001.000001.00000Constant
8EstoniaRegion II1.000001.000001.00000Constant1.000001.000001.00000Constant
9FinlandRegion II1.000001.000001.00000Constant1.000001.000001.00000Constant
10FranceRegion II1.000001.000001.00000Constant1.000001.000001.00000Constant
11GermanyRegion III0.878080.840151.16676Decreasing1.068861.190261.38875Decreasing
12GreeceRegion II1.000001.000001.00000Constant1.000001.000001.00000Constant
13HungaryRegion II1.000001.000001.00000Constant1.000001.000001.00000Constant
14IrelandRegion II1.000001.000001.00000Constant1.000001.000001.00000Constant
15ItalyRegion II1.000001.000001.00000Constant1.000001.000001.00000Constant
16LatviaRegion II1.000001.000001.00000Constant1.000001.000001.00000Constant
17LithuaniaRegion II1.000001.000001.00000Constant1.000001.000001.00000Constant
18LuxembourgRegion II1.000001.000001.00000Constant1.000001.000001.00000Constant
19MaltaRegion II1.000001.000001.00000Constant1.000001.000001.00000Constant
20NetherlandsRegion III1.000000.929381.41560Decreasing1.000001.075991.52317Decreasing
21PolandRegion II1.000001.000001.00000Constant1.000001.000001.00000Constant
22PortugalRegion II1.000001.000001.00000Constant1.000001.000001.00000Constant
23RomaniaRegion II1.000001.000001.00000Constant1.000001.000001.00000Constant
24SlovakiaRegion II1.000001.000001.00000Constant1.000001.000001.00000Constant
25SloveniaRegion II1.000001.000001.00000Constant1.000001.000001.00000Constant
26SpainRegion II1.000001.000001.00000Constant1.000001.000001.00000Constant
27SwedenRegion III1.000000.745031.34206Decreasing1.000001.342231.80135Decreasing
Source: authors’ own processing in DEAFrontier.
Table 5. DEA analysis results for the year 2017.
Input-OrientedInput-Oriented Output-OrientedOutput-Oriented
VRSCRS Input-OrientedVRSCRS Output-Oriented
DMU No.DMU NameRTS RegionEfficiencyEfficiencySlRTSEfficiencyEfficiencySlRTS
1AustriaRegion II1.000001.000001.00000Constant1.000001.000001.00000Constant
2BelgiumRegion IV0.812110.782410.83656Increasing1.255511.278101.06920Decreasing
3BulgariaRegion II1.000001.000001.00000Constant1.000001.000001.00000Constant
4CroatiaRegion II1.000001.000001.00000Constant1.000001.000001.00000Constant
5CyprusRegion II1.000001.000001.00000Constant1.000001.000001.00000Constant
6CzechiaRegion I0.908420.725130.71529Increasing1.363961.379060.98643Increasing
7DenmarkRegion II1.000001.000001.00000Constant1.000001.000001.00000Constant
8EstoniaRegion II1.000001.000001.00000Constant1.000001.000001.00000Constant
9FinlandRegion II1.000001.000001.00000Constant1.000001.000001.00000Constant
10FranceRegion II1.000001.000001.00000Constant1.000001.000001.00000Constant
11GermanyRegion I0.970970.963420.92579Increasing1.033531.037970.96094Increasing
12GreeceRegion II1.000001.000001.00000Constant1.000001.000001.00000Constant
13HungaryRegion IV0.891220.812960.87788Increasing1.224731.230081.07987Decreasing
14IrelandRegion II1.000001.000001.00000Constant1.000001.000001.00000Constant
15ItalyRegion II1.000001.000001.00000Constant1.000001.000001.00000Constant
16LatviaRegion II1.000001.000001.00000Constant1.000001.000001.00000Constant
17LithuaniaRegion II1.000001.000001.00000Constant1.000001.000001.00000Constant
18LuxembourgRegion II1.000001.000001.00000Constant1.000001.000001.00000Constant
19MaltaRegion II1.000001.000001.00000Constant1.000001.000001.00000Constant
20NetherlandsRegion II1.000001.000001.00000Constant1.000001.000001.00000Constant
21PolandRegion II1.000001.000001.00000Constant1.000001.000001.00000Constant
22PortugalRegion II1.000001.000001.00000Constant1.000001.000001.00000Constant
23RomaniaRegion II1.000001.000001.00000Constant1.000001.000001.00000Constant
24SlovakiaRegion II1.000001.000001.00000Constant1.000001.000001.00000Constant
25SloveniaRegion II1.000001.000001.00000Constant1.000001.000001.00000Constant
26SpainRegion II1.000001.000001.00000Constant1.000001.000001.00000Constant
27SwedenRegion III0.783780.707071.19329Decreasing1.090921.414281.68766Decreasing
Source: authors’ own processing in DEAFrontier.
Disclaimer/Publisher’s Note: The statements, opinions and data contained in all publications are solely those of the individual author(s) and contributor(s) and not of MDPI and/or the editor(s). MDPI and/or the editor(s) disclaim responsibility for any injury to people or property resulting from any ideas, methods, instructions or products referred to in the content.

