Abstract
This study addresses the need for early design processes for diverse stakeholder interests in engineering challenges. It does this by using System-of-Systems frameworks, methods, and tools. The presented method, Inclusive SoS Analysis, helps to acquire an overview of the stakeholders’ interests and their preferred System-of-Systems architecture design in an operational setting, and in what way they have conflicting or synergistic interests. The stakeholders are classified by their relationship to the operational execution and integrated broadly throughout the modeling, simulation, and analysis of the System-of-Systems operation—a novel aspect of this work. The proposed method involves three phases: (1) Use case and stakeholder analysis to identify stakeholder interests and define Key Performance Indicators, (2) Modeling and simulation in an agent-based environment to represent System-of-Systems architectures and operational dynamics, and (3) Results and analysis to generate value functions to evaluate the impact of architectural configurations on stakeholder interests. Simulations explore varying System-of-Systems architectures characterized by the constituent systems that compose them, how their collaborative strategy is configured, and how decision making is controlled, revealing the ways in which these factors influence outcomes of the operation. The method is applied to the case study of a complex wildfire fighting scenario with a broad set of stakeholders and multiple constituent systems.
1. Introduction
We have increasing problems of social and environmental imbalances in our world, for example social inequalities and transgression of planetary boundaries [1]. It is time for System-of-Systems (SoS) frameworks, methods, and tools to be designed for social and environmental benefit, alongside economic interests. For this to occur, a broader set of stakeholders needs to be involved, and the SoS needs to be evaluated with their interests taken into account.
The International Council on Systems Engineering (INCOSE) reflects in their outlook for 2025 on the need to increase the inclusion of different stakeholders—for example, those that want environmentally and socially safe solutions—resulting in a more comprehensive system to engineer [2].
The SoS engineering approach, using systems thinking concepts such as emergence, evolution, control, and self-organization, offers a structured methodology to comprehend and enhance the collaboration among different systems [3,4].
Early holistic comprehension of a SoS is crucial for its subsequent enhancement, for example, in product development of its CSs, and it is a notable gap in the establishment of early-stage holistic SoS analyses. A SoS early analysis can be done to know how the SoS operates, considering stakeholders’ interests and operational execution, such as used resources, strategies, and tactics [5]. High-level abstraction can be useful for early-stage SoS analysis to define it at a general level with CSs capability descriptions and with low focus on detailed descriptions of subsystems in specific programming languages. Another use case for high-level abstraction analysis is optimizing the operation of existing CSs through SoS analysis, supporting the evolutionary design and improved outcomes of the SoS.
This work presents a methodology for early-stage SoS development processes called Inclusive SoS Analysis. It uses stakeholder analysis linked to the SoS architecture classification of composition, configuration, and control. This framework represents a step towards filling the gap of early-stage SoS development processes by linking a broad range of stakeholders’ interests to the SoS architecture.
One example of a SoS that affects a broad set of stakeholders is wildfire fighting operations, working in a sensitivity environment of ecosystems as well as residents, which will work as a case study.
Purpose
This article proposes a novel early-stage method for SoS development that systemically connects a broad set of stakeholders to SoS architecture. At the same time, the method supports flexible SoS composition to account for the fact that SoSs consist of CSs with different life cycles. The novelty is the integration of a wide stakeholder perspective and being able to analyze SoS operational outcomes in the early stages of the design process. This approach serves to guide the continuing development process, resulting in more responsible, sustainable, and effective SoS architectures.
To show its application, the method is tested in the complex operation of wildfire fighting in a semi-fictional scenario. The case study is retrospective, validated with partial face validation by interviews in the first step of the three-step method. The aim is to obtain insights into the SoS design from a broad range of stakeholder interests.
2. Background
This section presents research relevant to the developed method in the areas of SoS engineering, SoS architecture, evaluation of SoS, modeling and simulation, and stakeholder analysis.
2.1. System-of-Systems Engineering
SoS engineering is inherently very complex. It involves many steps, long processes, and —often—many years of life cycle planning and implementation. The SoS may contain some systems that are active over long periods of time, while others may be introduced in a planned way, perhaps to replace systems that are retiring or simply to add new capabilities to the SoS [6].
Traditional engineering approaches struggle to account for the dynamic interactions, emergent behaviors, and independent operational and managerial structures inherent in SoS [7]. One of the best-known models in Systems Engineering is the V-model, which progresses from operational need, requirements, and component design to implementation, validation, and delivery. As an attempt to adapt the V-model to SoS engineering, the Double-V model presents several systems’ shorter life cycles as part of the longer SoS life cycle, visualizing the design and engineering of different levels. Another expansion of the V-model is to integrate modeling and analysis conducted in parallel with the engineering of the system, to integrate a virtual and physical systems development [8].
Another perspective of the SoS engineering process is the implementer’s view with the Wave Model, which presents a more iterative approach to the evolution of a SoS and its CSs. The model is centered around the key characteristics of SoS engineering, which are to represent the evolution, ongoing analysis, and adaptability of the SoS, where the engineering should be done using an iterative approach. The main steps which are iterated are (1) Initiate SoS, (2) Conduct SoS Analysis, (3) Develop SoS Architecture, (4) Plan SoS Update, (5) Implement SoS Update, and (6) Continue SoS Analysis [9]. An early application of the Wave Model is conducted with a model-based approach using the SysML language in [10]. It shows the usefulness of structure, but the time consumed and tools need to be further developed and integrated to facilitate enhanced capabilities in analytical aspects of SoS engineering. Mission Engineering is another method to develop SoSs, which bases the development on realistic, simulated scenarios to be able to achieve mission objectives [11]. The development is normally done with modeling tools such as Capella, Cameo, and Rhapsody. While Capella can be used to translate operational requirements to agent-based models, the goal of Inclusive SoS Analysis is to promote early-stage analysis that both involves a variety of stakeholders and is simple to carry out, with only as many different tools involved as needed. Cameo and Rhapsody are more suitable for more mature SoS developments.
For the initial stages of product or CS development, Staack et al. [5] suggest the need for an analysis of the operational context in which the product should operate. Since the CS operates within a SoS, the SoS design space is evaluated as well as its context, which generates more detailed CS requirements. The suggested holistic approach to product development is a five-phase-based process decomposition. For similar purposes, Knöös Franzén et al.’s work uses ontology for early-stage product development. SoS needs are broken down to SoS capabilities with the use of ontology and an ontology reasoner. The approach shows a systematic way of moving from needs to SoS and high-level CS design [12].
In [13] Fang reviews a broad landscape of SoS architecture selection methods, framing them around seven critical themes: conceptual frameworks, evaluation criteria, interdependency, uncertainty, autonomy, dynamic evolution, and computational methods. The review supports the view of SoS architecture as composed of design variables as composition, configuration, and control, and stresses the importance of selecting optimal architecture alternatives early in the design process using structured, data-driven methods. While most studies focus on solving specific issues, such as interdependency and uncertainty, more papers are needed regarding the SoS architecture selection, of which one method is presented in this work.
2.2. System-of-Systems Architecture
An architecture is the organizational structure and associated behavior of a system. There are several frameworks for SoS architectures developed from various backgrounds. One common architecture perspective is the MODAF framework, which presents the architecture in the form of viewpoints—strategic, service, operational, systems, acquisition, and standards. MODAF is mainly applied within military use, like other frameworks such as DoDAF and NAF. The most common commercial framework is TOGAF, with the first step ‘architecture vision’ consisting of capturing stakeholder concerns, constraints, developing a value proposition, Key Performance Indicators (KPIs), and identifying risks and mitigation [14].
In System-of-Systems Modeling and Analysis [15], DeLaurentis considers three classes of design variables for the SoS: composition, configuration, and control. Composition refers to the selection of type and amount of CSs, configuration addresses their interconnections and functional arrangements, and control defines the governance and decision-making mechanisms that regulate interactions. DeLaurentis also refers to these as the SoS architecture, and, in the following work, the design variables of composition, configuration, and control are also referred to as architecture components.
2.3. Evaluation of System-of-Systems
Evaluation and analysis support the process of system synthesis in decision-making, identification and evaluation of alternative solution concepts, and understanding the behaviors of a particular system architecture. The process of analysis happens throughout the life cycle, alongside synthesis in iterative design loops [15].
Mission Engineering provides an approach to evaluate SoS operations with the help of well-defined KPIs that capture mission effectiveness and operational efficiency. The indicators are different on different SoS levels, capturing different characteristics. The most high-level KPIs are Measures of Success (MoS), which are on the mission level, taking into account both the SoS and the environment. The level below consists of Measures of Effectiveness (MoE) on the SoS level, which indicates the SoS’s effectiveness in reaching the objectives. The lowest level consists of the indicators Measures of Performance (MoP), which describe the effectiveness of specific CSs [16]. Ideally, all levels should be included in an assessment so that all aspects of the mission architecture are aligned with the overall objectives and function optimally. When testing and evaluating different SoS architectures, the most important indicators are MoEs to assess the performance of the SoS as a whole.
In [17], Brat et al. investigate a method to combine different life cycle stages in the same assessment method. This involves expanding the development of a system from the operational phase to also include phases of enabling systems such as production or support (e.g., maintenance). The value-model theory and the Multi-Attribute Utility value model are used, where a solution is represented by a function value between 0 and 1. With many solutions and values, a trade-space is created with various solutions to explore and assess, with the aim of supporting decision-making.
These indicators provide a quantitative basis for comparing alternative SoS configurations and identifying optimal response strategies. By integrating these measures into the SoS modeling and simulation framework, decision-makers can systematically assess trade-offs between stakeholder priorities.
A systematic review of evaluation methods for SoS software architecture presents a wide range of techniques, including scenario-based, mathematical modeling, and simulation-based approaches. However, most of these methods are adaptations from traditional system architectures and lack full compatibility with the dynamic and evolving nature of SoS. Scenario-based methods seem to be more mature and industry-validated, while simulation-based techniques dominate recent academic works because of their ability to handle architectural complexity and automate design space exploration, but are still early in the maturity stages [18]. The study underscores a gap in new hybrid (qualitative and quantitative) strategies for evaluating SoS software architectures, including the use of SoS missions as the foundation for evaluation, the development of flexible evaluation methods, and more rigorous documentation. This article’s work addresses the hybrid strategy and the use of the SoS mission as the frame for evaluation.
2.4. Modeling and Simulation
The modeling process involves creating simplified representations of reality, deliberately focusing on the aspects relevant to the problem at hand [15]. The objective is to construct a model capable of evaluating system performance during its development phase. Agent-based modeling (ABM) captures the emergent properties of a SoS when the CSs operate independently according to set boundaries and rules. In complex systems, deterministic models are not useful. There needs to be tools that can handle the complex properties, such as ABM [15].
An effective model accurately reflects the system and its interactions, operating at an appropriate level of abstraction and fidelity, and is detailed enough to support decision-making yet clear and manageable. It is adaptable to new insights or requirements, supports analysis and decision making, and can illustrate how product architecture and organizational structures influence one another. To achieve this, DeLaurentis [15] proposes a three-phase method consisting of Definition, Abstraction, and Implementation (DAI).
Environmental ABM has been an area of focus, particularly in the study of disaster response and emergency operations. Lovaco et al. [19] developed a firefighting SoS framework using ABM to analyze wildfire spread and response efficiency. Their findings highlight the importance of simulation fidelity in representing real-world scenarios and optimizing resource allocation.
A suitable tool for ABM and simulation is the open-source software NetLogo (version 6.4.0). It has been used to model various complex social and ecological problems and provides a library of several predefined functions and a user interface.
Simulations can be planned with a Design of Experiments (DoE) to vary the input design variables systematically. One DoE method is Latin Hypercube Sampling, which generates a nearly random assignment of parameter values in a multidimensional distribution.
2.5. Stakeholder Analysis
In Systems Engineering, stakeholder analysis is carried out in the concept phase, which is the first life cycle phase followed by development, production, utilization, support, and retirement [20]. It is common to structure stakeholder needs and requirements via a model-based approach, for example, the SysML modeling language [17]. Stakeholders can be at the center of the operation, or they can be stakeholders of the enabling systems, like infrastructure providers. Normally, the stakeholders of the enabling systems are identified after the design is set, which can require re-design later in the development process and be costly. But there are also approaches in which all life cycle stages of the CSs are included in the requirement identification process [17]. A common way to link the customer needs to the system characteristics is via a Quality Function Deployment, which provides a way to trace stakeholder requirements and validate the end design [21].
SoS Engineering has a few differences compared to Systems Engineering. When identifying requirements in SoS, these should be less specific and broader to represent a requirements space rather than specific operational or technical requirements [22]. Performance measures should be independent of the specific CSs and focus on the SoS solution rather than on specific systems.
According to when IOS 15288 is applied to SoS, the stakeholder needs and requirements definitions should focus on the top-level SoS, but also consider the needs of the stakeholders of the CSs. This phase is carried out in the technical process. The SoS architecture should be on the SoS level and leave the CSs’ architecture to their respective organizations [23].
One way to systemically trace stakeholders’ objectives, goals, and interests is Goal-oriented Requirements Language, which is used to support goal-oriented modeling and reasoning about requirements [24]. The role of ontologies and description logic reasoning in structuring SoS requirements and improving interoperability between CSs has been explored [12].
2.6. Summary
The literature review reveals that there is little research done in stakeholder involvement and analysis in a SoS context. There is also limited work in tracing stakeholder interests throughout modeling, simulation, and operational evaluation, both in a combined qualitative and quantitative manner and specifically considering architecture evaluation. Furthermore, SoS engineering methods are most often technically advanced, with few developments in early-stage analysis that can facilitate a broad set of stakeholder interests and varying levels of SoS engineering domain knowledge.
3. Methodology
The main contribution of this work is the method in this section. It builds upon the recognized need to integrate a broader set of stakeholders, especially those with environmental and social concerns, into SoS design processes. The approach aims to bridge early-stage SoS architecture development with stakeholder interests, addressing limitations in current engineering practices. It is developed through a comprehensive literature review, leading to the identification of the research gap (lack of stakeholder integration) and selection of tools to integrate from already established engineering practices, presented in the Background chapter. The specific contributions that are synthesized and included in the method are described below. The text is organized based on the three phases of the new method Inclusive SoS Analysis: (1) Use Case and Stakeholder Analysis, (2) Modeling and Simulation, and (3) Results and Analysis.
To validate Inclusive SoS Analysis, it is applied to a retrospective case study of wildfire fighting, presented in Section 4. This case study demonstrates that the method has useful outputs for stakeholders, such as insights that facilitate the determination of the best SoS architecture to apply to the SoS operation. These consist of composition (type and number of CSs), configuration (their combined strategy), and control (how decisions are made during the operation).
3.1. Use Case and Stakeholder Analysis
The first phase, Use Case and Stakeholder Analysis, is setting the purpose and scope of the work, which will decide the level of depth of the Inclusive SoS Analysis. Just as in the early parts of the V-model [9], the required use case and stakeholder information is gathered in the beginning, but in this method, the information is broader and less specific. Instead of detailed requirements, this phase will result in knowledge of stakeholders’ interests to serve as the basis of further analysis. The Use Case and Stakeholder Analysis is carried out iteratively with the Modeling and Simulation phase (represented by the dotted arrow from phase 2 to 1 in Figure 1). The iteration is due to the building of the model considering the SoS scenario as well as stakeholder KPIs, which in turn are influenced by the model design and the used modeling tool’s capabilities.
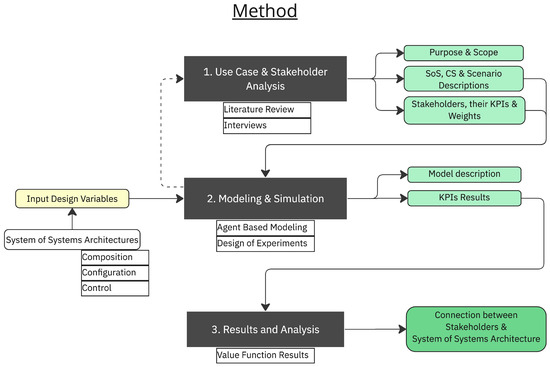
Figure 1.
Inclusive SoS Analysis: (1) Use Case and Stakeholder Analysis, (2) Modeling and Simulation, and (3) Results and Analysis. The black boxes are the three main phases described by activities underneath; on the left side are inputs, and on the right are outputs from the phases.
At first, the use case of the SoS assessment is identified, for example, that an initial analysis will give information about how to proceed in a design process. Use case identification is carried out together with the actor ordering the assessment and will also decide the analysis’s level of depth.
Further on, the data collection is to a large extent done by exchange with domain experts, examination of reports, and interviews with stakeholders. Early on in the process, the scenario is identified by the SoS’s function, the CSs’ characteristics and capabilities, and the environment they are operating in. The scenario also includes which SoS architectures are interesting to analyze and model. A scenario description of the operation is created to be used as the scope of the model and simulation in phase two.
Some SoS stakeholders relate to the CSs as financiers or managers, but some stakeholders influence or are influenced in other ways. The stakeholders are classified according to whether they are: (1) Operation Executors, (2) Operation Managers, or (3) Impacting or Impacted and presented in an Involvement Circle. The Involvement Circle is designed so that the inner core is the stakeholders physically executing the operation, and the further out the stakeholder is, the further away from the operation’s execution. The inner circle Operation Executors are the ones physically executing the operation, including the stakeholders operating the CSs in the system-of-interest. The middle circle Operation Managers are stakeholders not physically present in the operation, but who have some influence and decision-making power in the execution. In the outer circle, Impacting or Impacted are the stakeholders who do not have direct influence over the operation but influence or are influenced indirectly or in the longer term. This is inspired by tools from systems thinking networks such as stakeholder diagrams, where stakeholders are identified as core stakeholders, directly affected, or indirectly affected by the issue at hand [25].
The Involvement Circle provides a deeper understanding of all stakeholders’ roles, influence, and importance in the SoS operation. Their interests are identified as incentives in the SoS operation and constraints to fulfill them, and are quantitatively represented by KPIs to be modeled. The KPIs are weighted to assign varying priorities to the stakeholders’ interests and are later used in the simulation analysis. The weighting is carried out by distributing weights to the KPIs so that the weights sum up to 1.
Since this method is for SoS analysis, the majority of the KPIs should be Measures of Effectiveness (MoE) or Measures of Success (MoS), which are on a SoS and higher abstraction level, compared to Measures of Performance (MoP) at CS level, based on Mission Engineering [16].
The important outcomes of the Use Case and Stakeholder Analysis are (1) the purpose and scope of the work; (2) SoS, CS, and scenario descriptions; and (3) stakeholders, their KPIs, and weights.
3.2. Modeling and Simulation
The SoS, CS, and scenario description from the first phase are modeled in an agent-based simulation in the second phase. This tool is chosen as the best one to represent the SoS as a complex system [15], including the five SoS characteristics: CS operation and managerial independence, emergence, geographical distribution, and evolutionary behavior [26]. The scenario informs the model’s environment and the CSs’ behavior as well as the SoS architectures to be tested. Each variation of the design variable classes (composition, configuration, and control) is modeled so that they can be in any arrangement and represent any specific SoS architecture.
The model is built in an iterative way, first with as high an abstraction level as possible while still including the model demands from the Use Case and Stakeholder Analysis. It is built on iteration with stakeholder KPI identification to find out if and how specific indicators can be represented in the model. The model is then built in more detail in the areas that need lower abstraction.
The stakeholders’ KPIs are modeled as parameters to be measured as outcomes of a simulation. The simulations test a number of SoS architectures with varying configuration, composition, and control, and each simulation results in a variety of KPI results.
The experiments are planned with a DoE to vary the input design variables systematically. One DoE method is Latin Hypercube Sampling, which generates a nearly random assignment of parameter values in a multidimensional distribution.
The outcome of the Modeling and Simulation phase is the model description and KPI results from the various simulations. The KPI results are used in the following phase of Results and Analysis, explained in Section 3.3.
3.3. Results and Analysis
The third and final phase involves analyzing the results of the KPIs in relation to the design variables of the SoS architecture.
The KPIs are analyzed with a correlation heatmap to understand their interdependencies. The design variables and KPIs are also analyzed with a sensitivity matrix to understand how design variables influence the different KPIs. With that knowledge, more can be understood about the SoS architecture and its effects on stakeholders’ interests. Before generating the map and matrix, the KPIs’ results are normalized from their original units to the range of 0 to 1 with the min-max method.
The KPIs and weights are aggregated into value functions for each stakeholder and calculated for each simulation, as a way to aggregate stakeholder interests and create a trade-space such as in [17]. The value function is a sum of the weights multiplied by the KPIs. The KPIs desired to be large (e.g., effectiveness) are positive and add to the value function, while the KPIs desired to be small (e.g., costs) are negative. The general value function is Equation (1):
where n is the number of KPIs and w represents the weight for each KPI. The stakeholders have different value functions since their KPIs and weights differ. The value functions are generated for every simulation, and the higher the result of the value function, the more the stakeholder’s interests are fulfilled.
The value functions’ results are visualized and plotted against the input design variables. The stakeholders’ interests are then connected to the SoS architectures to compare and find the most preferable ones, to guide the continuing SoS development process.
4. Case Study
To illustrate how Involving SoS Analysis can be used, a semi-fictional retrospective scenario of wildfire fighting in a Swedish forest, in similar conditions as would be encountered in the European Union in general, is presented. The case study is undertaken with the three steps as presented in the method. In the first step of Use Case and Stakeholder Analysis, four stakeholders are interviewed to understand their interests and set the scope of the analysis. The interviews are semi-structured and represent a face validation of the case study. Translation of interests to KPIs is not validated with the stakeholders, nor are the following steps in the case study. The case study is therefore semi-fictional, though the initial interviews are seen as enough to frame the case study and clearly indicate an interest in the work from the stakeholders. The primary purpose of this work is to develop the method of Inclusive SoS Analysis and not to perform a fully validated case study, an important step to be taken in future work.
As a response to the emergency, a SoS is operating to hinder the spread and extinguish the fire. An assessment can result in the knowledge of which SoS architectures are most suitable for the operation and guide further improvement.
The data collection is mostly from governmental sources, such as the Swedish Civil Contingencies Agency (MSB) [27], which provides reports about wildfire fighting experiences and practices. A scenario of a Swedish wildfire in 2014 was used to obtain scenario-specific data of wind speed and fire spread [28]. Operational costs were identified through interviews, Internet searches, and documents from governmental organizations such as MSB. The stakeholder analysis was made both through analysis of reports from governmental organizations and, primarily, stakeholder interviews. These included semi-structured interviews with four stakeholders to identify their roles, interests, and constraints within the wildfire fighting operation.
4.1. Use Case and Stakeholder Analysis
The outcomes of this step are: purpose and scope of assessment; SoS scenario; CS characteristics as well as capabilities; stakeholders; KPIs and weights; and SoS architectures to model.
In this case study, the use case of the SoS assessment is to understand how wildfire fighting affects various stakeholders, including those operating or managing the operation, as well as external stakeholders. The purpose is to gain knowledge to guide the process of improving wildfire fighting strategies, which can then be extended and transferred to other national emergency services. The result could be used to compare with today’s operating wildfire SoSs, with the aim of improving them. This is an interest expressed by a wildfire fighting analyst from the Swedish National Fire Agency (MSB) [29]. Within the scope of the assessment are Swedish wildfire fighting operations in Swedish conditions, though they are similar to general European conditions. The analysis should mainly be on a general SoS level to give guidance on the CSs’ structure as a group, with less focus on improving the CSs themselves. The particular scenario analyzed is an intricate forest fire in 2014 in Sweden, where ground crews and helicopters were used together to control the fire’s spread [28].
The function of the SoS is to extinguish wildfires and to be ready to act quickly wherever its resources are needed. The most common CSs are of two types, ground crews and helicopters, and they play complementary roles in wildfire fighting scenarios. Ground crews typically work on the flanks of the fire, removing fuel and creating wet lines to stop the fire’s spread. Helicopters provide aerial support, slowing the fire by cooling flames with water drops, giving ground crews time to establish containment lines. They have independent operation and management, but coordination between these resources is crucial for effective firefighting. Ground crews normally operate in groups of five firefighters, using one water truck and one fuel truck [30]. The efficiency of aerial resources in firefighting is measured by their water delivery rate and operational costs. In an interview with the CEO of a company currently holding a contract with MSB, the CEO highlighted the vital role helicopters play in initial wildfire responses, emphasizing their capacity for rapid deployment. He noted that smaller helicopters, capable of carrying approximately 1000 L of water, are preferred for their agility and efficiency, while bigger ones increase exponentially in costs [31]. A common aerial CS is the helicopter model Eurocopter AS350.
The CSs have different characteristics and capabilities, presented in Table 1. These capabilities are important for delivering functions during a wildfire operation. This information is from interviews [29,30,31] as well as from wildfire fighting reports [32,33,34].

Table 1.
Characteristics and capabilities of Ground and Aerial CSs.
Interesting SoS architecture variables to vary are various amounts of CSs (composition), while an interesting configuration aspect is the response time, expressed by an MSB analyst [29]. Other configurations to test are different strategies which are variations of real use cases, formed by different wildfire fighting reports and stakeholder interviews [27,30,31,32,34]. The control part of the SoS architecture is explored to find out how the SoS performance responds to centralized and decentralized coordination. The decision of placement and strategy is either made by the Incident Commander or distributed to the CSs themselves. What is also part of the control aspect is delay time; how deciding placement and strategy based on old information about the operation situation affects the outcome.
4.1.1. Stakeholders
The identified stakeholders being (1) Operation Executors, (2) Operation Managers, or (3) Impacting or Impacted are presented in the Involvement Circle in Figure 2. The Operation Executors are: the Incident Commander (IC), local farmer with water tanks, police, medical unit, and volunteers, as well as the stakeholders operating the CSs in the system-of-interest, i.e., the aerial firefighters and ground firefighters. The Operation Managers are: the local fire agency, land owner, SoS emergency contact, municipality, national fire agency (MSB), air traffic management, and rescEU. The Impacting or Impacted are: residents, insurance companies, infrastructure companies, ecosystems, media, regional government, national government, production industry, Aerial Service Business, and the local farmer network.
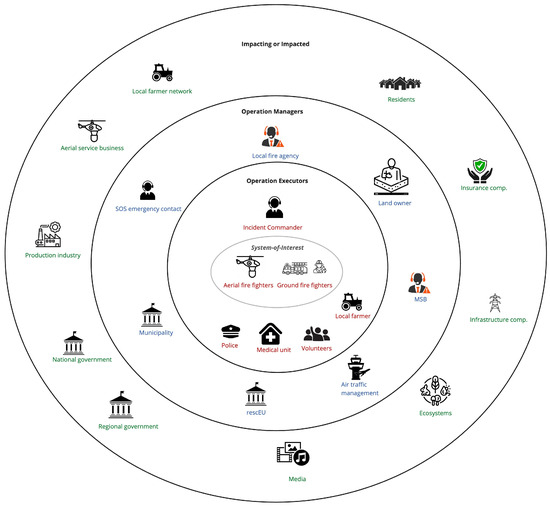
Figure 2.
Involvement Circle—All stakeholders in the use case wildfire fighting operation.
Three stakeholders are chosen as examples for analysis in the rest of the article, while the other stakeholders can be analyzed with the same process. The example stakeholders are from different circles in the Involvement Circle; from Operation Executors is the stakeholder (1) Incident Commander, from Operation Managers is the stakeholder (2) National Fire Agency (MSB), and from Impacting or Impacted is the stakeholder (3) Aerial Service Business.
4.1.2. Key Performance Indicators
The KPIs to represent the stakeholder interests and be modeled are mainly MoEs on the SoS level to represent the operation’s effectiveness, while two of the KPIs are MoPs to present CS efficiency. They are visually presented in Figure 3 and in more detail in Table 2.
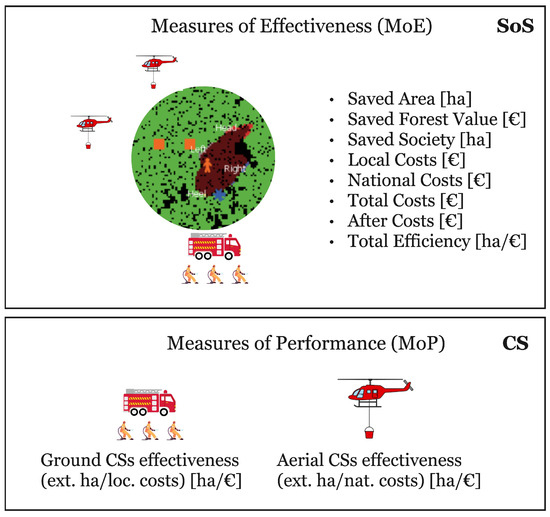
Figure 3.
KPIs representing the stakeholders’ interests on Measure of Effectiveness (MoE) and Measure of Performance (MoP) levels.
Table 2.
KPIs representing stakeholders’ interests in the model.
4.1.3. Stakeholder 1: Incident Commander—Operation Executor
The Incident Commander’s role in the wildfire fighting operation is to be the highest director of operation execution, with responsibility for the outcome and the actors in the operation. The Incident Commander does not think about costs but rather about safety and efficiency. The safety of the firefighters is always prioritized as a strict requirement rather than a variable and is therefore not a KPI but a model constraint. They have a constraint of available resources to use in the operation. The Incident Commander values high areas of saved forest and society, see Table 3.
Table 3.
Incident Commander specifications.
4.1.4. Stakeholder 2: National Fire Agency (MSB)—Operation Manager
The national fire agency (MSB) has national responsibility for civil protection, public safety, civil defense, and emergency management. They are the coordinators when the wildfire requires aerial resources and other national support. Their incentives, constraints, and model KPIs and weights are presented in Table 4.
Table 4.
National Fire Agency (MSB) stakeholder specifications.
4.1.5. Stakeholder 3: Aerial Service Business—Impacting or Impacted
The business provides helicopter resources for the operation. They have a contract with the national fire agency to provide service when needed and can be placed in strategic locations during high-risk periods. The Aerial Service Business incentives, constraints, and model KPIs and weights are presented in Table 5.
Table 5.
Aerial Service Business stakeholder specifications.
4.2. Modeling and Simulation
The model description and limitations of the agent-based model are presented here, as well as the DoE method for the simulations.
4.2.1. Model Description
The NetLogo model shown in Figure 4 represents the wildfire fighting scenario with an environment and agents representing CSs. The environment consists of a forest, water, two cities, and a non-burnable area. The environment is represented by a map of the region in Sweden of the 2014 wildfire, from the work of Lovaco [19], with added cities. The simulation stops when the fire is extinguished or when the operation has continued for 33 h, representing the two days in the 2014 fire and being a suitable maximum length for a normal wildfire fighting operation according to an MSB representative.
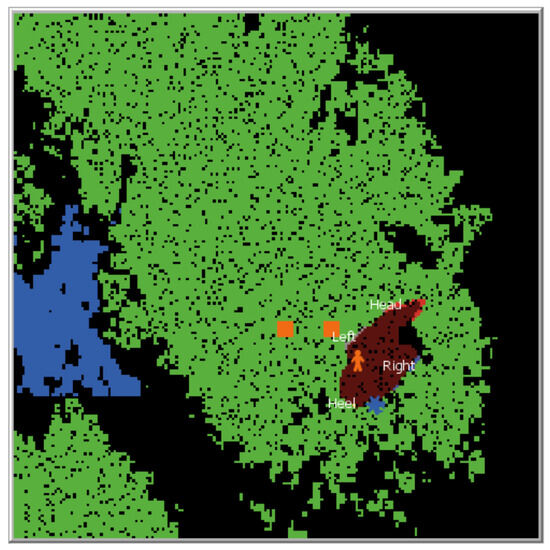
Figure 4.
NetLogo model representing the wildfire fighting use case. The green patches represent forest; the black patches, non-forest; the blue patches, water; the orange squares, cities; the red area, wildfire; and the blue helicopters and orange person, CSs.
The fire has a base spread in three directions and is larger in the wind direction, which is constant during the simulation. The fire is divided into four sectors—head, left flank, right flank, and heel—to distribute firefighting resources to different parts of the operation. Each time step in the simulation represents one minute.
The model demonstrates the five most important SoS characteristics from [26] of independent operation and management, emergence, geographical distribution, and evolutionary behavior.
- Independent operation—The agents representing the CSs move independently in the model.
- Independent management—The CSs have different costs which respond to demands from different managing stakeholders.
- Emergence—The simulation results cannot be predicted with the information about an individual CS’s behavior but must be analyzed with the outcomes of the KPI results on the SoS level.
- Geographical distribution—The agents representing the CSs move independently with the distance between them in the model.
- Evolutionary behavior—The fire evolves and strategy changes over time during the operation.
The design aspects of the SoS architecture that were changed in the simulations are described below, with the input design variable in brackets, and visualized in Figure 5:
- Composition
- CS Amount [CS amount]
- Proportion ground VS aerial CSs. [% ground CSs]
- Configuration
- Response time from fire ignition to operation start in minutes. [Response time]
- Strategy choices are five different strategies for focusing the CS resources during the operation [Strategy choice]:
- Largest fire sector—All CSs head towards the sector (head, heel, left, and right flank) of the fire with the currently largest fire spread.
- Largest relative change—All CSs head towards the sector with the largest increase of fire spread since the last situation assessment.
- Go around the fire—Ground CSs start at heel and continue upwards, while the aerial CSs start at the head and continue downwards.
- Spread CSs equally—Randomly assign the CSs to a sector to operate in.
- Protect city—Initially, the above strategy, and if the fire is closer than one km, the CSs go to the fire closest to the city. The CSs increase up to 10 on each ground and aerial to protect the city.
- Decentralized decision—The ground CSs always go to the fire closest to their starting point, and the helicopters always go closest to the fire that is closest to the water source.
- Control
- Time gap (hours) between situation assessments—The time gap influences how often the strategy is reassessed and updated, for example, if the ‘largest fire sector’ has changed and the CSs should be heading there. [Time strategy update]
- Centralized vs. decentralized decision making—Four of the strategies use centralized decision making from an Incident Commander point of view, while one strategy (decentralized decision) uses decision making taken by the CSs themselves. [Strategy choice]
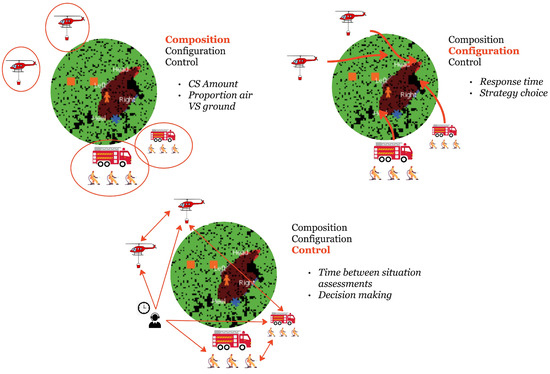
Figure 5.
The three SoS architecture components ‘Composition’ (where CSs are circled in red), ‘Configuration’ (where the placement of CSs is indicated with bold red arrows), and ‘Control’ (where time between situation assessments is indicated by the person and clock symbols and communication between CSs is represented with red arrows).
4.2.2. Model Limitations
The model ignores the effect of the slope of the fire spread, only considering wind and the availability of trees. The spread rate is the same as in the real 2014 scenario, but the results of the total burned area become larger, showing that some parts of the model fit a real scenario and some do not. The CSs are modeled with water dropping extinguishing fires and a certain distance between them during the operation, but the communication between them is not included.
4.2.3. Simulations
The simulations were run according to the scheme of a generated DoE. The DoE was generated by Latin Hypercube Sampling of 3600 samples, and the ranges of the input design variables are in Table 6. A total of 3600 samples were used to obtain a strong coverage of the ranges of the variables and their combinations.
Table 6.
Input design variables of SoS architecture and their ranges used in generating the DoE.
4.3. Results and Analysis
After the simulations, the data with faulty data points were removed, resulting in 3594 data points. This data set was further used in the analysis to find variable correlations through two correlation matrix heatmaps.
Analyzing the KPIs correlation to each other, a heatmap is presented in Figure 6. The big trends are that Saved area, Saved Forest Value, and Saved Society are positively correlated with each other, while they are negatively correlated with the different cost KPIs. This means that when there is a large saved area, the costs are also low. The Saved Area and Saved Forest Value have a positive correlation with Total Efficiency, and a negative correlation with Aerial CS Efficiency. This means if there has been a large saved area, the total efficiency has likely been high, but with lower aerial efficiency. The Ground CS Efficiency KPI and Total Efficiency are negatively correlated with cost, meaning if cost increases, efficiency goes down. Aerial CS Efficiency, on the other hand, is positively correlated with costs, meaning they are more effective during a costly operation.
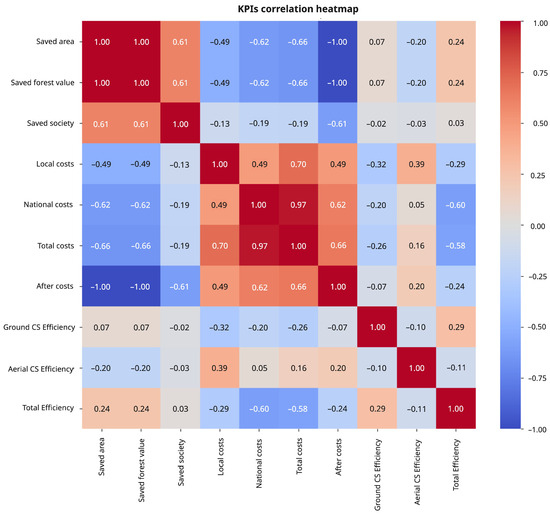
Figure 6.
KPI correlation heatmap.
Further analysis is conducted with the KPIs and the input design variables through the input–output sensitivity matrix in Figure 7. This shows that Response Time is the most influencing input variable, where a short one results in a good operational outcome of saved area, low costs, and total efficiency. But the KPI of Aerial CS Efficiency decreases with shorter response time, meaning they are more efficient if the fire has already grown large. If the input CS Amount increases, it results in a larger saved area and lower costs, and decreases the CSs’ efficiencies. Both ground and aerial efficiencies are influenced by the inputs of CS amount and percentage of ground CSs, and are less efficient if there are many of the same CS type in the operation. The strategy choice input has a small influence on the MoP of CS Efficiency and none on MoE KPIs. The variable Time Strategy Update barely influences any KPIs. Even though this might be due to reasons that were not observed in this study, it can be useful to filter design variables. Therefore, the KPIs Time Strategy Update and Strategy Choice are removed to focus on other design variables during further analysis of stakeholder satisfaction.
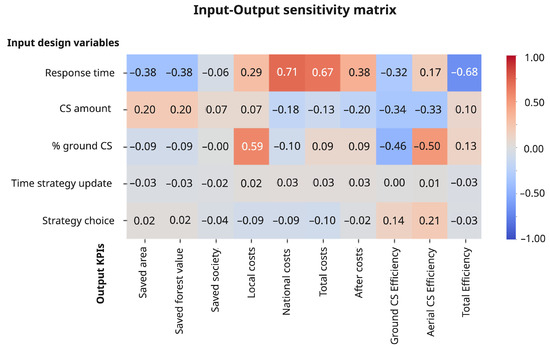
Figure 7.
Input–output sensitivity matrix.
The following sections present the three stakeholders’ value function results. First, the results distribution is presented in a histogram plot, and then in scatter plots for each design variable: Response Time, CS Amount, and % Ground CSs. The design variable range is on the x-axis and the value function on the y-axis. To more clearly see the implications the design variables have on the value function, the top 20% and bottom 20% of the value function are separated by two horizontal lines in the plots. This is to help see what causes top or bottom value function results, to further guide the determination of the most suitable SoS architecture.
4.3.1. Stakeholder 1: Incident Commander
The Incident Commander’s value function is presented in Equation (3), and the results from the simulations are presented below. The results are presented by the value function distribution in a histogram and the design variables in scatter plots.
Data distribution: Figure 8 shows the Incident Commander has almost all results near the maximum value (close to 1), meaning there is high satisfaction of their interests. They have the KPIs of Saved Area and Saved Society, both with weights of 0.5 as the only KPIs in the value function. This means Saved Area and Saved Society almost always obtain high values in the simulations.
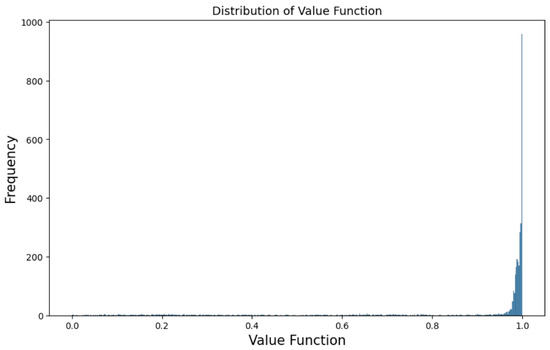
Figure 8.
Stakeholder 1 (Incident Commander)—Histogram of value function distribution. The x-axis shows normalized value function results, y-axis shows the frequency of simulation results.
Design variables for top 20%: Figure 9 shows that the top 20% value function results are achieved with the full range of values of the design variables. The response time can be anything between 30 and 300 min, but the top results have a small decline as the response time increases. CS amount can be between 2 and 20 with stable results. The percentage of ground CSs can be from 3 to 97%.
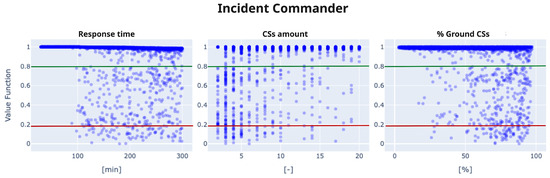
Figure 9.
Incident Commander (Stakeholder 1) results across the SoS input design variables represented by each plot. Value function results on the y-axis with top and bottom 20% marked with lines.
Design variables for bottom 20%: There are few results below 20%. The trends show that this always happens with a response time over 100 min and is more prevalent the fewer CSs there are in the operation, i.e., most common with five or fewer CSs. A higher percentage of ground CSs should be avoided, as there is less risk for low results with a larger percentage of aerial CSs.
4.3.2. Stakeholder 2: National Fire Agency
The National Fire Agency’s value function is presented in Equation (4), and the results from the simulations are presented below. The results are presented according to the value function distribution in a histogram and the design variables in scatter plots.
Data distribution: The National Fire Agency has a large distribution of results around 0.55 as seen in Figure 10. There is a stable decline up to 0.8 on the higher end, while there is a drop around 0.4, with more results at 0.2 on the lower end of the scale.
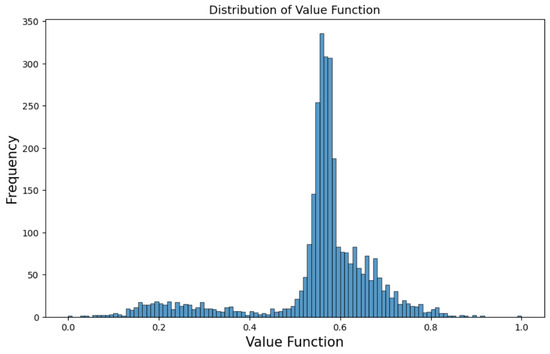
Figure 10.
Stakeholder 2 (National Fire Agency)—Histogram of value function distribution. The x-axis shows normalized value function results, y-axis shows the frequency of simulation results.
Design variables for top 20%: Figure 11 shows there are very few results with a value function above 0.8. What is important is a short response time below 105 min, and it has more successful cases with a large proportion of ground CSs.
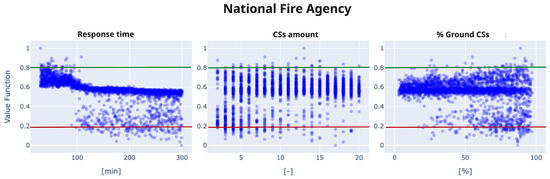
Figure 11.
National Fire Agency (Stakeholder 2) results across the SoS input design variables represented by each plot. Value function results on the y-axis with top and bottom 20% marked with lines.
Design variables for bottom 20%: There are very few results below the 20% but they happen when the response time is larger than 100 min. The CS amount can be anything from three to 18, and the worst result is when there are 17 of them. There are more low results when the percentage of ground CSs is high (the result can be in the range from low to high for a large proportion of ground CSs).
4.3.3. Stakeholder 3: Aerial Service Business
The Aerial Service Business’s value function is presented in Equation (5), and the results from the simulations are presented below. The results are presented according to the value function distribution in a histogram and the design variables in scatter plots.
Data distribution: The value function results seen in Figure 12 are mostly distributed around 0.2 with a steady decline to the lower values and a sharper decline to the higher values, showing very few results above 0.4.
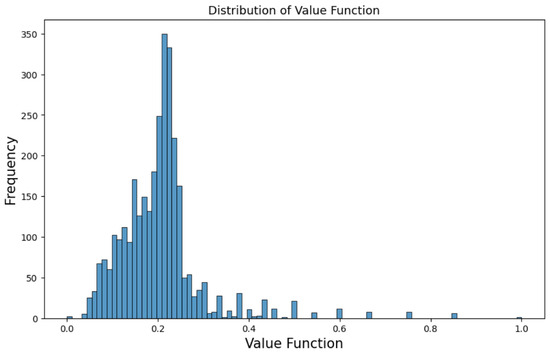
Figure 12.
Aerial Service Business (Stakeholder 3)—Histogram of value function distribution. The x-axis shows normalized value function results, y-axis shows the frequency of simulation results.
Design variables for top 20%: Figure 13 shows there are few results in the top 20%, but it is clear that a short response time is very important, as well as a high percentage of ground CSs. This means the aerial CSs perform with higher efficiency when there is a larger proportion of ground CSs.
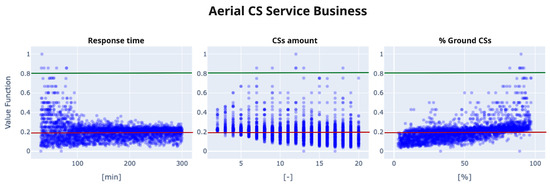
Figure 13.
Stakeholder 3 (Aerial Service Business) results across the SoS input design variables represented by each plot. Value function results on the y-axis with top and bottom 20% marked with lines.
Design variables for bottom 20%: The bottom value function results can happen with any response time but are more prevalent when there is a short response time, explaining the positive correlation in the sensitivity matrix in Figure 7. It shows that the density of results is important; most cases with short response time result in bad results, but a few result in great outcomes, making response time an unreliable design variable. The CS amount shows worse results when there are many, i.e., more prevalent above ten CSs. The percentage of grounds CSs shows that with a lower percentage (more aerial CSs), there is a higher risk of obtaining a bad result.
4.3.4. Stakeholder Comparison
As a summary of the stakeholders, the best SoS architectures for them are:
- Incident Commander—Short response time (below 100 min) with a large CS amount and most of them being aerial CSs.
- National Fire Agency—Short response time (below 100 min) with a large CS amount and most of them being aerial CSs.
- Aerial Service Business—Short response time with a high % of ground CSs, the CSs amount is of less importance.
All three stakeholders are satisfied with a low response time, under 100 min. Stakeholder 1 (Incident Commander) and stakeholder 2 (National Fire Agency) have similar preferences of a large CS amount, mostly aerial, while stakeholder 3 (Aerial Service Business) prefers a low CS amount, which is mostly ground CSs, in conflict with the other two stakeholders.
Remembering the stakeholders’ weighted KPIs:
- Stakeholder 1 Incident Commander—Saved area: 0.5 and Saved society: 0.5
- Stakeholder 2 National Fire Agency—Total efficiency: 0.6, Saved area: 0.1, Saved society: 0.1, Total cost: 0.1, and National cost: 0.1
- Stakeholder 3 Aerial Service Business—Aerial efficiency: 1
The results of stakeholder 3 (Aerial Service Business) are intuitively contradictory, i.e., the Aerial Service Business would prefer a low amount of CSs, with most being ground CSs, meaning there would be few aerial CSs in the operation. This stakeholder only has Aerial Efficiency as a KPI, which is calculated as ’hectares of extinguished fire by aerial CSs’ per ’euro spent on aerial CSs’. The number will be large with a low aerial CS cost, which is paid hourly, and the cost will be low if there are few aerial CSs in the operation. This might be good in the short term, but it shows that the KPI representing the stakeholder is too narrow to really represent their interests, which go beyond this representation, like having the business case of providing aerial CSs’ services. This shows difficulties with representing stakeholders with the right KPIs from the operation, especially when their interests expand to other life cycle parts beyond the operation.
Since stakeholder 1 (Incident Commander) has a value function distribution always close to 1, it means they are easily satisfied. This is in contrast with stakeholder 3 (Aerial Service Business), which has most of the results close to 0.2, rarely being satisfied. The KPI Saved Area is often large in the simulations; see Figure 14 where their distribution is plotted against a value function with all KPIs having equal weight. Since Saved Society is correlated with Saved Area (see correlation matrix Figure 6) and the Incident Commander only has those two KPIs in their value function, it will most often be close to 1.
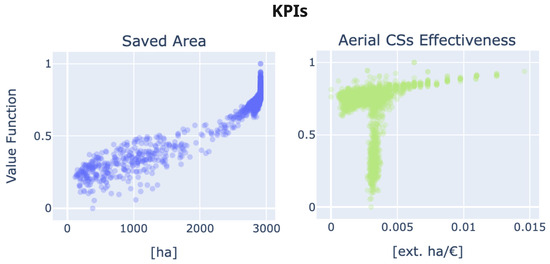
Figure 14.
Two KPI distributions, Saved Area and Aerial Effectiveness, when all KPI weights are equal.
The KPI Aerial Efficiency is often low during the simulations (see Figure 14), which contributes to Aerial Service Business having low value function results. It is most often around 0.003 ext.ha/EUR, which is 20% of its maximum value 0.015 ext.ha/EUR, the same percentage as stakeholder 3’s most common value function value. The KPI is low due to the high hourly cost of EUR 1369 (see Table 2), and any increase in cost without a proportional increase in area leads to low efficiency. Efficiency KPIs are the most sensitive to design choices and tend to be low and skewed because costs scale faster than the area saved. An insight from this is that it is important to have a rigorous analysis of the KPIs in the model and the reasons behind their results.
The outcomes of the case study consist of insights related to composition, configuration, and control. Composition is represented as rough estimates of the appropriate types and number of ground and aerial CSs, and configuration as intervals of response times. The control aspect, including time between situation assessments as well as strategy choice (which can also be considered a part of configuration), does not have any notable impact on the results of the operation.
5. Discussion
The discussion starts with an analysis of the method and how it relates to other work presented in the background, followed by a discussion of the case study results.
5.1. Method
This work combines various methods to fulfill the purpose of connecting the interests of a broad range of stakeholders to SoS architecture design. The methods are not new, but the combinations of them are. Within the three steps of the method, (1) Use Case and Stakeholder Analysis, (2) Modeling and Simulation, and (3) Results and Analysis, these are the contributions:
- Use Case and Stakeholder Analysis
- Usage of Mission Engineering [16] KPI levels of Measures of Success, Measures of Effectiveness, and Measures of Performance, as representations of stakeholder interests in the operational stage of the SoSs life cycle.
- New classification of stakeholders and their connection to the SoS operation by an Involvement Circle consisting of Operation Executors, Operation Managers, and Impacting or Impacted.
- Modeling and Simulation
- Agent-based modeling to represent the SoS as a group of agents showing the typical SoS characteristics of emergence, geographical distance, operational and managerial independence, and evolutionary behavior [26].
- Explore the SoS architecture during the operation in terms of composition, configuration, and control [15].
- Results and Analysis
- Usage of value-model theory [17] in aggregating the operational KPIs to a singular value for every simulation for each stakeholder.
These methods, in combination with more general and classical methods of stakeholder interviews, Design of Experiments, and sensitivity analysis, result in a useful method for inclusive SoS analysis. It can be used for early-stage processes in CS (product) development, to first acquire a high coverage stakeholder understanding in the SoS operation, to withdraw SoS requirements, before continuing with CS development. This refers to Steps 1–3 in the Holistic SoS Design Process [5]. That method also encourages inclusion of broader factors such as geopolitics, threats, and technologies, which is something that can be represented as KPIs in the operation, perhaps with the same method as to involve enabling systems in the SoS analysis, as done in [17]. Both the Holistic SoS Design Process and Inclusive SoS Analysis are analytical methods of the operational life cycle stage. Found in this work is that stakeholders of the operational stage can have interests reaching beyond the operation, and that these interests are important to be accurately transformed into specific KPIs to be measured during the operation. Therefore, it is important to trace the stakeholder interests being transformed to KPIs in a systematic way, for example, with the use of ontology [12], QFD [21], or Goal-Requirement Language [24].
Another use case of the Inclusive SoS Analysis method is for continuous SoS analysis, which is the use case for the Wave Model [36]. This corresponds with the SoS engineering key characteristic being that it should represent the evolution, ongoing analysis, and adaptability of the SoS, where the engineering should be done in an iterative approach. On that note, the Inclusive SoS Analysis method fits in the second and third steps, i.e., Conduct SoS Analysis and Develop SoS Architecture, to both analyze the as-is SoS as well as explore various new architectures. The Inclusive SoS Analysis models an operation such as in Mission Engineering but is expanded by explicitly integrating a broader set of stakeholders, and quantifying their interests through weighted KPIs. Another difference is the exclusion of specific tools such as Capella or Cameo that require specific skills, making it particularly useful for early-stage analysis or for individuals who are not professional SoS developers.
This approach’s demonstrated applicability in the wildfire fighting case study suggests that SoS engineering could become more relevant and applicable beyond traditional product development, particularly for actors working with complex systems in other domains. In such contexts, methods with lower barriers for specific tools and skills can be especially valuable. There is still a need for agent-based modeling and data analysis skills, but they are more general skills and used in many domains.
This work’s most significant contribution, the Inclusive SoS Analysis method for early-stage SoS design and inclusive SoS development processes, can be used in a broad range of scenarios—such that are similar to the wildfire fighting case study, for example. There was interest among the stakeholders, not professional SoS developers, to show which strategies were more successful in the operation using the presented method. The method can be expanded to other use cases where the operation is in a SoS context and there is a broad range of stakeholders, such as other emergency services, but also more everyday societal services, such as energy systems and food production. It could also be adapted to scenarios with larger time horizons (weeks or months rather than days).
5.2. Case Study
The case study showed an application of the method to a wildfire fighting scenario. It was semi-fictional because the scenario and stakeholder identification were based on real stakeholder interviews, but the continued work was never validated with the stakeholders, and the results were not applied in a real situation.
The greatest insight was that it is important that the stakeholders’ interests can be correctly transformed into KPIs to be used in the model. The KPIs should be validated and updated in an iterative way in parallel with developing the model, visualized by the arrow from step 2 to 1 in Figure 1. This insight came from the results of Stakeholder 3 Aerial Service Business not aligning with its longer-term interests. The same applies to Stakeholder 2 National Fire Agency, who have more complex incentives that extend longer-term than their KPI representations during operation. Stakeholders’ interests from other life cycle stages than the operation could be handled by extracting the KPI results from the operation to be used in the analysis of other connecting life cycle stages.
Engaging stakeholders at various stages ensures that their perspectives are accurately represented and that the model remains aligned with real-world conditions. Validation with stakeholders should be an ongoing process throughout the study. The method would benefit from adding validating steps in steps 1 and 2 of the model. In step one, the validation should be of the KPIs to represent the stakeholders’ interests in the operation, to inform whether they should be modeled in a different way, or if they cannot be quantified. In step two, the model should be validated to ensure the simulation outcomes have the right level of fidelity and results similar to real case scenarios. The validation is therefore something to be added in the iterative process between steps 1 and 2 in the method.
The results gave an indication of desirable SoS architecture—which design variables have the most impact on the results, and which values the design variables should have to satisfy a stakeholder. For example, the response time was the most important design variable for all stakeholders, and it should be less than 100 min to ensure satisfying results. An insight regarding combinations of design variables was, for example, that a short response time increases the risk of Stakeholder 3 (Aerial Service Business) having the worst value function result. At the same time, a low response time, when combined with a high proportion of ground CSs, represents the only scenario that enables high results.
The use of a correlation matrix was beneficial for filtering out the important design variables to keep or remove in the continuing analysis. The plotted results were informative, though incorporating a trade-off analysis and filtering function could provide more valuable insights. Conflicting or synergistic interests could be shown by the effects on the other stakeholders if the SoS architecture were chosen to increase one stakeholder’s value function by 0.1 points.
The stakeholders’ positions in the Involvement Circle do not explain the differences in their value function results. While those closer to the center showed higher values, this was due to the selected KPIs rather than their operational roles. The circle serves more as an overview of stakeholder involvement than as a predictor of outcomes, though it can be useful for analyzing stakeholder importance and synergies.
There is no straightforward way to draw conclusions regarding the optimal SoS architecture. However, the method provides valuable insights into which design variables are most influential, the value ranges required to satisfy different stakeholders, and which SoS architecture would be most valuable for them.
6. Conclusions
This work presents a novel method for early-stage System-of-Systems (SoS) development processes connecting stakeholder interests to SoS architectures, with a special focus on the inclusion of a broad range of stakeholders in all stages. The Inclusive SoS Analysis method has possible usage for Constituent System (CS) development, but with even greater potential for continuous SoS design and improvement. The main contribution of this work is the combination of methods into one framework for SoS analysis.
In the method’s first step, Use Case and Stakeholder Analysis, stakeholders are classified according to a new categorization of an Involvement Circle consisting of Operation Executors, Operation Managers, and those being Impacting or Impacted. To represent their interests, the Mission Engineering classification of KPIs is used. In the Modeling and Simulation step, an agent-based model is developed to simulate the most important SoS characteristics. The simulations are varied according to the SoS architecture definition of composition, configuration, and control. The Results and Analysis step uses value-model theory to combine the stakeholders’ KPIs in a value function to represent their combined satisfaction level, which can be compared between stakeholders. This helps to identify how the KPIs affect the value function results and, most importantly, which design variables of the SoS should have which values to satisfy which stakeholders.
The method was applied to a semi-fictional case study of wildfire fighting SoS with two types of CSs. The results show which design variables are most influential, the value ranges required to satisfy different stakeholders, and which SoS architecture would be most valuable for them. The diverse interests of a broad set of stakeholders can be complicated to interpret, but that only means there should be more attempts to design systematic methods to do the analysis.
An important next step is to further validate the method. Future work should include validation of the first two phases: (1) confirming that the KPIs represent stakeholder interests accurately and (2) validating that the model captures use cases realistically, perhaps through a longitudinal case study in wildfire fighting or another fitting context.This should be done by tracing stakeholder interests to the KPIs represented in the model. Since stakeholders’ interests can reach beyond the operational life cycle stage of the SoS as well as be complex, tools such as Goal-Requirement-Language, Quality-Function-Deployment, or ontology should be explored. Validation may also be done in the form of face validation through workshops and discussions with the engineering community.
Author Contributions
Conceptualization, R.Z. and L.K.F.; methodology, R.Z.; software, R.Z.; validation, R.Z.; formal analysis, R.Z.; investigation, R.Z.; resources, R.Z.; data curation, R.Z.; writing—original draft preparation, R.Z.; writing—review and editing, R.Z.; visualization, R.Z.; supervision, L.K.F.; project administration, L.K.F. All authors have read and agreed to the published version of the manuscript.
Funding
This research was funded by the European Union under Grant Agreement no 101097120.
Institutional Review Board Statement
Not applicable.
Informed Consent Statement
Informed consent was obtained from all subjects involved in the study.
Data Availability Statement
NetLogo wildfire fighting model available at URL (accessed on 22 May 2025): https://github.com/rosannazimdahl/NetLogoWildfireFighting.
Acknowledgments
The authors would like to acknowledge the contributions of colleagues from Linköping University: Christopher Jouannet, who provided guidance during the work, Felipe Villas, who contributed to discussions, Jorge, who presented the tool NetLogo, Petter Krus, who advised on data analysis, and Ethan Witwer, who reviewed a draft of this article.
Conflicts of Interest
The authors declare no conflicts of interest.
References
- Richardson, K.; Steffen, W.; Lucht, W.; Bendtsen, J.; Cornell, S.E.; Donges, J.F.; Drüke, M.; Fetzer, I.; Bala, G.; von Bloh, W.; et al. Earth beyond six of nine planetary boundaries. Sci. Adv. 2023, 9, eadh2458. [Google Scholar] [CrossRef] [PubMed]
- Beihoff, B.; Oster, C.; Friedenthal, S.; Paredis, C.; Kemp, D.; Stoewer, H.; Nichols, D.; Wade, J. A World in Motion—Systems Engineering Vision 2025; International Council on Systems Engineering: San Diego, CA, USA, 2014. [Google Scholar]
- Adams, K. Systems principles: Foundation for the SoSE methodology. Int. J. Syst. Syst. Eng. 2011, 2, 120–155. [Google Scholar] [CrossRef]
- Saunders, T.; Croom, C.; Austin, W.; Brock, J.; Crawford, N.; Endsley, M.; Glasgow, E.; Hastings, D.; Levis, A.; Murray, R. System-of-Systems Engineering for Air Force Capability Development: Executive Summary and Annotated Brief; USAF Scientific Advisory Board: Arlington, VA, USA, 2005; p. 98. [Google Scholar]
- Staack, I.; Amadori, K.; Jouannet, C. A holistic engineering approach to aeronautical product development. Aeronaut. J. 2019, 123, 1545–1560. [Google Scholar] [CrossRef]
- Henshaw, M. Good Practice in Systems of Systems Engeneering (SoSE); NATO Science & Technology Organization: Brussels, Belgium, 2015. [Google Scholar]
- Maier, M.W. Architecting principles for systems-of-systems. Syst. Eng. 1998, 1, 267–284. [Google Scholar] [CrossRef]
- Seal, D. The Model-Based Engineering (MBE) Diamond: A Framework for Digital Transformation. In Proceedings of the INCOSE International Workshop 2020, San Diego, CA, USA, 25–28 January 2020. Approved for Public Release (RROI 19-00371-BDS). [Google Scholar]
- Dahmann, J.S. Systems of Systems Engineering Life Cycle; EN-SCI-276-04; NATO Science & Technology Organization: Brussels, Belgium, 2015. [Google Scholar]
- Bonanne, K.H. A Model-Based Approach to System-of-Systems Engineering via the Systems Modeling Language. Master’s Thesis, Purdue University, West Lafayette, IN, USA, 2014. [Google Scholar]
- Dahmann, J.S.; Parasidis, G.I. Mission Engineering. ITEA J. Test Eval. 2024, 45, 1001–1015. [Google Scholar] [CrossRef]
- Knöös Franzén, L.; Staack, I.; Krus, P.; Jouannet, C.; Amadori, K. A Breakdown of System of Systems Needs Using Architecture Frameworks, Ontologies and Description Logic Reasoning. Aerospace 2021, 8, 118. [Google Scholar] [CrossRef]
- Fang, Z. System-of-Systems Architecture Selection: A Survey of Issues, Methods, and Opportunities. IEEE Syst. J. 2022, 16, 4768–4778. [Google Scholar] [CrossRef]
- Brook, P. The Role of Architecting in Systems of Systems; EN-SCI-276-04; NATO Science & Technology Organization: Brussels, Belgium, 2015. [Google Scholar]
- DeLaurentis, D.A.; Moolchandani, K.; Guariniello, C. System of Systems Modeling and Analysis; CRC Press: Boca Raton, FL, USA, 2022. [Google Scholar] [CrossRef]
- Office of the Under Secretary of Defense for Research and Engineering. Mission Engineering Guide; Office of the Under Secretary of Defense for Research and Engineering: Washington, DC, USA, 2020. [Google Scholar]
- Boggero, L.; Bussemaker, J.H.; Donelli, G.; Torrigiani, F.; Nagel, B. Processes, methods and tools supporting the development of aeronautical systems. In Proceedings of the 34th Congress of the International Council of the Aeronautical Sciences, ICAS 2024, Firenze, Italy, 9–13 September 2024. [Google Scholar]
- Santos, D.S.; Oliveira, B.R.N.; Kazman, R.; Nakagawa, E.Y. Evaluation of Systems-of-Systems Software Architectures: State of the Art and Future Perspectives. ACM Comput. Surv. 2022, 55, 67. [Google Scholar] [CrossRef]
- Lovaco, J.; Staack, I.; Krus, P. Environmental Agent-Based Modelling For A Firefighting System Of Systems. In Proceedings of the 33rd Congress of the International Council of the Aeronautical Sciences, Stockholm, Sweden, 4–9 September 2022. [Google Scholar]
- SEBoK Editorial Board. The Guide to the Systems Engineering Body of Knowledge (SEBoK), v. 2.11. 2024. Available online: https://www.sebokwiki.org (accessed on 22 April 2025).
- Kiran, D. Chapter 30—Quality Function Deployment. In Total Quality Management; Kiran, D., Ed.; Butterworth-Heinemann: Oxford, UK, 2017; pp. 425–437. [Google Scholar] [CrossRef]
- Dahmann, J.; Rebovich, G.; Lane, J.; Lowry, R. System Engineering Artifacts for SoS. Aerosp. Electron. Syst. Mag. IEEE 2011, 26, 22–28. [Google Scholar] [CrossRef]
- ISO15288; Systems and Software Engineering—System Life Cycle Processes. International Organization for Standardization: Geneva, Switzerland, 2023. Available online: https://www.iso.org/standard/81702.html (accessed on 11 May 2025).
- Negri, P.; Silva Souza, V.; Leal, A.; Falbo, R.; Guizzardi, G. Towards an Ontology of Goal-Oriented Requirements. In Proceedings of the 20th Iberoamerican Conference on Software Engineering (CIbSE 2017), Buenos Aires, Argentina, 22–23 May 2017. [Google Scholar]
- Systems Innovation Network. 2025. Available online: https://www.systemsinnovation.network/ (accessed on 11 May 2025).
- Dahmann, J.S. Systems of Systems Characterization and Types; NATO Science & Technology Organization: Brussels, Belgium, 2015. [Google Scholar]
- MSB. EU and Civil Protection. Available online: https://www.msb.se/en/about-msb/international-co-operation/cooperation-with-eu/eu-and-the-civil-protection-cooperation/ (accessed on 11 May 2025).
- MSB. Skogsbranden i Västmanland 2014: Observatörsrapport. Available online: https://www.msb.se/sv/publikationer/skogsbranden-i-vastmanland-2014–observatorsrapport/ (accessed on 11 May 2025).
- Sandahl, L. (Linköping University, Linköping, Östergötland, Sweden). Interview by Rosanna Zimdahl. Personal interview, 2024. [Google Scholar]
- Lind, C. (Linköping University, Linköping, Östergötland, Sweden). Interview by Rosanna Zimdahl. Personal interview, 2024. [Google Scholar]
- Rubenstein, A. (Linköping University, Linköping, Östergötland, Sweden). Interview by Rosanna Zimdahl. Personal interview, 2024. [Google Scholar]
- Tuscana, R. La Lotta Attiva Agli Incendi Boschivi; Press Tuscany Region Council Press Center: Firenze, Italy, 2011. [Google Scholar]
- Granström, A.; Sjöström, J.; Vylund, L. Perception of wildfire behaviour potential among Swedish incident commanders, and their fire suppression tactics revealed through tabletop exercises. Wildland Fire 2023, 32, 320–327. [Google Scholar] [CrossRef]
- Åke Björklund, J.; Kaiser, M. Skogsbränderna Sommaren 2018: Betänkande av 2018 års Skogsbrandsutredning; Statens Offentliga Utredningar SOU 2019:7; Regeringskansliet: Stockholm, Sweden, 2019. [Google Scholar]
- Granström, A. (Linköping University, Linköping, Östergötland, Sweden). Interview by Rosanna Zimdahl. Personal interview, 2024. [Google Scholar]
- Dahmann, J.; Rebovich, G.; Lowry, R.; Baldwin, K. An Implementers’ View of Systems Engineering for Systems of Systems. Aerosp. Electron. Syst. Mag. IEEE 2011, 27, 212–217. [Google Scholar] [CrossRef]
Disclaimer/Publisher’s Note: The statements, opinions and data contained in all publications are solely those of the individual author(s) and contributor(s) and not of MDPI and/or the editor(s). MDPI and/or the editor(s) disclaim responsibility for any injury to people or property resulting from any ideas, methods, instructions or products referred to in the content. |
© 2025 by the authors. Licensee MDPI, Basel, Switzerland. This article is an open access article distributed under the terms and conditions of the Creative Commons Attribution (CC BY) license (https://creativecommons.org/licenses/by/4.0/).