Article

Digital Economy, Government Innovation Preferences, and Regional Innovation Capacity: Analysis Using PVAR Model

1
School of Innovation and Entrepreneurship, Zhejiang University of Finance and Economics Dongfang College, Haining 314408, China
2
School of Business, Nanjing University, Nanjing 210008, China
3
The College of Urban & Environmental Sciences, Central China Normal University, Wuhan 430079, China
4
Key Laboratory for Geographical Process Analysis & Simulation in Hubei Province, Central China Normal University, Wuhan 430079, China
5
School of Foreign Languages, Zhejiang University of Finance and Economics Dongfang College, Haining 314408, China
*
Authors to whom correspondence should be addressed.
Systems 2025, 13(5), 382; https://doi.org/10.3390/systems13050382
Submission received: 28 March 2025 / Revised: 4 May 2025 / Accepted: 15 May 2025 / Published: 16 May 2025

Abstract

:
Digital technology drives global industrial transformation. The synchronized development of organizational digital transformation and innovation systems is pivotal in corporate strategy and governmental governance. The dynamic interaction mechanisms among digital economy, government innovation policy, and regional innovation capacity remain insufficiently explored. This study employs panel data from 15 prefecture-level cities within the Yangtze River Delta urban agglomeration, spanning the years 2012 to 2020, and uses the panel vector autoregression (PVAR) model to investigate the interrelationships among the digital economy, government innovation preferences (the government’s supportive attitude and policy inclination towards innovative activities in the fields of science and technology as well as economic development), and regional innovation capacity. This research emphasizes the impact of the digital economy on regional innovation capacity and the influence of government innovation preferences on regional innovation capacity. The findings indicate that both the digital economy and government innovation preferences significantly enhance technological and product innovation, with this effect being particularly pronounced in the initial stages but diminishing over time. The three dimensions of the digital economy exert varying effects on technological and product innovation. Specifically, digital application has the most substantial impact on technological innovation, whereas infrastructure has a more pronounced effect on product innovation. Overall, the influence of government innovation preferences on technological and product innovation is less significant than that of the digital economy. The intensity of government innovation preferences has a greater impact than does the structure of government innovation preferences; however, in the long term, the structure of government innovation preferences can exert a more stable and sustainable influence. This study offers policy implications for constructing an innovation ecosystem driven by the synergy between government and market forces, particularly in optimizing data governance systems and planning sustainable transformation pathways, which hold practical value.

1. Introduction

Against the backdrop of global digital transformation, the digital economy has become a key factor for countries to enhance their innovation capacity and promote high-quality economic development. With the popularization of digital technology in China, the digital economy has gradually penetrated various industries and has had a far-reaching impact on regional innovation capacity [1]. Especially in the Yangtze River Delta (YRD) city cluster, the digital economy not only promotes the upgrading of traditional industries, but also provides a new impetus for technological innovation and product innovation in the region. The Yangtze River Delta Urban Agglomeration is the most economically developed and urbanized region in China, creating approximately a quarter of China’s total economic output [2]. According to statistics, the total digital economy of the YRD region accounted for 44% of the region’s total economic output in 2020 [3], a phenomenon that highlights the important role of the digital economy in driving regional economic transformation. Government innovation preference, as an important part of the regional innovation system, has become a key policy tool for enhancing regional innovation capacity. Through policy support and financial incentives, local governments can effectively promote the application of digital technologies and the implementation of technological innovations, thereby enhancing a region’s innovation capacity [4,5].
Existing academic research on the interaction mechanisms among the digital economy, government innovation preferences, and regional innovation capacity has focused primarily on four key areas, as follows: (1) Examining the impact of the digital economy on regional innovation capacity, thereby providing a foundation for policies aimed at moderating the development of the digital economy. This includes considering regional differences, optimizing infrastructure development according to local conditions, and harnessing the potential of the digital economy to increase regional innovation capacity [6,7,8,9,10]. (2) Research on the mechanisms of government innovation preferences. As a policy variable, government innovation preference plays a key role in the development of the digital economy and the enhancement of regional innovation capacity [11,12,13,14]. (3) Research on interaction mechanisms from the perspective of systems theory. Scholars have begun to adopt the perspective of systems theory and systems thinking to scrutinize the interactive complexity of the digital economy, government policy, and regional innovation [15,16,17,18]. (4) Digital economy, government innovation preferences, and the dynamic evolution of regional innovation capabilities [19,20,21,22]. This study uses static regression models to analyze the impact of the digital economy or government innovation preferences on innovation capacity. Therefore, the construction of a dynamic analytical framework to reveal the long-term interaction between the digital economy, government innovation preferences, and regional innovation capacity is a problem that needs to be solved in current research.
However, systematic research on the interaction effect of the digital economy and government innovation preferences on regional innovation capacity is still limited, and there are research gaps. First, a systematic analytical framework is lacking. Existing studies mainly use static regression analysis and dynamic modeling methods to analyze the interaction between the digital economy and government innovation preferences, and its impact on innovation capacity. Second, the impact of the time dimension was neglected. Most studies focus on short-term innovation impacts and fail to reveal the long-term dynamic evolution mechanism of the digital economy and government innovation preferences regarding regional innovation capacity. Finally, the policy applicability is weak. Existing studies are mostly based on theoretical analyses and are less commonly combined with empirical data to assess the long-term effectiveness of government innovation policies, resulting in a lack of targeted policy recommendations.
On the basis of the above issues, this study examines the dynamic interactive relationship between the digital economy and government innovation preference under the framework of system theory, and constructs a PVAR model to reveal the mechanism of its influence on regional innovation capability. This study aimed to address the following key questions:
(1)
What are the mechanisms through which the digital economy and government innovation preferences affect regional innovation capabilities?
(2)
What are the interactive effects of the digital economy and government innovation preferences on technological and product innovation?
(3)
How do the effects of the digital economy and government innovation policies on regional innovation capabilities vary across time dimensions?
This study fills the gaps in the literature through systematic analysis, and provides policymakers with more precise suggestions for digital economy development and innovation-driven strategies. In this study, we analyze the panel data of 15 prefecture-level cities in the Yangtze River Delta city cluster from 2012 to 2020 to explore the impacts of the digital economy and government innovation preferences on regional innovation capacity. By applying the PVAR model, we can not only deeply analyze the respective roles of the digital economy and government innovation preferences in promoting technological and product innovation, but also systematically reveal the interactive effects between the two. Additionally, this study examines the changes in these effects under different time dimensions to further understand how the digital economy and government innovation policies enhance regional innovation capacity under synergistic effects. The contributions of this study are as follows: first, to comprehensively explore the interaction between the digital economy and government innovation preferences from a systematic perspective; second, to adopt the PVAR model to analyze its long-term and short-term impacts on regional innovation capacity; and third, to provide new theoretical bases and policy recommendations for promoting the enhancement of regional innovation capacity and the development strategy of the digital economy.
The structure of this paper is as follows: the Section 2 reviews the literature related to the digital economy, government innovation preferences, and regional innovation capacity, and highlights the gaps and limitations of existing research; the Section 3 presents the research model and data sources of this paper; the Section 4 presents the results of the empirical analysis; and finally, the Section 5 summarizes the main conclusions of this paper and proposes policy recommendations.

2. Literature Review

In recent years, academics have conducted a series of studies on the dynamic interaction mechanisms of the digital economy, government innovation preferences, and regional innovation capacity from a systemic perspective. These studies involve the following four aspects.

2.1. Mechanism of Digital Economy’s Influence on Regional Innovation System

Current research argues that the digital economy, as an open, dynamic, and adaptive economic system, is capable of operational efficiency through technology diffusion, the optimization of factor allocation, and reconfiguration of the innovation ecosystem [23,24]. First, digital technologies have contributed significantly to upgrading regional innovation systems. Tian et al. studied how the digital economy promotes regional innovation capacity through system spillovers, and reported that it not only improves the efficiency of the local innovation system [25]. Xu and Li noted that the development of the digital economy system is not a balanced process, and that there are significant differences in the degrees of its role in the innovation ecosystems of different regions, especially in regions with optimized industrial structures or higher levels of urbanization, where the digital economy’s driving effect on the innovation system is more prominent [26]. Kanbur et al. further refined the core components of the digital economy system and explored its heterogeneous impact on regional innovation systems. The study shows that digital applications facilitate the construction of technological innovation systems mainly by enhancing information mobility, whereas digital infrastructure provides fundamental support for product innovation systems [27]. Second, the digital economy reconfigures the traditional method of allocating production factors through the mobility of data elements, thus enhancing the regional innovation system. Zhang et al.’s measurements based on Chinese city data show that the digital economy enhances overall innovation efficiency by reducing information asymmetry [28]. Moreover, Subramanian et al. showed that blockchain technology can reduce the financing cost of SMEs and alleviate the financial constraints of their innovation activities [29]. Finally, digital technologies drive innovation ecosystems to progress, thereby enhancing regional innovation systems [30]. Li et al. emphasized that digital innovation ecosystems are designed to promote sustainable social and economic development by building a dynamic, collaborative digital innovation environment that is flexible and responsive to change [31]. Wang et al. noted that in the construction industry, digital technologies make the innovation ecosystem more flexible and dynamic [32]. Therefore, from a systemic perspective, the digital economy not only affects regional innovation capacity as an independent variable, but is also a key component of the innovation system, which can reconfigure the pattern of innovation resource allocation and make the regional innovation system more efficient, interconnected, and dynamic.

2.2. Role Mechanism and Influence Path of Government Innovation Preference on Regional Innovation System

As an important intervention subject in regional innovation systems, the government’s innovation preference directly affects resource allocation and the orientation of innovation activities within the system [33]. Ye and Zeng reported that the influence path of government innovation preference on regional innovation systems can be carried out through three levels: financial support, policy incentives, and institutional optimization [34]. First, in terms of financial support, direct R&D subsidies and tax incentives can alleviate the financial constraints on firms’ innovation activities. For example, empirical studies by Hu et al. show that increased government investment in R&D subsidies can lead to an increase in firms’ patent output [35]. Second, from the perspective of policy incentives, good policy incentives can guide the direction of innovation. Dai and Chapman [35] believe that the government, through a series of policy incentives, can effectively guide the innovation body to focus its innovation activities in the direction of national or regional strategic needs [36]. In addition, governments optimize regional innovation ecosystems through institutional construction. Belderbos et al. argue that stronger IPR enforcement leads to higher returns on regional R&D investments [37]. Zhang et al. further propose that the role of government innovation preference in regional innovation systems can be categorized into innovation preference intensity and innovation preference structure. Innovation preference intensity has a more pronounced effect on the improvement of the short-term efficiency of the innovation system, whereas innovation preference structure has a greater effect on the stability of the system in the long run [38]. Therefore, from a systemic perspective, government innovation preferences need to balance short-term stimuli with long-term stability, and optimize the distribution of innovation resources throughout the system to achieve dynamic stability.

2.3. Synergy Between the Digital Economy and Government Innovation Preferences in the Innovation System

In recent years, research has begun to focus on how the digital economy system and government innovation policy system interact with each other to jointly drive the evolution of regional innovation systems [39]. Under the framework of regional innovation system theory, government policy regulation amplifies the facilitating effect of the digital economy on innovation capacity. For example, Zhang and Zhao argued that the government enhances the adaptability of firms to the digital economy system through policy tools, which in turn facilitates the flow and reorganization of innovation resources throughout the system [40]. Luo et al. used a model to analyze the level of cities in China and reported that government-related policies play a significant role in promoting the economic level of cities [41]. Dou and Gao’s study, which was based on the innovation activities of manufacturing firms in China, reported that government policies influence manufacturing firms’ green innovation [42]. However, some studies have noted that the role of government policies has a nonlinear characteristic; that is, in the early stage of the innovation system, government intervention can effectively stimulate market dynamics, but in the mature stage of the innovation system, excessive intervention may reduce the system’s self-organizing innovation capacity, thus weakening the market’s guiding role in innovation [43,44]. In addition, existing studies have not yet fully explored the feedback mechanism between the government innovation policy system and the digital economy system, that is, how they have positive or negative circular effects on the evolution of the innovation system. Therefore, future research should incorporate system dynamics modeling or structural equation modeling to explore how the innovation system dynamically evolves in different regions under government policy intervention.

2.4. Long-Term Dynamic Evolution of the Digital Economy, Government Innovation Preferences and Regional Innovation System

Most existing studies use static regression models to analyze the impact of the digital economy or government innovation preferences on the innovation system, but few studies have investigated the long-term dynamic interaction mechanism among the three. Yousaf et al. studied the realization of digital innovation in developing countries through the sustainable enhancement of innovation systems through the digital economy [45]. Cooke et al. reported that the digital economy can significantly enhance innovation output in the early development stage of the regional innovation system; however, as the innovation system enters the maturity stage, this facilitating effect may weaken, or even enter the stage of diminishing returns [46]. Yin et al. constructed a case of industrial transformation through green innovation in the manufacturing industry via a pressure-state-response system [47]. Khattak et al. noted that the impact of government innovation preferences on the innovation system is not linear, and that overintervention may lead to an increase in the complexity of the system, which in turn affects the self-adaptive capacity of the innovation ecosystem [48]. Therefore, the adoption of a system modeling approach to reveal the dynamic feedback relationships among the digital economy, government innovation preferences, and regional innovation capacity in different time dimensions is an urgent issue for current research.
While extant research has examined the influence of the digital economy and governmental innovation preferences on regional innovation systems from diverse perspectives, several research gaps persist. First, a comprehensive analytical framework is lacking. Current studies predominantly utilize static regression methods and infrequently employ system modeling approaches for analysis. Second, the dynamic evolution of the system is often overlooked. Most research concentrates on short-term innovation impacts and fails to elucidate how the digital economy and governmental innovation preferences influence the long-term functioning of the innovation system. Third, the regulatory mechanisms of the system remain unclear. Existing studies pay insufficient attention to the time-varying characteristics of policy effects, such as evolving policy impacts over time [49,50,51]. These studies discuss how governments can optimize innovation policies at various stages to maintain an appropriate level of intervention in the regional innovation system. In response to these gaps, this paper constructs a PVAR model within the framework of system theory to examine the dynamic interaction between the digital economy and governmental innovation preferences from a systemic perspective, thereby revealing its systematic impact on regional innovation capacity. It offers more precise strategic recommendations for the development of the digital economy and innovation-driven strategies for policymakers, and optimizes the government’s regulatory mechanism in promoting the regional innovation system.

3. Research Design

3.1. Selection of Indicators

3.1.1. Regional Innovation Capacity

Regional innovation capacity has emerged as a pivotal determinant of a region’s core advantages in the context of escalating global competition. This capacity is indicative of the volume of innovation output generated by innovation entities within specific innovation environments and resource allocation conditions. Henderson and Cockburn proposed a classic framework in AMJ, which pointed out that R&D investment only constitutes the input of production factors for innovation activities, while output indicators such as patents can capture the “combinatorial creativity” of knowledge production [52]. This theory emphasizes that the essence of innovation capability lies in transforming R&D resources into new knowledge with market value, and this transformation process is mediated and regulated by organizational routines and recombination capabilities. When measuring innovation efficacy rather than input scale, output indicators are theoretically necessary. Therefore, numerous studies have explored the measurement of regional innovation capacity, employing a variety of measurement variables. Predominantly, scholars have opted to represent regional innovation capacity through innovation output, with common indicators including the number of patents [53] and the output value of new products [54]. The number of patents serves as a reflection of technological innovation capacity, representing intermediate products of innovation output and indicating the intensity of technological development activities. A greater number of patent applications correlates with greater societal innovation capacity and dynamism. Conversely, the output value of new products reflects product innovation capacity, which encompasses three elements: technology (technical details and consequences), usability (relative product advantages and compatibility), and finance (profitability and financial feasibility). This metric primarily refers to the total production value of products that have undergone significant improvements in structure, materials, processes, or other aspects, thereby enhancing product performance or expanding usage functions through the adoption of new technological principles or design concepts. This reflects the ability to convert scientific and technological advancements into economic value [54]. Consequently, this paper employs the number of patent applications and the output value of new products from large and medium-sized enterprises as two indicators to depict regional innovation capacity, focusing on the aspects of innovation development (technological innovation) and innovation transformation (product innovation) capabilities.

3.1.2. Digital Economy

As the digital economy increasingly contributes to high-quality economic development, assessing the extent of digital economy development has emerged as a significant topic of interest for both the academic and industrial sectors globally [55]. Since 2014, the European Union has introduced the digital economy and society index (DESI) to evaluate the digital economy status of its member states [56]. This index comprises 32 secondary indicators across four primary domains: digital skills, digital infrastructure, the digital transformation of enterprises, and the digitalization of public services. In 2016, the Digital Economy Board of Advisors (DEBA) of the US Department of Commerce, in its inaugural report, categorized the digital economy into four principal aspects: the extent of digitalization within the economic system, the impact of digitalization on economic activities and output, the combined effect on economic indicators such as nominal GDP and CPI, and the monitoring of emerging digital fields [57]. In 2017, the China Academy of Information and Communications Technology introduced the digital economy index (DEI) in its white paper on the development of China’s digital economy, which employs big data investment and financing, mobile internet access traffic, and the market size of cloud computing services as primary indicators to construct a digital economy indicator system [58]. The Global Digital Economy Competitiveness Index, released by the Shanghai Academy of Social Sciences in 2017, primarily utilizes a comparative method to quantitatively evaluate the digital economy development levels of countries worldwide, focusing on four dimensions: digital facilities, digital industries, digital innovation, and digital governance [59].
In conclusion, various domestic and international institutions prioritize different aspects when assessing the digital economy. Nonetheless, the infrastructure of the digital economy, digital applications, and investment in talent are consistently included in the indicator systems. Additionally, ICT, along with digital governance and services, is frequently highlighted. Therefore, based on existing research, this paper selects representative indicators for each dimension, combines the DESL and other indicator systems, and references literature on measuring the level of digital economic development [60,61,62] to systematically collect, classify, and deeply compare and analyze the advantages and disadvantages of each representative indicator. Finally, it selects infrastructure, talent investment, and digital application as three dimensions to measure the level of digital economic development, covering the main contents and structural characteristics of the digital economy up to 2020, and has strong representativeness and explanatory power [63,64].

3.1.3. Government Innovation Preferences

Local governments serve as the primary entities in the development of regional innovation systems and significantly influence regional innovation activities, primarily through fiscal expenditures [65]. The government’s innovation preference indicates its support for the establishment of regional innovation systems and its emphasis on technological innovation activities. Liu [66] and Zhao et al. [67] employed the proportion of science and technology expenditures within local fiscal expenditures to represent governmental support for regional innovation activities, considering the allocation structure of fiscal funds. This approach is widely recognized in the academic community as the standard method for assessing government innovation preference. Furthermore, from the perspective of fiscal expenditure intensity, Sarpong et al. [68] examined the scale of government fiscal investment in science and technology, drawing on the construction logic of the R&D investment intensity index. They innovatively utilized the proportion of fiscal science and technology investment in GDP to describe the government’s innovation preference, defining it as the government’s innovation preference intensity. Building on the previous literature, this paper characterizes government innovation preference in two distinct dimensions: government innovation preference intensity and the government innovation preference structure. The relevant indicators and variables are detailed in Table 1.

3.2. Data Sources and Processing

In conducting quantitative analysis through statistical methods, it is imperative to base the analysis on a substantial dataset, taking into account both the availability and validity of the data. Data spanning from 2012 to 2020, encompassing a total of nine years, were selected for this purpose. The use of only time series data presents challenges in meeting the sample size requirements for statistical analysis owing to the limited data volume. Consequently, this study employs panel data from 15 cities within the Yangtze River Delta urban agglomeration, covering the period from 2012 to 2020, for empirical investigation. As the most economically and technologically advanced region in China, the Yangtze River Delta urban agglomeration is at the forefront of the nation in terms of digital economy development and innovation capacity. Nonetheless, significant disparities persist in the levels of the digital economy and innovation capabilities among the various cities within the agglomeration. According to the 2021 Yangtze River Delta Digital Economy Index Report published by the China Center for Information Industry Development, the top 15 cities in terms of the digital economy index are Shanghai, Hangzhou, Nanjing, Suzhou, Wuxi, Ningbo, Hefei, Changzhou, Wenzhou, Jiaxing, Huzhou, Jinhua, Wuhu, Nantong, and Shaoxing [69]. Our data collection primarily involved statistical yearbooks, statistical bulletins, and statistical websites of the respective provinces and cities. We selected panel data from 15 cities for the period from 2012 to 2020. Additionally, to mitigate issues of heteroscedasticity and dimensionality, the data were subjected to logarithmic transformation. The specific data processing procedure of this paper is illustrated in Appendix A.

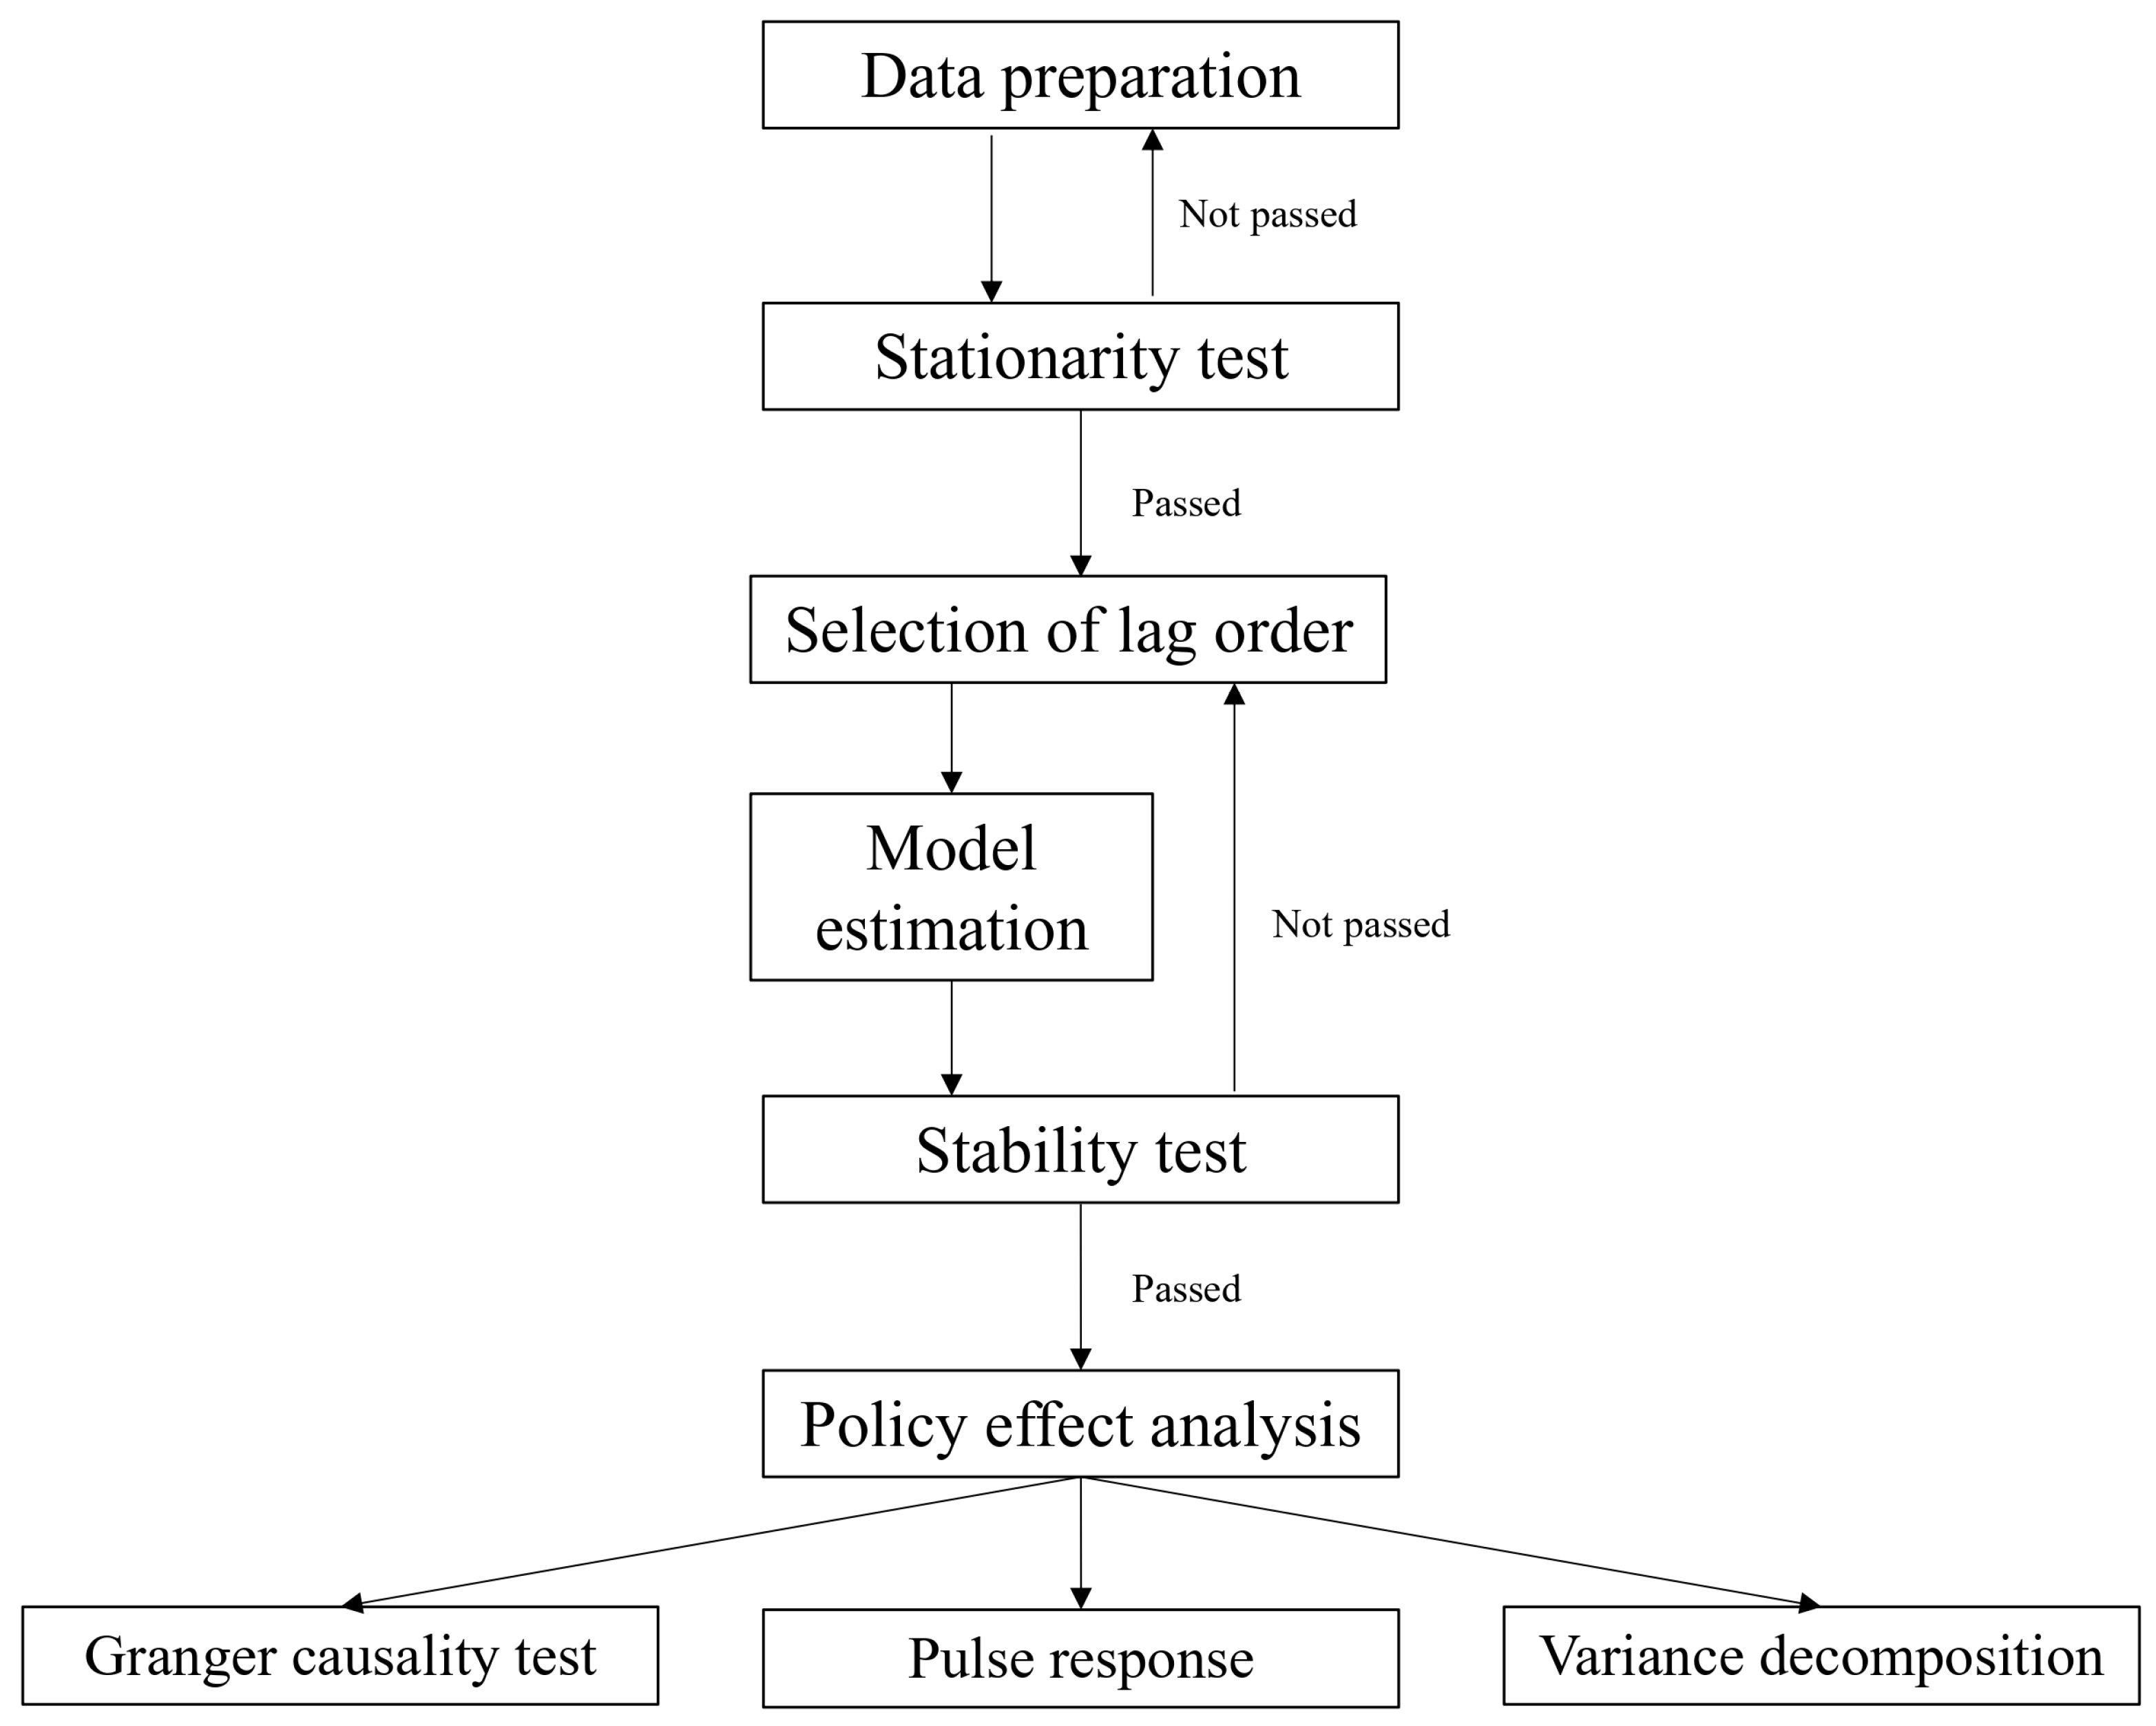
3.3. Model Setting and Method Selection

This paper employs the PVAR method. The primary distinctions between PVAR and other dynamic modeling tools are found in data adaptability, dynamic mechanisms, and scenario applicability. For example, system dynamics models simulate complex systems through predefined feedback loops, but may be susceptible to overfitting when applied to micro-temporal data. Structural equation models emphasize latent variable relationships and can incorporate spatial effects, yet they depend on unidirectional path assumptions. Spatial Durbin models are particularly suited for geographically related data. The PVAR model is developed based on the Vector Autoregression (VAR) model. Traditional regression models frequently fail to address the issue of endogeneity among variables. The VAR model treats all variables as endogenous, thereby more accurately capturing the interrelationships among them. The PVAR model, an extension applicable to panel data, incorporates fixed effects and time effects [70], thereby enhancing the precision and stability of measurement outcomes. This model integrates the benefits of panel data analysis with those of VAR models. This approach does not necessitate the prior establishment of research hypotheses or the designation of independent and dependent variables. It allows for the direct examination of interrelationships and mechanisms of action through the model. Furthermore, it enhances the degrees of freedom of the observed values, controls for individual heterogeneity, and aids in elucidating the complex relationships among various variables. This study employs the PVAR model and, following a stationarity test, systematically examines the relationships among the variables through model estimation, impulse response, and variance decomposition. The generalized method of moments (GMM) is utilized for model estimation to determine the parameters and preliminarily investigate the relationships among the variables within the model. The impulse response function primarily assesses the impact of random disturbances from an endogenous variable on its own and other endogenous variables’ current and future values. Variance decomposition primarily evaluates the explanatory power of each endogenous variable’s shock in relation to the variation of all endogenous variables, thereby systematically analyzing the relative significance of each shock to the endogenous variables.
This study divides regional innovation capacity into two levels: technological innovation and product innovation. It builds PVAR models to explore the impact of the digital economy and government innovation preferences on regional innovation capacity. The models were constructed as follows [71,72]:
  y i 1 t 1 = a 1 + j 1 = 1 p 1 a j 1 y i 1 t 1 j 1 + x i 1 + n t 1 + ε i 1 t 1
y i 2 t 2 = a 2 + j 2 = 1 p 2 a j 2 y i 2 t 2 j 2 + x i 2 + n t 2 + ε i 2 t 2
where y i 1 t 1 = [TIN, APP, LIN, INF, SG, SC]T, [ D F , T I , C E ] T , and contains a vector of columns with six variables—TIN for technological innovations, APP for digital applications, LIN for talent inputs, INF for infrastructure, SG for the intensity of government innovation preferences, and SC for the structure of government innovation preferences. a 1 represents the vector of intercept terms, p 1 represents the lag order, a j 1 represents the individual fixed-effect variable, n t 1 represents the time-effect variable, and ε i 1 t 1 represents the random disturbance term. Similarly, y i 2 t 2 = [PIN, APP, LIN, INF, SG, SC]T consists of six column vectors—PIN, APP, LIN, INF, SG, and SC. PIN represents product innovation, and the meanings of the other variables are the same as those in Model 1. The codes used in this paper are shown in Appendix B.

4. Research Results

4.1. Descriptive Statistical Analysis

This study conducted a descriptive statistical analysis of the relevant variables of the digital economy, government innovation preference, and regional innovation capacity. The results are presented in Table 2.

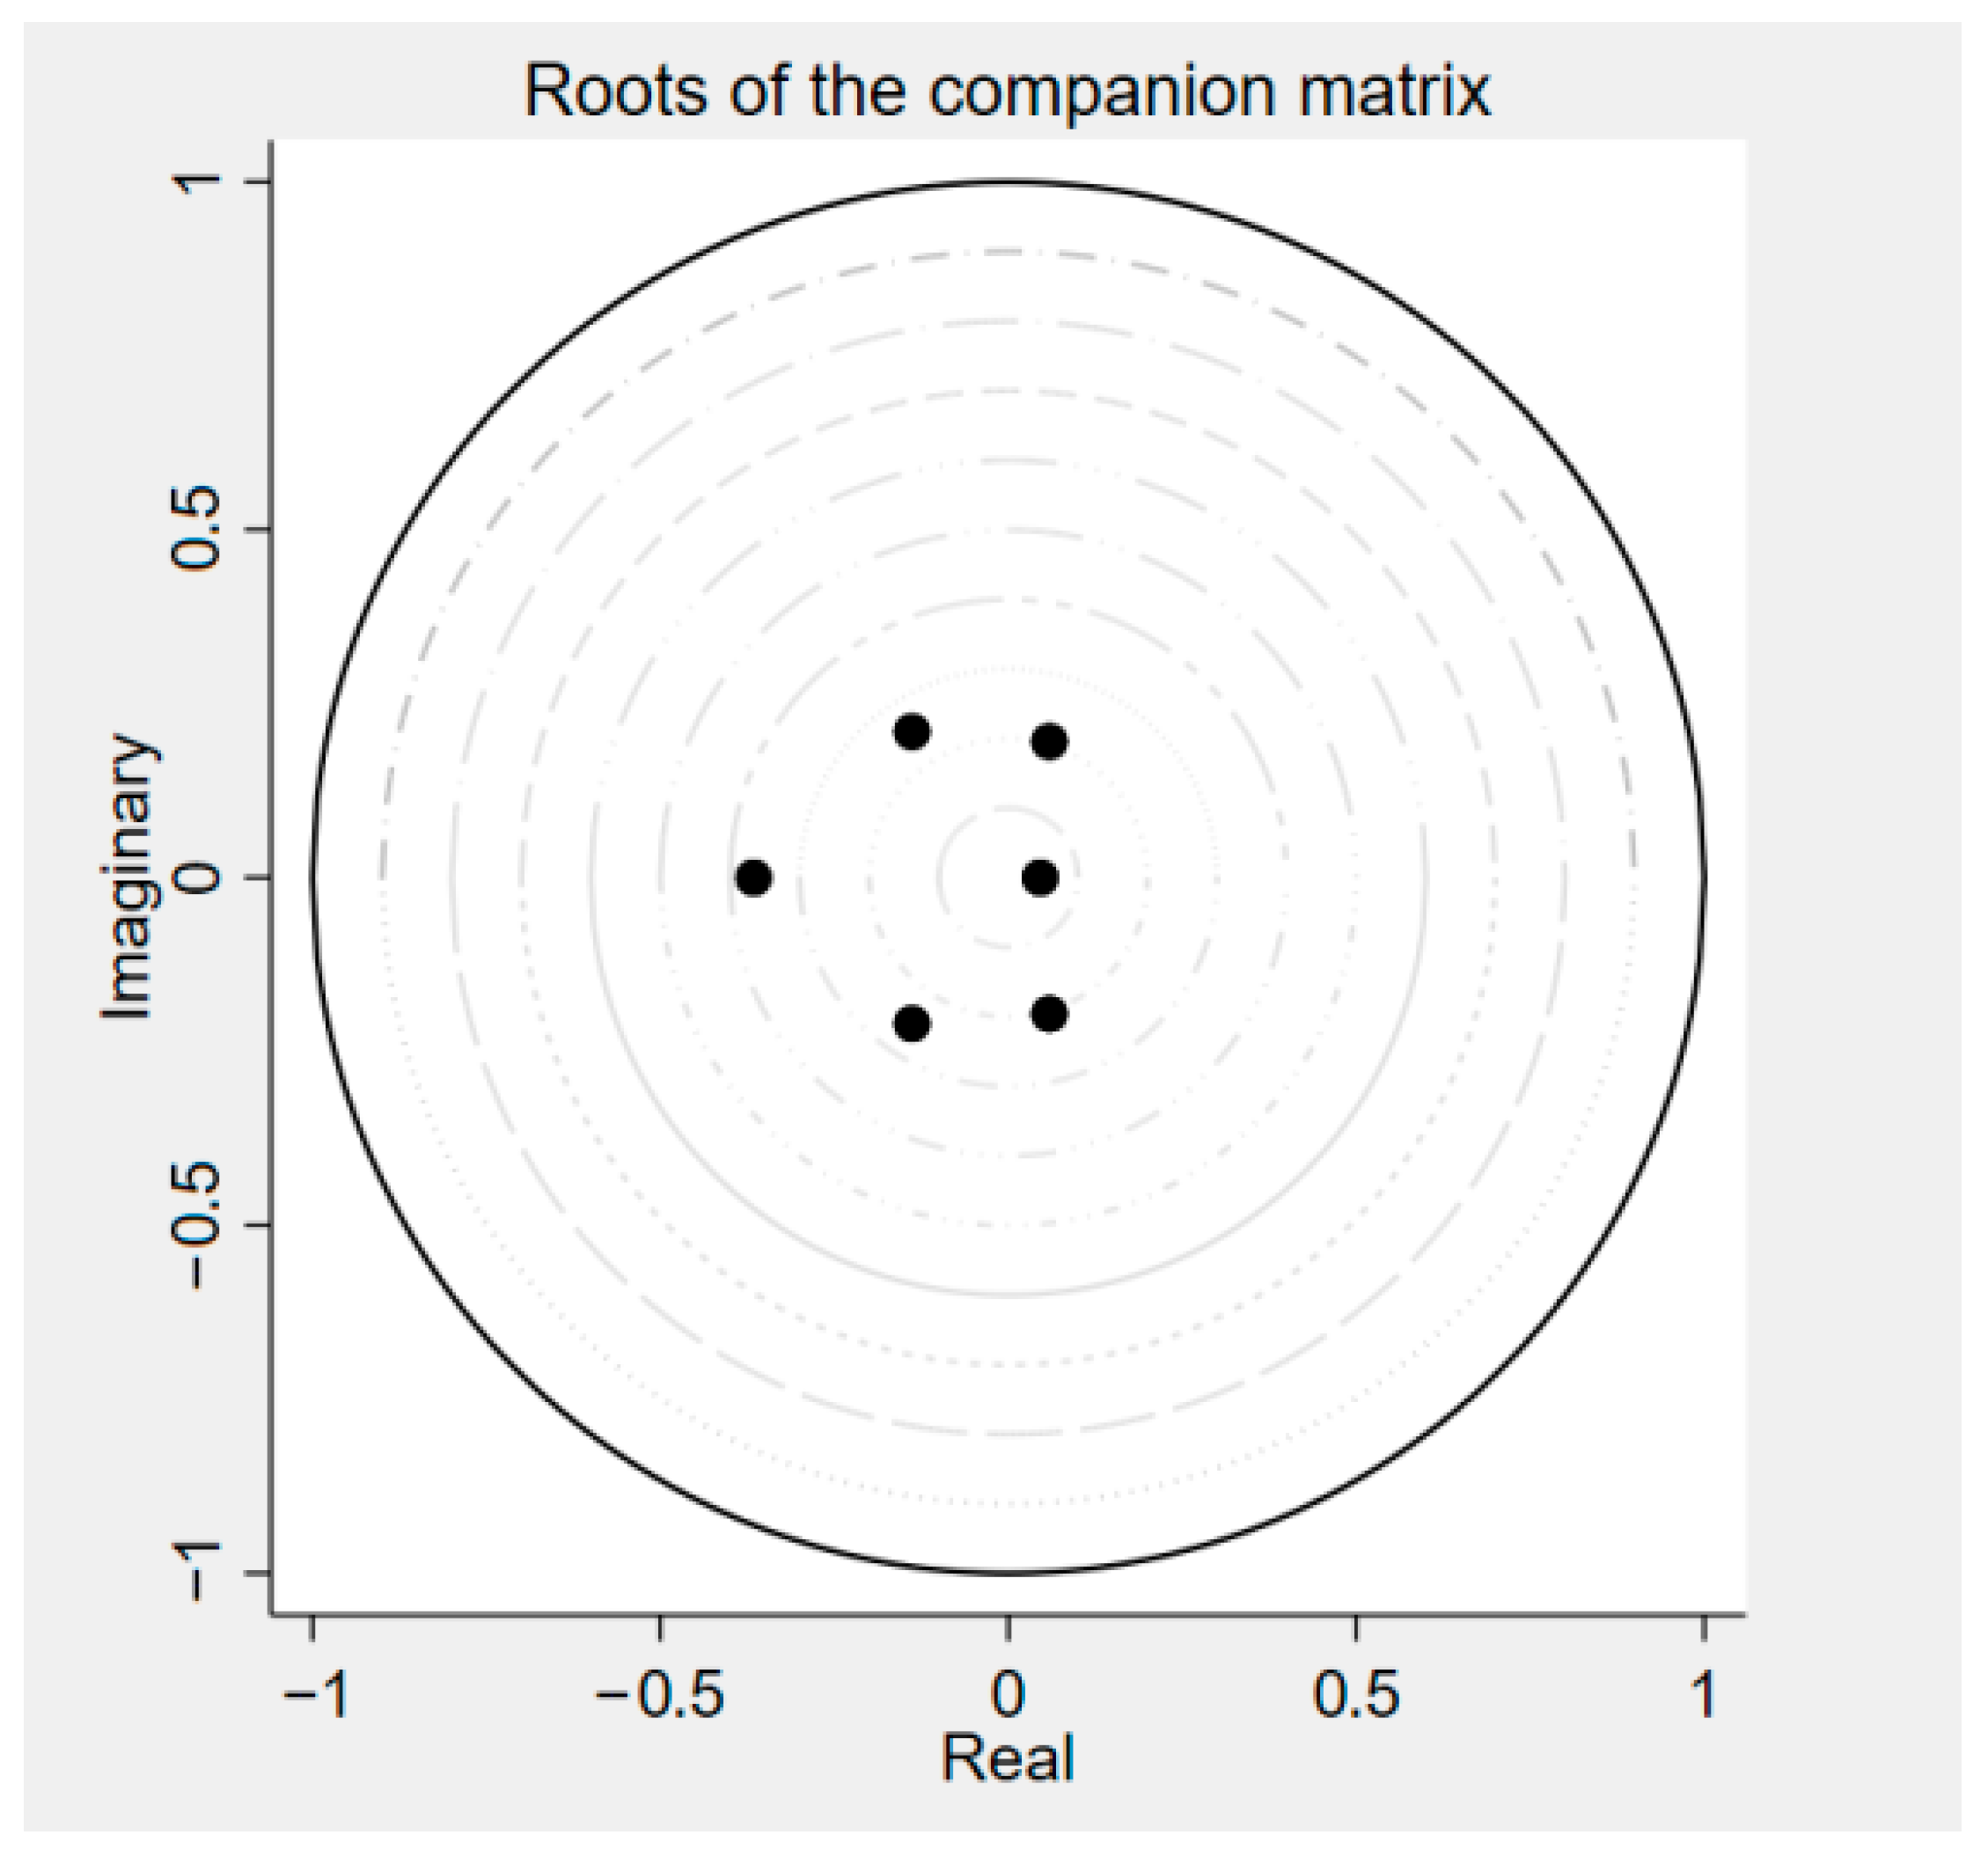
4.2. Smoothness and Significance Tests

To avoid the occurrence of “spurious regression”, this study employs three unit root tests, namely, the LLC test [73,74], Fisher ADF test [75], and Fisher PP test [76], to examine the stationarity of the data. According to the results in Table 3, some sequences of APP, INF, TIN, etc., failed the unit root test, but after first-order differencing, all the variables passed the unit root test, indicating that all the variables were first-order integrated and could undergo a cointegration test. This study adopts the Kao cointegration test method for panel data. The results show that the t value of the residuals of technological innovation and each explanatory variable is −3.7485, with a p value of 0.0001, and the t value of the residuals of product innovation and each explanatory variable is −3.7788, with a p value of 0.0001. That is, at the 1% level, the null hypothesis of “no cointegration relationship” was strongly rejected for each variable. Therefore, in the long term, each variable has a cointegration relationship, and a PVAR model can be established.

4.3. Determination of the Optimal Lag Order

To ensure the validity of parameter estimation within the PVAR model, it is essential to determine the optimal lag order. The determination of this optimal lag order typically employs the AIC, BIC, and HQIC criteria. The AIC incorporates a penalty term for the number of parameters, aiming to select a model that is both explanatory and parsimonious. In contrast, the BIC applies a larger penalty term coefficient than the AIC does, thereby imposing stronger constraints on model complexity. This is particularly effective in controlling the scale of parameters when the sample size is large. The HQIC criterion is specifically designed for variable selection in regression models, dynamically balancing the marginal benefit of improved goodness of fit derived from adding new variables against the increase in model complexity, thus providing a criterion for model simplicity. The selection of lag order must balance the model’s fitting effect and complexity. An insufficient lag order may result in correlation within the residual sequence, whereas an excessive lag order can reduce the degrees of freedom and lead to overfitting. Consequently, the lag order corresponding to the minimum value of each criterion should be selected [77]. To prevent the loss of sample degrees of freedom due to an excessively large lag order, a smaller lag order should be chosen whenever possible. As demonstrated in Table 4 and Table 5, the optimal lag order selected for both Model 1 and Model 2 is the first order, thereby establishing the PVAR (1) model.

4.4. PVAR Model Analysis

This study utilizes the PVAR model to investigate the interrelationships among various variables, employing the generalized method of moments (GMM) for estimation. To mitigate the potential bias in parameter estimates caused by the inclusion of fixed and time effects in the model, the forward mean difference method is implemented. Additionally, the data undergo Helmert transformation to remove fixed effects, thereby ensuring the validity of the parameter estimation [78]. The variables h_TIN, h_PIN, h_APP, h_LIN, h_INF, h_SG, and h_SC represent the transformed variables following the Helmert transformation to eliminate fixed effects, whereas L1. TIN, L1_PIN, L1_APP, L1_LIN, L1_INF, L1_SG, and L1_SC denote the lagged variables of each variable by one period.

4.4.1. GMM Estimation of PVAR Model 1

This study uses the PVAR Model 1 to examine the relationships among digital applications, infrastructure, talent investment, the structure of government innovation preference, the intensity of government innovation preference, and technological innovation. Table 6 presents the GMM estimation results.
In Table 6, column (2) considers technological innovation (TIN) as the dependent variable. The findings indicate that both the lagged one-period digital application and the intensity of the government’s innovation preference exert positive, albeit weak, effects on technological innovation. This suggests that, in the short term, digital application and the configuration of the government’s innovative preference can moderately enhance technological innovation. Conversely, lagged one-period talent input, infrastructure, and the structure of the government’s innovation preference negatively impact technological innovation, implying that these factors impede technological innovation in the short term. In column (3), digital application (APP) is the dependent variable. Within this equation, only the lagged one-period structure of the government’s innovative preference positively influences digital application, whereas technological innovation, talent input, infrastructure, and the intensity of the government’s innovative preference negatively affect it. This finding indicates that, in the short term, only the structure of the government’s innovative preference facilitates digital application, whereas the other variables act as impediments. Column (4) reveals that digital application, infrastructure, and the intensity of the government’s innovative preference positively influence talent input in the short term, whereas technological innovation and the structure of the government’s innovative preference exert negative effects. In column (5), lagged one-period technological innovation, digital application, and the intensity of the government’s innovative preference positively affect infrastructure, whereas lagged one-period talent input and the structure of the government’s innovative preference negatively impact infrastructure. The results in column (6) demonstrate that technological innovation, digital application, talent input, and the structure of the government’s innovative preference all negatively affect the intensity of the government’s innovative preference in the short term, with infrastructure being the sole factor exerting a positive effect. In column (7), lagged one-period technological innovation, talent input, and digital application negatively influence the structure of the government’s innovative preference, whereas infrastructure and the intensity of the government’s innovative preference positively affect it.

4.4.2. GMM Estimation of PVAR Model 2

This study uses PVAR Model 2 to test the relationships among digital applications, infrastructure, talent input, the structure of the government’s innovative preference, the intensity of the government’s innovative preference, and product innovation. Table 7 presents the GMM estimation results.
In Table 7, column (2) examines product innovation (PIN) as the dependent variable. The findings indicate that a one-period lag in digital application, talent input, infrastructure, and the government’s innovative preference structure has a negative effect on product innovation. Conversely, a one-period lag in the government’s innovative preference intensity positively influences product innovation. This suggests that, in the short term, digital application, talent input, infrastructure, and the government’s innovative preference structure inhibit product innovation, whereas the government’s innovative preference intensity facilitates it. In column (3), a one-period lag in talent input, infrastructure, and government innovative preference intensity negatively affects digital application, whereas a one-period lag in product innovation and the government’s innovative preference structure positively impacts digital application. Column (4) reveals that a one-period lag in product innovation, digital application, infrastructure, and government innovation preference intensity positively affects talent input, whereas a one-period lag in the government innovation preference structure negatively influences talent input. In column (5), a one-period lag in product innovation, digital application, and government innovative preference intensity positively affects infrastructure, whereas a one-period lag in talent input and the government innovative preference structure negatively impacts infrastructure. Column (6) shows that product innovation, digital application, talent input, and the government innovative preference structure inhibit the government’s innovative preference intensity, whereas infrastructure has a positive influence on it. The results in column (7) indicate that product innovation, digital application, and talent input have inhibitory effects on the government’s innovative preference structure, whereas infrastructure and government innovation preference intensity promote the government’s innovative preference structure.

4.5. Granger Causality Test

To determine whether there is a causal relationship among the digital economy, government innovation preference, and regional innovation capacity, and to test whether the explanatory variable information has predictive power for the explained variables, this study adopts the Granger causality test [79]. This methodology is grounded in the time series predictive causality framework introduced by Granger [80]. According to this framework, if the historical data of the explanatory variable significantly enhance the predictive accuracy after accounting for the lagged terms of the dependent variable, a Granger causality relationship is statistically inferred. It is important to acknowledge that the Granger causality test exhibits limited robustness, and the causal relationships derived from this test may not accurately reflect the true causal dynamics, serving only as a reference. The results of the test are presented in Appendix C.

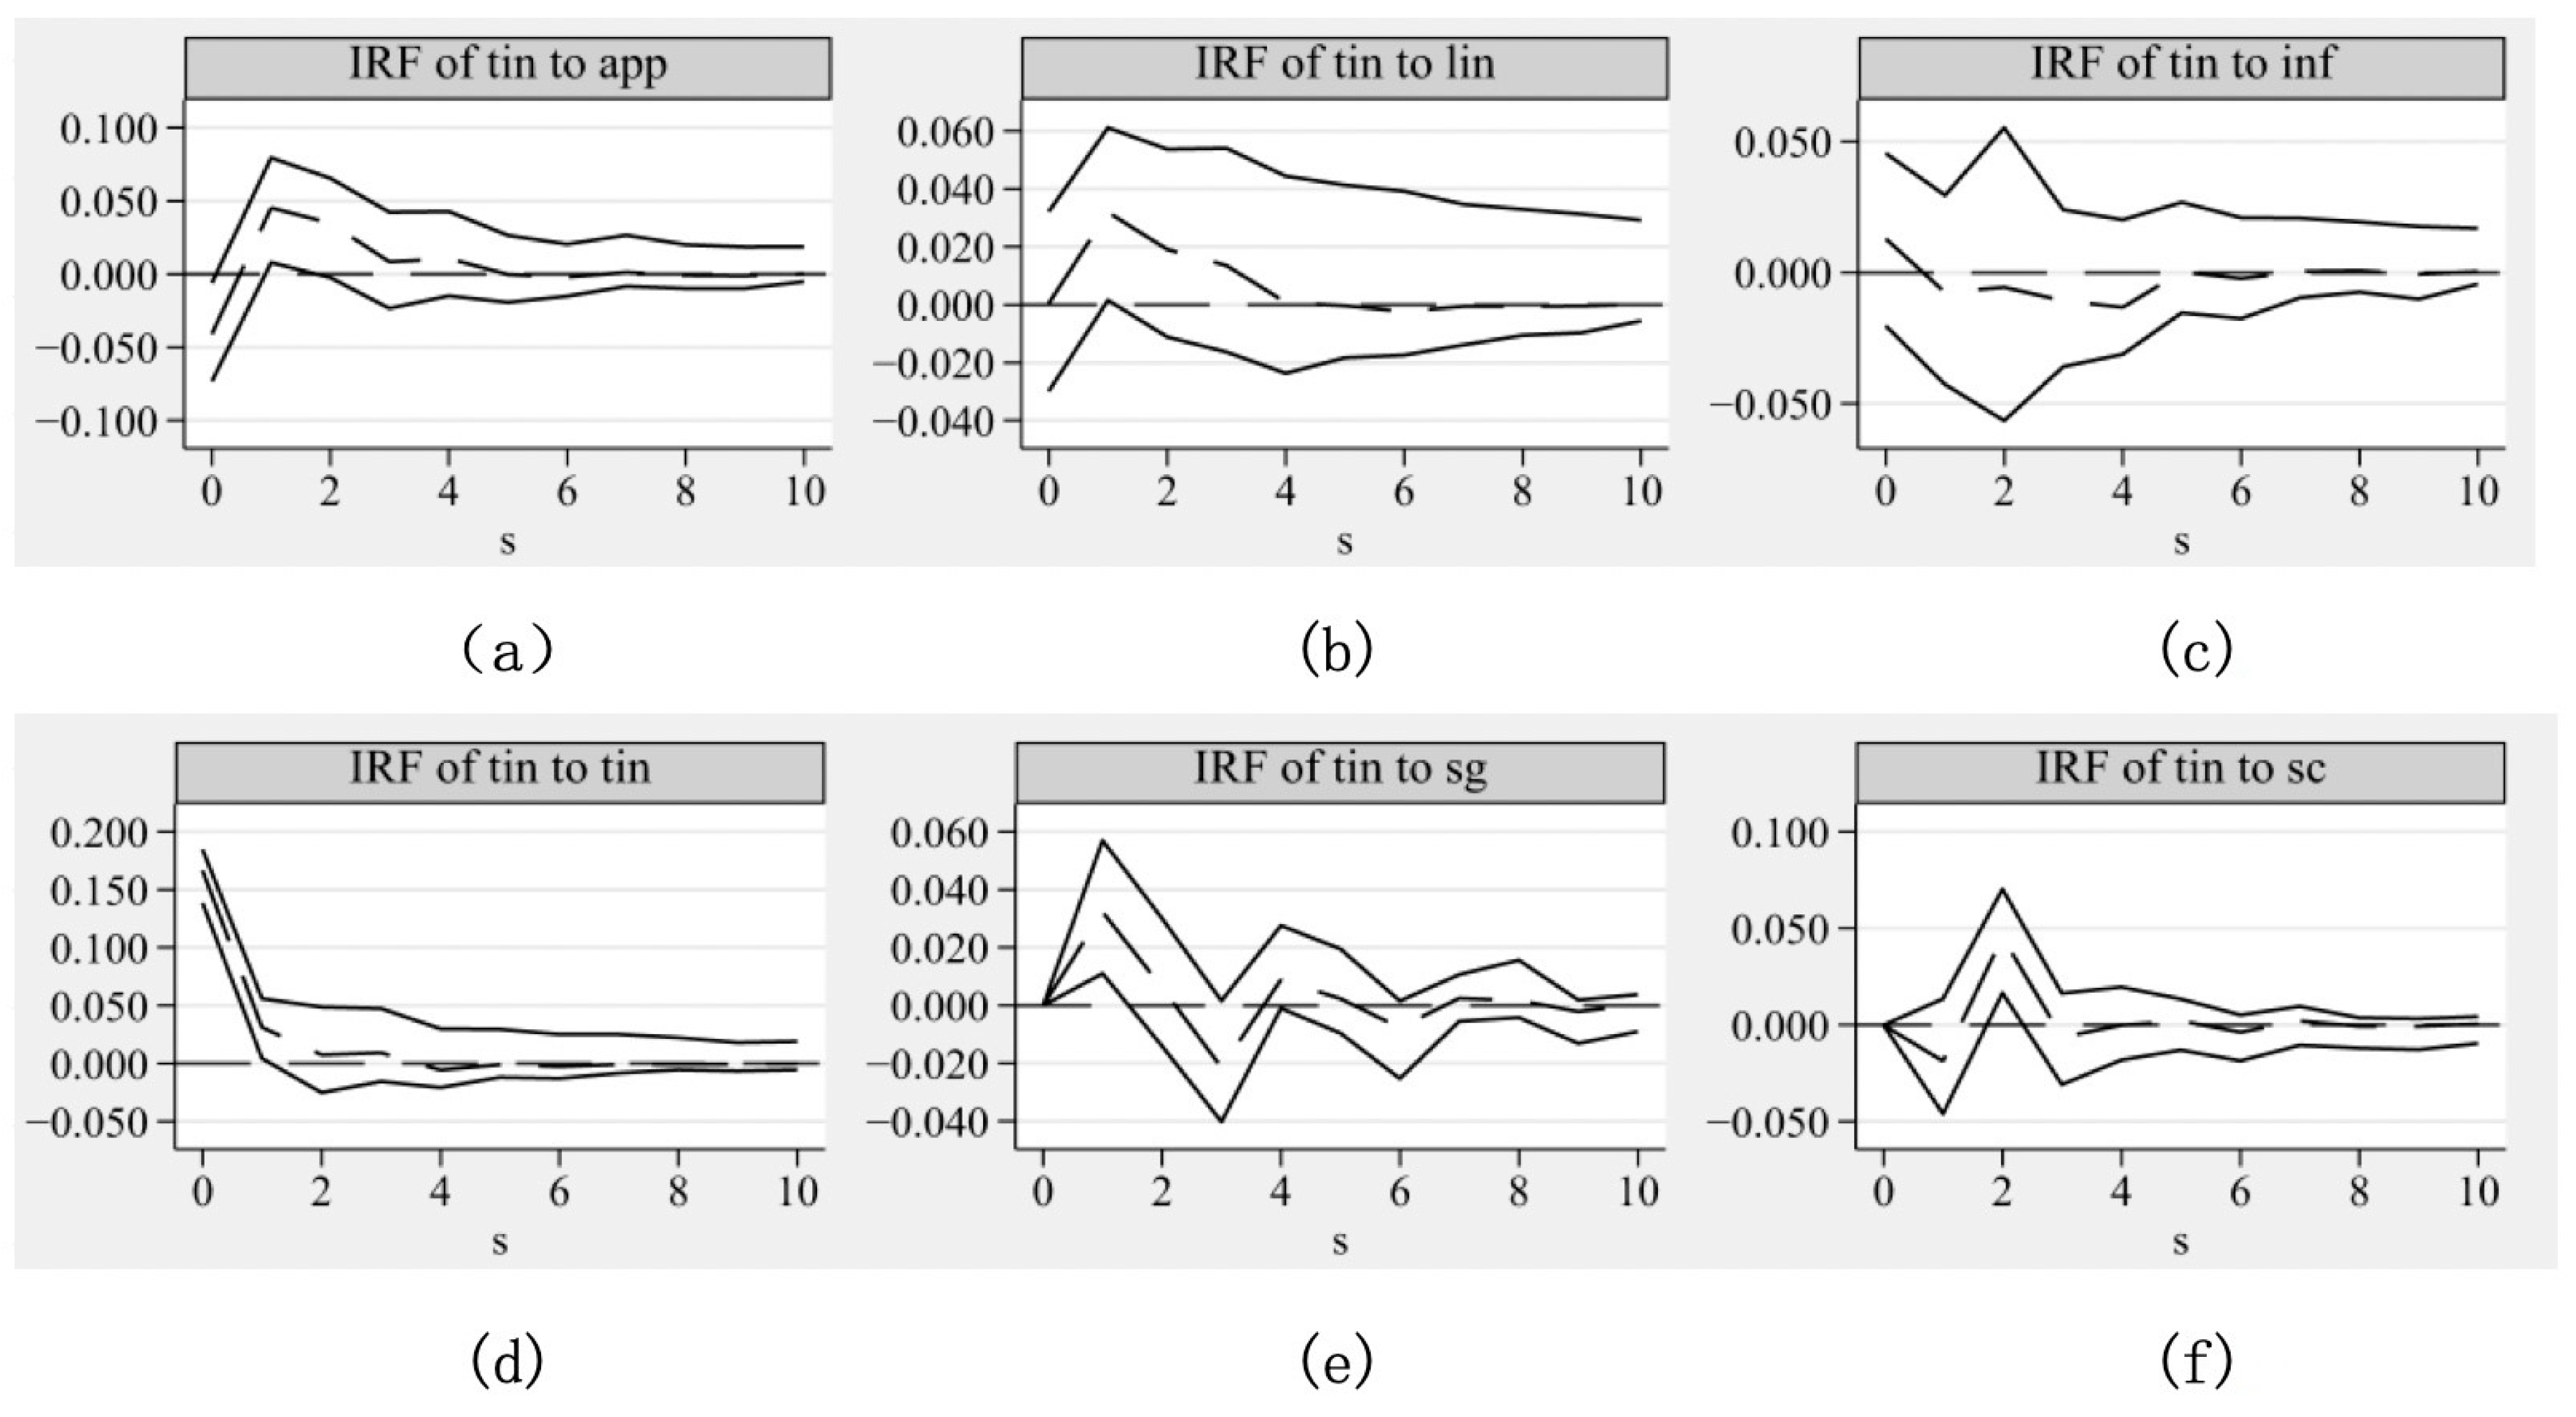
4.6. Impulse Response Function

To ensure the validity of the impulse response and variance decomposition, it is necessary to conduct a stability test on the PVAR(1) model before the analysis. The stability test can reflect the impact of the change in one endogenous variable on itself and other endogenous variables in the model. This method holds that if all characteristic roots are within the unit circle, that is, if the modulus of all characteristic roots is less than 1, then the model is stable, which is a prerequisite for conducting impulse response and variance decomposition [81]. Therefore, we conduct stability tests on Models 1 and 2. As shown in Figure 1 and Figure 2, all characteristic roots of Models 1 and 2 are within the unit circle; therefore, the model is stable.
This study employs 500 Monte Carlo simulations, establishing the response period at 10 intervals. The impulse response graphs for PVAR Model 1 and PVAR Model 2 are subsequently derived, as depicted in Figure 3 and Figure 4. The horizontal axis denotes the number of response periods to the shock, whereas the vertical axis indicates the magnitude of the response to the shock. The central dotted line represents the actual variation in the impulse response function, whereas the two solid lines above and below delineate the potential range of the impulse response. As the number of response periods increases, the impulse response functions of all the variables converge to zero, indicating the relevance of the models under investigation.

4.6.1. The Impulse Response Function of PVAR Model 1

The impulse response function is mainly used to analyze the dynamic response of a variable to the shock of other variables [82]. Figure 3a–f illustrate the impulse response functions of technological innovation in relation to digital applications, talent investment, infrastructure, technological innovation itself, the intensity of government innovation preference, and the structure of government innovation preference within the digital economy, respectively.
Figure 3a illustrates the response of technological innovation output to digital applications. Initially, the curve has a negative effect, subsequently rising to its peak in the first period before declining and stabilizing near zero by the sixth period. This pattern suggests that digital application has a negative impact in the early stages, which rapidly dissipates and transitions into a positive influence. In the long term, digital application significantly promotes technological innovation, with a lasting and substantial effect. Figure 3b depicts the response curve of technological innovation to talent input. The curve initially increases, reaching its peak in the first period, followed by a downward trend, approaching zero by the fourth period. Overall, the curve demonstrates a convergent trend, indicating that talent input significantly promotes technological innovation in the early stages, although this effect diminishes in the later stages. Figure 3c presents the response curve of technological innovation to infrastructure input. Initially, there is a positive response, which then declines at a relatively gentle rate, rebounding around the fifth period, yet continues to fluctuate around zero. This suggests that infrastructure exerts a weak promoting effect on technological innovation in the current period, which quickly dissipates and may even become negative. In the long term, the impact of infrastructure on technological innovation is not pronounced, and infrastructure is generally not conducive to technological innovation.
Figure 3d illustrates the response curve of technological innovation to its own shock. Following the shock, the effect remains positive, reaching its maximum in the current period, and then gradually declines. This finding indicates that technological innovation shows strong economic inertia in the short term and a robust self-enhancing effect. Figure 3e reflects the effect of government innovation preference intensity on technological innovation. The curve initially exhibits an upward trend, reaching its maximum effect in the first period, then sharply declines, turning negative around the second period, reaching its maximum negative effect around the third period, before rising again, albeit with significantly reduced amplitude, and eventually fluctuating around zero. This suggests that government innovation preference intensity significantly promotes technological innovation in the early stages, but that the effect is unstable in the long term. Figure 3f shows the response curve of technological innovation to the structure of government innovation preferences. The structure initially exerts a negative effect in the current period, which intensifies, reaching its maximum negative effect in the first period, before rebounding to a positive peak in the second period, and it then rapidly decreases and gradually stabilizes around zero after the third period. This finding indicates that the structure of government innovation preference initially hinders technological innovation to some extent, but this negative effect gradually transitions into a positive influence, although the duration is brief.

4.6.2. The Impulse Response Function of PVAR Model 2

Figure 4a presents the response curve of product innovation to digital applications. The effect value of digital applications on product innovation is positive in the current period, then shows a downward trend, and then increases again after the first period. The positive and negative effects subsequently alternate and eventually tend toward zero around the fourth period. This finding indicates that digital applications have a certain negative effect on product innovation in the short term, but overall, the positive effect is dominant. Figure 4b shows the response curve of product innovation to talent inputs. The curve reaches its maximum value in the current period and then decreases. It has a weak negative effect in the first period but quickly rebounds. Although the curve fluctuated after the second period, the overall effect remained positive. This finding suggests that talent input has a relatively stable promoting effect on product innovation. Figure 4c shows the response curve of product innovation to infrastructure. The curve initially shows a negative effect that gradually weakens. The response value becomes positive around the second period, quickly peaks, and then slightly decreases, but remains above zero overall. This finding indicates that although infrastructure may hinder product innovation in the short term, it has a positive effect on product innovation in the long term. Figure 4d presents the response curve for product innovation. The curve reaches its maximum value in the current period, decreases sharply, reaches a negative peak in the first period, and then rebounds. It slowly approaches zero during the second period. This finding indicates that product innovation has a significant reinforcing effect in the current period, but in the long term, this effect is unstable and weak. Figure 4e,f show the response curves of product innovation to the intensity and structure of government innovation preferences, respectively. Both initially have a negative effect on product innovation, then gradually rise after the second period, and subsequently alternate between positive and negative responses, fluctuating around zero and eventually tending toward zero. This suggests that both dimensions of government innovation preference have a negative effect on product innovation in the early stage, but in the long term, they form a nonlinear relationship with a certain regularity.

4.7. Variance Decomposition

The significance of variance decomposition lies in exploring the extent to which each variable explains fluctuations in innovation capacity [83].

4.7.1. Variance Decomposition of PVAR Model 1

Table 8 presents the variance decomposition results for technological innovation. Sum1 represents the total explanatory power of the three dimensions of the digital economy on technological innovation. Sum2 indicates the total explanatory power of the two dimensions of government innovation preference in relation to technological innovation. Sum3 shows the total explanatory power of both government innovation preference and the digital economy in relation to technological innovation.
Table 8 shows that both the digital economy and the government’s innovation preferences explain fluctuations in technological innovation to some extent. The digital economy contributes more to technological innovation, with the highest contribution reaching 18.1%, whereas the government’s innovation preference contributes less, with the highest contribution reaching 10.8%. However, in the long term, the government’s prioritization of innovation assumes a more prominent role. The impact of the digital economy on technological innovation ceases to expand after the fifth period, and even experiences a slight decline, whereas the government’s emphasis on innovation continues to rise until the seventh period.
As shown in Table 8, among the three aspects of the digital economy, digital applications have the greatest explanatory power for fluctuations in technological innovation. Its growth rate was relatively rapid in the early stage, rising from 5.6% in the first period to 10.6% in the second period, reaching a peak in the fifth and sixth periods, and then slightly declining, but the change was not significant. The second is talent input, with the maximum explanatory power for technological innovation being 3.9%, which is significantly lower than that of digital applications. However, talent input continued to rise throughout the shock response period, maintaining a very fast growth rate in the first three periods. Infrastructure has the smallest explanatory power for technological innovation, with the highest value at only 1.4%. Overall, the contribution of the three aspects of the digital economy to technological innovation maintained an upward trend during the response period, especially in the first three periods, peaked around the fifth and sixth periods, and then remained stable. This finding indicates that the digital economy has a strong promoting effect on technological innovation, among which digital applications have the greatest promoting effect, and the digital economy is most significant in the first three periods.
The contribution of the structure of the government’s innovation preference to technological innovation is less than that of the intensity of the government’s innovation preference, but its growth rate in the later stages is greater than that of the intensity of the government’s innovation preference for technological innovation. This is the only variable among the five explanatory variables whose contribution increases by more than 1% after the fourth period, indicating that the structure of the government’s innovation preference has a long-term effect on the improvement of technological innovation. The intensity of the government’s innovation preference is the second most significant variable among the five in terms of contribution to technological innovation, with a particularly rapid increase in the early stage; however, the contribution decreases after the third period.

4.7.2. Variance Decomposition of PVAR Model 2

Table 9 presents the variance decomposition results of product innovation. Sum1 represents the total explanatory degree of the three dimensions of the digital economy on product innovation. Sum2 indicates the total explanatory degree of the two dimensions of government innovation preference on product innovation. Sum3 shows the total explanatory degree of the digital economy and government innovation preference for product innovation.
Table 9 presents the variance decomposition results for product innovation. Compared with the results of Model 1, the explanatory power of the digital economy and government innovation preference for product innovation is 11.4%, which is lower than that for technological innovation (28.8%). Overall, the explanatory power of the digital economy for product innovation is greater than that of government innovation preference, as in Model 1. Among the three aspects of the digital economy, infrastructure makes the greatest contribution to product innovation, which is exactly the opposite of Model 1. The contribution of infrastructure to product innovation is particularly significant in the early stages, reaching 5.2% in the first period and maintaining a good growth trend until the sixth period. The second is talent input, which makes a relatively small contribution in the initial stage but experiences rapid growth in the second period, rising from 0.4% to 1.7%. The last is digital applications, which have relatively little explanatory power for product innovation. It maintained a stable growth trend from the first period, increasing by approximately 0.3% in each period. The explanatory power of government innovation preference for product innovation is similar to that of Model 1. The contribution of the intensity of government innovation preference is greater than that of its structure of government innovation preference. However, in the long term, the structure of government innovation preferences has a relatively stable positive effect.

5. Conclusions and Implications

5.1. Conclusions

On the basis of the panel data of 15 cities in the Yangtze River Delta urban agglomeration from 2012 to 2020, this study explores the impact of the digital economy and government innovation preference on regional innovation capacity from the two dimensions of technological innovation and product innovation via the PVAR model. According to the empirical analysis, both the digital economy and government innovation preferences promote the regional innovation capacity of the Yangtze River Delta urban agglomeration. However, the impacts of different elements of the digital economy and government innovation preferences on different forms of innovation are different. The conclusions drawn are as follows.
(1) The digital economy has a positive effect on the development of regional innovation capabilities; however, its promoting effect on technological innovation is greater than that on product innovation. The digital economy has a positive effect on the improvement of regional innovation capabilities, which is reflected mainly in technological and product innovation capabilities. On the one hand, although digital applications did not promote the improvement of technological innovation capabilities in the early stage and even had a negative effect, they soon changed from a hindering effect to a promoting effect, and this positive effect lasted; at the same time, although the effects of talent input and infrastructure on the improvement of technological innovation capabilities were not obvious in the later stage, they had a significant promoting effect in the early stage. On the other hand, both digital applications and talent input have alternating positive and negative effects on product innovation capabilities, specifically showing an initial positive effect, followed by a downward trend, and then an upward rebound. That is, digital applications had a short-term hindering effect on product innovation capabilities, but the positive promoting effect was dominant. The impact of infrastructure on product innovation capabilities also showed alternating positive and negative effects, but the form was different from that of digital applications. Initially, infrastructure had a negative effect on product innovation capabilities, but it then had a positive effect. Although the intensity of the positive effect weakened in the later stages, it maintained a promoting effect. However, overall, the promoting effect on technological innovation capabilities was greater than that on product innovation capabilities. With respect to technological innovation capabilities, the promoting effect of digital applications was the most significant, followed by talent input, and infrastructure was the weakest. For product innovation, the order of the effects of the various dimensions of the digital economy, from largest to smallest, was infrastructure, talent input, and digital applications.
(2) Government innovation preferences play a promoting role in improving regional innovation capabilities. On the one hand, the effect of the intensity of government innovation preferences on technological innovation capabilities first shows a positive upward trend, then a negative hindering effect, and then a positive promoting effect, but the amplitude is significantly reduced. The intensity of government innovation preferences had a relatively significant promoting effect on technological innovation capabilities in the early stage, but the effect was unstable in the long term. The impact of the structure of government innovation preferences on technological innovation capabilities initially had a negative effect and later had a positive promoting effect, but the duration of this positive promoting effect was relatively short. On the other hand, both the intensity and the structure of government innovation preferences showed alternating positive and negative effects on product innovation capabilities; that is, a negative effect followed by a positive effect, and this phenomenon alternated and showed a certain regularity. In general, the intensity of government innovation preferences had a greater effect on technological and product innovation capabilities than did the structure of government innovation preferences, but the structure of government innovation preferences could have a more sustained promoting effect on technological and product innovation capabilities.
(3) The influences of the digital economy and government innovation preferences on the two dimensions of regional innovation capabilities both increased rapidly in the early stage and then gradually decreased and approached zero after the third period. The previous analysis results show that the contribution of the digital economy to the improvement of technological innovation capabilities is generally greater than that of government innovation preferences, and the explanatory power of the digital economy for the development of product innovation capabilities is greater than that of government innovation preferences for product innovation. In other words, the digital economy has a greater impact on regional innovation capabilities than do government innovation preferences; however, in the long term, government innovation preferences have a more stable and sustained impact on regional innovation capabilities than does the digital economy.

5.2. Implications

To enhance the regional innovation capabilities of the 15 cities within the Yangtze River Delta urban agglomeration, this paper, building upon the aforementioned conclusions, offers targeted recommendations from the following perspectives, aiming to provide experiential and theoretical references for related topics.
First, it is essential to differentiate the allocation of policy tools and precisely align them with the gradient of digital economic development [30]. The research indicates significant heterogeneity in digital maturity and innovation effects within the Yangtze River Delta urban agglomeration, necessitating the abandonment of a “one-size-fits-all” policy model. This paper concludes that the digital economy has a more substantial effect on technological innovation than on product innovation. To prevent inefficient investment and ensure that policies are precisely tailored to regional characteristics, the core areas (such as Shanghai and Hangzhou) should prioritize technological penetration and ecological collaboration, reduce short-term fiscal stimulus, and enhance institutional support. For example, the promotion of research and development of cutting-edge technologies can be facilitated through tax deferral and market-based financing tools, with the government’s role shifting toward rule-making (such as data cross-border circulation and intellectual property protection). Peripheral areas (such as Wuhu and Shaoxing) should focus on bridging the gap in digital infrastructure, adopting a “demand–responsive” funding allocation mechanism that dynamically adjusts the subsidy ratio on the basis of the progress of enterprises’ digital transformation to prevent a disconnect between infrastructure investment and market demand.
Second, to optimize the government’s innovation preference structure and enhance policy sustainability, it is imperative to transcend the path dependence of traditional policy tools and establish a resource allocation system grounded in the innovation value chain. Empirical evidence indicates that the long-term impact of government innovation preference intensity on technological innovation is unstable, whereas the preference structure, such as investment in basic research, requires a longer duration to manifest short-term results, but is more sustainable. To fortify the structural and sustainable nature of policies, it is advisable to reduce short-term intensity investments and reallocate fiscal resources towards long-cycle areas, including basic research and pilot platforms. Establishing a gradient support framework is essential to balance the collaborative relationship among basic research, applied research, and technology transfer, enhance the hub function of pilot platforms, and design phased funding and long-term tracking evaluation mechanisms. By constructing a multi-dimensional dynamic evaluation system, it is possible to integrate the observation dimensions of knowledge production, transformation, spillover, and iteration, and employ big data modeling to analyze the innovation spillover effects of policy tools. Concurrently, a dynamic adjustment mechanism centered on marginal output efficiency should be established to phase out policy tools with innovation output below the social average, and a cross-cycle stress testing system should be developed to enhance the resilience of policy combinations. By increasing the strategic allocation weight of basic research and optimizing the temporal structure of policy tool combinations, the short-termness dilemma of innovation incentives can be addressed, ultimately achieving the intergenerational sustainability of innovation-driven development.
Third, it is imperative to enhance market-driven and institutional coordination to establish a resilient innovation ecosystem. The research presented in this paper indicates that the digital economy has greater explanatory power for innovation capabilities than does government support, although the latter demonstrates more stability over the long term. It is essential to delineate the roles of the government and the market: the government should transition to roles such as “rule-makers” and “risk buffers”. For example, it should pilot the confirmation of data element rights and trading rules to reduce institutional transaction costs and develop a regional innovation risk-sharing network to provide compensation for systemic risks, such as the failure of common technology research and development. Concurrently, it is important to deepen the “innovation fly zone” benefit-sharing mechanism, design “two-way assessment” indicators (such as the proportion of industrialization of core area R&D achievements in the peripheral area), and link policy support with cross-regional performance. Through institutional coordination, it is possible to balance the short-term momentum of the digital economy with the long-term stability provided by the government, thereby avoiding excessive intervention and forming a “market-driven—government-protected” resilient innovation ecosystem.

5.3. Limitations and Prospects

This study acknowledges several limitations encountered during the research process. (1) Although the literature review highlights the spatial heterogeneity characteristics of the digital economy’s impact, constraints related to data availability and matching have hindered the empirical design from systematically incorporating regional dummy variable interaction terms or employing spatial econometric models. Consequently, the analysis lacks depth regarding the moderating effects of urbanization rate, industrial structure, and spatial spillover mechanisms. Additionally, the analysis omits the moderating effects of policy tool variables, such as the proportion of industry–university–research cooperation patents in each city, thereby failing to elucidate the differentiated moderating mechanisms of regional innovation policy tools in the digital economy’s transmission path. (2) While the digital economy measurement system encompasses infrastructure and talent dimensions, it inadequately includes emerging indicators such as digital industry output value and technology penetration rate. Furthermore, the measurement of policy tools is biased towards fiscal expenditure, neglecting the integration of multiple policy tools like tax incentives and intellectual property protection. Notably, there is a lack of quantitative tracking of policy tools related to industry–university–research collaboration, such as the proportion of joint patents between universities and enterprises, resulting in an insufficient analysis of the “tools–structure–capability” interaction mechanism within the policy combination effect, potentially weakening the analysis of the policy combination effect. (3) The conclusions derived from the Yangtze River Delta region’s data are constrained by the geographical scope and timeliness of the sample (data up to 2020), and their universality may be compromised by the heterogeneity characteristics of the central and western regions and the structural changes in the digital economy post-pandemic. Therefore, future research could advance in the following three areas: First, construct a spatial interaction weight matrix and integrate geographically weighted regression and spatial Durbin models to elucidate the spatial non-stationarity and spillover paths of the digital economy, embedding policy tool variables such as the intensity of industry–university–research collaboration to quantify their transmission effects in different innovation niches through moderation effect models. Second, reconstruct a two-dimensional indicator system of “digital industrialization–industrial digitalization”, and incorporate policy text big data, industry databases, and other methods to supplement a more dynamic indicator system to quantify the policy synergy effects of fiscal and tax incentives and data element markets, with a focus on introducing policy tool proxy variables such as the proportion of industry–university–research collaboration patents. Further, employ threshold regression to analyze the marginal moderation laws of their effects on innovation in the digital economy in different collaboration intensity intervals. Third, expand cross-regional dynamic panel data, and utilize mixed-frequency sampling models, event study methods, and difference-in-differences methods to capture the time–frequency evolution laws of the digital economy in the post-pandemic era, and employ sub-sample analysis to clarify regional heterogeneity and the applicability boundaries of conclusions to enhance the explanatory power and practical adaptability of the theoretical framework.

Author Contributions

Conceptualization: H.W.; methodology: H.W. and M.C.; visualization: M.C.; funding acquisition: H.W. and C.J.; project administration: C.J.; supervision: C.J.; writing—original draft: H.W., Y.S. and X.X.; writing—review and editing: H.W., Y.S., X.X. and C.J. All authors have read and agreed to the published version of the manuscript.

Funding

This research was supported by the Humanities and Social Sciences Youth Foundation of the Ministry of Education of China (24YJC630233), the National Natural Science Foundation of China (72372073), and the Key Project of Zhejiang University of Finance & Economics Dongfang College (2024dfyzd008).

Data Availability Statement

The data presented in this study are available on request from the corresponding author. The data are not publicly available due to privacy.

Conflicts of Interest

The authors declare no conflicts of interest.

Appendix A

The specific data processing procedure of this paper is illustrated in the flowchart below.
Systems 13 00382 i001

Appendix B

The codes used in this paper are as follows:
recast long city
recast float year
xtset city year,yearly
xtdes
cd”E:\stata\plus folder path\p”
pvar d_tin d_app d_lin d_inf d_sg d_sc,lag(1)
pvarstable,graph
pvar d_pin d_app d_lin d_inf d_sg d_sc,lag(1)
pvarstable,graph
xtset city year, yearly//set panel data
xtdes
xtsum app lin inf pin tin sc sg//descriptive statistics
cd”E:\Desktop\pvar2”//import path
xtunitroot ht app,trend demean
xtunitroot ht lin,trend demean
xtunitroot ht inf,trend demean
xtunitroot ht tin,trend demean
xtunitroot ht pin,trend demean
xtunitroot ht sg,trend demean
xtunitroot ht sc,trend demean//Harris-Tzavalis Unit Root Test
xtunitroot ips app,trend demean
xtunitroot ips lin,trend demean
xtunitroot ips inf,trend demean
xtunitroot ips tin,trend demean
xtunitroot ips pin,trend demean
xtunitroot ips sg,trend demean
xtunitroot ips sc,trend demean//IPS Unit Root Test
xtunitroot fisher app,trend dfuller demean lags(1)
xtunitroot fisher lin,trend dfuller demean lags(1)
xtunitroot fisher inf,trend dfuller demean lags(1)
xtunitroot fisher tin,trend dfuller demean lags(1)
xtunitroot fisher pin,trend dfuller demean lags(1)
xtunitroot fisher sg,trend dfuller demean lags(1)
xtunitroot fisher sc,trend dfuller demean lags(1)//Fisher-type Unit Root Test
gen D_app=d.app
gen D_lin=d.lin
gen D_pin=d.pin
gen D_tin=d.tin
gen D_inf=d.inf
gen D_sg=d.sg
gen D_sc=d.sc//first-order difference
xtunitroot ht app,trend demean
xtunitroot ht lin,trend demean
xtunitroot ht inf,trend demean
xtunitroot ht tin,trend demean
xtunitroot ht pin,trend demean
xtunitroot ht sg,trend demean
xtunitroot ht sc,trend demean
xtunitroot ips app,trend demean
xtunitroot ips lin,trend demean
xtunitroot ips inf,trend demean
xtunitroot ips tin,trend demean
xtunitroot ips pin,trend demean
xtunitroot ips sg,trend demean
xtunitroot ips sc,trend demean
xtunitroot fisher app,trend dfuller demean lags(1)
xtunitroot fisher lin,trend dfuller demean lags(1)
xtunitroot fisher inf,trend dfuller demean lags(1)
xtunitroot fisher tin,trend dfuller demean lags(1)
xtunitroot fisher pin,trend dfuller demean lags(1)
xtunitroot fisher sg,trend dfuller demean lags(1)
xtunitroot fisher sc,trend dfuller demean lags(1)//Re-test stationarity
xtcointtest kao tin pin app inf sg sc
xtcointtest pedroni tin pin app inf sg sc,trend
xtcointtest westerlund tin pin app inf sg sc,trend//Cointegration test
helmert y x1 x2//Transform data to eliminate fixed effects
pvar2 D_tin D_app D_lin D_inf D_sg D_sc, lag(2) soc
pvar2 D_tin D_app D_lin D_inf D_sg D_sc, lag(3) soc
pvar2 D_tin D_app D_lin D_inf D_sg D_sc, lag(4) soc//Determine optimal lag order
pvar2 D_tin D_app D_lin D_inf D_sg D_sc,lag(1) granger//Granger causality test
pvar2 D_tin D_app D_lin D_inf D_sg D_sc,lag(1) reps(100) irf(10) seed(2)//Impulse response analysis
pvar2 D_tin D_app D_lin D_inf D_sg D_sc,lag(1) irf(10) decomp(10)//Forecast error variance decomposition

Appendix C

Results of the Granger causality test.
VariantModel 1 VariantModel 2
APPOriginal hypothesisChi-squareConclusion Original hypothesisChi-squareConclusion
LIN is not the reason2.7539 *rejectionAPPLIN is not the reason2.8386acceptance
INF is not the reason0.00024acceptanceINF is not the reason0.00086 **rejection
TIN is not the reason0.00872acceptanceTIN is not the reason0.10958acceptance
SG is not the reason2.0727acceptanceSG is not the reason2.0179acceptance
SC is not the reason2.3323acceptanceSC is not the reason2.2637acceptance
ALL is not the reason6.3974acceptanceALL is not the reason6.4838acceptance
LINAPP is not the reason1.7212acceptanceLINAPP is not the reason2.2731 *rejection
INF is not the reason0.6928acceptanceINF is not the reason0.40247acceptance
TIN is not the reason1.7787acceptanceTIN is not the reason0.1887acceptance
SG is not the reason0.42931 *rejectionSG is not the reason0.55352acceptance
SC is not the reason0.30292acceptanceSC is not the reason0.47571acceptance
ALL is not the reason4.6662acceptanceALL is not the reason3.1393acceptance
INFAPP is not the reason2.1344 *rejectionINFAPP is not the reason1.9988acceptance
INF is not the reason0.04365acceptanceINF is not the reason0.10224acceptance
TIN is not the reason0.84437acceptanceTIN is not the reason0.00138acceptance
SG is not the reason0.04092acceptanceSG is not the reason0.01154acceptance
SC is not the reason0.03916acceptanceSC is not the reason0.00778acceptance
ALL is not the reason4.4391acceptanceALL is not the reason5.809acceptance
SGAPP is not the reason0.9441 *rejectionSGAPP is not the reason0.96837acceptance
LIN is not the reason2.2294acceptanceLIN is not the reason0.30861acceptance
INF is not the reason3.2297acceptanceINF is not the reason1.9825acceptance
TIN is not the reason1.5785acceptanceTIN is not the reason1.2483acceptance
SC is not the reason1.8751acceptanceSC is not the reason1.1659 *rejection
ALL is not the reason12.545acceptanceALL is not the reason5.469acceptance
SCAPP is not the reason1.2798acceptanceSCAPP is not the reason1.3171acceptance
LIN is not the reason0.216acceptanceLIN is not the reason0.19576acceptance
INF is not the reason0.01649 **rejectionINF is not the reason0.01416acceptance
TIN is not the reason0.00513acceptanceTIN is not the reason0.39214acceptance
SG is not the reason1.2254acceptanceSG is not the reason1.2379 *rejection
ALL is not the reason2.7453acceptanceALL is not the reason2.8252acceptance
TINAPP is not the reason1.1723acceptanceTINAPP is not the reason1.2128 ***rejection
LIN is not the reason0.45288 *rejectionLIN is not the reason0.34852acceptance
INF is not the reason0.14507acceptanceINF is not the reason0.10603acceptance
SG is not the reason0.24094acceptanceSG is not the reason1.3217 *rejection
SC is not the reason2.3458 **rejectionSC is not the reason2.6702 *rejection
ALL is not the reason4.4219acceptanceALL is not the reason4.9667acceptance
Note: *, **, and *** denote p < 0.1, p < 0.05, and p < 0.01, respectively.

References

  1. Kong, H.; Sun, L.; Zhang, W. Digitization and Green Technology Innovation of Chinese Firms Under Government Subsidy Policies. Systems 2024, 12, 447. [Google Scholar] [CrossRef]
  2. Xia, C.; Zhai, G. The Spatiotemporal Evolution Pattern of Urban Resilience in the Yangtze River Delta Urban Agglomeration Based on TOPSIS-PSO-ELM. Sustain. Cities Soc. 2022, 87, 104223. [Google Scholar] [CrossRef]
  3. Luo, D.; Liang, L.; Wang, Z.; Chen, L.; Zhang, F. Exploration of Coupling Effects in the Economy–Society–Environment System in Urban Areas: Case Study of the Yangtze River Delta Urban Agglomeration. Ecol. Indic. 2021, 128, 107858. [Google Scholar] [CrossRef]
  4. Yang, J.; Liu, N. Whether Low-Carbon City Pilot Policy Can Promote the Transition to a Green Lifestyle? Evidence from China. J. Syst. Sci. Syst. Eng. 2025. [Google Scholar] [CrossRef]
  5. Zhao, Z.; Gao, G. The Impact of Digital Trade on China’s Position in the GVC: An Empirical Analysis Based on Sino-Russian Cross-Border Panel Data. Sustainability 2024, 16, 5493. [Google Scholar] [CrossRef]
  6. Liang, L.; Li, Y. How Does Government Support Promote Digital Economy Development in China? The Mediating Role of Regional Innovation Ecosystem Resilience. Technol. Forecast. Soc. Chang. 2023, 188, 122328. [Google Scholar] [CrossRef]
  7. Pan, W.; Xie, T.; Wang, Z.; Ma, L. Digital Economy: An Innovation Driver for Total Factor Productivity. J. Bus. Res. 2022, 139, 303–311. [Google Scholar] [CrossRef]
  8. Wu, M.; Ma, Y.; Gao, Y.; Ji, Z. The Impact of Digital Economy on Income Inequality from the Perspective of Technological Progress-Biased Transformation: Evidence from China. Empir. Econ. 2024, 67, 567–607. [Google Scholar] [CrossRef]
  9. David, A.; Yigitcanlar, T.; Li, R.Y.M.; Corchado, J.M.; Cheong, P.H.; Mossberger, K.; Mehmood, R. Understanding Local Government Digital Technology Adoption Strategies: A PRISMA Review. Sustainability 2023, 15, 9645. [Google Scholar] [CrossRef]
  10. Xu, J.; Li, W. Study on the Impact of Digital Economy on Innovation Output Based on Dynamic Panel Data Model. Eur. J. Innov. Manag. 2023, 28, 877–899. [Google Scholar] [CrossRef]
  11. Meng, Q.; Li, M.; Liu, W.; Li, Z.; Zhang, J. Pricing Policies of Dual-Channel Green Supply Chain: Considering Government Subsidies and Consumers’ Dual Preferences. Sustain. Prod. Consum. 2021, 26, 1021–1030. [Google Scholar] [CrossRef]
  12. Meng, Q.; Wang, Y.; Zhang, Z.; He, Y. Supply Chain Green Innovation Subsidy Strategy Considering Consumer Heterogeneity. J. Clean. Prod. 2021, 281, 125199. [Google Scholar] [CrossRef]
  13. Wu, B.; Gu, Q.; Liu, Z.; Liu, J. Clustered Institutional Investors, Shared ESG Preferences and Low-Carbon Innovation in Family Firm. Technol. Forecast. Soc. Chang. 2023, 194, 122676. [Google Scholar] [CrossRef]
  14. Yi, J.; Murphree, M.; Meng, S.; Li, S. The More the Merrier? Chinese Government R&D Subsidies, Dependence, and Firm Innovation Performance. J. Prod. Innov. Manag. 2021, 38, 289–310. [Google Scholar] [CrossRef]
  15. Shi, Y.; Zhai, G.; Xu, L.; Zhou, S.; Lu, Y.; Liu, H.; Huang, W. Assessment Methods of Urban System Resilience: From the Perspective of Complex Adaptive System Theory. Cities 2021, 112, 103141. [Google Scholar] [CrossRef]
  16. Li, G.; Kou, C.; Wen, F. The Dynamic Development Process of Urban Resilience: From the Perspective of Interaction and Feedback. Cities 2021, 114, 103206. [Google Scholar] [CrossRef]
  17. Renn, O.; Laubichler, M.; Lucas, K.; Kröger, W.; Schanze, J.; Scholz, R.W.; Schweizer, P.-J. Systemic Risks from Different Perspectives. Risk Anal. 2022, 42, 1902–1920. [Google Scholar] [CrossRef] [PubMed]
  18. Fancourt, D.; Aughterson, H.; Finn, S.; Walker, E.; Steptoe, A. How Leisure Activities Affect Health: A Narrative Review and Multi-Level Theoretical Framework of Mechanisms of Action. Lancet Psychiatry 2021, 8, 329–339. [Google Scholar] [CrossRef]
  19. Dai, D.; Fan, Y.; Wang, G.; Xie, J. Digital Economy, R&D Investment, and Regional Green Innovation—Analysis Based on Provincial Panel Data in China. Sustainability 2022, 14, 6508. [Google Scholar] [CrossRef]
  20. Li, Z.; Wang, J. The Dynamic Impact of Digital Economy on Carbon Emission Reduction: Evidence City-Level Empirical Data in China. J. Clean. Prod. 2022, 351, 131570. [Google Scholar] [CrossRef]
  21. Hui, P.; Zhao, H.; Liu, D.; Li, Y. How Does Digital Finance Affect Regional Innovation Capacity? A Spatial Econometric Analysis. Econ. Model. 2023, 122, 106250. [Google Scholar] [CrossRef]
  22. Huaping, G.; Binhua, G. Digital Economy and Demand Structure of Skilled Talents—Analysis Based on the Perspective of Vertical Technological Innovation. Telemat. Inform. Rep. 2022, 7, 100010. [Google Scholar] [CrossRef]
  23. Li, J.; Chen, L.; Chen, Y.; He, J. Digital Economy, Technological Innovation, and Green Economic Efficiency—Empirical Evidence from 277 Cities in China. Manag. Decis. Econ. 2022, 43, 616–629. [Google Scholar] [CrossRef]
  24. Wang, L.; Shao, J. Digital Economy, Entrepreneurship and Energy Efficiency. Energy 2023, 269, 126801. [Google Scholar] [CrossRef]
  25. Tian, Z.; Li, Y.; Niu, X.; Liu, M. The Impact of Digital Economy on Regional Technological Innovation Capability: An Analysis Based on China’s Provincial Panel Data. PLoS ONE 2023, 18, e0288065. [Google Scholar] [CrossRef] [PubMed]
  26. Xu, J.; Li, W. The Impact of the Digital Economy on Innovation: New Evidence from Panel Threshold Model. Sustainability 2022, 14, 15028. [Google Scholar] [CrossRef]
  27. Kanbur, R.; Ortiz-Juarez, E.; Sumner, A. Is the Era of Declining Global Income Inequality Over? Struct. Chang. Econ. Dyn. 2024, 70, 45–55. [Google Scholar] [CrossRef]
  28. Zhang, C.; Liu, B.; Yang, Y. Digital Economy and Urban Innovation Level: A Quasi-Natural Experiment from the Strategy of “Digital China”. Humanit. Soc. Sci. Commun. 2024, 11, 574. [Google Scholar] [CrossRef]
  29. Subramanian, K.P.; Qamashoui, A.A.A.; V, R.; Jayashree, R.; Christopher, B.P. Ruksana Integrating Blockchain Technology to Mitigate Trade Credit Risks and Boost SME Growth in Oman. J. Ecohumanism 2024, 3, 9982–9994. [Google Scholar] [CrossRef]
  30. Samara, E.; Kilintzis, P.; Katsoras, E.; Martinidis, G.; Kosti, P. A Dynamic Analysis to Examine Regional Development in the Context of a Digitally Enabled Regional Innovation System: The Case of Western and Central Macedonia (Greece). Systems 2024, 12, 200. [Google Scholar] [CrossRef]
  31. Li, Y.; Fu, K.; Gong, X.; Xiang, Z.; Zhang, J.; Liao, C. Research on Value Co-Creation Mechanism of Platform Enterprises in Digital Innovation Ecosystem: A Case Study on Haier HOPE Platform in China. Front. Psychol. 2022, 13, 1055932. [Google Scholar] [CrossRef]
  32. Wang, S.; Su, H.; Hou, Q. Evolutionary Game Study on Multi-Agent Value Co-Creation of Service-Oriented Digital Transformation in the Construction Industry. PLoS ONE 2023, 18, e0285697. [Google Scholar] [CrossRef] [PubMed]
  33. Li, Y.; Wei, Y.; Li, Y.; Lei, Z.; Ceriani, A. Connecting Emerging Industry and Regional Innovation System: Linkages, Effect and Paradigm in China. Technovation 2022, 111, 102388. [Google Scholar] [CrossRef]
  34. Ye, M.; Zeng, W. Government Innovation Preferences, Institutional Fragility, and Digital Economic Development. Econ. Anal. Policy 2024, 81, 541–555. [Google Scholar] [CrossRef]
  35. Hu, R.; Yu, C.; Jin, Y.; Pray, C.; Deng, H. Impact of Government Policies on Research and Development (R&D) Investment, Innovation, and Productivity: Evidence from Pesticide Firms in China. Agriculture 2022, 12, 709. [Google Scholar] [CrossRef]
  36. Dai, X.; Chapman, G. R&D Tax Incentives and Innovation: Examining the Role of Programme Design in China. Technovation 2022, 113, 102419. [Google Scholar] [CrossRef]
  37. Belderbos, R.; Park, J.; Carree, M. Do R&D Investments in Weak IPR Countries Destroy Market Value? The Role of Internal Linkages. Strateg. Manag. J. 2021, 42, 1401–1431. [Google Scholar] [CrossRef]
  38. Zhang, J.; Yang, J.; Zhao, F. Do Government Innovation Preferences Enhance Ecological Resilience in Resource-Based Cities?—Based on Mediating Effect and Threshold Effect Perspectives. PLoS ONE 2024, 19, e0303672. [Google Scholar] [CrossRef]
  39. Song, S.; Wen, J.; Li, Y.; Li, L. How Does Digital Economy Affect Green Technological Innovation in China? New Evidence from the “Broadband China” Policy. Econ. Anal. Policy 2024, 81, 1093–1112. [Google Scholar] [CrossRef]
  40. Zhang, Q.; Zhao, X. Can the Digital Economy Facilitate the Optimization of Industrial Structure in Resource-Based Cities? Struct. Chang. Econ. Dyn. 2024, 71, 405–416. [Google Scholar] [CrossRef]
  41. Luo, S.; Yimamu, N.; Li, Y.; Wu, H.; Irfan, M.; Hao, Y. Digitalization and Sustainable Development: How Could Digital Economy Development Improve Green Innovation in China? Bus. Strategy Environ. 2023, 32, 1847–1871. [Google Scholar] [CrossRef]
  42. Dou, Q.; Gao, X. The Double-Edged Role of the Digital Economy in Firm Green Innovation: Micro-Evidence from Chinese Manufacturing Industry. Environ. Sci. Pollut. Res. 2022, 29, 67856–67874. [Google Scholar] [CrossRef] [PubMed]
  43. You, C.; Khattak, S.I.; Ahmad, M. Capturing the Asymmetrical Effect of Macroeconomic Factors on Public-Sector Innovation in Chinese Local Government: A Dynamic Technology Forecasting Approach. SAGE Open 2024, 14, 21582440241292966. [Google Scholar] [CrossRef]
  44. Zhang, K.; Wang, Z.; Yang, Q.; Wang, Y. The Changing Role between Public and Private R&D Investments in Regional Innovation: Threshold Analysis from Guangdong, China. Reg. Stud. Reg. Sci. 2025, 12, 76–94. [Google Scholar]
  45. Yousaf, Z.; Radulescu, M.; Sinisi, C.I.; Serbanescu, L.; Păunescu, L.M. Towards Sustainable Digital Innovation of SMEs from the Developing Countries in the Context of the Digital Economy and Frugal Environment. Sustainability 2021, 13, 5715. [Google Scholar] [CrossRef]
  46. Cooke, P.; Heidenreich, M.; Braczyk, H.-J. Introduction: Regional Innovation Systems—An Evolutionary Approach. In Regional Innovation Systems; Routledge: London, UK, 2004; ISBN 978-1-00-357238-1. [Google Scholar]
  47. Yin, S.; Zhang, N.; Ullah, K.; Gao, S. Enhancing Digital Innovation for the Sustainable Transformation of Manufacturing Industry: A Pressure-State-Response System Framework to Perceptions of Digital Green Innovation and Its Performance for Green and Intelligent Manufacturing. Systems 2022, 10, 72. [Google Scholar] [CrossRef]
  48. Khattak, S.I.; Khan, A.M.; Khan, M.K.; Li, C.; Liu, J.; Pi, Z. Do Regional Government Green Innovation Preferences Promote Industrial Structure Upgradation in China? Econometric Assessment Based on the Environmental Regulation Threshold Effect Model. Front. Environ. Sci. 2022, 10, 995990. [Google Scholar] [CrossRef]
  49. Acemoglu, D.; Makhdoumi, A.; Malekian, A.; Ozdaglar, A. Learning from Reviews: The Selection Effect and the Speed of Learning. Econometrica 2022, 90, 2857–2899. [Google Scholar] [CrossRef]
  50. Huang, Y.; Duan, K.; Urquhart, A. Time-Varying Dependence between Bitcoin and Green Financial Assets: A Comparison between Pre- and Post-COVID-19 Periods. J. Int. Financ. Mark. Inst. Money 2023, 82, 101687. [Google Scholar] [CrossRef]
  51. Simionescu, M.; Schneider, N.; Gavurova, B. A Bayesian Vector-Autoregressive Application with Time-Varying Parameters on the Monetary Shocks–Production Network Nexus. J. Appl. Econ. 2024, 27, 2395114. [Google Scholar] [CrossRef]
  52. Henderson, R.; Cockburn, I. Measuring Competence? Exploring Firm Effects in Pharmaceutical Research. Strateg. Manag. J. 1994, 15, 63–84. [Google Scholar] [CrossRef]
  53. Akcigit, U.; Grigsby, J.; Nicholas, T.; Stantcheva, S. Taxation and Innovation in the Twentieth Century. Q. J. Econ. 2022, 137, 329–385. [Google Scholar] [CrossRef]
  54. Jang, S.; Kim, J.; von Zedtwitz, M. The Importance of Spatial Agglomeration in Product Innovation: A Microgeography Perspective. J. Bus. Res. 2017, 78, 143–154. [Google Scholar] [CrossRef]
  55. Zhang, P.; Thurasamy, R. Bridging Big Data Analytics Capability and Competitive Advantage in China’s Agribusiness: The Mediator of Absorptive Capacity. Systems 2025, 13, 3. [Google Scholar] [CrossRef]
  56. Stephen, M.M. Digital Economies: SMEs and E-Readiness: SMEs and E-Readiness; IGI Global: Hershey, PA, USA, 2009; ISBN 978-1-60566-421-7. [Google Scholar]
  57. Aldrich, D.F. Mastering the Digital Marketplace: Practical Strategies for Competitiveness in the New Economy; John Wiley & Sons: Hoboken, NJ, USA, 1999; ISBN 978-0-471-34546-6. [Google Scholar]
  58. Cao, C. Analysis of the Status of Digital Economy in China’s Economy. Adv. Econ. Manag. Political Sci. 2024, 59, 42–47. [Google Scholar] [CrossRef]
  59. Zhang, Y.; Wang, L.; Duan, Y. Agricultural Information Dissemination Using ICTs: A Review and Analysis of Information Dissemination Models in China. Inf. Process. Agric. 2016, 3, 17–29. [Google Scholar] [CrossRef]
  60. Saidani, M.; Yannou, B.; Leroy, Y.; Cluzel, F.; Kendall, A. A Taxonomy of Circular Economy Indicators. J. Clean. Prod. 2019, 207, 542–559. [Google Scholar] [CrossRef]
  61. Moraga, G.; Huysveld, S.; Mathieux, F.; Blengini, G.A.; Alaerts, L.; Van Acker, K.; de Meester, S.; Dewulf, J. Circular Economy Indicators: What Do They Measure? Resour. Conserv. Recycl. 2019, 146, 452–461. [Google Scholar] [CrossRef] [PubMed]
  62. Geng, Y.; Fu, J.; Sarkis, J.; Xue, B. Towards a National Circular Economy Indicator System in China: An Evaluation and Critical Analysis. J. Clean. Prod. 2012, 23, 216–224. [Google Scholar] [CrossRef]
  63. Niebel, T. ICT and Economic Growth—Comparing Developing, Emerging and Developed Countries. World Dev. 2018, 104, 197–211. [Google Scholar] [CrossRef]
  64. Lai, S.; Chen, H.; Zhao, Y. Measurement and Prediction of the Development Level of China’s Digital Economy. Humanit. Soc. Sci. Commun. 2024, 11, 1756. [Google Scholar] [CrossRef]
  65. Lee, C.-Y. The Differential Effects of Public R&D Support on Firm R&D: Theory and Evidence from Multi-Country Data. Technovation 2011, 31, 256–269. [Google Scholar] [CrossRef]
  66. Liu, C. Infrastructure Public–Private Partnership (PPP) Investment and Government Fiscal Expenditure on Science and Technology from the Perspective of Sustainability. Sustainability 2021, 13, 6193. [Google Scholar] [CrossRef]
  67. Zhao, C.; Feng, F.; Chen, Y.; Li, X. Local Government Competition and Regional Innovation Efficiency: From the Perspective of China-Style Fiscal Federalism. Sci. Public Policy 2021, 48, 488–489. [Google Scholar] [CrossRef]
  68. Sarpong, D.; Boakye, D.; Ofosu, G.; Botchie, D. The Three Pointers of Research and Development (R&D) for Growth-Boosting Sustainable Innovation System. Technovation 2023, 122, 102581. [Google Scholar] [CrossRef]
  69. Chu, H.; Ning, Y.; Qie, X. Measurement and Spatial Correlation Analysis of the Development Level of the Digital Economy in the Yangtze River Delta Urban Agglomeration. Sustainability 2023, 15, 13329. [Google Scholar] [CrossRef]
  70. Sims, C.A. Macroeconomics and Reality. Econometrica 1980, 48, 1–48. [Google Scholar] [CrossRef]
  71. Nguyen, H.M.; Nguyen, L.D. The Relationship between Urbanization and Economic Growth: An Empirical Study on ASEAN Countries. Int. J. Soc. Econ. 2018, 45, 316–339. [Google Scholar] [CrossRef]
  72. Zhang, Y.; Chen, H.; He, Z. Environmental Regulation, R&D Investment, and Green Technology Innovation in China: Based on the PVAR Model. PLoS ONE 2022, 17, e0275498. [Google Scholar] [CrossRef]
  73. Aziz, O.G. FDI Inflows and Economic Growth in Arab Region: The Institutional Quality Channel. Int. J. Financ. Econ. 2022, 27, 1009–1024. [Google Scholar] [CrossRef]
  74. Asogwa, F.O.; Onyeke, Q.O.; Kuma, P.M.; Arazue, W.O.; Nkalu, C.N. Do Macroeconomic Indicators Determine Income Inequality in Selected African Countries? J. Public Aff. 2022, 22, e2560. [Google Scholar] [CrossRef]
  75. Setiawan, R. Testing the Dynamic Relationship of Inflation and Interest Rates: Fisher Effect Testing. J. Ilm. Manaj. Ekon. Akunt. (MEA) 2022, 6, 1030–1041. Available online: https://journal.stiemb.ac.id/index.php/mea/article/view/2942 (accessed on 28 April 2022).
  76. Ghaddab, S.; De Peretti, C.; Belkacem, L. Are Stock Markets Efficient with Respect to the Google Search Volume Index? A Robustness Check of the Literature Studies. Res. Int. Bus. Financ. 2025, 73, 102574. [Google Scholar] [CrossRef]
  77. Andrews, D.W.K.; Lu, B. Consistent Model and Moment Selection Procedures for GMM Estimation with Application to Dynamic Panel Data Models. J. Econom. 2001, 101, 123–164. [Google Scholar] [CrossRef]
  78. Abas, A.; Bendory, T.; Sharon, N. The Generalized Method of Moments for Multi-Reference Alignment. IEEE Trans. Signal Process. 2022, 70, 1377–1388. [Google Scholar] [CrossRef]
  79. Zhang, Z.; Wu, L. Graph Neural Network-Based Bearing Fault Diagnosis Using Granger Causality Test. Expert Syst. Appl. 2024, 242, 122827. [Google Scholar] [CrossRef]
  80. Granger, C.W.J. Investigating Causal Relations by Econometric Models and Cross-Spectral Methods. Econometrica 1969, 37, 424–438. [Google Scholar] [CrossRef]
  81. Chen, X.; Lee, S.; Liao, Y.; Seo, M.H.; Shin, Y.; Song, M. SGMM: Stochastic Approximation to Generalized Method of Moments. J. Financ. Econom. 2025, 23, nbad027. [Google Scholar] [CrossRef]
  82. Aguirregabiria, V.; Collard-Wexler, A.; Ryan, S.P. Dynamic Games in Empirical Industrial Organization☆. In Handbook of Industrial Organization; Ho, K., Hortaçsu, A., Lizzeri, A., Eds.; Elsevier: Amsterdam, The Netherlands, 2021; Volume 4, pp. 225–343. [Google Scholar]
  83. Xu, A.; Qiu, K.; Jin, C.; Cheng, C.; Zhu, Y. Regional Innovation Ability and Its Inequality: Measurements and Dynamic Decomposition. Technol. Forecast. Soc. Chang. 2022, 180, 121713. [Google Scholar] [CrossRef]
Figure 1. PVAR Model 1 stability test.
Systems 13 00382 g001
Figure 2. PVAR Model 2 stability test.
Systems 13 00382 g002
Figure 3. Response of APP, INF, LIN, SG, SC, and TIN to the impact of technological innovation. (a) Note: (1) The horizontal axis represents the response period, and the vertical axis represents the response value; (2) IRF of tin to app—According to the index description in Table 1, this indicates the response degree of technological innovation output to digital application; the same applies to (bf) below.
Systems 13 00382 g003
Figure 4. Response graphs of product innovation to the impacts of APP, INF, LIN, SG, SC, and PIN. (a) Note: (1) The horizontal axis represents the response period, and the vertical axis represents the response value; (2) IRF of pin to app—According to the index description in Table 1, the meaning expressed here is the impact of digital applications on product innovation; the same applies to (bf) below.
Systems 13 00382 g004
Table 1. Description of indicators.
Variable TypePrimary IndicatorSecondary IndicatorsSecondary Indicator CodeTertiary Indicators
Explained variableRegional innovation capacityTechnological innovationTINPatent applications
product innovationPINOutput value of new products
Explanatory variableDigital economyInfrastructureINFInternet broadband access
Talent inputsLINNumber of researchers
digital applicationAPPNumber of high-tech enterprises
Government innovation preferencesIntensity of government innovation preferencesSGFiscal expenditure on science and technology as a share of GDP
Structure of government innovation preferencesSCShare of fiscal expenditure on science and technology in total local fiscal expenditure
Table 2. Results of descriptive statistical analysis of variables.
VariableMeanStd. Dev.MinMax.
app0.1405950.180925−0.540220.994881
pin0.1053440.243127−1.449511.595077
lin0.1227710.261372−0.383961.775935
inf0.1052110.13489−0.630760.85388
tin0.0758880.19477−0.729570.469608
sg0.0297590.461268−2.19412.44367
sc0.0163870.460644−2.33332.553538
Table 3. Unit root test for each variable.
VariantLLCFisher-ADFFisher-PPConclusion
APP−2.59564 ** (0.0047)23.3484 (0.8007)22.7340 (0.8260)uneven
d_APP−4.50604 *** (0.0000)54.2873 *** (0.0043)66.8124 *** (0.0001)smoothly
LIN−11.6468 *** (0.0000)49.9160 (0.0127)63.4975 *** (0.0003)smoothly
d_LIN−14.5672 *** (0.0000)60.7023 *** (0.0008)100.114 *** (0.0000)smoothly
INF−5.48898 *** (0.0000)38.8875 (0.1283)33.4659 (0.3027)uneven
d_INF−4.73791 *** (0.0000)74.8382 *** (0.000)78.7518 *** (0.0000)smoothly
TIN7.53241 *** (0.0000)30.9103 (0.4198)32.3073 (0.4198)uneven
d_TIN−7.62648 *** (0.0000)97.1347 *** (0.0000)97.2272 *** (0.0000)smoothly
PIN11.4640 *** (0.0000)52.0668 *** (0.0075)73.3011 *** (0.0000)smoothly
d_PIN−15.9440 *** (0.0000)61.4279 *** (0.0006)105.816 *** (0.0000)smoothly
SG−4.1184 *** (0.0000)34.5329 (0.2599)42.5460 * (0.0642)uneven
d_SG−8.74416 *** (0.0000)44.3106 * (0.0447)90.7318 *** (0.0000)smoothly
SC−4.41890 *** (0.0000)31.1382 (0.4086)40.1990 (0.1011)uneven
d_SC−8.49212 *** (0.0000)44.47269 * (0.0432)80.7482 *** (0.000)smoothly
Note: *, **, and *** denote p < 0.1, p < 0.05, and p < 0.01, respectively.
Table 4. Judgment results of the lag order of Model 1.
AICBICHQIC
1−0.517739 *2.98199 *−0.893559 *
20.85875.864472.85745
367.74.299470.0915
Note: * indicates p < 0.1.
Table 5. Judgment results of the lag order of Model 2.
AICBICHQIC
1−0.088362 *3.5881 *1.49966 *
21.395946.401723.39469
353.085659.996955.789
Note: * indicates p < 0.1.
Table 6. GMM estimation results for PVAR Model 1.
h_TINh_APPh_LINh_INFh_SGh_SC
L1.h_TIN0.082
(0.099)
−0.008 *
(0.090)
−0.253
(0.190)
0.092
(0.100)
−0.095
(0.193)
−0.014
(0.198)
L1.h_APP0.128
(0.132)
−0.035
(0.103)
0.170
(0.129)
0.167 *
(0.114)
−0.704
(0.651)
−0.771
(0.681)
L1.h_LIN−0.113
(0.075)
−0.080
(0.048)
0.018
(0.051)
−0.013
(0.062)
−0.056 *
(0.083)
−0.043
(0.092)
L1.h_INF−0.250 *
(0.139)
−0.002
(0.107)
0.121
(0.145)
−0.069
(0.198)
0.116
(0.305)
0.040
(0.309)
L1.h_SG0.285
(0.208)
−0.206
(0.135)
0.085 **
(0.155)
0.028
(0.144)
0.371
(0.405)
0.460
(0.416)
L1.h_SC−0.267
(0.212)
0.198
(0.138)
−0.105
(0.160)
−0.029
(0.143)
−0.614
(0.401)
−0.699 *
(0.393)
Note: *, ** denote p < 0.1 and p < 0.05, respectively.
Table 7. GMM estimation results for PVAR Model 2.
h_PINh_APPh_LINh_INFh_SGh_SC
L1.h_PIN−0.511 **
(0.225)
0.015
(0.046)
0.031
(0.070)
0.002
(0.042)
−0.139
(0.121)
−0.102
(0.163)
L1.h_APP−0.204
(0.207)
−0.031
(0.101)
0.198
(0.131)
0.159
(0.112)
−0.717
(0.651)
−0.785
(0.684)
L1.h_LIN−0.030
(0.055)
−0.080 *
(0.047)
0.032
(0.054)
−0.018 *
(0.058)
−0.048
(0.081)
−0.040
(0.091)
L1.h_INF−0.187
(0.133)
−0.003
(0.104)
0.083
(0.130)
−0.055
(0.198)
0.103
(0.317)
0.039
(0.324)
L1.h_SG0.295 *
(0.273)
−0.211
(0.141)
0.109 **
(0.158)
0.014
(0.162)
0.448
(0.439)
0.508
(0.457)
L1.h_SC−0.305
(0.273)
0.205
(0.144)
−0.121
(0.163)
−0.017
(0.160)
−0.692
(0.423)
−0.749 *
(0.427)
Note: * and ** indicate p < 0.1 and p < 0.05, respectively.
Table 8. Model 1 variance decomposition results.
PhaseAPPLININFSum1SCSGSum2Sum3
TIN10.05600.0060.0620.0010.0040.0050.067
TIN20.1060.0290.0060.1410.0230.0230.0460.187
TIN30.1270.0360.0070.170.0250.0690.0940.264
TIN40.1260.0390.0090.1740.0370.0670.1040.278
TIN50.1280.0390.0140.1810.0390.0670.1060.287
TIN60.1280.0390.0140.1810.0390.0670.1060.287
TIN70.1270.0390.0140.180.0410.0670.1080.288
TIN80.1270.0390.0140.180.0410.0670.1080.288
TIN90.1270.0390.0140.180.0410.0670.1080.288
TIN100.1270.0390.0140.180.0410.0670.1080.288
Table 9. Model 2 variance decomposition results.
PhaseAPPLININFSum1SCSGSum2Sum3
PIN10.0030.0010.0520.0560.0050.010.0150.071
PIN20.0060.0040.0570.0670.0060.010.0160.083
PIN30.0070.0170.0550.0790.0070.020.0270.106
PIN40.010.0170.0560.0830.0070.020.0270.11
PIN50.010.0180.0570.0850.0070.020.0270.112
PIN60.010.0180.0580.0860.0070.020.0270.113
PIN70.010.0180.0580.0860.0070.020.0270.113
PIN80.010.0180.0580.0860.0080.020.0280.114
PIN90.010.0180.0580.0860.0080.020.0280.114
PIN100.010.0180.0580.0860.0080.020.0280.114
Disclaimer/Publisher’s Note: The statements, opinions and data contained in all publications are solely those of the individual author(s) and contributor(s) and not of MDPI and/or the editor(s). MDPI and/or the editor(s) disclaim responsibility for any injury to people or property resulting from any ideas, methods, instructions or products referred to in the content.

