Article

A Catalyst for the Improvement of Inclusive Public Service: The Role of High-Speed Rail

1
School of Economics and Management, Beijing Jiaotong University, Beijing 100044, China
2
School of Civil Engineering and Transportation, South China University of Technology, Guangzhou 510641, China
*
Author to whom correspondence should be addressed.
Systems 2025, 13(5), 380; https://doi.org/10.3390/systems13050380
Submission received: 24 March 2025 / Revised: 3 May 2025 / Accepted: 8 May 2025 / Published: 14 May 2025
(This article belongs to the Section Systems Practice in Social Science)

Abstract

:
Basic public service (BPS) serves as a crucial connection between governments and citizens, impacting the standard of living and well-being of the populace. Can High-Speed Rail (HSR) service incentivize local governments to improve the fiscal competition model of prioritizing production over public service to expand the supply of public services? This study empirically examines the impact of HSR service on the provision of BPS based on panel data from 282 cities in China during the period from 2008 to 2020. The findings indicate that improvements in HSR service significantly stimulate the provision of BPS, a result that withstands various robustness tests. An analysis of mechanisms reveals that HSR service enhances the provision of BPS by mitigating tax competition and fostering fiscal expenditure competition among local governments. Furthermore, this study demonstrates that the positive impact of HSR is more pronounced in cities characterized by high levels of fiscal decentralization and financial autonomy. In western regions and peripheral cities, HSR service has a more pronounced effect on BPS provision. Ultimately, this study offers valuable policy insights for governments to optimize fiscal expenditure structures and bolster social governance capabilities.

1. Introduction

The UN 2030 Agenda acknowledges that increased levels of human welfare play a significant role in bolstering regional resilience to global threats and challenges [1]. The 2030 Agenda comprises a Declaration along with 17 Sustainable Development Goals (SDGs) and 169 related targets. Within the framework of the 2030 Agenda, targets include enhancing BPS, referring to quality education, good health, and employment security. BPS is a complex system that impacts the standard of living and well-being of the populace [2]. Regrettably, the 2023 SDGs progress report indicates that certain targets concerning the quality of life and economic growth have failed to reach anticipated levels of progress [3]. In comparison to high-welfare developed nations, developing countries, notably China given its substantial population, encounter more acute public service concerns. Enhancing BPS has emerged as a pressing matter necessitating a prompt resolution in China. Improving individuals’ welfare stands as a paramount objective in bolstering governmental efficacy. While China has made substantial economic advancements since the initiation of its reform and opening-up policies, local governments have prioritized boosting local economic development through a fiscal expenditure structure that focuses on production over improving public services related to people’s survival [4]. This approach has led to an inadequate provision of BPS, with disparities persisting in the allocation of educational resources, healthcare accessibility, and the inclusivity of social security provisions. These challenges impede both economic and social progress in China and the advancement of social equity. The increasing need for education, healthcare, social security, and other vital services highlights the need to enhance the quality of BPS and narrow urban–rural disparities. Addressing these issues is crucial for bolstering the government’s capacity for effective governance [5,6].
The current literature predominantly discusses the impact of technological innovation [7,8], citizen engagement [9,10], and organizational capacity [11,12] on BPS. Local governments hold a crucial role in public service delivery, serving as the main interface between citizens and government services [13,14]. The official promotion strategy, based on economic development indicators [15], incentivizes local governments to prioritize investments in productive economic sectors rather than public service, resulting in the neglect of public service supply. The matter of motivating local governments to enhance the provision of BPS has not received sufficient attention.
HSR has emerged as a transformative transportation infrastructure that has revolutionized mobility and shaped regional development in the modern era. At the end of 2020, the mileage of High-Speed Railway in operation in China had reached 38,000 km, approximately two-thirds of the total operational mileage of HSR in the world. Figure 1 shows the number of HSR passengers (millions) in 2020. The ongoing construction of HSR networks is expected to persist, especially in major emerging economies in the Southern Hemisphere [16].
The previous research has predominantly concentrated on the effects of HSR on the spatial distribution of regional economies [17], the enhancement of industrial structures [18], and the movement of factors [19]. The existing literature does not adequately address the impact of HSR as an interregional infrastructure on government behavior, and only a limited number of papers examine the influence of HSR on government expenditure bias [20,21]. HSR contributes to breaking down market segmentation [22,23] and promoting cross-regional population movement [24,25]. Does HSR effectively incentivize local governments to shift their fiscal expenditure structure from prioritizing production to expanding the supply of public services? The potential impact of HSR on BPS and its underlying mechanism remains uncertain. Thoroughly exploring these questions not only assists in enhancing the local government competition model and fiscal expenditure structure but also contributes to the realization of sustainable social development.
This paper uses the data of 282 cities in China from 2008 to 2020 and employs a two-way fixed effects model to verify the impact of the HSR train frequency on the provision of BPS. The marginal contributions of this study are as follows: (1) The HSR service is linked to the supply of BPS using a theoretical analytical framework of tax competition (TC) and fiscal expenditure competition (FEC) among local governments. (2) The impact of HSR on the supply of BPS by local governments was empirically tested from the perspective of HSR train frequency. Most of the existing literature use the HSR-DID (dummy) variable to explore the impact of HSR, ignoring the heterogeneous effects of the operation of HSR on cities. The HSR train frequency can reflect not only the presence of HSR connection but also the intensity of the HSR connection, which can be a better measure of the development of HSR. Using the HSR train frequency also circumvents the information omission caused by using the HSR-DID dummy variable. In addition, the HSR train frequency accurately reflects the intensity of the impact of HSR service on population mobility and market integration. In summary, this approach overcomes the estimation bias arising from the omission of information when using a dummy variable for the opening of HSR or not, which is common in the existing literature, and enriches the theoretical research on improvements in BPS.
The rest of this paper is organized as follows: Section 2 provides a comprehensive review of the relevant literature. Section 3 analyzes the theoretical framework and formulates the research hypotheses. Section 4 describes the source of the data and methodology. Section 5 reports an empirical analysis of the estimation results. Section 6 concludes the study and provides relevant policy implications as well as research prospects.

2. Literature Review

2.1. Impact of HSR on Labor Mobility

HSR affects the spatial layout of the labor force and promotes the intercity mobility of labor and other factors of production, prompting individuals and families to make new residence choices [25,26]. Studies that examine how HSR affects the spatial distribution of the labor force are conducted from a different point of view: the labor force’s clustering in node cities or dispersion to peripheral cities.
Some researchers have argued that HSR influences labor force agglomeration in the central region. The opening of HSR compresses the time space distance between cities [27], improves regional accessibility, and generates agglomeration effects in economic node areas [28]. The opening of HSR enhances the population’s attraction to megacities and strengthens the population agglomeration effect [29]. Some scholars further analyzed the impact of HSR on the spatial distribution of a heterogeneous labor force: the opening of HSR promotes the inflow and agglomeration of highly skilled personnel [25]. Some studies have suggested that HSR can promote the dispersion of labor from the central city to the periphery. Sasaki et al. [30] argued that the Shinkansen network’s expansion promotes the population’s spatial dispersion by constructing a supply-oriented regional econometric model.

2.2. Impact of HSR on Market Integration

The development of transportation infrastructure, such as HSR, has been demonstrated to enhance market integration [23]. The existing literature mainly examines the impact of HSR on market integration from two aspects. First, HSR and other transportation infrastructures result in time–space compression. Transportation infrastructure can alleviate information asymmetry between regions due to their geographic distance and mismatch of resources [29,31], thus reducing the level of market segmentation [23,32]. Second, by reducing transport costs and breaking trade barriers, HSR and other transportation infrastructures promote factor flow to less developed areas and accelerate market integration [33,34].

2.3. The Impact of Fiscal Competition on the Supply of BPS

The fiscal system is of great significance in incentivizing local governments. Under the fiscal decentralization system, there is a contractual relationship between the central government and local governments. Local governments have the “Residual Claim”: carrying out fierce horizontal competition to compete for tax resources and economic development [35]. On the one hand, horizontal competition incentivizes local governments and promotes rapid economic development. On the other hand, to compete for tax resources, local governments participate in a “race to the bottom” through tax rebates, financial subsidies, and the relaxation of tax collection management, which stimulates local protectionism. This disorderly and illegal tax competition is contrary to the principle of tax neutrality; it impedes the free flow of production factors [36], is not conducive to market integration [37], and negatively affects the progression of market integration [38]. Uncontrolled tax competition among local governments leads to the distortion of their fiscal expenditure structures, where they favor productive expenditures and neglect public expenditures [39]. Excessive competition among local governments for tax incentives for capital, technology, and other factors of production leads to the insufficient supply of public services [40,41,42]. On the other hand, local governments’ TC leads to the “prisoner’s dilemma”, resulting in a low equilibrium tax rate and a general reduction in fiscal revenues, which restricts the supply of BPS [43,44].
China’s economy has developed to a new stage, where simple tax concessions can no longer effectively attract resources, and uncontrolled TC reduces the economic [40,45] and resource allocation efficiency [46]. Residents have a higher demand for education, medical care, and social security, which motivates the local government to provide public goods and increase the supply of public services [43]. TC and FEC coexist in practice. As the economy advances, FEC progressively supplants TC, emerging as the primary strategy in the fiscal competition among local governments. Focusing solely on TC when studying the impact of fiscal competition on the supply of BPS fails to provide a comprehensive understanding of the issue. Therefore, based on the race to bottom encouraged by TC, local governments have engaged in FEC to encourage labor inflow and agglomeration.
Talent is an important element of government competition, and BPS is an important factor in local governments’ competition for talent [47,48]. Tiebout [49] pioneered the concept of residents “voting with their feet” on the premise that they have the freedom to move and choose their place of settlement, and governments are inclined to increase fiscal spending to enhance the provision of public services, thereby attracting more inhabitants. Based on Tiebout’s concept, other scholars have further confirmed the existence of local governments’ fiscal competition and its impact on the supply of BPS. Interregional fiscal competition has the characteristics of a strategic game: an increase in the fiscal expenditure in the surrounding areas leads to an increase in the local fiscal expenditure; if a local government increases the per capita healthcare expenditure by USD 1, the per capita healthcare expenditure of the neighboring areas will increase by USD 0.90 [50]. Wilson and Gordon [51] argued that FEC, as a means of government fiscal competition, is manifested in the expansion of BPS, ultimately leading to an improvement in the level of the BPS provision. FEC provides a competitive advantage by expanding the scale of the fiscal expenditure, improving the efficiency of fiscal expenditure, and improving BPS compared to other cities.

2.4. Summary of Existing Literature

Having reviewed the existing literature, we find the following problems: First, the existing literature mostly analyzes the mechanism of the BPS supply shortage from the perspective of the TC among local governments, and there is relatively little research on how to enhance channel mechanisms that increase the provision of BPS. Second, the existing literature on the economic effects of HSR lacks research on its impact on the behavior of local governments. HSR affects the economic behaviors of enterprises and individuals at the micro level, and the government’s “visible hand” also undergoes behavioral changes, which in turn affects the allocation of resources in the market. Third, the existing literature shows that HSR service can promote labor mobility and accelerate market integration from theoretical and empirical perspectives. Fiscal competition among governments is an important factor influencing the supply of BPS and is divided into TC and expenditure competition; the existing literature confirms that TC inhibits the provision of BPS and expenditure competition helps to increase it. Population mobility is one of the prerequisites for fiscal competition between governments, while HSR, as a cross-regional infrastructure, largely decreases the time cost of cross-regional population mobility and reduces the business communication cost of capital mobility, which provides natural exogenous shocks to population mobility and market integration. Therefore, there is a lack of theoretical and empirical research on whether HSR can affect the provision of BPS by influencing fiscal competition among governments.

3. Theoretical Analysis and Research Hypothesis

3.1. HSR and the Provision of BPS

HSR compresses the spatial and temporal distance between cities. On the one hand, HSR promotes the flow and agglomeration of labor and other factors of production between cities, prompting individuals and families to make new location choices [26,52]. Individuals and families make new location choices not only to increase their income but also to enjoy better BPS in cities. The level of public service is an important factor influencing labor inflow [50]. Ji et al. [53] integrates physical constraints and deep learning for trajectory tracking, offering useful insights for understanding how HSR systems may in turn influence urban policy behavior. Talent resources have become a significant embodiment of city competitiveness. HSR reduces the time and space costs of labor mobility and improves its efficiency. In addition, HSR provides more possibilities for residents to access high-quality BPS, and the opening of HSR enhances the bias of the local government’s livelihood expenditures [21]. On the other hand, the construction of transportation infrastructures, such as HSR, contributes to market integration, reduces the degree of market segmentation [23], and effectively reduces the cost of the flow of production factors and the degree of information asymmetry [31]. Within the analytical framework of new economic geography, market integration promotes economic agglomeration and gives rise to the phenomenon of “agglomeration rent”: enterprises have a higher rate of return on capital due to a decline in trade costs and the spillover of knowledge and technology, resulting in an agglomeration effect that entices enterprises to relocate. Local governments levy taxes on agglomeration rent to increase tax revenues, and enterprises’ returns via agglomeration rent reduce their sensitivity to the tax rate [54]. Enterprises would not relocate to new regions due to local government tax rate adjustments. “Agglomeration rent” weakens the incentives for local governments to engage in TC, which leads to the race to the bottom [55,56]; increases government tax revenue; optimizes the structure of fiscal expenditure; and increases the provision of BPS. Based on this, this paper proposes the following hypothesis:
H1: 
HSR service can effectively increase the provision of BPS.

3.2. The Mechanism of HSR Influencing the Provision of BPS

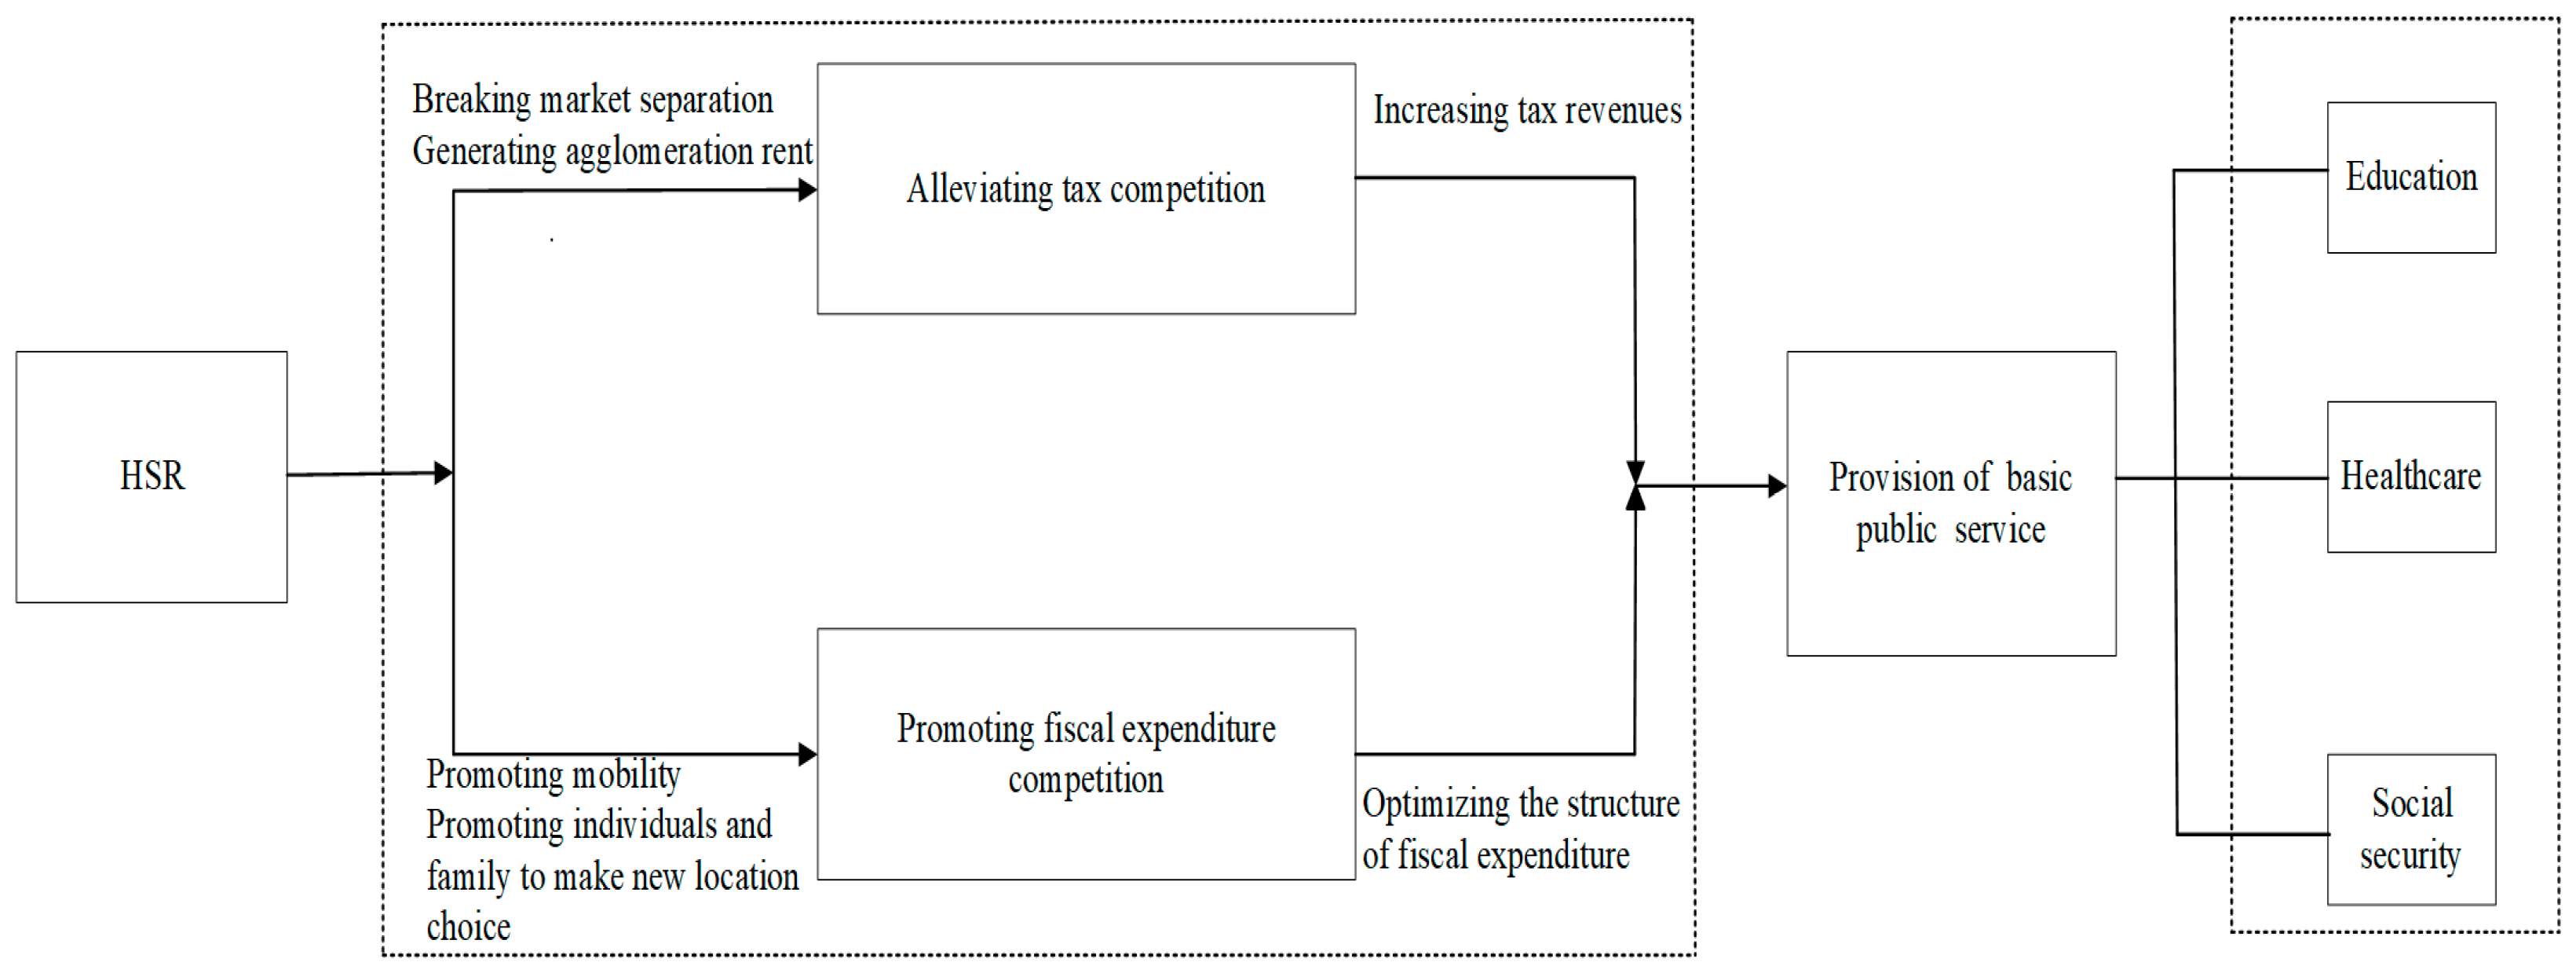
HSR increases the provision of BPS by alleviating the TC among local governments. HSR and other transportation infrastructures help to reduce the logistics costs of the production factor flow to weaken the border effect [57] and improve the efficiency of market transactions. First, HSR has the effect of time–space compression, which significantly shortens the travel time between cities, improves the accessibility of cities, and effectively alleviates the market segmentation caused by the natural environment [58]. Second, HSR facilitates the flow of highly skilled personnel across the region to improve the level of technology and knowledge spillover, alleviating technical segmentation [25]. HSR service improves the linkage between regions, and enterprises allocating resources across the region are more likely to see greater returns, which contributes to the realization of market integration [23]. Within the analytical framework of new economic geography, market integration generates regional agglomeration effects through multiple channels, such as reducing transaction costs, pooling labor reserves, sharing inputs, and facilitating knowledge spillovers. The agglomeration effect provides more profitability opportunities and higher rates of return for firms and capital [59]; the resulting benefits are known as “agglomeration rent”. Economic agglomeration creates a “lock-in effect” [55]: firms are willing to bear a heavier tax burden to take advantage of agglomeration rent, are less sensitive to tax burdens [60], and are less likely to relocate to new regions due to local government tax rate adjustments. Local governments maintain higher tax rates by taxing agglomeration rent, which diminishes the impact of tax incentives on the decisions of businesses to move their operations to certain locations, thereby reducing the motivation of local authorities to offer tax incentives, such as rebates and relaxed tax regulations, to draw in resources, ultimately alleviating the efficiency loss resulting from the race to bottom motivated by TC [56]. Agglomeration rent eases the fiscal pressure on local governments and increases their tax revenue, which contributes to the provision of BPS. HSR service increases the provision of BPS by alleviating the TC among local governments and optimizing the level of the tax burden [41] and the structure of fiscal expenditures [61].
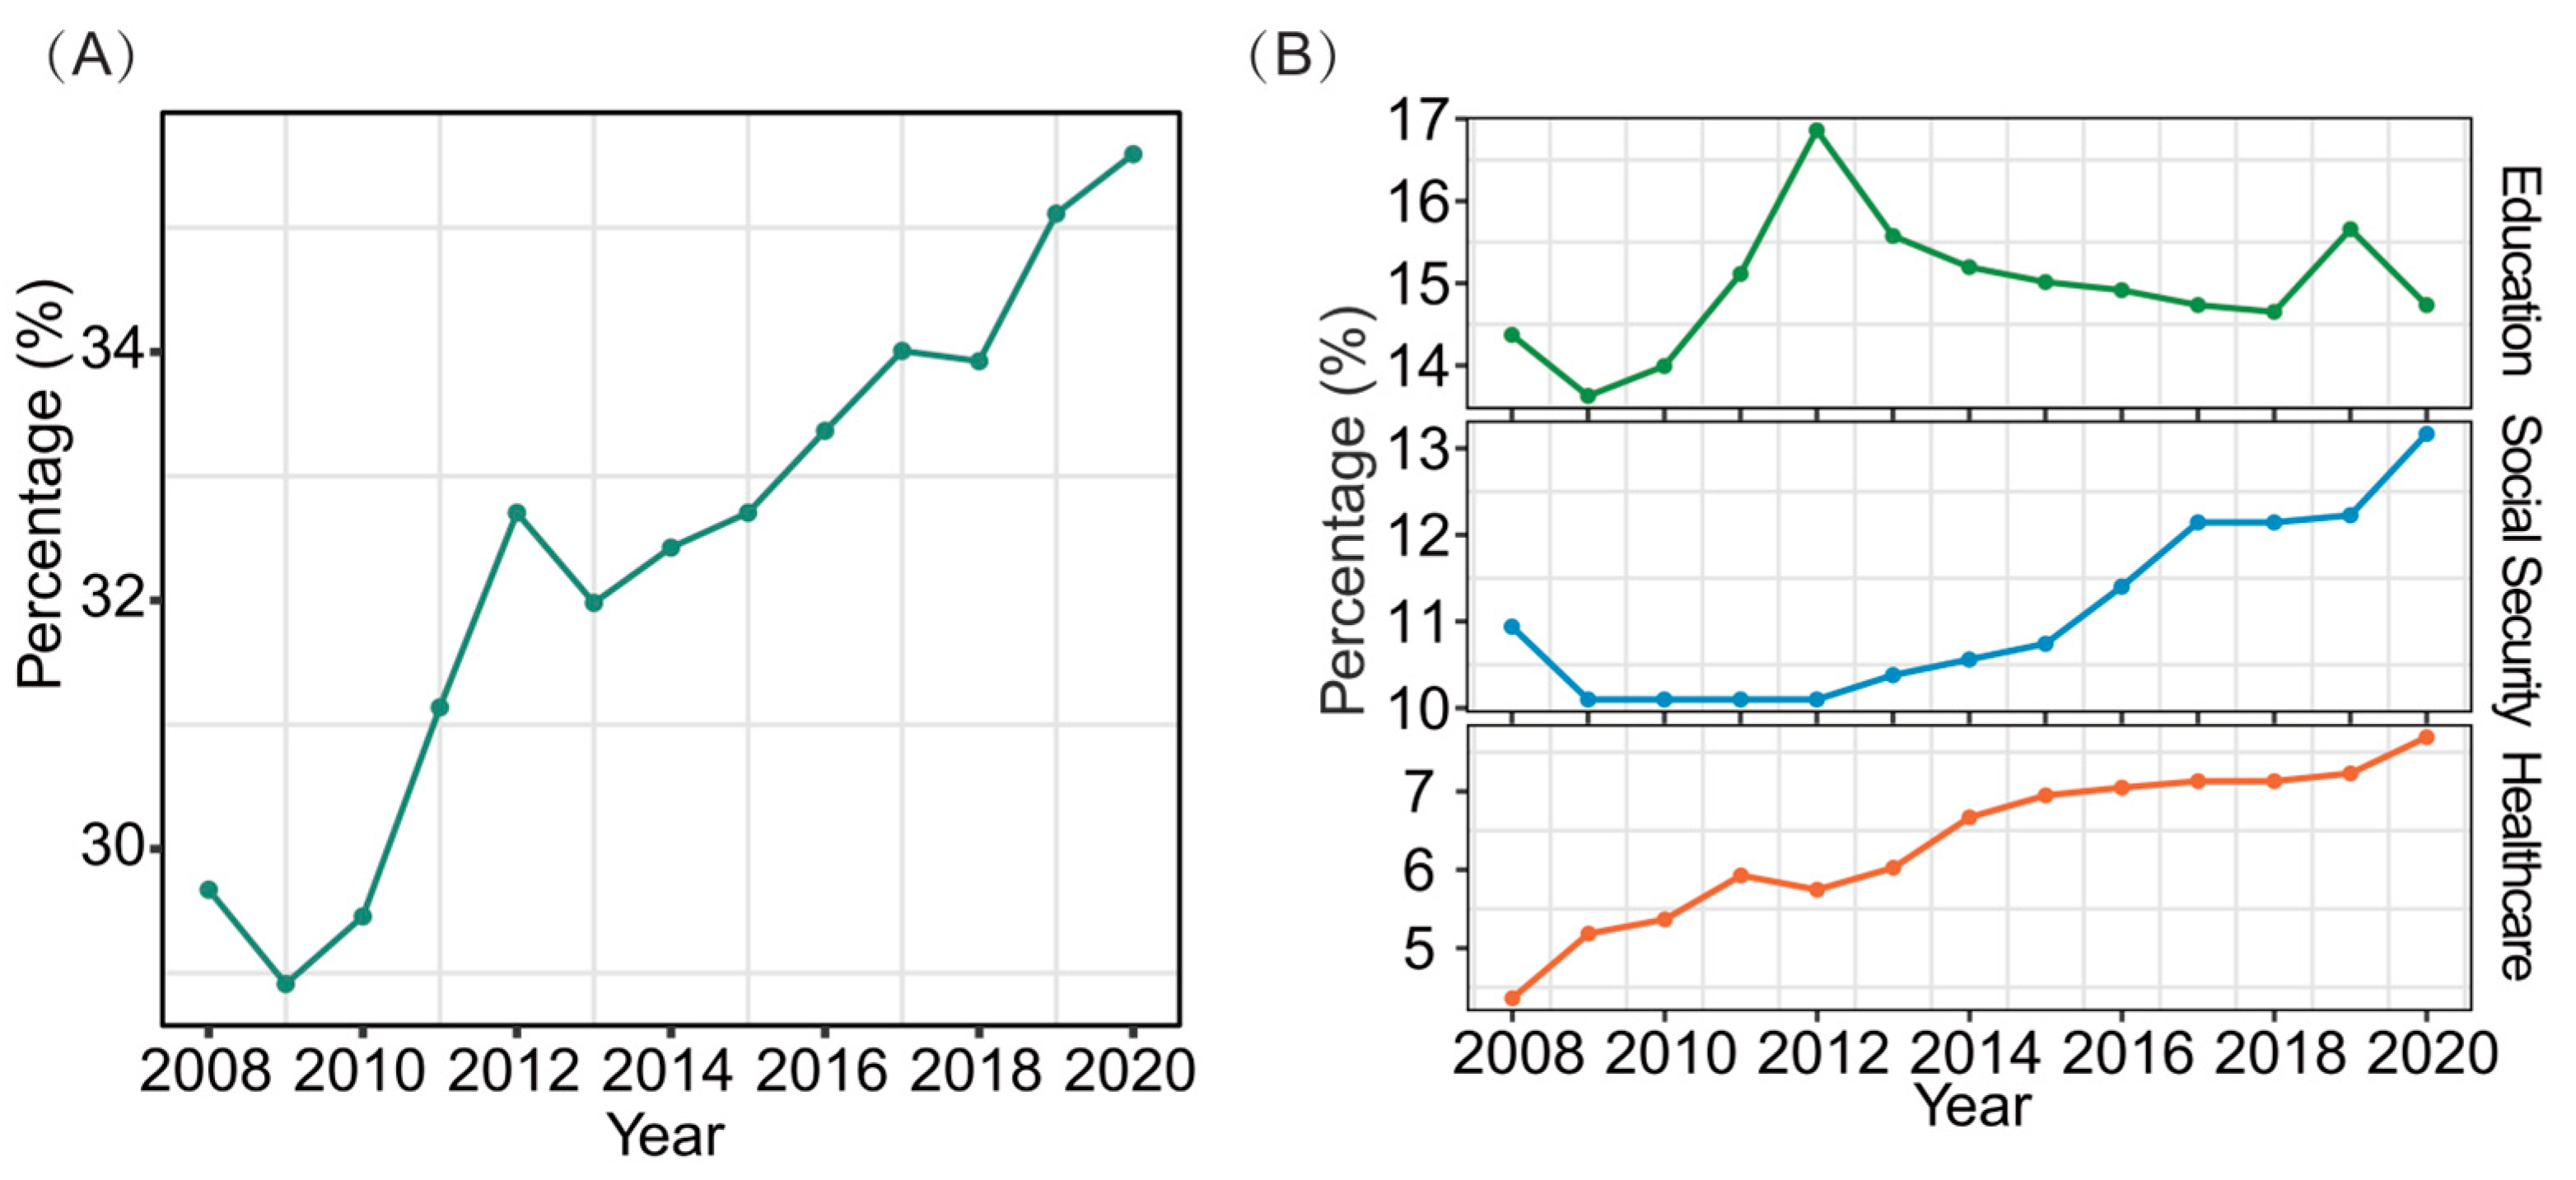
HSR increases the provision of BPS by promoting the FEC among local governments. HSR promotes the agglomeration of highly skilled labor in the inflow area [25], enhances the population attraction capacity of the city, and accelerates the population agglomeration effect. Under the framework of fiscal decentralization, local governments engage in horizontal competition by expanding the scale of fiscal expenditures to deliver desirable public service for residents within their jurisdictions, thereby attracting the inflow of the factors of production and resources [62]. Talent resources have become an important manifestation of the competitiveness of cities. In order to secure a competitive edge, local governments strive to encourage a population influx to their areas and participate in fiscal expenditure rivalry. This manifests in adjustments to the scale and structure of fiscal expenditures with the aim of improving the supply of public goods, thereby attracting effective external resources [48,49]. Figure 2 shows that the proportion of the BPS expenditure in China’s general public budget expenditure has been steadily increasing. Specifically, the proportion of expenditures on education, healthcare, and social security, in general, also exhibits an upward trend. Figure 2 illustrates the progressive change in government fiscal expenditure structures, demonstrating a prioritization of BPS. HSR can incentivize local governments to expand BPS expenditures, such as education and healthcare, by facilitating population mobility [21]. This enhanced resource mobility creates favorable conditions for local governments to engage in fiscal competition [21]. Consequently, a strategic interregional fiscal competition arises, where an uptick in the neighboring regions’ fiscal expenditure drives an increase in local expenditure [63]. FEC is conducive to improving the quality of BPS [51].
In conclusion, the following hypotheses are advanced:
H2a: 
HSR increases the provision of BPS by alleviating TC among local governments.
H2b: 
HSR increases the provision of BPS by promoting FEC among local governments.
Based on the above theoretical analyses, the conceptual framework is summarized in Figure 3.

4. Data and Methodology

4.1. Variable Definition

4.1.1. Explained Variables

In this study, the provision of basic public services (BPS) was chosen as the explained variable. China’s “14th Five-Year Plan for Basic Public Service” states that services related to people’s survival should include the following aspects: “care for the young, education for all, stable employment, medical services, elderly care, housing for all, and support for the vulnerable”. According to the functional classification of government organizations by the United Nations, the International Monetary Fund, and the OECD, BPS covers the following three aspects: healthcare, education, and social security. Given the diversity of the scope of public services provided by local governments, this study focused on BPS closely related to the survival rights of citizens, considering the accessibility and comparability of data and referring to prior research [21,64,65], and a comprehensive evaluation index of BPS was constructed based on three aspects: healthcare, education, and social security (see Table 1).
On this basis, all the indicators were processed without dimensions, as described by Wang and Xu [66], where the supply of BPS was measured using Principal Component Analysis (PCA). Before using PCA, it is necessary to conduct the KMO test and the Bartlett Test of Sphericity to verify whether the data are suitable for PCA. The KMO test is used to measure the correlation among variables. The closer the KMO value is to 1, the stronger the correlation among variables, indicating that the data are more suitable for PCA. The Bartlett Test of Sphericity is used to examine whether the covariance matrix of variables is close to a normal distribution and a uniform distribution. The null hypothesis of the Bartlett Test of Sphericity is that there is no significant correlation among variables. The Degree of Freedom (df) reflects the number of pairwise variable combinations and determines the critical chi-square threshold for hypothesis testing. The approximate chi-square statistic quantifies the deviation of the observed correlation matrix from the null hypothesis of independence. A higher approximate chi-square value indicates stronger correlations among variables, thus supporting the suitability of PCA for dimensionality reduction.
The KMO test and Bartlett’s Test of Sphericity were conducted on the basic data. The KMO value was 0.729, indicating that the data sample was acceptable. In Bartlett’s Test of Sphericity, the p value was 0.000, indicating that the data are significantly suitable for PCA (See Table 2). The analysis entailed reducing the dimension of each indicator, followed by the calculation of indicator weights through a factor loading matrix, to determine whether the selected indicators meet the criteria for PCA. Then, the weighted average of each variable was calculated to obtain the composite index of the supply of BPS.

4.1.2. Core Explanatory Variable

The HSR train frequency (Ln(Hsr + 1)) was selected as the core explanatory variable, and the HSR service in a given city was measured by the number of HSR trains stopping in the city in the same year.
Firstly, the data on the names of all railway stations in the 282 cities are from the 12306 website. 12306 is the official ticketing and operational data platform of China State Railway Group Co., Ltd. (Beijing, China), offering real-time HSR data on ticket sales, schedules, and network coverage. Secondly, this study employed the Yingdao RPA software (v5.21.27) to cycle through the data of the names of all railway stations in these 282 cities on the JIPIN Train Timetable, LuLu Tong Timetable, and Sheng Ming Timetable, thereby acquiring the information on the HSR stopovers in these 282 cities. Subsequently, this study used an in-house Python script (v3.1) to further process the information on the HSR stopovers in these 282 cities. Taking into account the situation where a single HSR train makes stopovers at multiple railway stations within the same city, this study removed duplicate instances where the same HSR stops at multiple train stations in the same city. Finally, this study summed up the number of HSR stopovers in terms of the HSR train frequency. In this study, data from the National Railway Passenger Train Timetable for a certain day in each year between 2008 and 2020 were selected as sample data, and the number of HSR trains stopping in the city on that day was calculated and multiplied by 365 to obtain the number of HSR trains stopping in the city in the year.
The average operating speed of “G” HSR ranges from 250 km/h to 350 km/h, and those of “D” HSR and “C” HSR range from 160 km/h to 200 km/h. One of the most important factors affecting the movement of labor, capital, and other factors of production is time–space compression. Compared to “D” HSR and “C” HSR, “G” HSR demonstrates more pronounced time-space compression advantages. This technological superiority enables “G” HSR to facilitate the efficient flow of production factors—particularly labor mobility and capital allocation. Consequently, “C” HSR and “D” HSR are excluded from the sample. Although HSR is slower than airplanes, its punctuality and service frequency are higher; moreover, airplanes have denser flights only between China’s major cities, whereas HSR connects large, medium-sized, and small cities at high densities, so the impacts of the cross-regional mobility of populations and capital are more extensive [20].

4.1.3. Control Variables

In order to comprehensively study the impact of HSR on the supply of BPSs and avoid the omission of variables, which leads to bias in the research results, based on the existing literature [67], the following variables were selected as control variables that influence the supply of BPS: (1) urbanization rate (urban): the proportion of the year-end urban population to the total year-end population of the city; (2) industrial structure upgrading (industrct): the proportion of the added value of the tertiary industry to the GDP of the city; (3) years of education per capita (edup): [ (the number of people with primary school education + the number of primary school students) * 6 + (the number of people with junior high school education + the number of junior high school students) * 9 + (the number of people with senior high school education + the number of senior high school students) * 12 + (the number of people with a university or junior college education + the number of university or junior college students) * 16 ]/the total population aged 6 and above; (4) degree of fiscal decentralization (fd): the proportion of per capita fiscal expenditure in the city to the sum of per capita fiscal expenditures in the city, per capita fiscal expenditure at the provincial level, and per capita fiscal expenditure at the national level; (5) population density (lndens): the natural logarithm of the proportion of the city’s residential population to the city’s land area; (6) government size (scale): the proportion of municipal government consumption expenditure to municipal social consumption expenditure.

4.1.4. Mechanism Variables

To complement the theoretical analyses above, TC and FEC were selected as mechanism variables. The fiscal relationship between the central and local governments in China has developed from a system wherein local authorities take responsibility for their finances to fiscal decentralization, and local governments engage in intense horizontal competition based on promotion tournaments and GDP tournaments. HSR helps reduce market segmentation, promotes economic agglomeration, generates the phenomenon of “agglomeration rent”, and inhibits disorderly and illegal TC among local governments. Therefore, in this study, the index of TC was selected, and the relative tax rate was used as a proxy variable for TC [68,69]. On the other hand, the supply of HSR services promotes labor mobility, and local governments encourage population inflow through expenditure competition. Therefore, local government FEC indicators were selected, and the relative expenditure level was used as a proxy variable for FEC [70].
T a x c o m p e t i t = T a x i t ÷ G D P i t T a x t ÷ G D P t
In Equation (1), Taxit denotes the tax revenue of city i in year t, GDPit denotes the GDP of city i in year t, Taxt denotes the tax revenue of China in year t, and GDPt denotes the GDP of China in year t. The lower the relative tax rate, the higher the degree to which local governments use tax measures to engage in TC.
E x p e n c o m p e t i t = O u t l a y i t ÷ G D P i t O u t l a y t ÷ G D P t
In Equation (2), Outlayit denotes the public budget expenditure of city i in year t, GDPit denotes the GDP of city i in year t, Outlayt denotes the public budget expenditure of China in year t, and GDPt denotes the GDP of China in year t. The higher the level of relative expenditure, the higher the degree of participation of local governments in FEC.

4.2. Sample Selection and Data Source

Data from 282 cities in China from 2008 to 2020 were used in this study, covering 28 provinces, autonomous regions, and municipalities directly under the central government. Hainan Province and Zhoushan City in Zhejiang Province, which do not have direct HSR connections with other provinces, were excluded from the empirical study, and Tibet province and Xinjiang province were excluded from the study sample because of their large number of missing statistics. As a research sample to explore the impact of HSR on the supply of BPS, basic data were derived from the 2008–2020 China Urban Statistical Yearbooks, China Population Statistical Yearbooks, and China Financial Statistics Yearbook, and some of the missing data were filled in using the linear interpolation method. HSR train frequency data were used to reflect HSR service intensity. The HSR train frequency data were from the JIPIN Train Timetable, LuLutong Timetable, and Sheng Ming Timetable, and the railway stations in each city were through the official website of 12306. The descriptive statistics of the main variables are shown in Table 3. The mean values of BPS and Ln(Hsr + 1) are relatively small, while the standard deviations are relatively large, which reflects that there is a significant gap in HSR train frequency and BPS among different regions. In terms of the control variables, there are also significant differences among cities in aspects such as years of education per capita (edup), population density (lndens), and government size (scale), which reflects the diversity of economic and living conditions in Chinese cities.
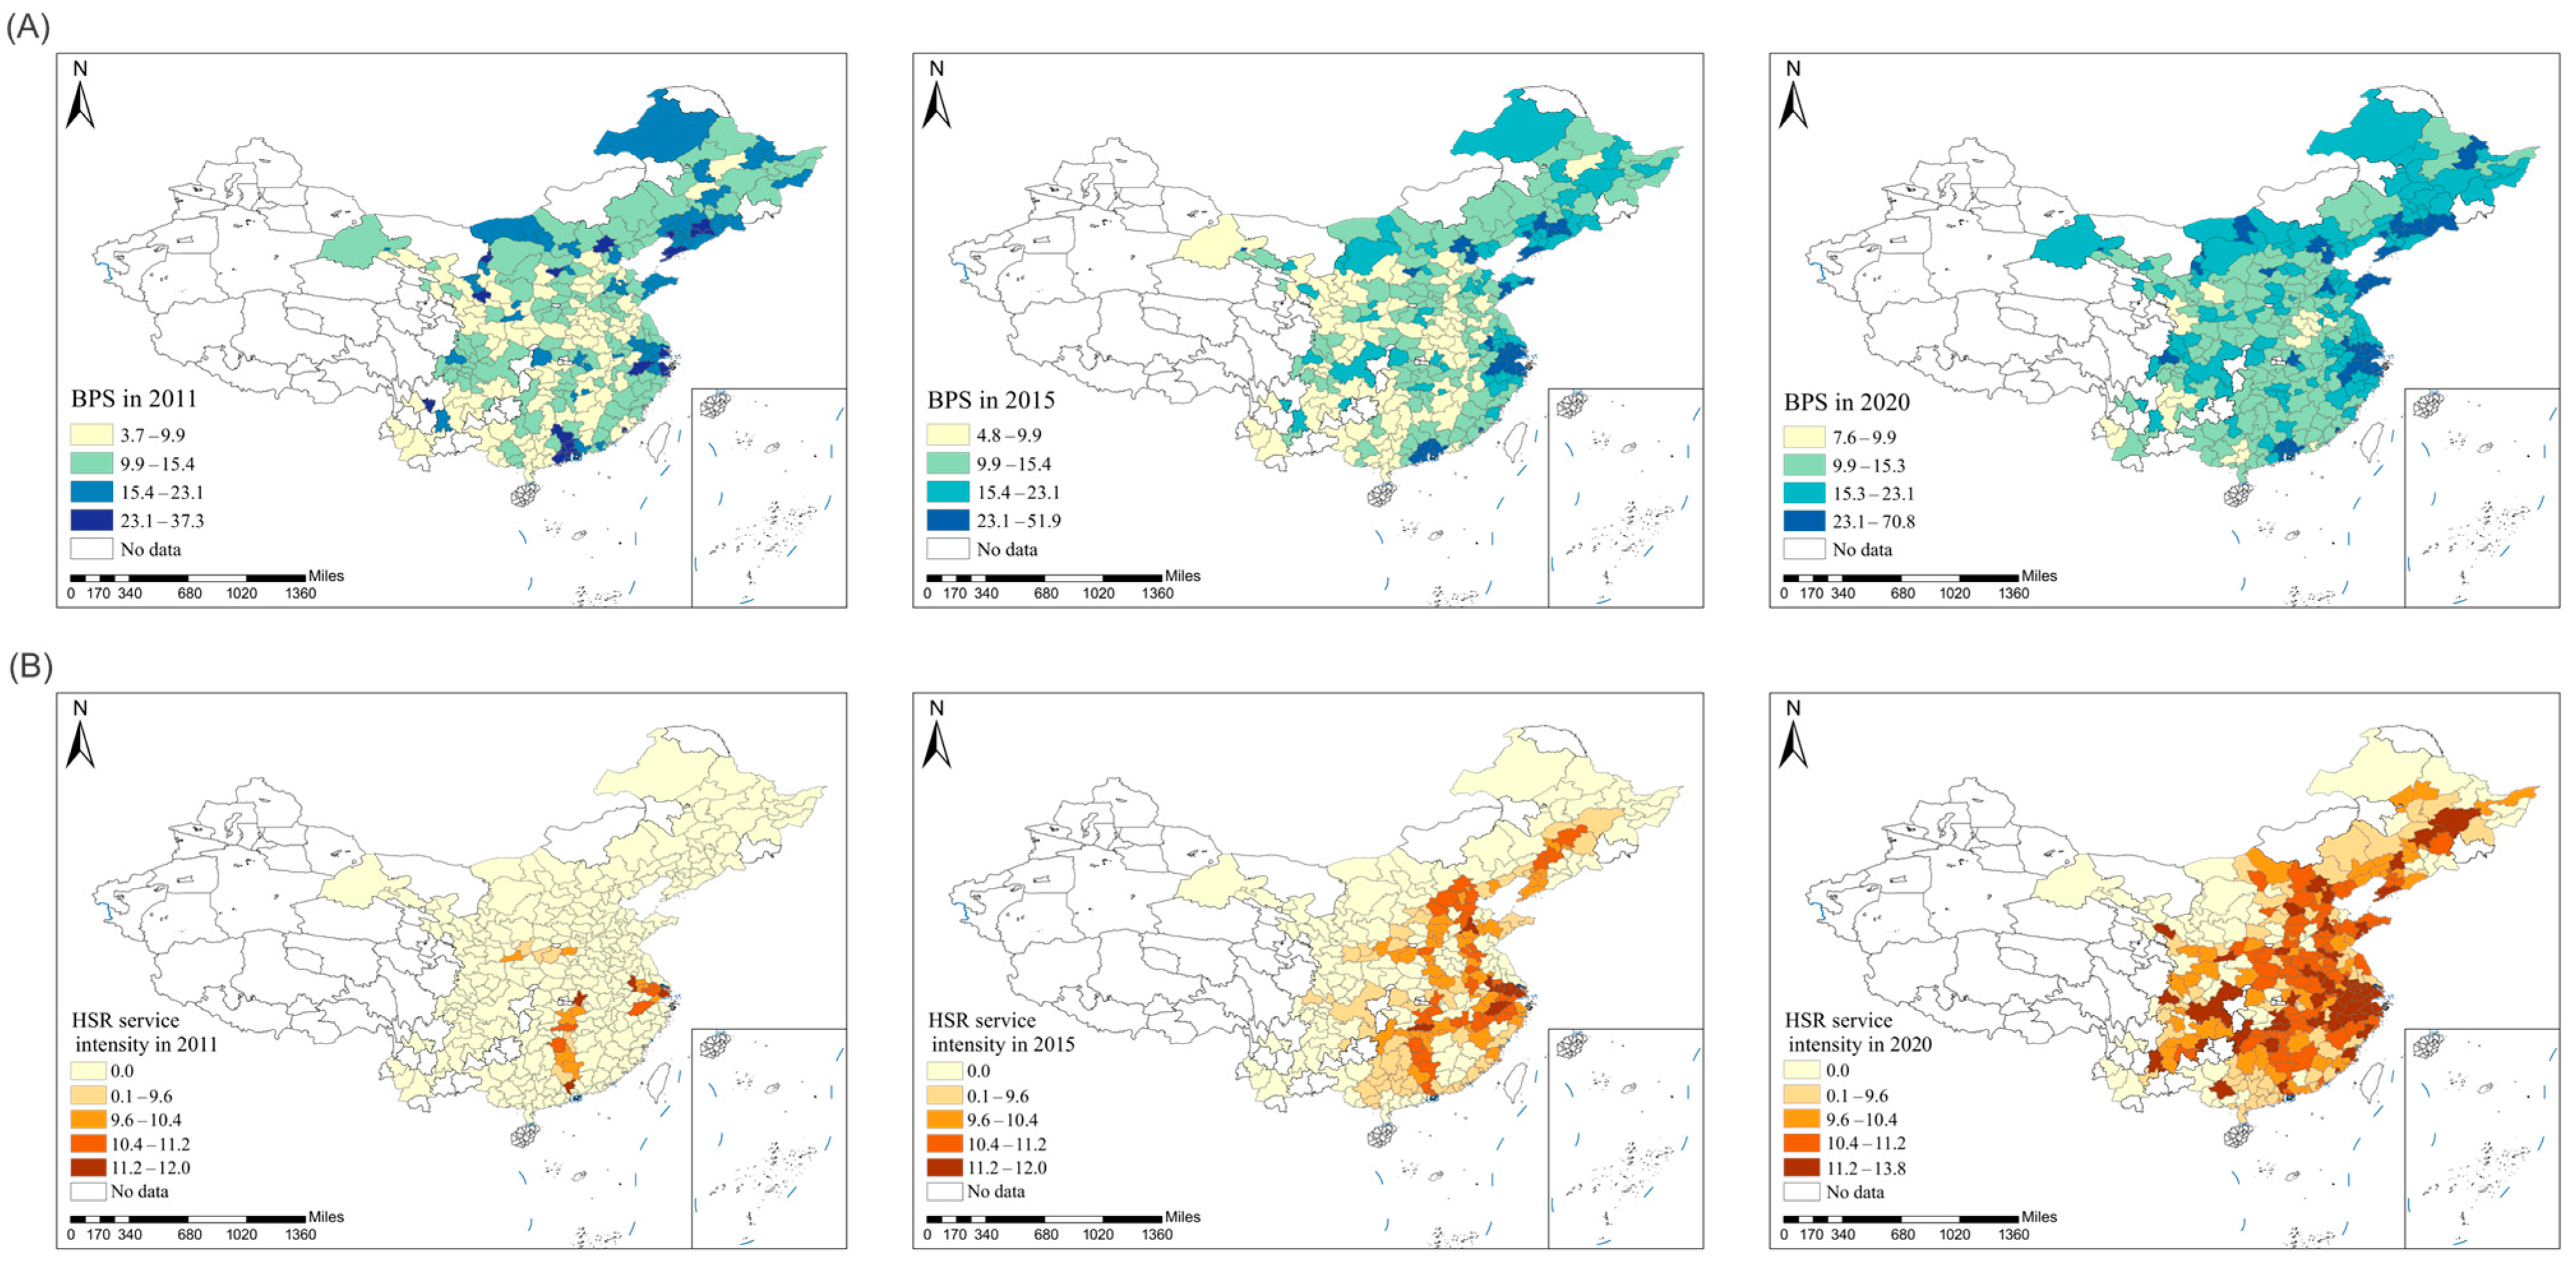
Figure 4 shows BPS and HSR service for the selected years of 2011, 2015, and 2020. The years 2011, 2015, and 2020 were selected as pivotal nodes: 2011 marks the completion of the initial phase of China’s “Four Vertical and Four Horizontal” HSR network plan; 2015 aligns with the mid-term expansion phase under the 12th Five-Year Plan; and 2020 serves as the endpoint for assessing long-term effects while coinciding with the critical observation window for the substantive implementation phase of the “Eight Vertical and Eight Horizontal” HSR network. Overall, there is a consistent trend in the changes in both BPS and HSR service. Nevertheless, variations in data distribution and dispersion highlight substantial differences in BPS and HSR development across cities. This suggests that while China has made significant strides in BPS, exploration and promotion efforts remain ongoing. Further research is warranted to explore the variations in the provision of BPS among different regions and administrative levels of cities, necessitating a thorough analysis of heterogeneity.

4.3. Model Specification

In line with the theoretical analyses and research hypotheses, to verify the direct impact of HSR train frequency on the provision of BPS, this paper constructs the following panel data two-way fixed effect model for testing
B p s i t = α 0 + α 1 L n H s r i t + 1 + γ X i t + μ i + φ t + ε i t
In model (3), i represents the city; t represents the year; BPSit is the explained variable, representing the supply of BPS in city i in year t; Ln(Hsrit + 1) is the core explanatory variable, representing the natural logarithm of HSR train frequency in city i in year t; and Xit represents the control variables, including the urbanization rate (urban), industrial structure upgrading (industrct), years of education per capita (edup), fiscal decentralization (fd), the natural logarithm of population density (lndens), and the government scale (scale). In addition, to improve the conclusion’s robustness, we additionally controlled for the fixed effects of city (μi) and year (φt), and εit is the random error term.

5. Empirical Results and Analysis

5.1. Analysis of the Baseline Regression Results

To verify the impact of HSR service on the provision of BPS, a progressive regression strategy was adopted in this study, and Table 4 reports the estimation results of model (3). Column (1) only reports the impact of HSR service on the provision of BPS without including control variables, and columns (2)–(7) sequentially include control variables that may affect the provision of BPS; all regressions control for unobserved regional and temporal characteristics by fixing the year and city effects, and robust standard errors are clustered at the city level. In all models with the gradual inclusion of control variables, the coefficient of Ln(Hsr + 1) is significantly positive at the 1% statistical level. Additionally, the gradual inclusion of control variables improves the model’s fit, effectively avoiding estimation errors caused by omitted variables. Column (7) shows that for every 1% increase in the HSR train frequency, the provision of BPS increases by 0.07. The above results indicate that the increase in the frequency of HSR service has a positive effect on the provision of BPS.
From the estimation results for the control variables, industrct, edup, and fd have significant positive effects on the provision of BPS, and scale has a significant inhibitory effect on the supply of BPS. The increase in industrct indicates that the proportion of tertiary industry belonging to the service sector increases, and the local government will increase its investment in BPS; the increase in edup indicates that the education level of the residents has increased, and their awareness of supervision and participation has increased, which contributes to an increase in the local government’s BPS [71]. The increase in fd indicates that the local government can be more sensitive to the demand for BPS and more accurate and efficient in its provision [49,67]; an increase in scale suggests that there is a bias toward squeezing the provision of BPS out of administrative overheads [72]. There is a positive correlation between lndens and the supply of BPS. An increase in lndens has a scale agglomeration effect, which increases the demand for BPS and, in turn, the supply of BPS by local governments. There is a negative correlation between urban and the supply of BPS; an increase in urban increases the demand for infrastructure construction, and the government’s pressure for infrastructure increases, prompting local governments to limit the supply of BPS for the sake of financing, which leads to a decrease in the supply of BPS.

5.2. Endogeneity Test

The baseline regression using the two-way fixed effects model can overcome the omitted variable problem of mixed OLS and RE models to a certain extent. The HSR train frequency is not completely randomly selected but is affected by multiple factors, such as the city’s geographic location, level of economic development, positioning function, etc. In order to reduce the reciprocal causality between the frequency of the HSR service and the supply of BPS, mitigate the impact of omitted variables, and prevent endogeneity from interfering with the research conclusions, the instrumental variable method was adopted, and a one-period lag was applied to the explained variables to solve the problem of endogeneity. In this paper, in accordance with Zheng and Kahn [73], we select the instrumental variable IVslope as follows: the geographic slope of each city as the instrumental variable. On the one hand, the difficulty of HSR construction in each city increases with the rise in the city’s geographic slope, which meets the correlation requirement for instrumental variable selection. On the other hand, there is no direct causal relationship between cities’ geographic slope and the provision of BPS, which meets the requirement for the exogeneity of instrumental variables. Since cities’ geographic slopes are historical, constant data that do not change with the time dimension, the interaction term between the geographic slope and the year variable was used as an instrumental variable for the two-stage least squares (2SLS) regression. In addition, considering that labor and other factors of production mobility brought about by the construction and operation of HSR generally have time-lagged effects [74], there is a certain lag in the impact of HSR on the provision of BPS. Therefore, as described by Luo et al. [75], a model was constructed with a one-year lag for the regression of the explanatory variables to further ensure the robustness of the research results.
Columns (1) and (2) of Table 5 report the regression results of the instrumental variables. The first-stage regression results in column (1) of Table 5 show that the geographic slope of the city has a significant negative correlation with the HSR train frequency. Specifically, an elevation in the city’s geographic slope leads to a decrease in the HSR train frequency. In addition, it is necessary to test the effectiveness of the selected instrumental variables. The Kleibergen–Paap rk LM statistic specifically evaluates whether the model suffers from a lack of identification, with the null hypothesis stating that the instruments have no statistically significant correlation with the endogenous regressors. The Kleibergen–Paap rk Wald F statistic addresses the weak identification problem by testing the null hypothesis that the instruments exhibit insufficient strength in their correlation with the endogenous variables. The results are reported in column (1) of Table 5. The Kleibergen–Paap rk LM is 29.380, which significantly rejects the original hypothesis of an insufficient identification of instrumental variables at the 1% level. The Kleibergen–Paap rk Wald F value is greater than the Stock–Yogo critical value of 16.38 at the 10% level, which rejects the weak instrumental variable hypothesis. Thus, the above tests collectively validate the technical reliability of the instrumental variable selection in this study.
The results of the second-stage regression shown in column (2) of Table 5 indicate that HSR’s estimated coefficient is positively significant at the 1% level. Column (3) of Table 5 indicates that the coefficient of Ln(Hsr + 1) is significantly positive at the 5% statistical level with a one-year lag. The HSR train frequency is positively correlated with the provision of BPS, aligning with the results of the baseline regression.

5.3. Robustness Tests

5.3.1. Addition of Potentially Omitted Control Variables

To mitigate potential estimation bias arising from omitted control variables [76], this study incorporates both population aging and the government debt level as additional control variables that might influence the provision of BPS [77,78] in the baseline regression model. Specifically, population aging ( p o p u l a t i o n a g i n g ) is operationalized as the proportion of residents aged 65 and above to the resident population at the city level, while the government debt level ( d e b t s c a l e ) is measured by the year-end government debt balance divided by the annual fiscal revenue.
The result is reported in Table 6. The coefficient of Ln(Hsr + 1) is 0.061, which is positively significant at the 1% statistical level. The coefficient of debtscale is 0.078, which is significant at 1% statistical level, while the coefficient of populationaging is −0.004, which lacks statistical significance. By controlling the variables of populationaging and debtscale, Ln(Hsr + 1) still has a significant promoting effect on the provision of BPS, which proves the reliability of the results of the baseline regression.

5.3.2. Difference in Difference Estimation

In baseline regression, this study constructs the two-way fixed effect model for testing. To enhance the robustness of the conclusion, this study switched to the multi-period DID model to re-examine the relationship between HSR and BPS (see model 4):
B p s i t = α 0 + α 1 H S R D I D i . t . + γ X i t + μ i + φ t + ε i t
This study constructed the HSR opening dummy variable ( H S R D I D i t ), which equals to h s r i × a f t e r i . t ; if city is connected to the HSR service then h s r   = 1, otherwise h s r = 0. If the sample year is after the year of HSR opening then a f t e r = 1, otherwise a f t e r = 0. To make it easy, this paper uses H S R D I D i t to denote h s r i × a f t e r i . t .
The result is reported in column (1) of Table 7. The coefficient of H S R D I D is 0.460, which is positively significantly at the 1% statistical level, suggesting that the opening of HSR can improve the provision of BPS, confirming the robustness of the baseline regression.

5.3.3. Parallel Trend Test

The parallel trend test serves as a critical prerequisite for multi-period DID analysis. To examine whether model 4 satisfies the parallel trend assumption, this study constructs the following test model by adopting the methodological framework proposed by Beck et al. [79], which is widely employed for verifying parallel trends in policy evaluation research.
B p s i t = ρ 0 + 10 9 ρ 1 H S R D I D i . t . + ρ 2 X i t + μ i + φ t + ε i t
This study establishes a 19-year observation period (spanning from 10 years before to 9 years after the opening of HSR, which is denoted by 10 9 ρ 1 H S R D I D i t ) to implement the parallel trend test. Under the DID framework, the validity of the parallel trend assumption is supported if all pre-intervention coefficients for HSR remain statistically insignificant but statistically significant in any year subsequent to it.
Figure 5 shows the test result of the parallel trend of the opening of the HSR on the provision of BPS. The empirical results demonstrate that the 95% confidence intervals encompass 0 in all pre-treatment periods (before the opening of HSR), with statistically insignificant coefficient estimates for both treatment and control groups, which validates the appropriateness of employing the multi-period DID framework. Post-intervention analyses reveal that the 95% confidence intervals exclude 0 and are consistently positive, demonstrating a statistically significant positive effect of HSR on BPS. Furthermore, the temporal pattern of coefficient estimates—insignificant pre-treatment divergence followed by sustained post-treatment significance—provides robust evidence satisfying the parallel trend assumption. Therefore, this study successfully passes the parallel trend test required for causal identification in DID designs.

5.3.4. Placebo Test

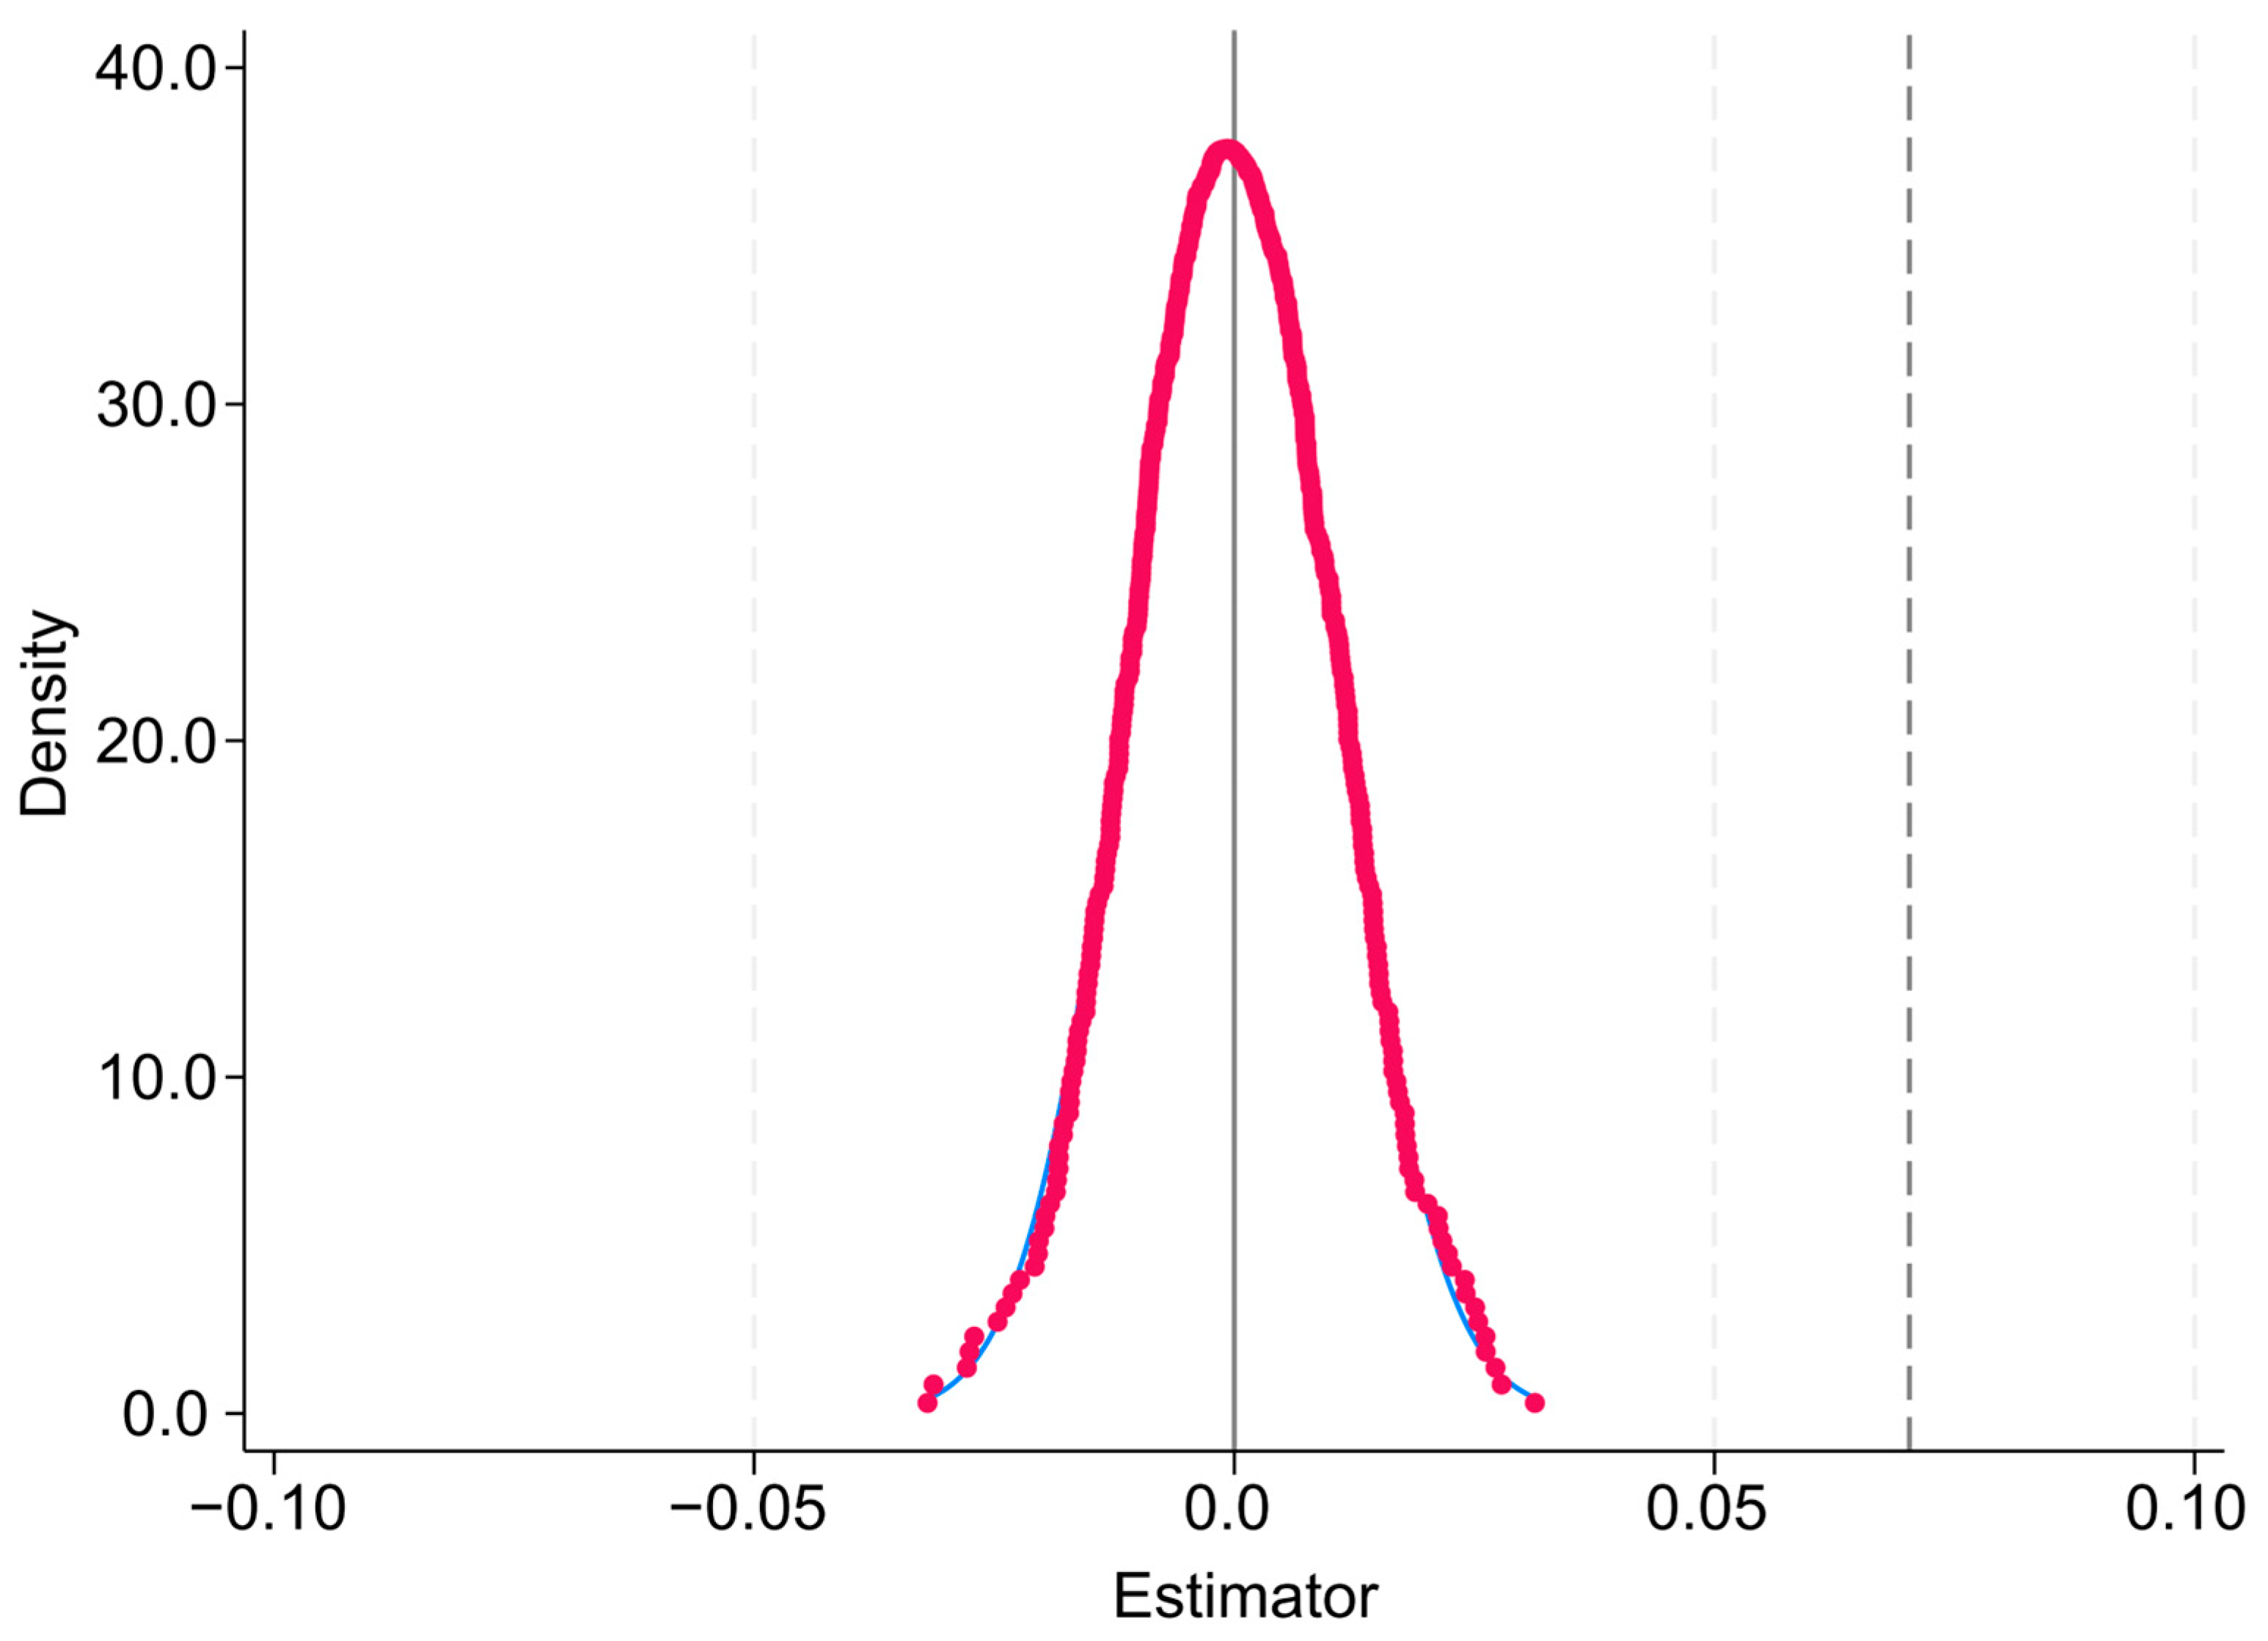
The correlation identified between HSR and the provision of BPS in the aforementioned analyses could potentially be attributed to temporal trends or chance occurrences. In order to address this potential confounding factor, a placebo test was performed by randomly generating an indicator for the HSR train frequency. From the full sample, 500 regressions were conducted by extracting and randomly assigning all core explanatory variables to determine the estimated coefficient density distributions and T-values. Figure 6 shows that the randomized coefficients are normally distributed with a mean value of 0. This indicates that most of the estimated coefficients are equal to 0. Figure 7 shows the distribution of random t-values. The randomly derived t-values are smaller than the t-value of 2.619 in the baseline regression, which proves that the baseline regression results are not random. Therefore, it can be inferred that HSR increases the provision of BPS. The above results reconfirm the reliability of baseline regression.

5.3.5. Replacement of Core Explanatory Variables

This study selects two methods to replace the explanatory variable. The first is to replace Ln(Hsr + 1) with the HSR network indicator, and the second is to replace Ln(Hsr + 1) with the number of HSR stations.
This study introduces an indicator to characterize the centrality of each node city within the network. Node centrality measures are typically categorized into three dimensions of network centrality: Degree Centrality (DC), Closeness Centrality (CC), and Betweenness Centrality (BC). Among these, DC has been extensively applied, refers to the connection between nodes, and can be divided into an input degree and output degree distinguished by the connected direction [80]. DC describes the interaction ability of a node city with other cities. The higher the value of this indicator, the more cities are directly connected to this node city and the greater its influence within the network. In this study, the relative DC is used, and the specific formula is:
D C i t = i = 1 , i = t n K i t n 1
K i t denotes the number of direct connections between node city i and other cities in HSR network in year t, and n represents the total number of node cities. The relative DC ranges between 0 and 1. A value closer to one indicates that the node city holds a more central and influential position within the network.
The result is reported in column (2) of Table 7. The regression coefficient of DC is 10.922, which is positively significant at the 1% level, suggesting that HSR network has a positively significant effect on the supply of BPS.
The number of HSR stations reflects, to a certain extent, the convenience of entering one city from another city via HSR and the intensity of communication between cities through HSR. Referring to the study of Wong et al. [81], we conducted a robustness test by replacing the HSR train frequency with the number of HSR stations. Therefore, the number of railway stations with “G” train stopping information was used as the indicator of HSR service, and the core explanatory variables were replaced to conduct the robustness test. The regression results are shown in column (3) of Table 7. The coefficient of the number of HSR stations is 0.253, which is positively significant at the 1% level, suggesting that HSR service has a significant positive effect on the supply of BPS.

5.3.6. Substitution of Explained Variables

The proportion of the BPS expenditure to the fiscal expenditure reflects local governments’ preference for and emphasis on BPS. Therefore, referring to the method used by Meng et al. [21], we used the proportion of the BPS expenditure to the fiscal expenditure to reflect the local governments’ BPS supply for a robustness test. The regression results in column (4) of Table 7 show that the regression coefficient of BPS is 0.083, which is positive and significant at the 1% level, further verifying the robustness of the previous findings.

5.3.7. Excluding Municipalities Directly Under the Central Government

Considering that municipalities directly under the central government have special economic and social management privileges compared with other cities, the setting of the HSR train frequency is not completely exogenous. In regions with economic and political advantages, the HSR train frequency tends to be higher, indicating that the provision of these services is not completely random. This study excluded Beijing, Shanghai, Chongqing, and Tianjin—four municipalities directly under the central government—from the sample to eliminate the influence of differences in the administrative status between cities. This helps to prevent metropolitan advantages from influencing the regression results and avoid the endogeneity caused by reverse causality. The regression results in column (5) of Table 7 show that the regression coefficient of Ln(Hsr + 1) is 0.065, which is positively significant at the 5% level, confirming the robustness of the baseline regression results.

5.3.8. The Winsorization of the Upper and Lower 1% of the Sample Data

To avoid the interference of outlier values from interfering with a wider range of research conclusions, the robustness of the baseline regression results was further validated by winsorizing the upper and lower 1% of the sample data for each variable in this paper. The regression results in column (6) of Table 7 show that the regression coefficient of Ln(Hsr + 1) is 0.055, which is positively significant at the 5% level, verifying the robustness of the baseline regression results.

5.4. Mechanism Analysis

To further explore the intrinsic mechanism through which HSR service affects the supply of BPS and test the mechanism underlying the role of local governments’ TC and FEC, this study refers to the mechanism test method of Chen et al. [82] and focuses on the regression results of the core explanatory variables on the mechanism variables, and the mechanism variables of the explained variables mainly rely on the literature and logic. As a result, the following model was constructed to test the effect of core explanatory variables on mechanism variables:
T a x c o m p e t i t = β 0 + β 1 L n H s r i t + 1 + γ X i t + μ i + φ t + ε i t
E x p e n c o m p e t i t = θ 0 + θ 1 L n H s r i t + 1 + γ X i t + μ i + φ t + ε i t
In these equations, Taxcompetit and Expencompetit are mechanism variables, representing local governments’ TC and FEC. The meanings of the other variables are the same as those of model (3). Based on the verification of the effects of the original core explanatory variables on the mechanism variables, we further elucidated the mechanism underlying the effects of TC and FEC on BPS based on the literature and logic.
The impact of HSR service on the provision of BPS is realized through the alleviation of TC among local governments. HSR service promotes the cross-regional flow of resources, helps eliminate the trend of regional protectionism, reduces market segmentation between cities, and mitigates the disorderly and irregular TC that local governments engage in to encourage the inflow of enterprises and other factors of production. The results of the test on the TC mechanism are shown in column (1) of Table 8, and the Ln(Hsr + 1)’s estimated coefficient for TC is 0.002, which is significant at the 5% level, indicating that the HSR service mitigates TC among local governments. Theoretical research confirms that local governments engaging in TC distort the structure of fiscal expenditures and reduce the supply of BPS. Local governments are inclined to participate in TC as a strategy to attract economic resources to their jurisdictions, subsequently engaging in intercity competition for tax resources. Excessive TC results in market segmentation and overcapacity, diminishing resource allocation efficiency. Moreover, it prompts local governments to channel their revenues into productive expenditures, thereby distorting the provision of BPS [41,83]. HSR service promotes factor mobility and accelerates market integration, promoting the phenomenon of economic agglomeration. The agglomeration rent generated by economic agglomeration promotes an increase in local government tax revenues, weakens the incentives of local governments to engage in TC, and promotes the provision of BPS.
The impact of HSR service on the provision of BPS is realized through the promotion of local governments’ FEC. HSR accelerates the time–space compression, and market integration enhances the human capital mobility and encourages individuals and households to make new locational choices [52]. Fiscal competition among local governments in China has been converted from pure TC to a situation in which TC and expenditure competition coexist. Long-term labor inflow tends to occur in areas with better BPS. To attract labor, local governments will bias their fiscal expenditure structures toward public service expenditures, exacerbating FEC among local governments and ultimately achieving an increase in the supply of BPS [49]. The results of the test on FEC are shown in column (2) of Table 8. The Ln(Hsr + 1)’s estimated coefficient for FEC is 0.008, which is positive and significant at the 1% level, suggesting that HSR service promotes FEC among local governments. The impact of HSR on the logic of FEC among local governments is confirmed. Theoretical studies have confirmed that, based on the “voting with their feet” mechanism, residents move to obtain better BPS, and in order to encourage labor inflow to their jurisdictions, local governments compete in fiscal spending by expanding the share of their general public budget expenditures and ultimately achieve an increase in the level of BPS [49,51,84].

5.5. Heterogeneity Analysis

5.5.1. Heterogeneity Analysis: City Level

The heterogeneity in an urban administrative hierarchy leads to disparities in the delivery of BPS. This study categorizes 282 cities into central cities and peripheral cities for grouped regression analysis. The classification criteria are as follows: central cities include direct-administered municipalities, provincial capital cities, and sub-provincial cities, while the remaining cities are classified as peripheral cities. The results are reported in Table 9. The regression results indicate that HSR service significantly enhances the provision of BPS in peripheral cities, which is positively significant at the 5% level. For every 1% increase in the HSR train frequency in peripheral cities, the provision of BPS increases by 0.035. In contrast, the coefficient for central cities is 0.016, which lacks statistical significance.
The possible reasons for the above results are as follows: Central cities already possess a well-developed transportation infrastructure and exhibit a higher administrative status, population density, and economic agglomeration. Consequently, the BPS in central cities has reached maturity, diminishing the marginal impact of HSR expansion. Peripheral cities leverage HSR service to attract inward migration by strategically expanding the provision of BPS, thereby enhancing the competitiveness of the city.

5.5.2. Heterogeneity Analysis: Location

Given China’s vast territory and significant interregional disparities in economic development, this study categorizes 282 cities into three regions—eastern, central, and western China—for group-wise regression analyses. The results are shown in Table 10. In eastern China, the regression coefficient for Ln(Hsr + 1) is significant at the 10% level, and for every 1% increase in the HSR train frequency, the provision of BPS increases by 0.171. In central China, the coefficient of Ln(Hsr + 1) is 0.002, which lacks statistical significance. In western China, the coefficient of Ln(Hsr + 1) is positively significant at the 1% level, and for every 1% increase in the HSR train frequency, the provision of BPS increases by 0.433.
The possible explanation is that in the eastern region, the relatively modest impact could be attributed to the diminishing marginal utility of infrastructure investments, where the existing comprehensive BPS systems leave limited room for further enhancement through HSR services. Conversely, the western region’s pronounced responsiveness likely stems from infrastructure deficiencies in its public service before HSR operations. The improved transportation accessibility facilitates a crucial resource mobility, particularly enabling efficient rotations of medical experts and the mobility of teaching staff, thereby directly expanding the coverage and amplifying the effectiveness of the BPS delivery. In contrast, the neutralized effect observed in the central region might reflect a dual mechanism where the HSR-induced population outflow to eastern regions reduces the local demand for BPS. This demand-side contraction could offset the supply-side improvements generated by transportation infrastructure upgrades, resulting in statistically insignificant effects.

5.5.3. Heterogeneity Analysis: Fiscal Decentralization

Based on the principal–agent relationship between the central and local governments, local governments have a better understanding of the preferences of residents in their jurisdiction for BPS compared to the central government [41]. Fiscal decentralization leads to an increase in the provision of BPS by local governments [49,85,86]. In contrast to the highly decentralized fiscal arrangements between central and local governments in federal systems, China adopts a tax-sharing system in its fiscal framework. While the fiscal authority remains centralized in central governments, this system grants local governments a degree of fiscal autonomy, including revenue retention and expenditure responsibilities. Differences in the degree of fiscal decentralization may lead to a divergence in the impact of HSR service on the supply of BPS. As described by Eyraud and Lusinyan [87], the degree of fiscal decentralization was measured by the proportion of the per capita fiscal expenditure of the city (pfec) to the sum of the per capita fiscal expenditure of the city (pfec), per capita fiscal expenditure at the provincial level (pfep), and per capita fiscal expenditure at the national level (pfen) (see 9).
F d = p f e c p f e c + p f e p + p f e n
The median of the fiscal decentralization of prefectural-level municipalities in past years was used as a criterion for dividing them into cities with fiscal decentralization higher and lower than the median regression groups. The results of the regression are reported in Table 11. The coefficients of Ln(Hsr + 1) are positive and significant at the 1% level in cities with a high degree of fiscal decentralization. For every 1% increase in the HSR train frequency in cities with a high degree of fiscal decentralization, the provision of BPS increases by 0.09. While the coefficients of Ln(Hsr + 1) are positive and significant at the 10% level in cities with a low degree of fiscal decentralization. For every 1% increase in the HSR train frequency in cities with a low degree of fiscal decentralization, the provision of BPS increases by 0.04. This suggests that cities with a higher degree of fiscal decentralization make more effective use of the factor agglomeration effect brought about by HSR. Cities with a higher degree of fiscal decentralization are more aware of the need to improve the public service capacity and can provide public services more effectively.

5.5.4. Heterogeneity Analysis: Financial Autonomy

An increase in the local government financial autonomy has a positive impact on the provision of BPS. Based on the method used by Liu and Li [88] and Wang and Xu [66], the fiscal self-sufficiency rate at the city level was adopted as an indicator to reflect the efficiency of local governments’ financial autonomy. An increase in the fiscal self-sufficiency rate represents an increase in the efficiency of the local government in utilizing fiscal funds, which in turn has a positive impact on the provision of BPS. The fiscal self-sufficiency rate is measured as the proportion of the general budget revenue to the public budget expenditure. The median fiscal self-sufficiency rate of prefectural-level municipalities in past years was used as a criterion for dividing them into cities with fiscal self-sufficiency rates higher and lower than the regression median.
The regression results are reported in Table 12. The result shows that the coefficients of Ln(Hsr + 1) are positive and significant at the 5% level in cities with a high degree of financial autonomy. For every 1% increase in the HSR train frequency in cities with a high degree of financial autonomy, the provision of BPS increases by 0.055. Coefficients of Ln(Hsr + 1) are insignificant in cities with a low degree of financial autonomy. A possible explanation is that cities with lower fiscal self-sufficiency rates have a lower efficiency of fiscal fund utilization, higher fiscal pressure, and lower autonomy in arranging fiscal expenditures. Therefore, based on the appraisal system of promotion tournaments and GDP competition, local governments tend to use fiscal funds for short-term and quick returns on product investments [21]. Even though HSR promotes market integration and population mobility, local governments under fiscal pressure prefer to direct their revenues toward product investments in order to rapidly promote economic development, resulting in a shortage of BPS.

6. Conclusions and Implications

With the major construction of HSR networks largely completed, the impact of HSR service on the provision of BPS was examined by creating a two-way fixed effects model. The results of this research are summarized below.
An improvement in the HSR service positively impacts the provision of BPS. This conclusion remained valid after a series of endogeneity and robustness tests. HSR helps to enhance the provision of BPS by alleviating local governments’ TC and promoting their FEC. The impact of HSR on the supply of BPS is affected by the location and administrative level of the city and the degree of the local governments’ fiscal decentralization and financial autonomy. The higher the degree of the fiscal decentralization and financial autonomy of cities, the more pronounced the role of the HSR service is in improving BPS. In western regions and peripheral cities, the HSR service has a more pronounced effect on the BPS provision.
The policy implications are as follows: First, an increase in the HSR service helps local governments increase the provision of BPS. It is important for railroad companies to prioritize the optimization of the HSR network operation to benefit public welfare. Additionally, efforts should be made to enhance market connectivity, deepen regional collaboration, and capitalize on the economic agglomeration externality. Governments ought to establish a cross-regional coordinating mechanism to synchronize, collaborate on, and distribute the people’s welfare and facilitate improvements in the standard of living. Based on the heterogeneity analysis, priority should be accorded to optimizing the HSR train frequency service in western regions and peripheral cities to facilitate the equalization of BPS. Second, based on the impact of fiscal competition on BPS, the central government should optimize local governments’ TC and address the distorted structure of the tax enforcement and expenditure caused by local governments’ TC, increasing people’s well-being. Third, based on the impact of HSR on TC, HSR service should be further optimized, and the HSR train frequency between cities should be adjusted to bolster intercity connectivity. It is essential to expedite the process of market integration and harness the advantages of economic agglomeration. Efficient cooperation among local governments is essential to reduce their reliance on tax incentive policies and to minimize the incentives that drive TC. Fourth, based on the impact of HSR on FEC, local governments should utilize HSR to enhance competition in fiscal expenditures, transitioning from a fiscal expenditure structure that prioritizes production over citizen welfare. By enhancing the level of BPS and improving the social governance capacity, local governments can encourage population migration, improve the city’s competitiveness, and promote sustainable social development.
Admittedly, the following shortcomings in this study need to be addressed in the future: (1) Although healthcare, education, and social security are important indicators of BPS closely related to the people’s right to survival, basic housing security was not included in the scope of BPS due to the limited availability of these data. (2) There is a spatial spillover effect on BPS; whether there is a positive spatial spillover effect of HSR on BPS deserves further study. (3) The research sample of this study is China. In the future, it would be worthwhile to use a cross-country perspective to analyze whether there are differences in the impacts of HSR on BPS under different administrative structures, fiscal systems, and infrastructure development stages.

Author Contributions

Conceptualization, J.H. (Jiangye He), J.W. and K.T.; methodology, J.H. (Jiangye He); software, J.W.; validation, J.W.; formal analysis, J.H. (Jiangye He); data curation, J.H. (Junda Huang); writing—original draft, J.H. (Jiangye He); writing—review and editing, J.H. (Jiangye He); supervision, K.T.; C.M. and J.H. (Junda Huang). All authors have read and agreed to the published version of the manuscript.

Funding

This research was funded by the Fundamental Research Funds for the Central Universities, grant number 2024YJS067.

Data Availability Statement

The data presented in this study are available on request from the corresponding author.

Conflicts of Interest

The authors declare no conflicts of interest.

References

  1. Zhang, C.; Zhao, L.; Song, X.; Zhang, Q.; Zhang, X. Spatial-Temporal Coupling Characteristics and Interaction Effects of Economic Resilience and People’s Livelihoods and Well-Being: An Analysis of 78 Cities in the Yellow River Basin. Sustain. Cities Soc. 2024, 112, 105638. [Google Scholar] [CrossRef]
  2. Jackson, E.A.; Jabbie, M. Understanding Market Failure in the Developing Country Context. In Decent Work and Economic Growth; Leal Filho, W., Azul, A.M., Brandli, L., Özuyar, P.G., Wall, T., Eds.; Springer International Publishing: Cham, Switzerland, 2019; pp. 1–10. ISBN 978-3-319-71058-7. [Google Scholar]
  3. Sachs, J.D.; Lafortune, G.; Fuller, G.; Drumm, E. Implementing the SDG Stimulus. Sustainable Development Report 2023; SDSN: Paris, France; Dublin University Press: Dublin, Ireland, 2023. [Google Scholar]
  4. Fu, Y.; Zhang, Y. Chinese Decentralization and Fiscal Expenditure Structural Bias: The Cost of Competing for Growth. J. Manag. World 2007, 3, 4–12+22. [Google Scholar] [CrossRef]
  5. Li, S.; Li, G. Fiscal Decentralization, Government Self-Interest and Fiscal Expenditure Structure Bias. Econ. Anal. Pol. 2024, 81, 1133–1147. [Google Scholar] [CrossRef]
  6. Wang, Y.; Li, J.; Ma, W.; Li, Y.; Xiong, X.; Yu, X. Fiscal Decentralization and Citizens’ Satisfaction with Public Services: Evidence from a Micro Survey in China. Cities 2024, 150, 105095. [Google Scholar] [CrossRef]
  7. Shen, Y.; Cheng, Y.; Yu, J. From Recovery Resilience to Transformative Resilience: How Digital Platforms Reshape Public Service Provision during and Post COVID-19. Public Manag. Rev. 2023, 25, 710–733. [Google Scholar] [CrossRef]
  8. Larsen, A.G.; Følstad, A. The Impact of Chatbots on Public Service Provision: A Qualitative Interview Study with Citizens and Public Service Providers. Gov. Inf. Q. 2024, 41, 101927. [Google Scholar] [CrossRef]
  9. Martin, G.P. The Third Sector, User Involvement and Public Service Reform: A Case Study in the Co-Governance of Health Service Provision. Public Adm. 2011, 89, 909–932. [Google Scholar] [CrossRef]
  10. Schiff, K.J. Does Collective Citizen Input Impact Government Service Provision? Evidence from SeeClickFix Requests. Public Adm. Rev. 2025, 85, 32–45. [Google Scholar] [CrossRef]
  11. Chen, X. Local Autonomy and Service Delivery: How Does Home Rule Shape the Provision of Local Public Services? Public Manag. Rev. 2024, 26, 1–24. [Google Scholar] [CrossRef]
  12. Mudzusi, T.N.; Munzhedzi, P.H.; Mahole, E. Governance Challenges in the Provision of Municipal Services in the Vhembe District Municipality. Afr. Public Serv. Deliv. Perform. Rev. 2024, 12, 10. [Google Scholar] [CrossRef]
  13. Cordella, A.; Tempini, N. E-Government and Organizational Change: Reappraising the Role of ICT and Bureaucracy in Public Service Delivery. Gov. Inf. Q. 2015, 32, 279–286. [Google Scholar] [CrossRef]
  14. Ramolobe, K.; Khandanisa, U. The Role of Public–Private Partnership in Achieving Local Government Sustainable Development. Afr. Public Serv. Deliv. Perform. Rev. 2024, 12, 6. [Google Scholar] [CrossRef]
  15. Yin, L.; Wu, C. Promotion Incentives and Air Pollution: From the Political Promotion Tournament to the Environment Tournament. J. Environ. Manag. 2022, 317, 115491. [Google Scholar] [CrossRef]
  16. Smirnov, A.; Smolokurov, E.; Fir, Y. Features of The Development of High Speed Railway Communications. Transp. Res. Procedia 2022, 61, 139–146. [Google Scholar] [CrossRef]
  17. Wang, F.; Wei, X.; Liu, J.; He, L.; Gao, M. Impact of High-Speed Rail on Population Mobility and Urbanisation: A Case Study on Yangtze River Delta Urban Agglomeration, China. Transp. Res. Part A Policy Pract. 2019, 127, 99–114. [Google Scholar] [CrossRef]
  18. Li, Y.; Chen, Z.; Wang, P. Impact of High-Speed Rail on Urban Economic Efficiency in China. Transp. Policy 2020, 97, 220–231. [Google Scholar] [CrossRef]
  19. Yang, Y.; Zhang, J.; Tong, Y.; Liu, W.; Ma, Z. High-Speed Rail in Shrinking Cities: A Weapon for Downturn or a Catalyst for Change. Cities 2024, 155, 105483. [Google Scholar] [CrossRef]
  20. Pu, L.; Ma, G.; Liu, C. Interregional Infrastructure, Competition for Capital, and Local Public Expenditure Policies: Evidence from China’s High-Speed Rail Network. Pac. Econ. Rev. 2023, 28, 295–313. [Google Scholar] [CrossRef]
  21. Meng, X.; Ding, T.; Wang, H. Incentives for Local Government Expenditures on People’s Livelihood: The Role of High-Speed Rail. Socioecon. Plan. Sci. 2023, 89, 101700. [Google Scholar] [CrossRef]
  22. Chen, Z.; Haynes, K.E. Impact of High-Speed Rail on Regional Economic Disparity in China. J. Transp. Geogr. 2017, 65, 80–91. [Google Scholar] [CrossRef]
  23. Xu, F.; Liu, Q.; Zheng, X.; Cao, L.; Yang, M. Research on the Impact of China’s High-Speed Rail Opening on Enterprise Market Power: Based on the Perspective of Market Segmentation. Transp. Policy 2022, 128, 121–137. [Google Scholar] [CrossRef]
  24. Guirao, B.; Campa, J.L.; Casado-Sanz, N. Labour Mobility between Cities and Metropolitan Integration: The Role of High Speed Rail Commuting in Spain. Cities 2018, 78, 140–154. [Google Scholar] [CrossRef]
  25. Feng, Q.; Chen, Z.; Cheng, C.; Chang, H. Impact of High-Speed Rail on High-Skilled Labor Mobility in China. Transp. Policy 2023, 133, 64–74. [Google Scholar] [CrossRef]
  26. Guirao, B.; Lara-Galera, A.; Campa, J.L. High Speed Rail Commuting Impacts on Labour Migration: The Case of the Concentration of Metropolis in the Madrid Functional Area. Land Use Policy 2017, 66, 131–140. [Google Scholar] [CrossRef]
  27. Li, G.; Pu, K.; Long, M. High-Speed Rail Connectivity, Space-Time Distance Compression, and Trans-Regional Tourism Flows: Evidence from China’s Inbound Tourism. J. Transp. Geogr. 2023, 109, 103592. [Google Scholar] [CrossRef]
  28. Kim, K.S. High-Speed Rail Developments and Spatial Restructuring. Cities 2000, 17, 251–262. [Google Scholar] [CrossRef]
  29. Martin-Barroso, D.; Nunez-Serrano, J.A.; Velazquez, F.J. The Effect of Accessibility on Productivity in Spanish Manufacturing Firms. J. Reg. Sci. 2015, 55, 708–735. [Google Scholar] [CrossRef]
  30. Sasaki, K.; Ohashi, T.; Ando, A. High-Speed Rail Transit Impact on Regional Systems: Does the Shinkansen Contribute to Dispersion? Ann. Reg. Sci. 1997, 31, 77–98. [Google Scholar] [CrossRef]
  31. Ke, X.; Chen, H.; Hong, Y.; Hsiao, C. Do China’s High-Speed-Rail Projects Promote Local Economy?—New Evidence from a Panel Data Approach. China Econ. Rev. 2017, 44, 203–226. [Google Scholar] [CrossRef]
  32. Liu, L.; Huang, R. A High-Speed Rail-Facilitated Evolution of the City-Network Structure in Less-Developed Regions: Evidence from Jiangxi Province, China. Sustainability 2025, 17, 904. [Google Scholar] [CrossRef]
  33. Liu, L.; Zhang, M. High-Speed Rail Impacts on Travel Times, Accessibility, and Economic Productivity: A Benchmarking Analysis in City-Cluster Regions of China. J. Transp. Geogr. 2018, 73, 25–40. [Google Scholar] [CrossRef]
  34. Gunasekera, K.; Anderson, W.; Lakshmanan, T.R. Highway-Induced Development: Evidence from Sri Lanka. World Dev. 2008, 36, 2371–2389. [Google Scholar] [CrossRef]
  35. Tao, P.; Gong, F.; Zhu, K. Tax Competition among Local Governments: Evidence from the Spillovers of Location-Based Tax Incentives in China. China Econ. Rev. 2023, 82, 102077. [Google Scholar] [CrossRef]
  36. Young, A. The Razor’s Edge: Distortions and Incremental Reform in the People’s Republic of China. Q. J. Econ. 2000, 115, 1091–1135. [Google Scholar] [CrossRef]
  37. Poncet, S. A Fragmented China: Measure and Determinants of Chinese Domestic Market Disintegration. Rev. Int. Econ. 2005, 13, 409–430. [Google Scholar] [CrossRef]
  38. Lejour, A.M.; Verbon, H.A. Tax Competition and Redistribution in a Two-Country Endogenous-Growth Model. Int. Tax Public Financ. 1997, 4, 485–497. [Google Scholar] [CrossRef]
  39. Wang, H.; Yang, G.; Ouyang, X.; Tan, Z. Does Environmental Information Disclosure Promote the Supply of Environmental Public Goods? Evidence Based on a Dynamic Spatial Panel Durbin Model. Environ. Impact Assess. Rev. 2022, 93, 106725. [Google Scholar] [CrossRef]
  40. Mintz, J.; Tulkens, H. Commodity Tax Competition between Member States of a Federation: Equilibrium and Efficiency. J. Public Econ. 1986, 29, 133–172. [Google Scholar] [CrossRef]
  41. Oates, W.E. An Essay on Fiscal Federalism. J. Econ. Lit. 1999, 37, 1120–1149. [Google Scholar] [CrossRef]
  42. Keen, M.; Konrad, K.A. The theory of International Tax Competition and Coordination. Handbook of Public Economics. 2013, 5, 257–328. [Google Scholar] [CrossRef]
  43. Zodrow, G.R.; Mieszkowski, P. Pigou, Tiebout, Property Taxation, and the Underprovision of Local Public Goods. J. Urban Econ. 1986, 19, 356–370. [Google Scholar] [CrossRef]
  44. Wilson, J.D. Trade, Capital Mobility, and Tax Competition. J. Political Econ. 1987, 95, 835–856. [Google Scholar] [CrossRef]
  45. Wilson, J.D. Theories of Tax Competition. Nat. Tax J. 1999, 52, 269–304. [Google Scholar] [CrossRef]
  46. Eggert, W.; Sørensen, P.B. The Effects of Tax Competition When Politicians Create Rents to Buy Political Support. J. Public Econ. 2008, 92, 1142–1163. [Google Scholar] [CrossRef]
  47. Faggian, A.; Modrego, F.; McCann, P. Human Capital and Regional Development. In Regional Dynamics and Growth: Advances in Regional Economics; Edward Elgar Publishing: Camberley, UK, 2019. [Google Scholar]
  48. Gu, H.; Wang, J.; Ling, Y. Economic Geography of Talent Migration and Agglomeration in China: A Dual-Driver Framework. China Econ. Rev. 2024, 86, 102180. [Google Scholar] [CrossRef]
  49. Tiebout, C.M. A Pure Theory of Local Expenditures. J. Political Econ. 1956, 64, 416–424. [Google Scholar] [CrossRef]
  50. Baicker, K. The Spillover Effects of State Spending. J. Public Econ. 2005, 89, 529–544. [Google Scholar] [CrossRef]
  51. Wilson, J.D.; Gordon, R.H. Expenditure Competition. J. Public Econ. Theory 2003, 5, 399–417. [Google Scholar] [CrossRef]
  52. Jia, S.; Zhou, C.; Qin, C. No Difference in Effect of High-Speed Rail on Regional Economic Growth Based on Match Effect Perspective? Transp. Res. Part A Policy Pract. 2017, 106, 144–157. [Google Scholar] [CrossRef]
  53. Ji, Y.; Huang, Y.; Yang, M.; Leng, H.; Ren, L.; Liu, H.; Chen, Y. Physics-Informed Deep Learning for Virtual Rail Train Trajectory Following Control. Reliab. Eng. Syst. Saf. 2025, 261, 111092. [Google Scholar] [CrossRef]
  54. Baldwin, R.E.; Krugman, P. Agglomeration, Integration and Tax Harmonisation. Eur. Econ. Rev. 2004, 48, 1–23. [Google Scholar] [CrossRef]
  55. Ludema, R.D.; Wooton, I. Economic Geography and the Fiscal Effects of Regional Integration. J. Int. Econ. 2000, 52, 331–357. [Google Scholar] [CrossRef]
  56. Andersson, F.; Forslid, R. Tax Competition and Economic Geography. J. Public Econ. Theory 2003, 5, 279–303. [Google Scholar] [CrossRef]
  57. Zheng, L.; Chang, Z.; Martinez, A.G. High-Speed Rail, Market Access, and the Rise of Consumer Cities: Evidence from China. Transp. Res. Part A Policy Pract. 2022, 165, 454–470. [Google Scholar] [CrossRef]
  58. Luo, H.; Zhao, S.; Cui, M.; Zhong, S.; Ma, J. The Evolution of Spatial Equity of High-Speed Rail Accessibility in China: An Operation Frequency Based Approach. Int. J. Sustain. Transp. 2023, 17, 1265–1277. [Google Scholar] [CrossRef]
  59. Jofre-Monseny, J. Is Agglomeration Taxable? J. Econ. Geogr. 2011, 13, 177–201. [Google Scholar] [CrossRef]
  60. Brülhart, M.; Jametti, M.; Schmidheiny, K. Do Agglomeration Economies Reduce the Sensitivity of Firm Location to Tax Differentials? Econ. J. 2012, 122, 1069–1093. [Google Scholar] [CrossRef]
  61. Hannes Winner, H.W. Fiscal Competition and the Composition of Public Expenditure: An Empirical Study. Contemp. Econ. 2012, 6, 38. [Google Scholar] [CrossRef]
  62. Brueckner, J.K. Strategic Interaction Among Governments: An Overview of Empirical Studies. Int. Reg. Sci. Rev. 2003, 26, 175–188. [Google Scholar] [CrossRef]
  63. Case, A.C.; Rosen, H.S.; Hines, J.R. Budget Spillovers and Fiscal Policy Interdependence. J. Public Econ. 1993, 52, 285–307. [Google Scholar] [CrossRef]
  64. Jiang, Y. Public Service Equalization, Digital Financial Inclusion and the Rural Revitalization: Evidence from Chinese 283 Prefecture-Level Cities. Int. Rev. Econ. Financ. 2024, 96, 103648. [Google Scholar] [CrossRef]
  65. Yang, Y.; Gong, B. Digital Financial Inclusion and Public Service Equalization. Financ. Res. Lett. 2025, 71, 106440. [Google Scholar] [CrossRef]
  66. Wang, H.; Xu, K. How City Shrinkage Affect Public Service Provision for Disadvantaged Groups? Evidence from China. World Dev. 2025, 186, 106823. [Google Scholar] [CrossRef]
  67. Marlow, M.L. Fiscal Decentralization and Government Size. Public Choice 1988, 56, 259–269. [Google Scholar] [CrossRef]
  68. Ihori, T.; Yang, C.C. Interregional Tax Competition and Intraregional Political Competition: The Optimal Provision of Public Goods under Representative Democracy. J. Urban Econ. 2009, 66, 210–217. [Google Scholar] [CrossRef]
  69. Zhou, K.; Qu, Z.; Wei, Z.; Zhao, J. Does Government Fiscal Pressure Matter for Firm Environmental Performance? The Role of Environmental Regulation and Tax Competition. Econ. Anal. Pol. 2023, 80, 1187–1204. [Google Scholar] [CrossRef]
  70. Du, T.W.; Zhang, Y.S.; Li, T.Y. Fiscal Competition, Soft Budget Constraints and Local Fiscal Sustainability. J. Financ. Econ. 2020, 46, 93–107. [Google Scholar] [CrossRef]
  71. Milligan, K.; Moretti, E.; Oreopoulos, P. Does Education Improve Citizenship? Evidence from the United States and the United Kingdom. J. Public Econ. 2024, 88, 1667–1695. [Google Scholar] [CrossRef]
  72. Herrera, S.; Pang, G. Efficiency of Public Spending In Developing Countries: An Efficiency Frontier Approach; World Bank Publications: Washington, DC, USA, 2005; Volume 1. [Google Scholar]
  73. Zheng, S.; Kahn, M.E. China’s Bullet Trains Facilitate Market Integration and Mitigate the Cost of Megacity Growth. Proc. Natl. Acad. Sci. USA 2013, 110, E1248–E1253. [Google Scholar] [CrossRef]
  74. Hanley, D.; Li, J.; Wu, M. High-Speed Railways and Collaborative Innovation. Reg. Sci. Urban Econ. 2022, 93, 103717. [Google Scholar] [CrossRef]
  75. Luo, X.; Mao, W.; Wang, B.; Liu, C. The Impacts of Aviation and High-Speed Rail on Urban Innovation Capacity in China. Prog. Geogr. 2022, 41, 2203–2217. [Google Scholar] [CrossRef]
  76. Li, C.T.; Yan, X.W.; Song, M.; Yang, W. Fintech and corporate Innovation—Evidence from Chinese NEEQ-ListedCompanies. China Ind. Econ. 2020, 1, 81–98. [Google Scholar] [CrossRef]
  77. Liang, K. The Effect of Population Aging on the Fiscal Burden of Local Governments. In 2023 International Conference on Economic Management, Financial Innovation and Public Service (EMFIPS 2023); Atlantis Press: Dordrecht, The Netherlands, 2024. [Google Scholar]
  78. Panizza, U.; Presbitero, A.F. Public Debt and Economic Growth: Is There a Causal Effect? J. Macroecon. 2014, 41, 21–41. [Google Scholar] [CrossRef]
  79. Beck, T.; Levine, R.; Levkov, A. Big Bad Banks? The Winners and Losers from Bank Deregulation in the United States. J. Financ. 2010, 65, 1637–1667. [Google Scholar] [CrossRef]
  80. Tang, Z.; Wang, L.; Wu, W. The Impact of High-Speed Rail on Urban Carbon Emissions: Evidence from the Yangtze River Delta. J. Transp. Geogr. 2023, 110, 103641. [Google Scholar] [CrossRef]
  81. Wong, Z.; Chen, A.; Shen, C.; Wu, D. Fiscal Policy and the Development of Green Transportation Infrastructure: The Case of China’s High-Speed Railways. Econ. Change Restruct. 2022, 55, 2179–2213. [Google Scholar] [CrossRef]
  82. Chen, Y.; Fan, Z.; Gu, X.; Zhou, L.-A. Arrival of Young Talent: The Send-Down Movement and Rural Education in China. Am. Econ. Rev. 2020, 110, 3393–3430. [Google Scholar] [CrossRef]
  83. Keen, M.; Marchand, M. Fiscal Competition and the Pattern of Public Spending. J. Public Econ. 1997, 66, 33–53. [Google Scholar] [CrossRef]
  84. Bucovetsky, S. Public Input Competition. J. Public Econ. 2005, 89, 1763–1787. [Google Scholar] [CrossRef]
  85. Qian, Y.; Roland, G. Federalism and the Soft Budget Constraint. Am. Econ. Rev. 1998, 1143–1162. [Google Scholar] [CrossRef]
  86. Zhang, H.; Lu, S.; Chen, S. Does Centralization of Tax Administration Regulate Tax Competition? Evidence from a Quasi-Natural Experiment in China. Econ. Anal. Pol. 2024, 84, 1084–1098. [Google Scholar] [CrossRef]
  87. Eyraud, L.; Lusinyan, L. Vertical Fiscal Imbalances and Fiscal Performance in Advanced Economies. J. Monet. Econ. 2013, 60, 571–587. [Google Scholar] [CrossRef]
  88. Liu, C.; Li, L. Place-Based Techno-Industrial Policy and Innovation: Government Responses to the Information Revolution in China. China Econ. Rev. 2021, 66, 101600. [Google Scholar] [CrossRef]
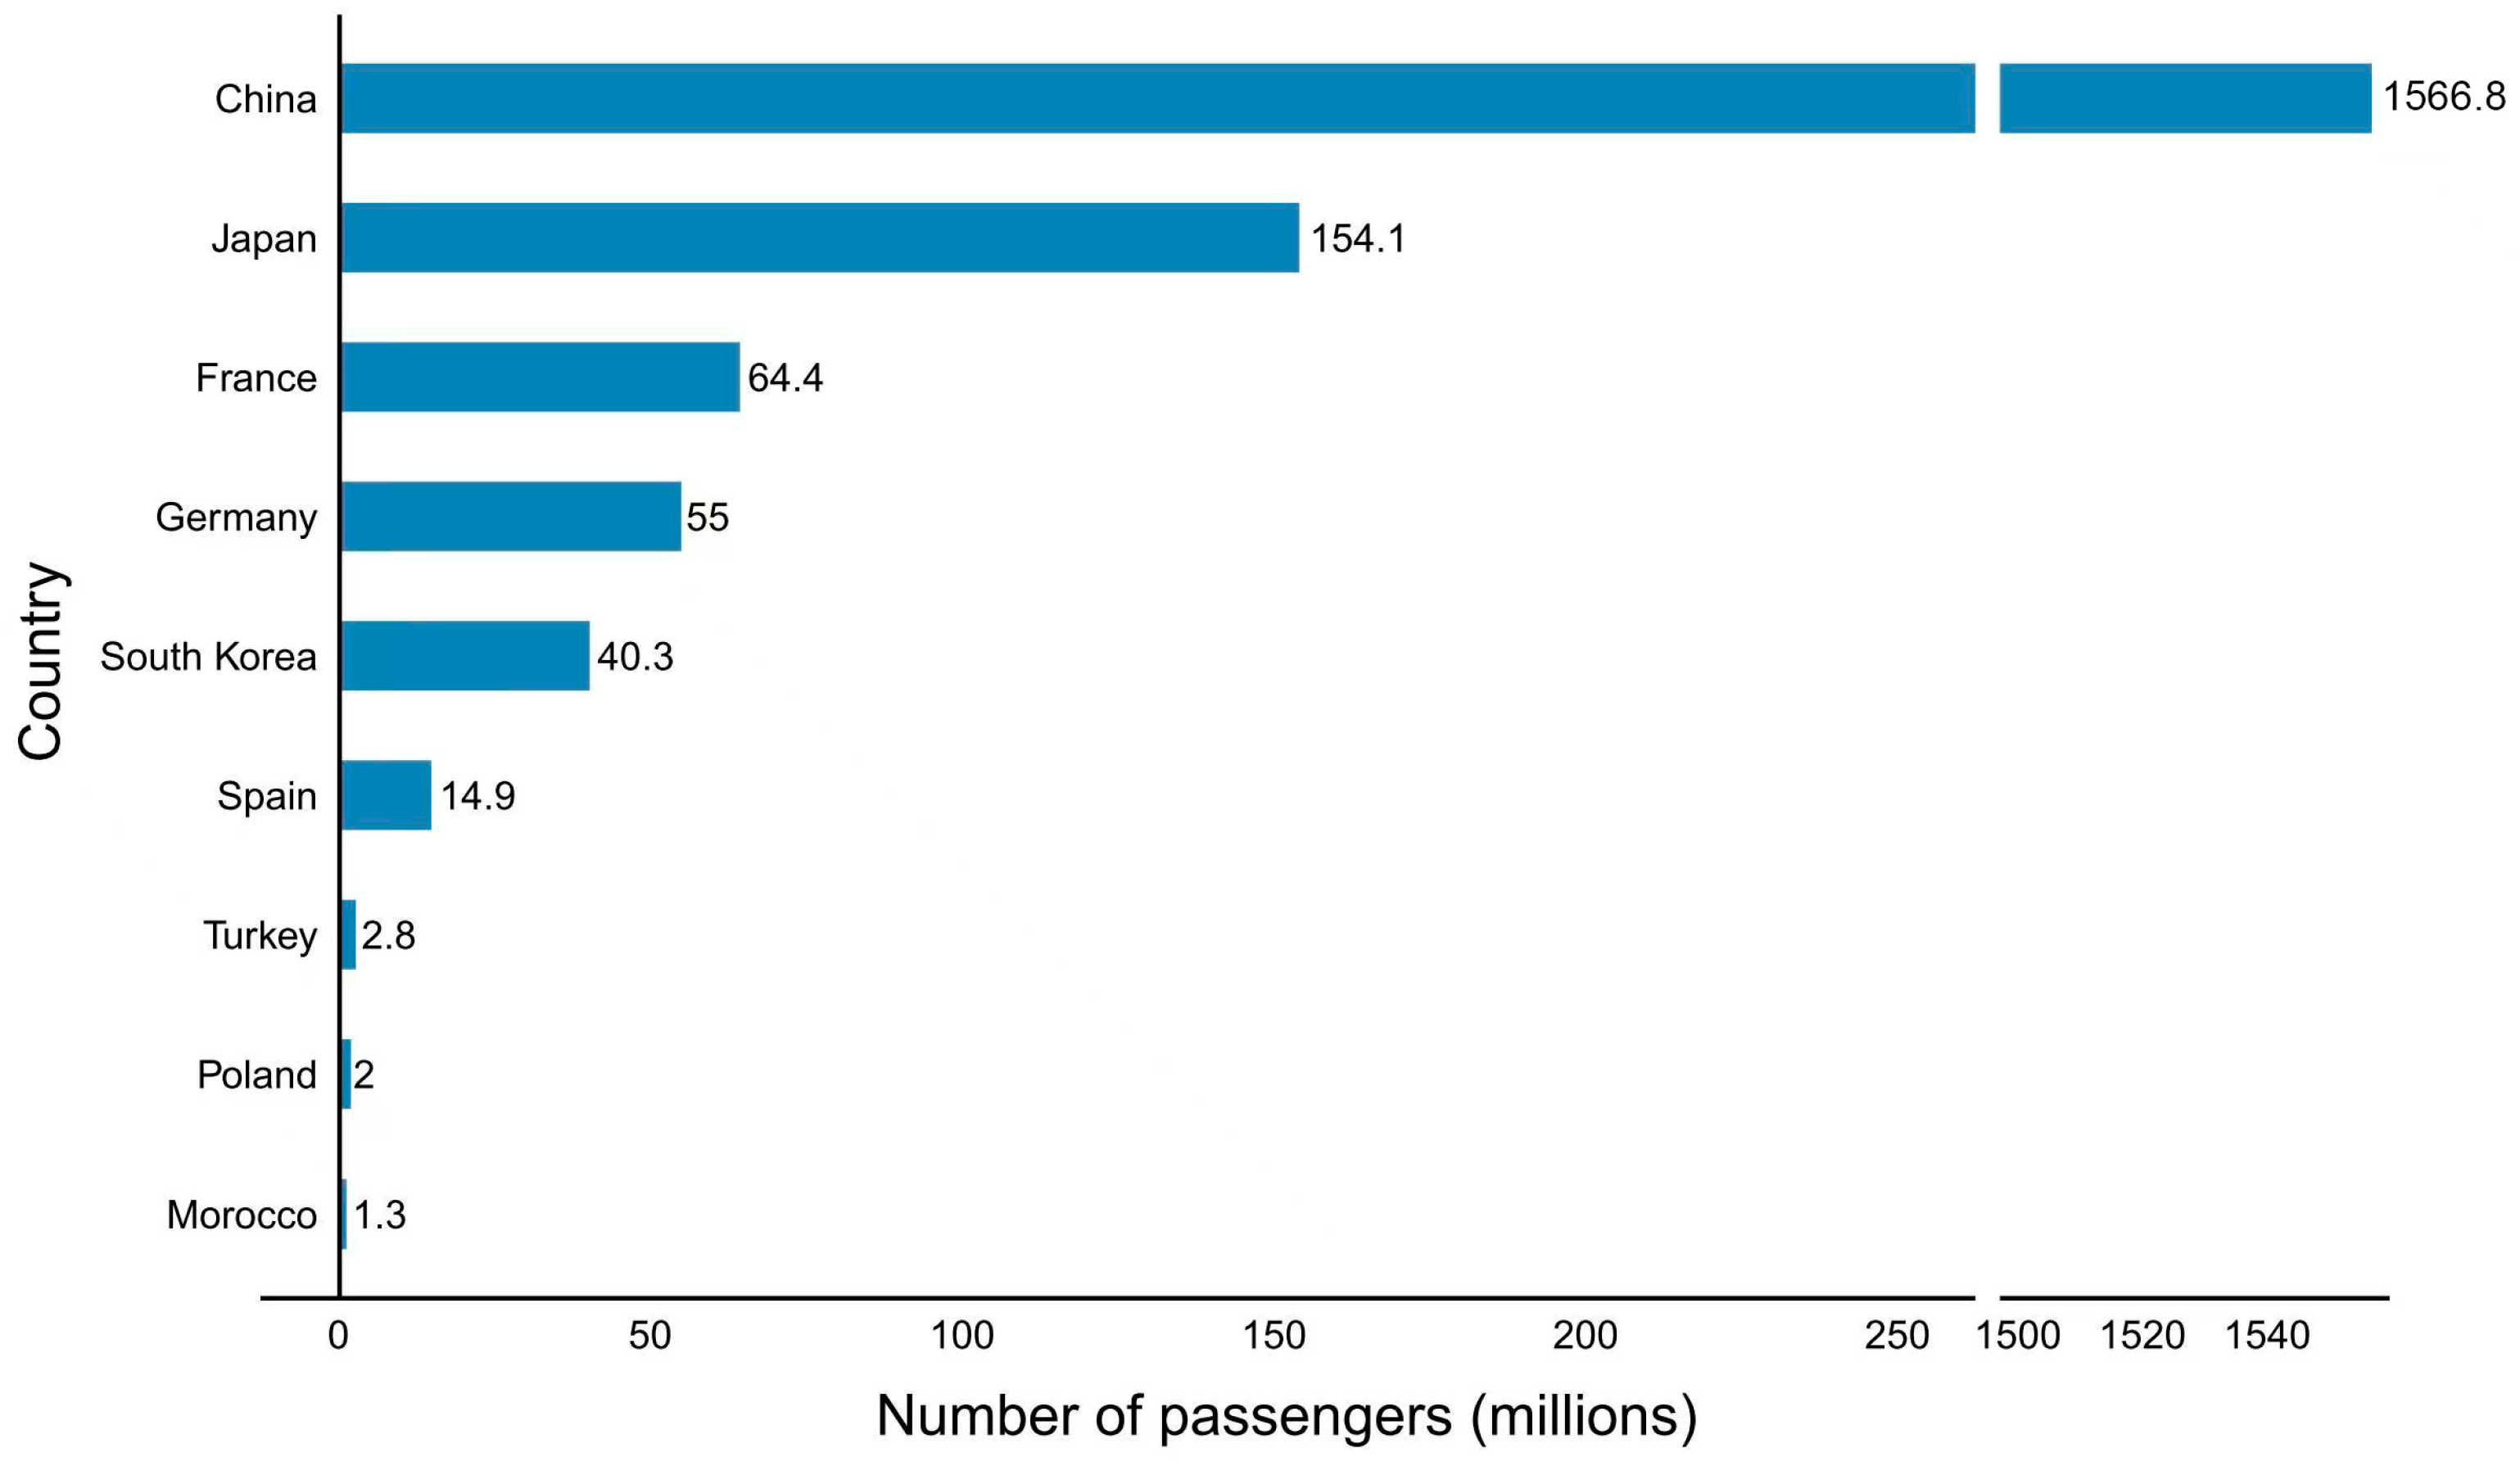
Figure 1. Number of HSR passengers (millions) in 2020.
Systems 13 00380 g001
Figure 2. The proportion of BPS expenditures in China’s general public budget expenditure. (A) The percentage of BPS expenditures from 2008 to 2020. (B) The percentage of education, social security and healthcare expenditures from 2008 to 2020.
Systems 13 00380 g002
Figure 3. Conceptual framework.
Systems 13 00380 g003
Figure 4. BPS and HSR service in 2011, 2015, and 2020. (A) BPS in 2011, 2015 and 2020. (B) HSR service in 2011, 2015, and 2020.
Systems 13 00380 g004
Figure 5. Parallel trend test results.
Systems 13 00380 g005
Figure 6. The distribution of the coefficients.
Systems 13 00380 g006
Figure 7. The distribution of random t-values.
Systems 13 00380 g007
Table 1. Indicator system for BPS.
First-Level IndicatorsSecond-Level IndicatorsCalculation Method
healthcarePer capita budgetary expenditure on healthcareGeneral public budget expenditure on healthcare/resident population
Number of beds in healthcare institutionsNumber of beds in healthcare institutions per 10,000 population
Number of medical and health staffNumber of health staff per 10,000 population
educationPer capita budgetary expenditure on educationGeneral public budget expenditure on education/resident population
Pupil–teacher ratio in secondary schoolsPupil–teacher ratio in general secondary schools
Pupil–teacher ratio in primary schoolsPupil–teacher ratio in general primary schools
social securityPer capita budgetary expenditure on social securityGeneral public budget expenditure on social security and employment/resident population
Basic pension insurance participation rateNumber of participants in basic old-age insurance/resident population
Basic medical insurance participation rateNumber of basic medical insurance participants/resident population
Basic unemployment insurance participation rateNumber of participants in basic unemployment insurance/resident population
Table 2. KMO test and Bartlett Test of Sphericity.
KMO Value0.729
Bartlett Test of SphericityApproximate Chi-Square16,199.727
df45
p value0
Table 3. Descriptive statistics.
VariableObsMeanStd. Dev.MinMax
BPS366614.7957.5433.00294.882
Ln(Hsr + 1)36663.4664.8730.00013.753
urban36660.5270.1580.1301.000
industrct366640.2039.65111.80083.870
edup36669.0520.8304.07012.210
fd36660.4030.0710.1490.852
lndens36665.7290.9260.6837.882
scale36660.1960.1090.0431.485
Taxcompet36660.3060.1400.0201.143
Expencompet36660.6020.3680.1354.061
Table 4. Baseline regression results.
BPS
(1)(2)(3)(4)(5)(6)(7)
Ln(Hsr + 1)0.073 ***0.073 ***0.073 ***0.075 ***0.078 ***0.074 ***0.070 ***
(4.138)(4.133)(4.114)(4.256)(4.410)(4.195)(2.619)
urban 1.7861.8160.8950.5510.365−0.288
(1.422)(1.445)(0.708)(0.435)(0.288)(−0.121)
instruct 0.0170.0190.0290.0240.041*
(1.084)(1.207)(1.546)(1.488)(1.934)
edup 2.419 ***2.500 ***2.537 ***2.246 *
(5.112)(5.284)(5.359)(1.870)
fd 5.937 ***5.658 ***12.458 ***
(3.176)(3.019)(3.618)
lndens 0.799 *0.674
(1.917)(0.870)
scale −7.404 ***
(−3.405)
Constant14.542 ***13.601 ***12.887 ***−8.603 **−11.790 ***−16.437 ***−14.694
(184.685)(20.407)(13.752)(−1.999)(−2.669)(−3.263)(−1.346)
Individual fixed effectYESYESYESYESYESYESYES
Year fixed effectsYESYESYESYESYESYESYES
Observations3666366636663666366636663666
R20.8430.8430.8430.8440.8440.8440.846
Notes: standard errors are clustered at the city level, and t-values are in parentheses. * p < 0.1, ** p < 0.05, *** p < 0.01.
Table 5. Endogeneity test.
First StageSecond Stage
Ln(Hsr + 1)BPSBPS
(1)(2)(3)
Ln(Hsr + 1)-iv−0.013 ***
(−5.419)
Ln(Hsr + 1) 0.606 ***0.058 **
(3.499)(2.450)
Constant352.461 ***2.791−17.918
(5.377)(0.384)(−1.164)
Control variableYESYESYES
Individual fixed effectYESYESYES
Year fixed effectsYESYESYES
Observations366636663380
R20.6510.8030.879
Kleibergen–Paap rk Wald F29.360
Kleibergen–Paap rk LM29.380 ***
Notes: standard errors are clustered at the city level, and t-values are in parentheses. * p < 0.1, ** p < 0.05, *** p < 0.01.
Table 6. Addition of potentially omitted control variables.
BPS
Ln(Hsr + 1)0.061 ***
(3.508)
urban0.127
(0.101)
industrct0.036 **
(2.189)
edup4.789 ***
(7.758)
fd11.956 ***
(5.226)
lndens0.634
(1.553)
scale−5.698 ***
(−3.702)
debatscale0.078 ***
(3.158)
populationaging−0.004
(−0.056)
Year/Individual fixed effectYES
Constant−37.673 ***
(−5.989)
Observations3666
R20.853
Notes: standard errors are clustered at the city level, and t-values are in parentheses. * p < 0.1, ** p < 0.05, *** p < 0.01.
Table 7. Results of other robustness tests.
BPS
(1)(2)(3)(4)(5)(6)
HSR-DID0.460 ***
(2.633)
Ln(Hsr + 1) 0.083 ***0.065 **0.055 **
(2.817)(2.404) (2.354)
DC 10.922 ***
(5.537)
num 0.253 ***
(3.670)
Constant−11.467 ***−9.075−18.79757.724 ***−11.576−22.076
(−2.585)(−0.965)(−1.442)(5.206)(−1.111)(−1.624)
Control variablesYESYESYESYESYESYES
Year fixed effectYESYESYESYESYESYES
Individual fixed effectYESYESYESYESYESYES
Observations366636663666366636143666
R20.8440.8510.8460.7320.8360.881
Notes: standard errors are clustered at the city level, and t-values are in parentheses. * p < 0.1, ** p < 0.05, *** p < 0.01.
Table 8. Mechanism test of HSR on BPS.
TaxcompetExpencompet
(1)(2)
Ln(Hsr + 1)0.002 **0.008 ***
(2.312)(5.688)
Control variablesYESYES
Constant0.1061.780 ***
(0.343)(3.251)
Individual fixed effectYESYES
Year fixed effectsYESYES
Observations36663666
R20.2060.575
Notes: standard errors are clustered at the city level, and t-values are in parentheses. * p < 0.1, ** p < 0.05, *** p < 0.01.
Table 9. Heterogeneity at city level.
City Level
Central CityPeripheral City
Ln(Hsr + 1)0.0160.035 **
(0.224)(1.996)
Control variablesYESYES
Individual/Year fixed effectYESYES
Observations4293237
R20.8070.822
Notes: standard errors are clustered at the city level, and t-values are in parentheses. * p < 0.1, ** p < 0.05, *** p < 0.01.
Table 10. Heterogeneity in location.
BPS
(1)(2)(3)
Ln(Hsr + 1)0.171 *0.0020.433 ***
(1.696)(0.056)(3.653)
Control VariablesYESYESYES
Individual/Year fixed effectsYESYESYES
Observation126113001105
R20.8430.8780.748
Notes: standard errors are clustered at the city level, and t-values are in parentheses. * p < 0.1, ** p < 0.05, *** p < 0.01.
Table 11. Heterogeneity in fiscal decentralization.
Fiscal Decentralization
High Degree of Fiscal DecentralizationLow Degree of Fiscal Decentralization
Ln(Hsr + 1)0.090 ***0.040 *
(3.296)(1.747)
Control variablesYESYES
Individual/Year fixed effectYESYES
Observations18331833
R20.8520.776
Notes: standard errors are clustered at the city level, and t-values are in parentheses. * p < 0.1, ** p < 0.05, *** p < 0.01.
Table 12. Heterogeneity in financial autonomy.
Financial Autonomy
High Degree of Financial AutonomyLow Degree of Financial Autonomy
Ln(Hsr + 1)0.055 **0.005
(2.136)(0.179)
Control variablesYESYES
Individual/Year fixed effectYESYES
Observations18331833
R20.8670.666
Notes: standard errors are clustered at the city level, and t-values are in parentheses. * p < 0.1, ** p < 0.05, *** p < 0.01.
Disclaimer/Publisher’s Note: The statements, opinions and data contained in all publications are solely those of the individual author(s) and contributor(s) and not of MDPI and/or the editor(s). MDPI and/or the editor(s) disclaim responsibility for any injury to people or property resulting from any ideas, methods, instructions or products referred to in the content.